|
||||||||||||||||||||
| |
| Phenotypic Information (metabolism pathway, cancer, disease, phenome) |
| |
| |
| Gene-Gene Network Information: Co-Expression Network, Interacting Genes & KEGG |
| |
|


| Gene Summary for CA3 |
| Top |
| Phenotypic Information for CA3(metabolism pathway, cancer, disease, phenome) |
| Cancer | CGAP: CA3 |
| Familial Cancer Database: CA3 | |
| * This gene is included in those cancer gene databases. |
|
|
|
|
|
|
| ||||||||||||||
Oncogene 1 | Significant driver gene in | |||||||||||||||||||
| cf) number; DB name 1 Oncogene; http://nar.oxfordjournals.org/content/35/suppl_1/D721.long, 2 Tumor Suppressor gene; https://bioinfo.uth.edu/TSGene/, 3 Cancer Gene Census; http://www.nature.com/nrc/journal/v4/n3/abs/nrc1299.html, 4 CancerGenes; http://nar.oxfordjournals.org/content/35/suppl_1/D721.long, 5 Network of Cancer Gene; http://ncg.kcl.ac.uk/index.php, 1Therapeutic Vulnerabilities in Cancer; http://cbio.mskcc.org/cancergenomics/statius/ |
| KEGG_NITROGEN_METABOLISM | |
| OMIM | |
| Orphanet | |
| Disease | KEGG Disease: CA3 |
| MedGen: CA3 (Human Medical Genetics with Condition) | |
| ClinVar: CA3 | |
| Phenotype | MGI: CA3 (International Mouse Phenotyping Consortium) |
| PhenomicDB: CA3 | |
| Mutations for CA3 |
| * Under tables are showing count per each tissue to give us broad intuition about tissue specific mutation patterns.You can go to the detailed page for each mutation database's web site. |
| There's no structural variation information in COSMIC data for this gene. |
| * From mRNA Sanger sequences, Chitars2.0 arranged chimeric transcripts. This table shows CA3 related fusion information. |
| ID | Head Gene | Tail Gene | Accession | Gene_a | qStart_a | qEnd_a | Chromosome_a | tStart_a | tEnd_a | Gene_a | qStart_a | qEnd_a | Chromosome_a | tStart_a | tEnd_a |
| Top |
| There's no copy number variation information in COSMIC data for this gene. |
| Top |
|
 |
| Top |
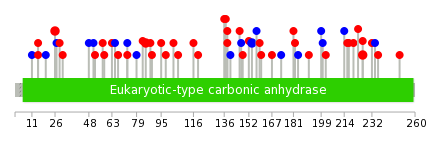
| Stat. for Non-Synonymous SNVs (# total SNVs=34) | (# total SNVs=11) |
 |  |
(# total SNVs=0) | (# total SNVs=0) |
| Top |
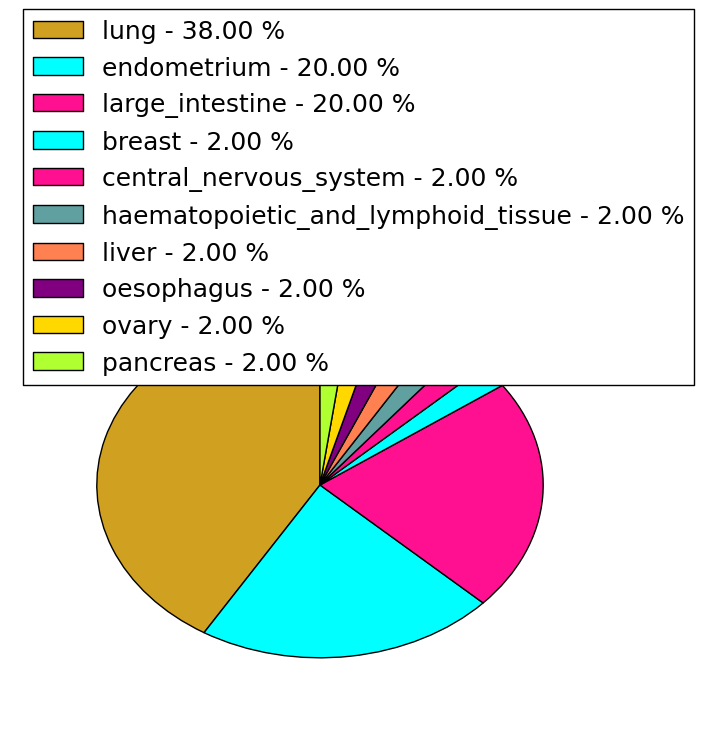
| * When you move the cursor on each content, you can see more deailed mutation information on the Tooltip. Those are primary_site,primary_histology,mutation(aa),pubmedID. |
| GRCh37 position | Mutation(aa) | Unique sampleID count |
| chr8:86360276-86360276 | p.R226Q | 3 |
| chr8:86351982-86351982 | p.E26K | 2 |
| chr8:86357402-86357402 | p.G154G | 2 |
| chr8:86354322-86354322 | p.P85S | 2 |
| chr8:86356323-86356323 | p.D138N | 2 |
| chr8:86356352-86356352 | p.L147L | 1 |
| chr8:86358415-86358415 | p.F184F | 1 |
| chr8:86352106-86352106 | p.R67Q | 1 |
| chr8:86360293-86360293 | p.A232T | 1 |
| chr8:86354377-86354377 | p.H103R | 1 |
| Top |
|
 |
| Point Mutation/ Tissue ID | 1 | 2 | 3 | 4 | 5 | 6 | 7 | 8 | 9 | 10 | 11 | 12 | 13 | 14 | 15 | 16 | 17 | 18 | 19 | 20 |
| # sample | 1 | 5 | 3 | 11 | 4 | 2 | 1 | 8 | 8 | 9 | ||||||||||
| # mutation | 1 | 5 | 3 | 11 | 4 | 2 | 1 | 8 | 8 | 9 | ||||||||||
| nonsynonymous SNV | 1 | 4 | 3 | 8 | 3 | 1 | 1 | 5 | 5 | 6 | ||||||||||
| synonymous SNV | 1 | 3 | 1 | 1 | 3 | 3 | 3 |
| cf) Tissue ID; Tissue type (1; BLCA[Bladder Urothelial Carcinoma], 2; BRCA[Breast invasive carcinoma], 3; CESC[Cervical squamous cell carcinoma and endocervical adenocarcinoma], 4; COAD[Colon adenocarcinoma], 5; GBM[Glioblastoma multiforme], 6; Glioma Low Grade, 7; HNSC[Head and Neck squamous cell carcinoma], 8; KICH[Kidney Chromophobe], 9; KIRC[Kidney renal clear cell carcinoma], 10; KIRP[Kidney renal papillary cell carcinoma], 11; LAML[Acute Myeloid Leukemia], 12; LUAD[Lung adenocarcinoma], 13; LUSC[Lung squamous cell carcinoma], 14; OV[Ovarian serous cystadenocarcinoma ], 15; PAAD[Pancreatic adenocarcinoma], 16; PRAD[Prostate adenocarcinoma], 17; SKCM[Skin Cutaneous Melanoma], 18:STAD[Stomach adenocarcinoma], 19:THCA[Thyroid carcinoma], 20:UCEC[Uterine Corpus Endometrial Carcinoma]) |
| Top |
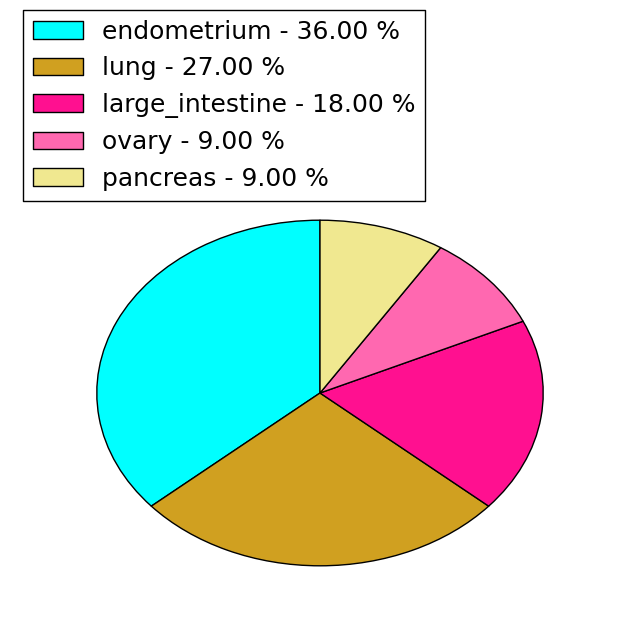
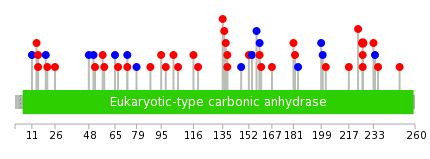
| * We represented just top 10 SNVs. When you move the cursor on each content, you can see more deailed mutation information on the Tooltip. Those are primary_site, primary_histology, mutation(aa), pubmedID. |
| Genomic Position | Mutation(aa) | Unique sampleID count |
| chr8:86360276 | p.R226L | 3 |
| chr8:86356323 | p.D138Y | 2 |
| chr8:86351966 | p.C182G | 1 |
| chr8:86358404 | p.P21S | 1 |
| chr8:86360301 | p.E106Q | 1 |
| chr8:86352125 | p.F184F | 1 |
| chr8:86356320 | p.E26K | 1 |
| chr8:86351967 | p.A116V | 1 |
| chr8:86358407 | p.T199T | 1 |
| chr8:86360305 | p.S48S | 1 |
| * Copy number data were extracted from TCGA using R package TCGA-Assembler. The URLs of all public data files on TCGA DCC data server were gathered on Jan-05-2015. Function ProcessCNAData in TCGA-Assembler package was used to obtain gene-level copy number value which is calculated as the average copy number of the genomic region of a gene. |
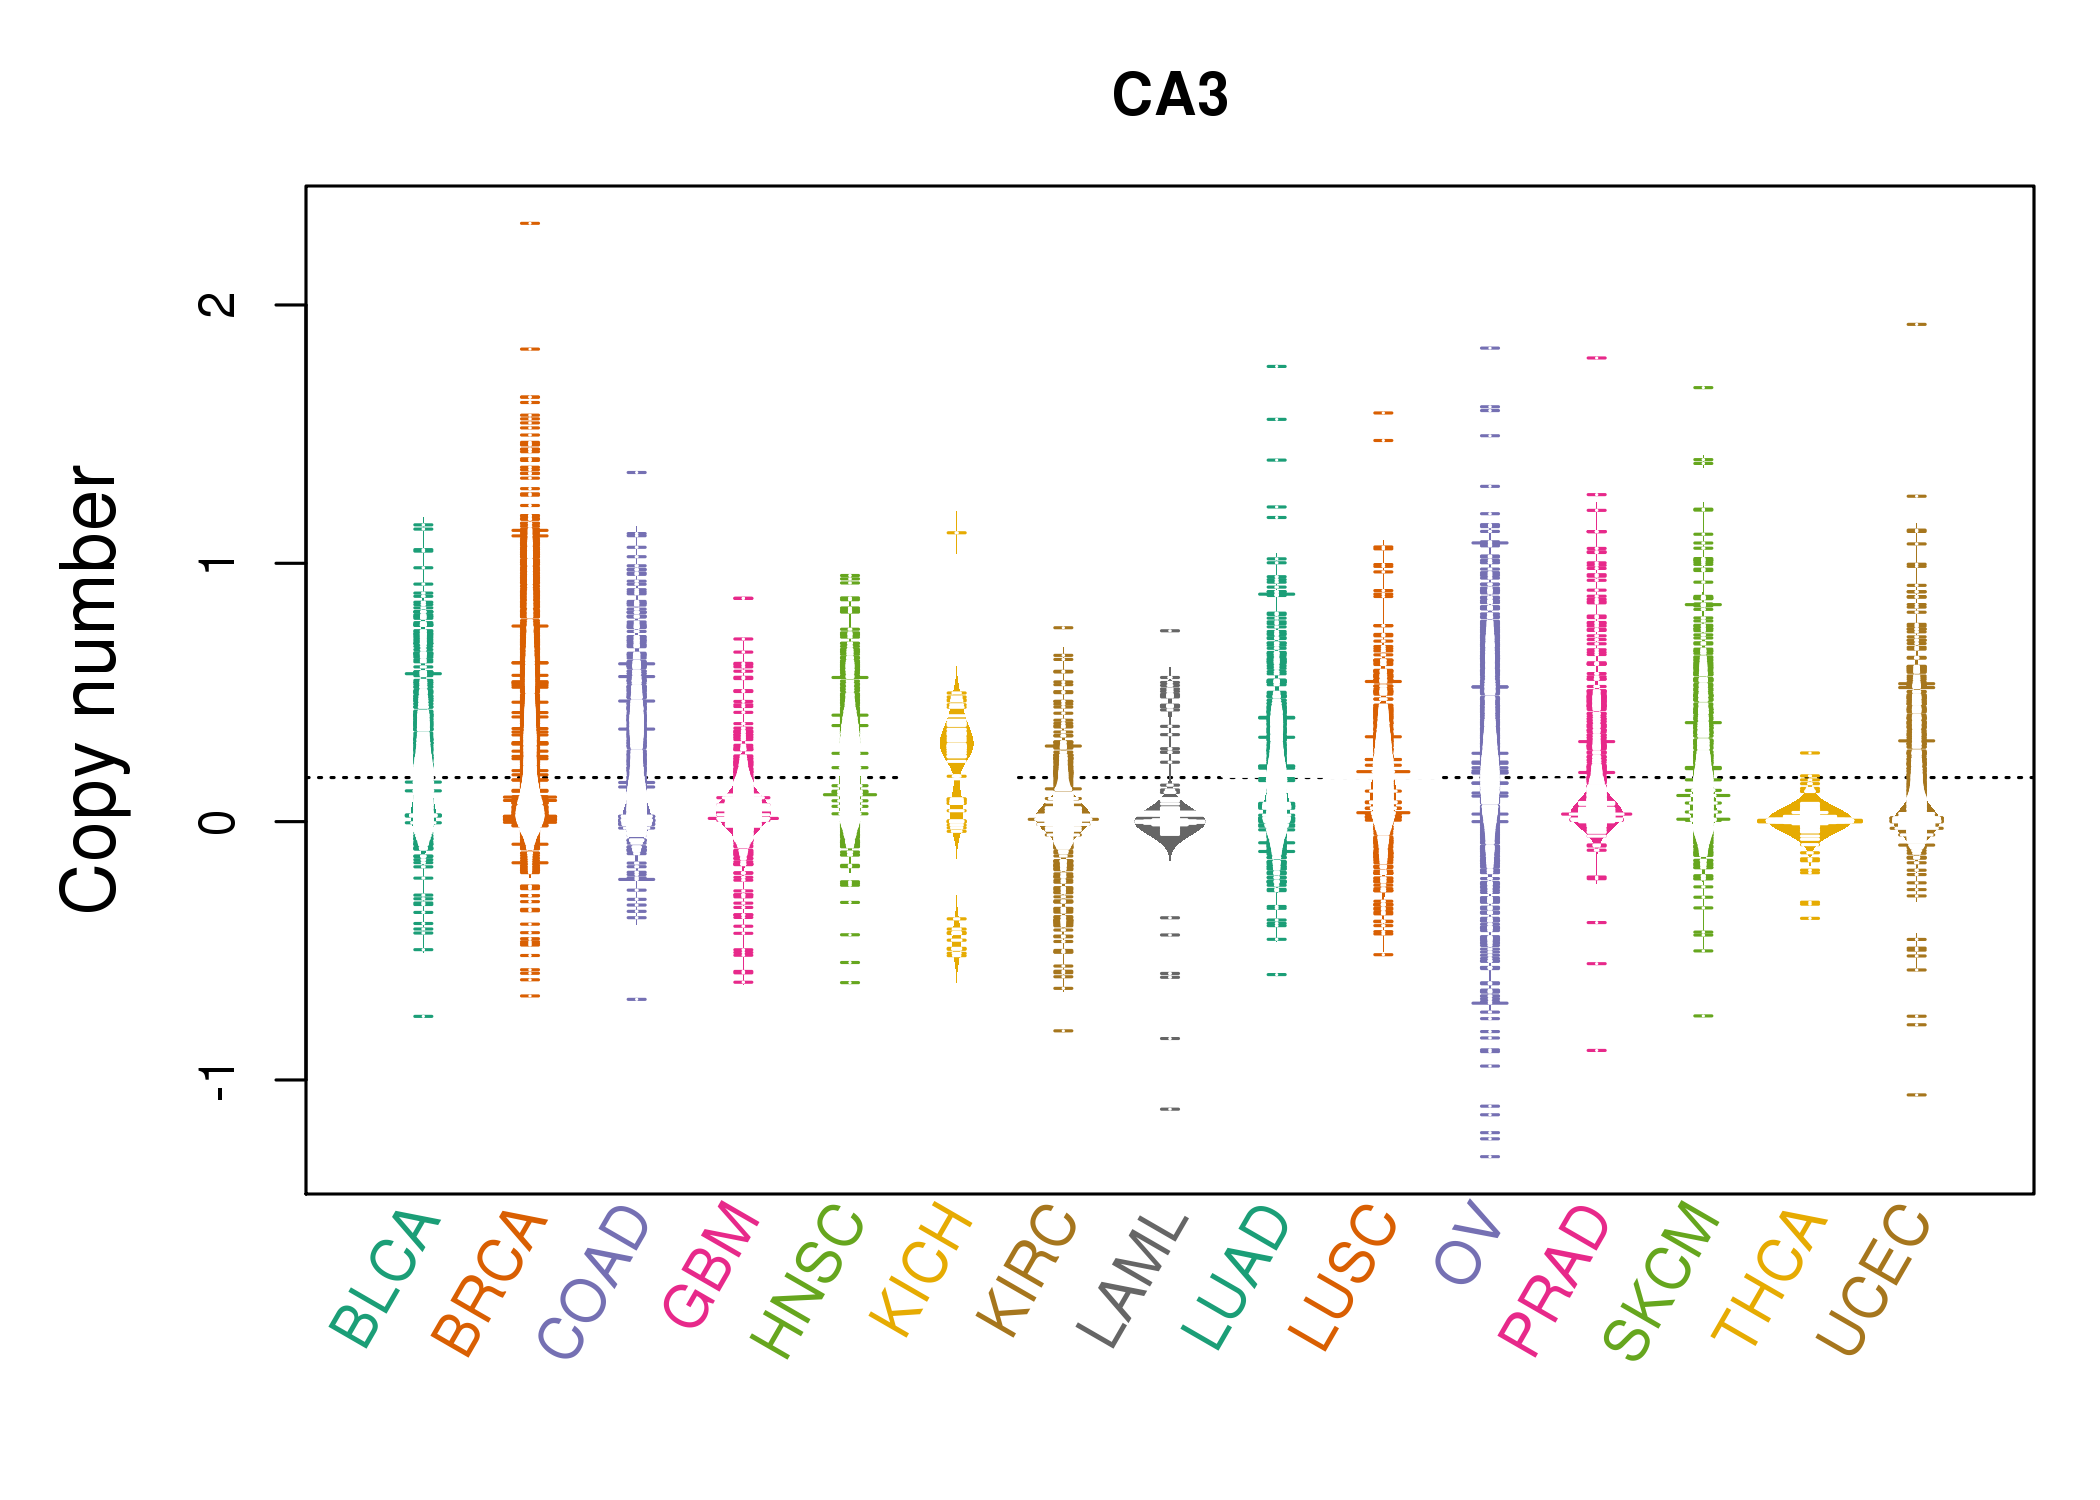 |
| cf) Tissue ID[Tissue type]: BLCA[Bladder Urothelial Carcinoma], BRCA[Breast invasive carcinoma], CESC[Cervical squamous cell carcinoma and endocervical adenocarcinoma], COAD[Colon adenocarcinoma], GBM[Glioblastoma multiforme], Glioma Low Grade, HNSC[Head and Neck squamous cell carcinoma], KICH[Kidney Chromophobe], KIRC[Kidney renal clear cell carcinoma], KIRP[Kidney renal papillary cell carcinoma], LAML[Acute Myeloid Leukemia], LUAD[Lung adenocarcinoma], LUSC[Lung squamous cell carcinoma], OV[Ovarian serous cystadenocarcinoma ], PAAD[Pancreatic adenocarcinoma], PRAD[Prostate adenocarcinoma], SKCM[Skin Cutaneous Melanoma], STAD[Stomach adenocarcinoma], THCA[Thyroid carcinoma], UCEC[Uterine Corpus Endometrial Carcinoma] |
| Top |
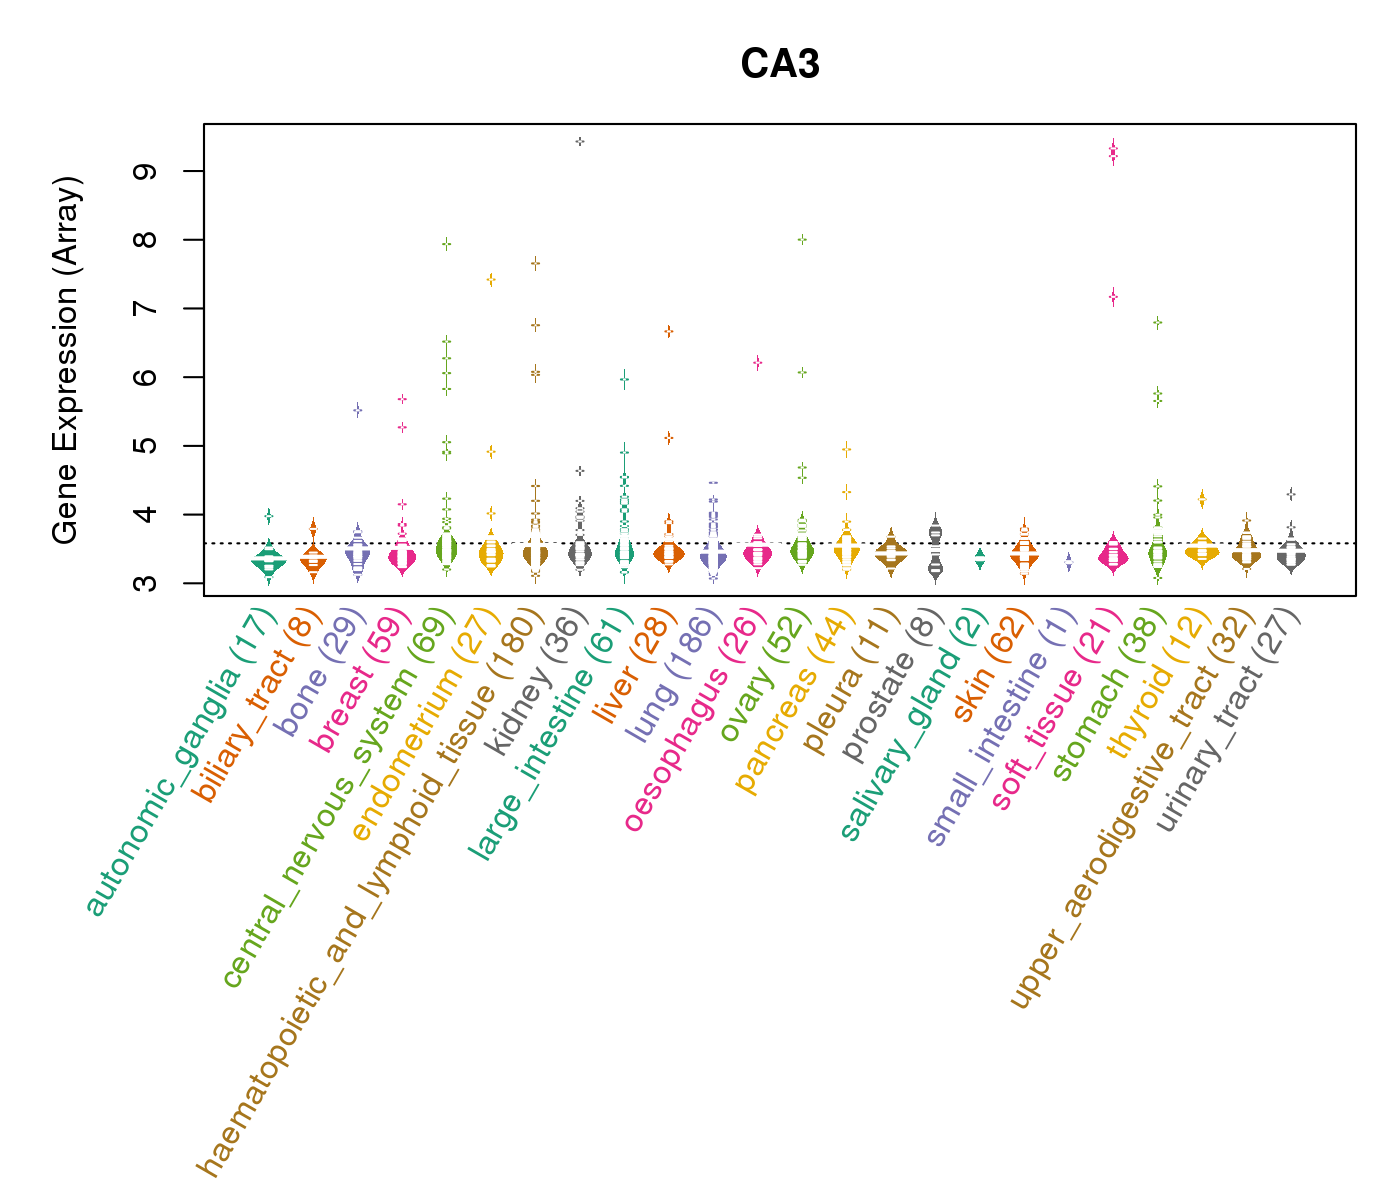
| Gene Expression for CA3 |
| * CCLE gene expression data were extracted from CCLE_Expression_Entrez_2012-10-18.res: Gene-centric RMA-normalized mRNA expression data. |
 |
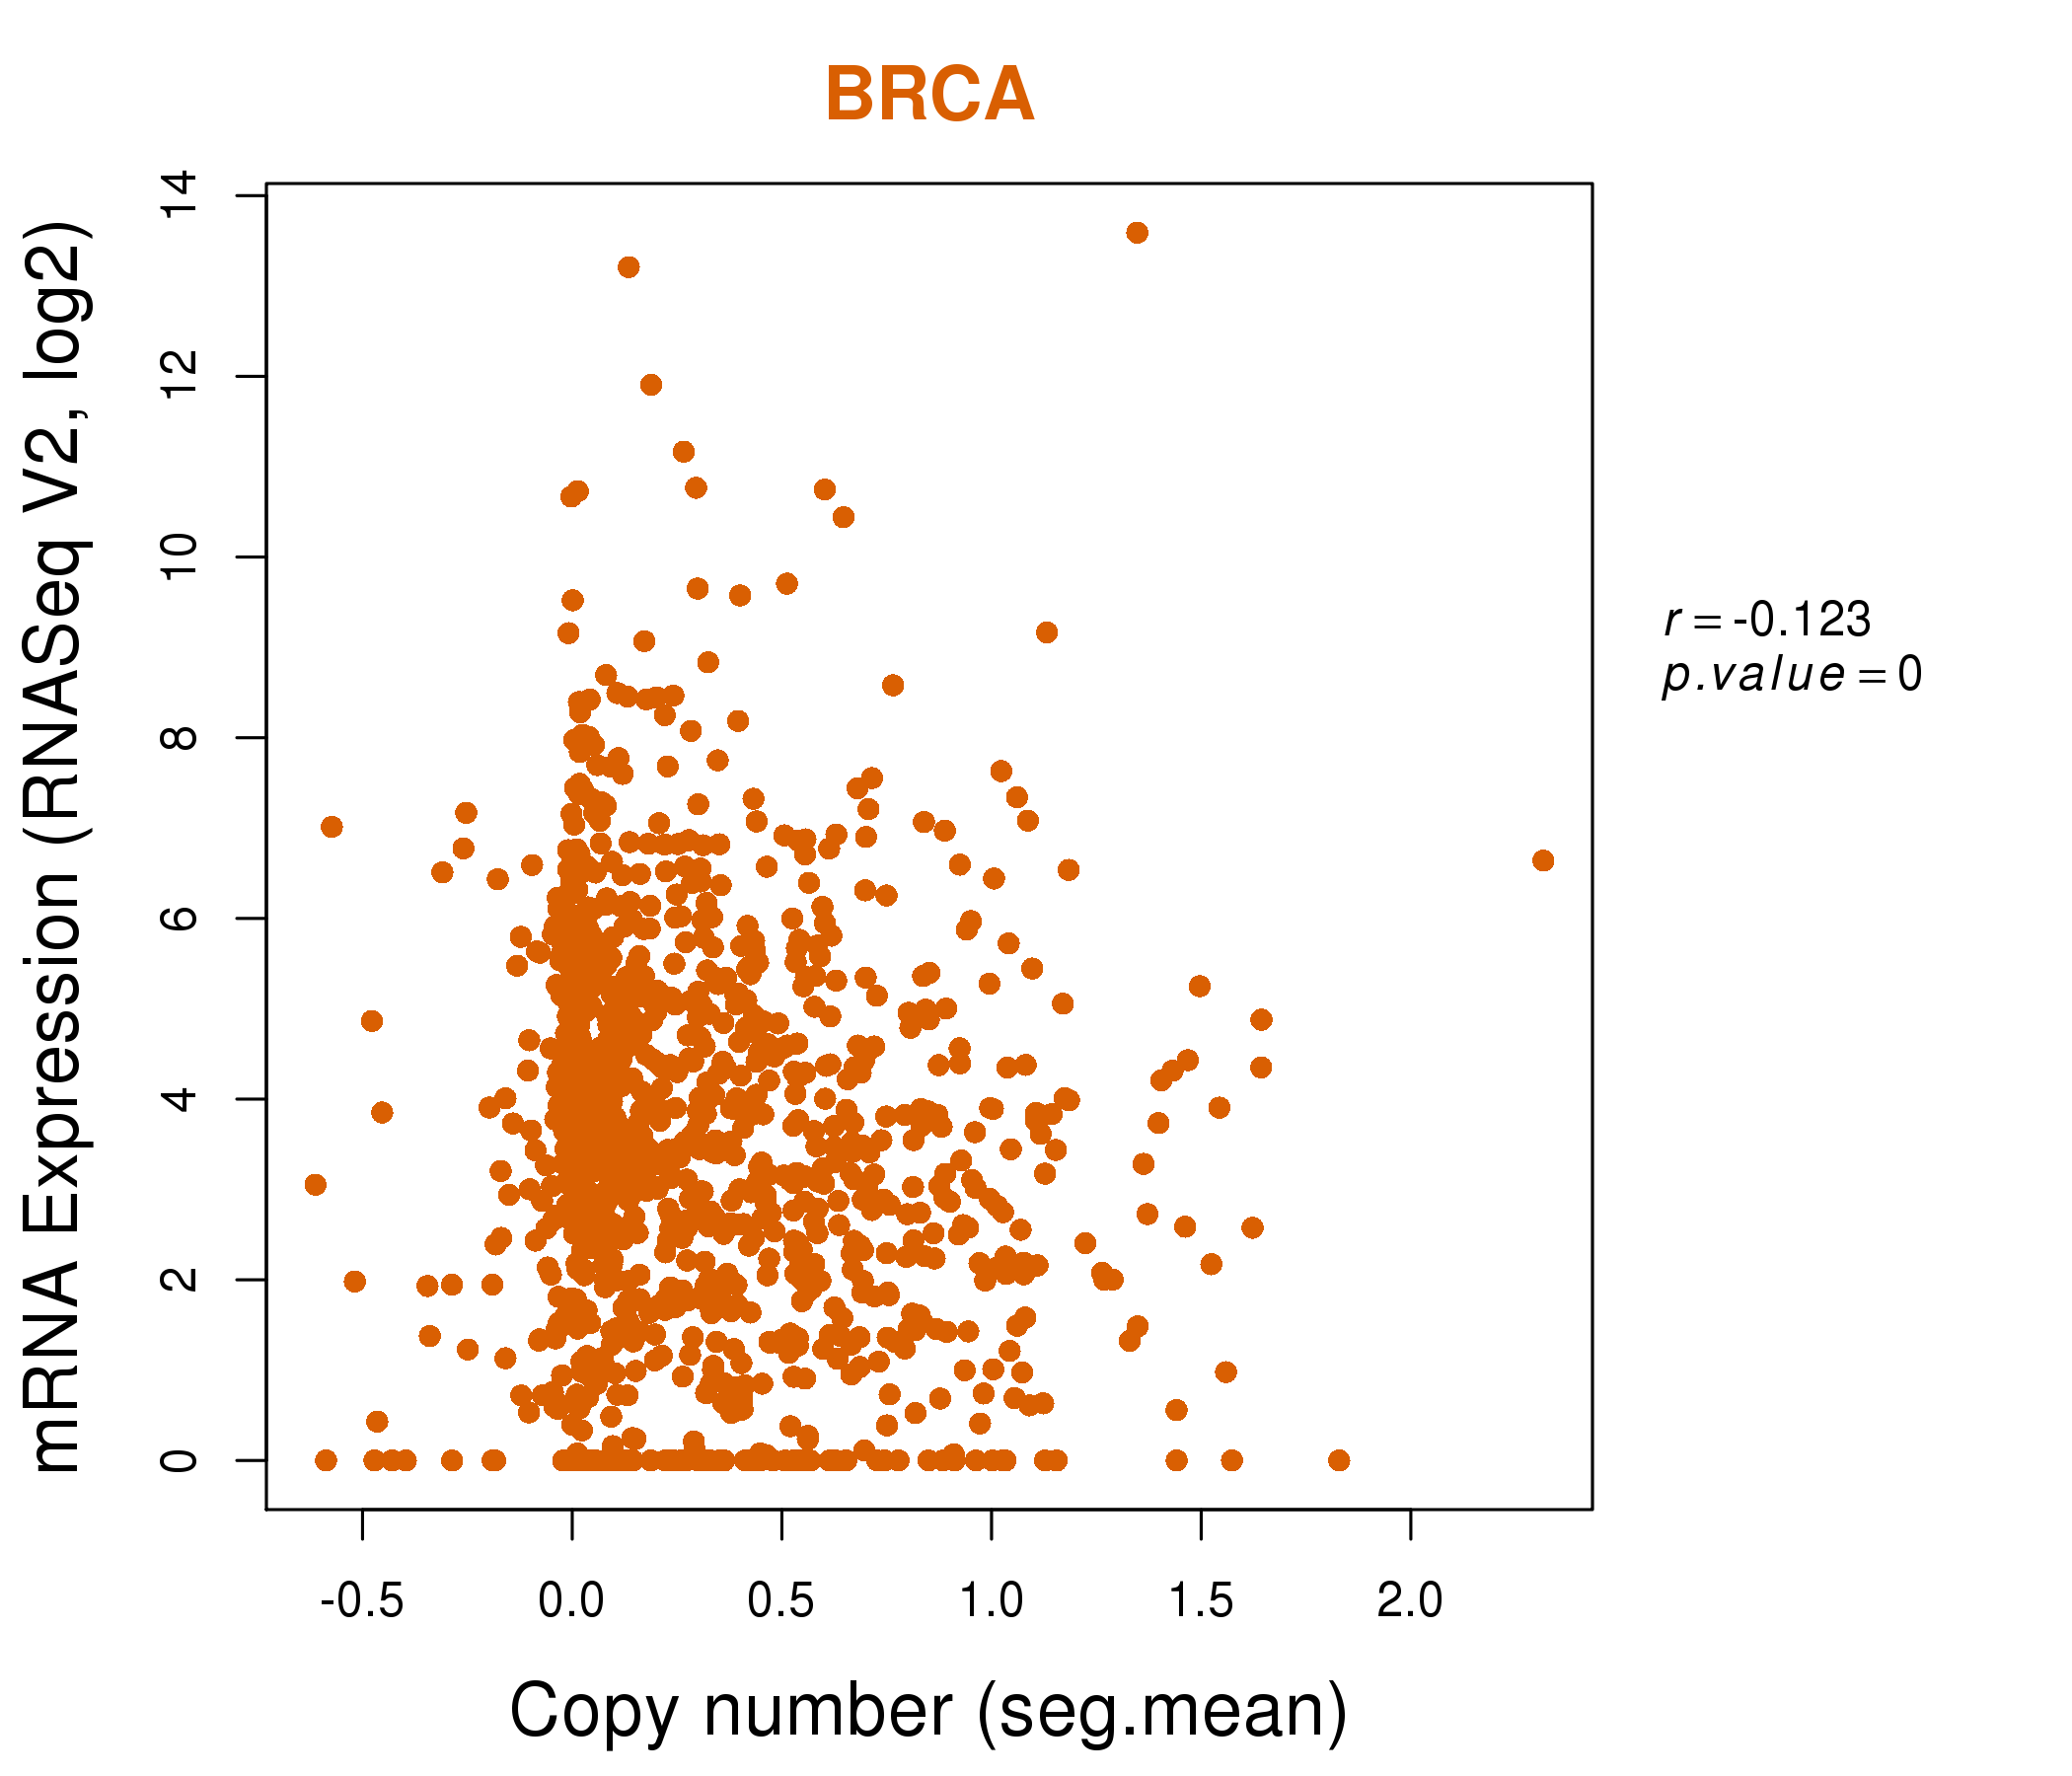
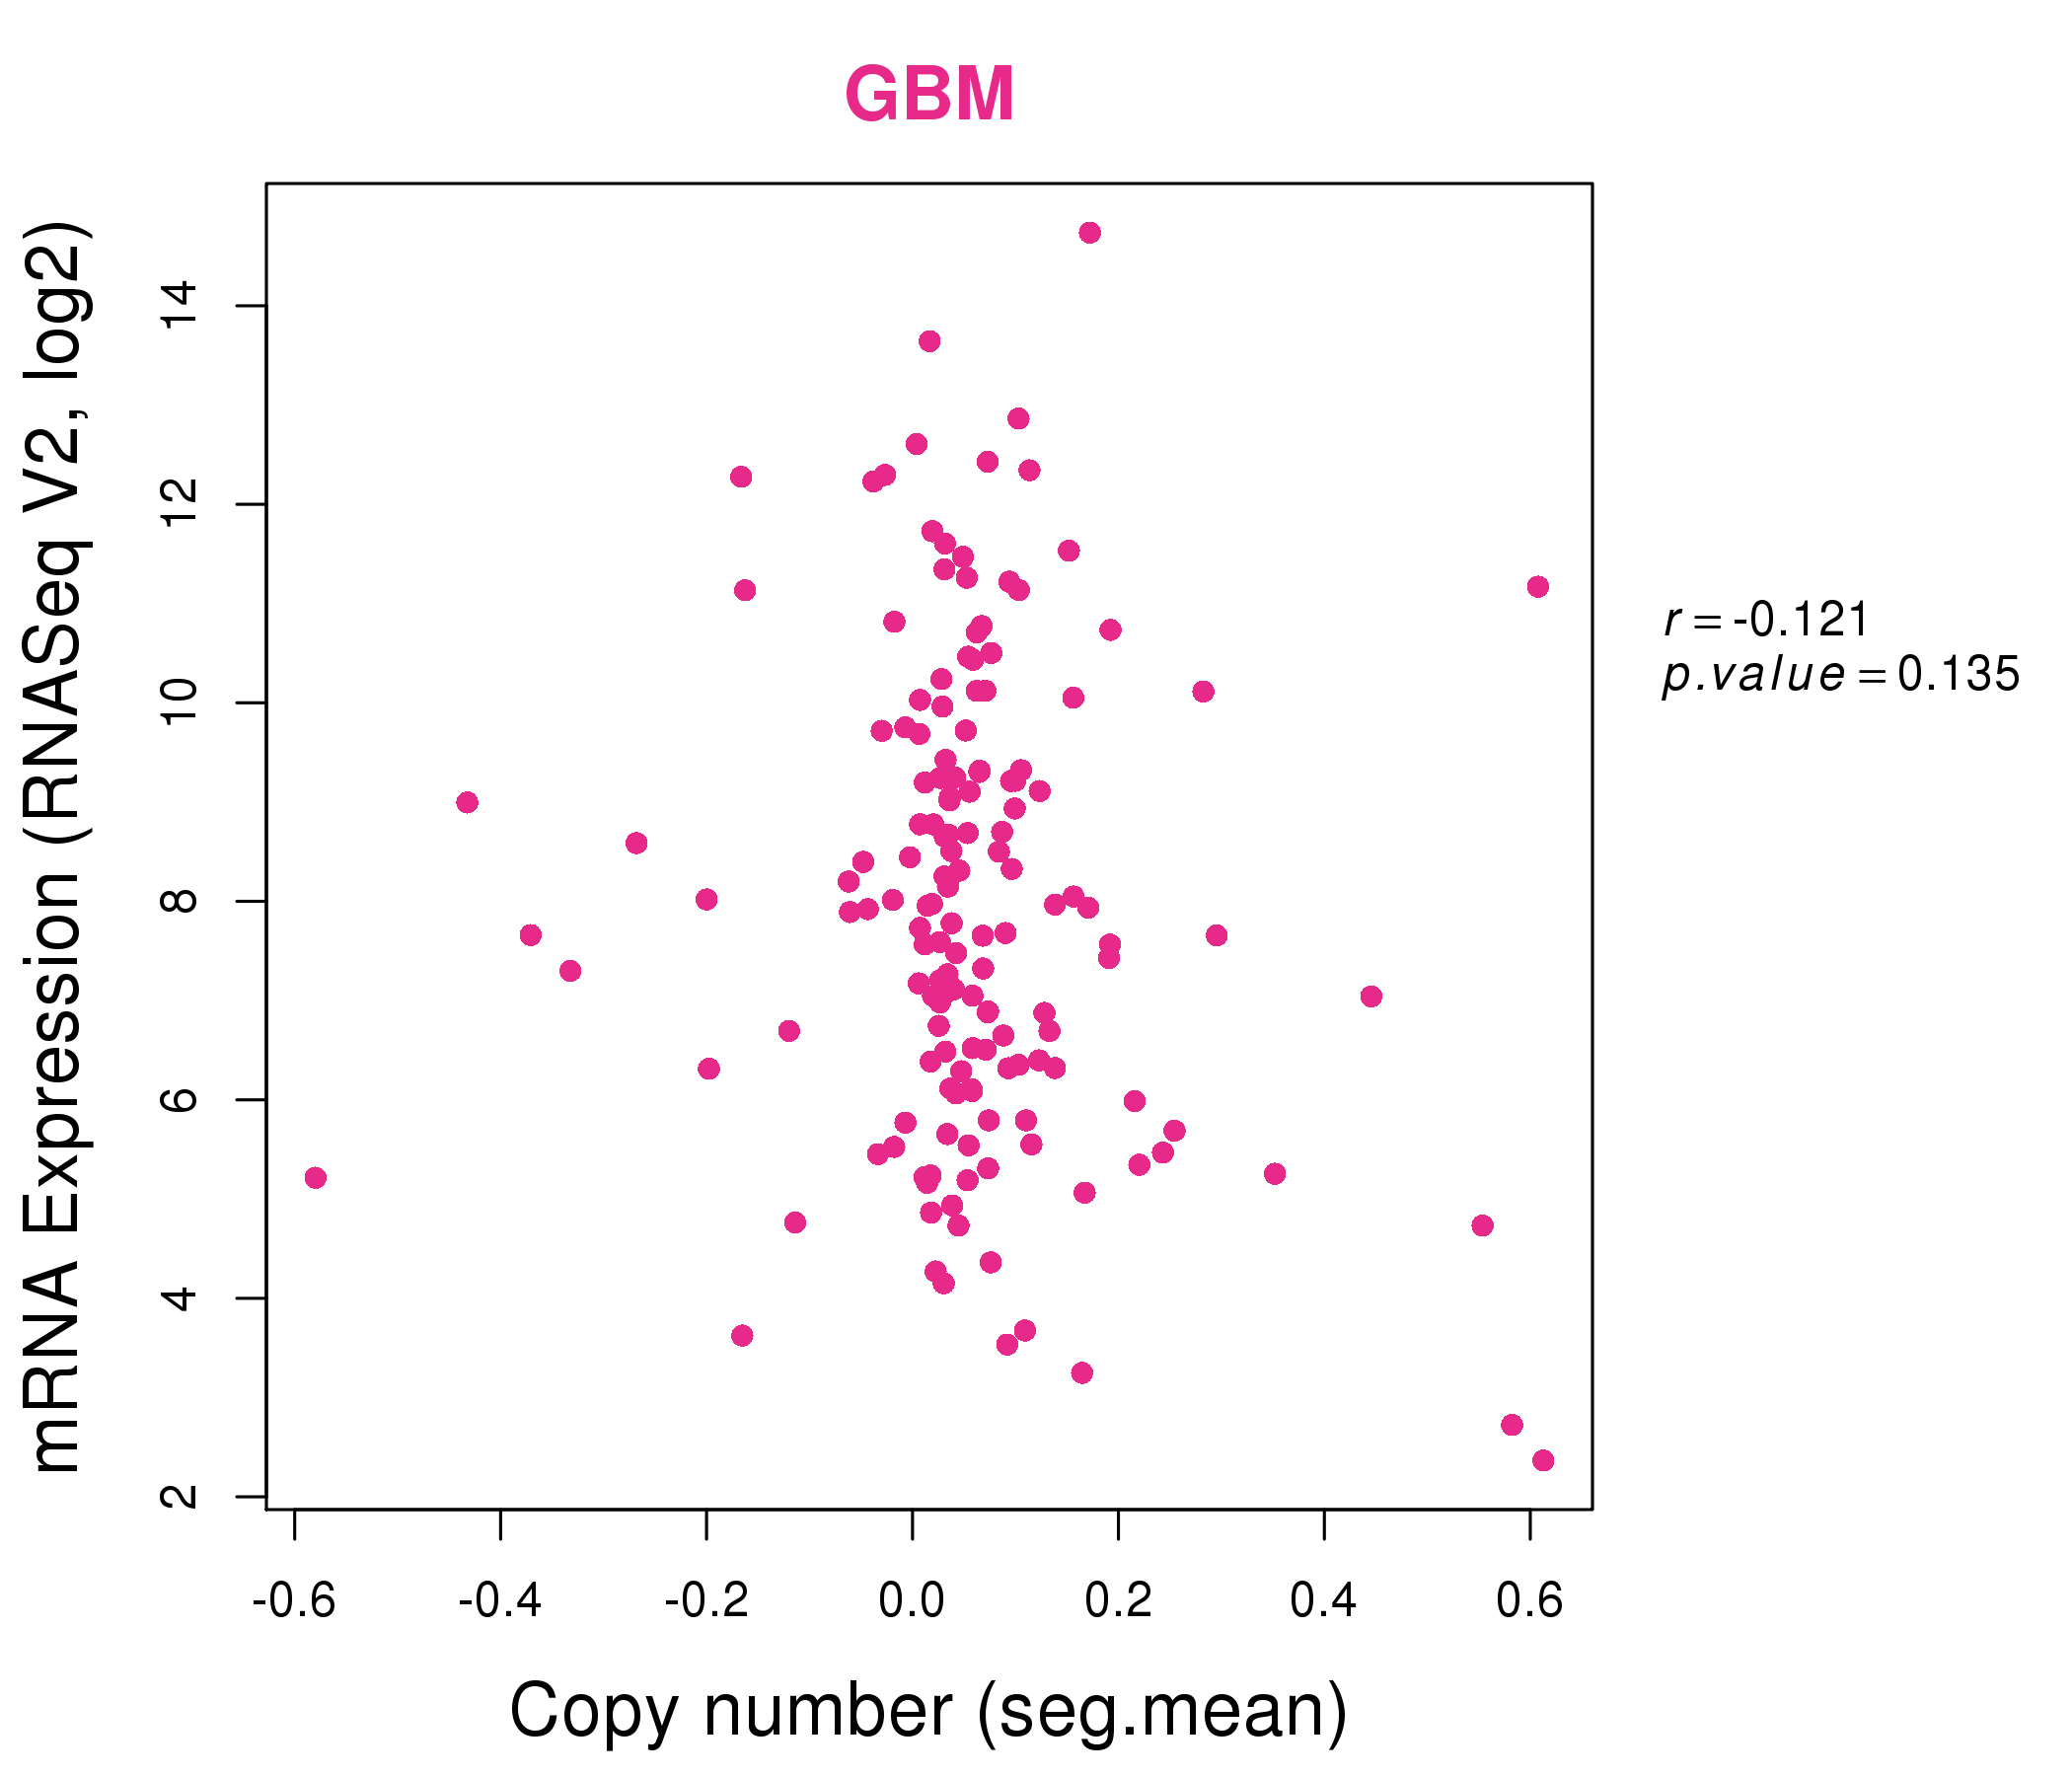
| * Normalized gene expression data of RNASeqV2 was extracted from TCGA using R package TCGA-Assembler. The URLs of all public data files on TCGA DCC data server were gathered at Jan-05-2015. Only eight cancer types have enough normal control samples for differential expression analysis. (t test, adjusted p<0.05 (using Benjamini-Hochberg FDR)) |
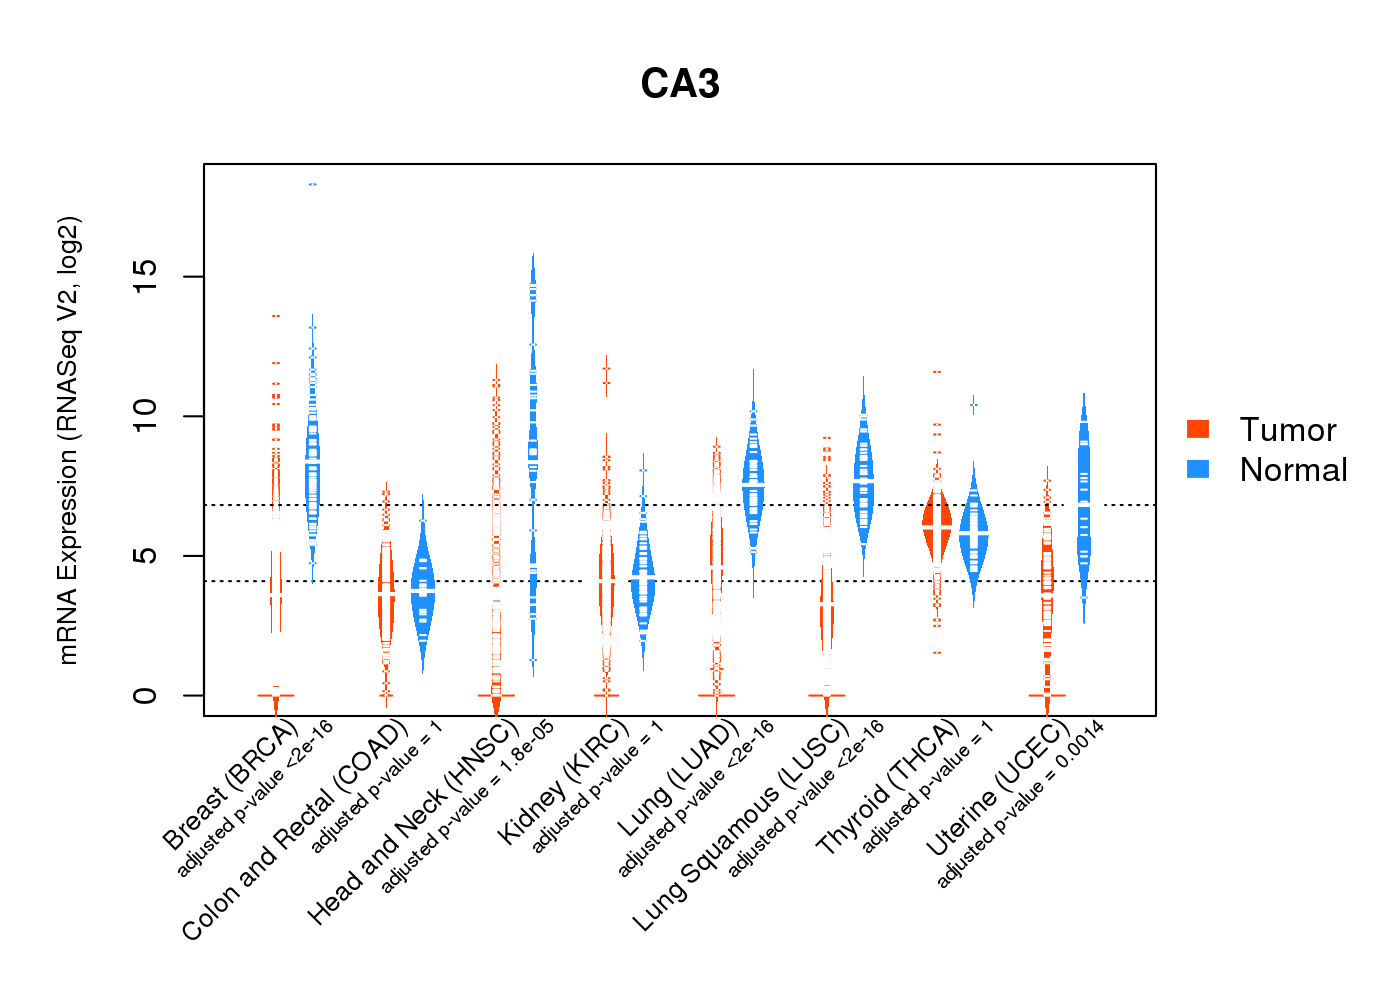 |
| Top |
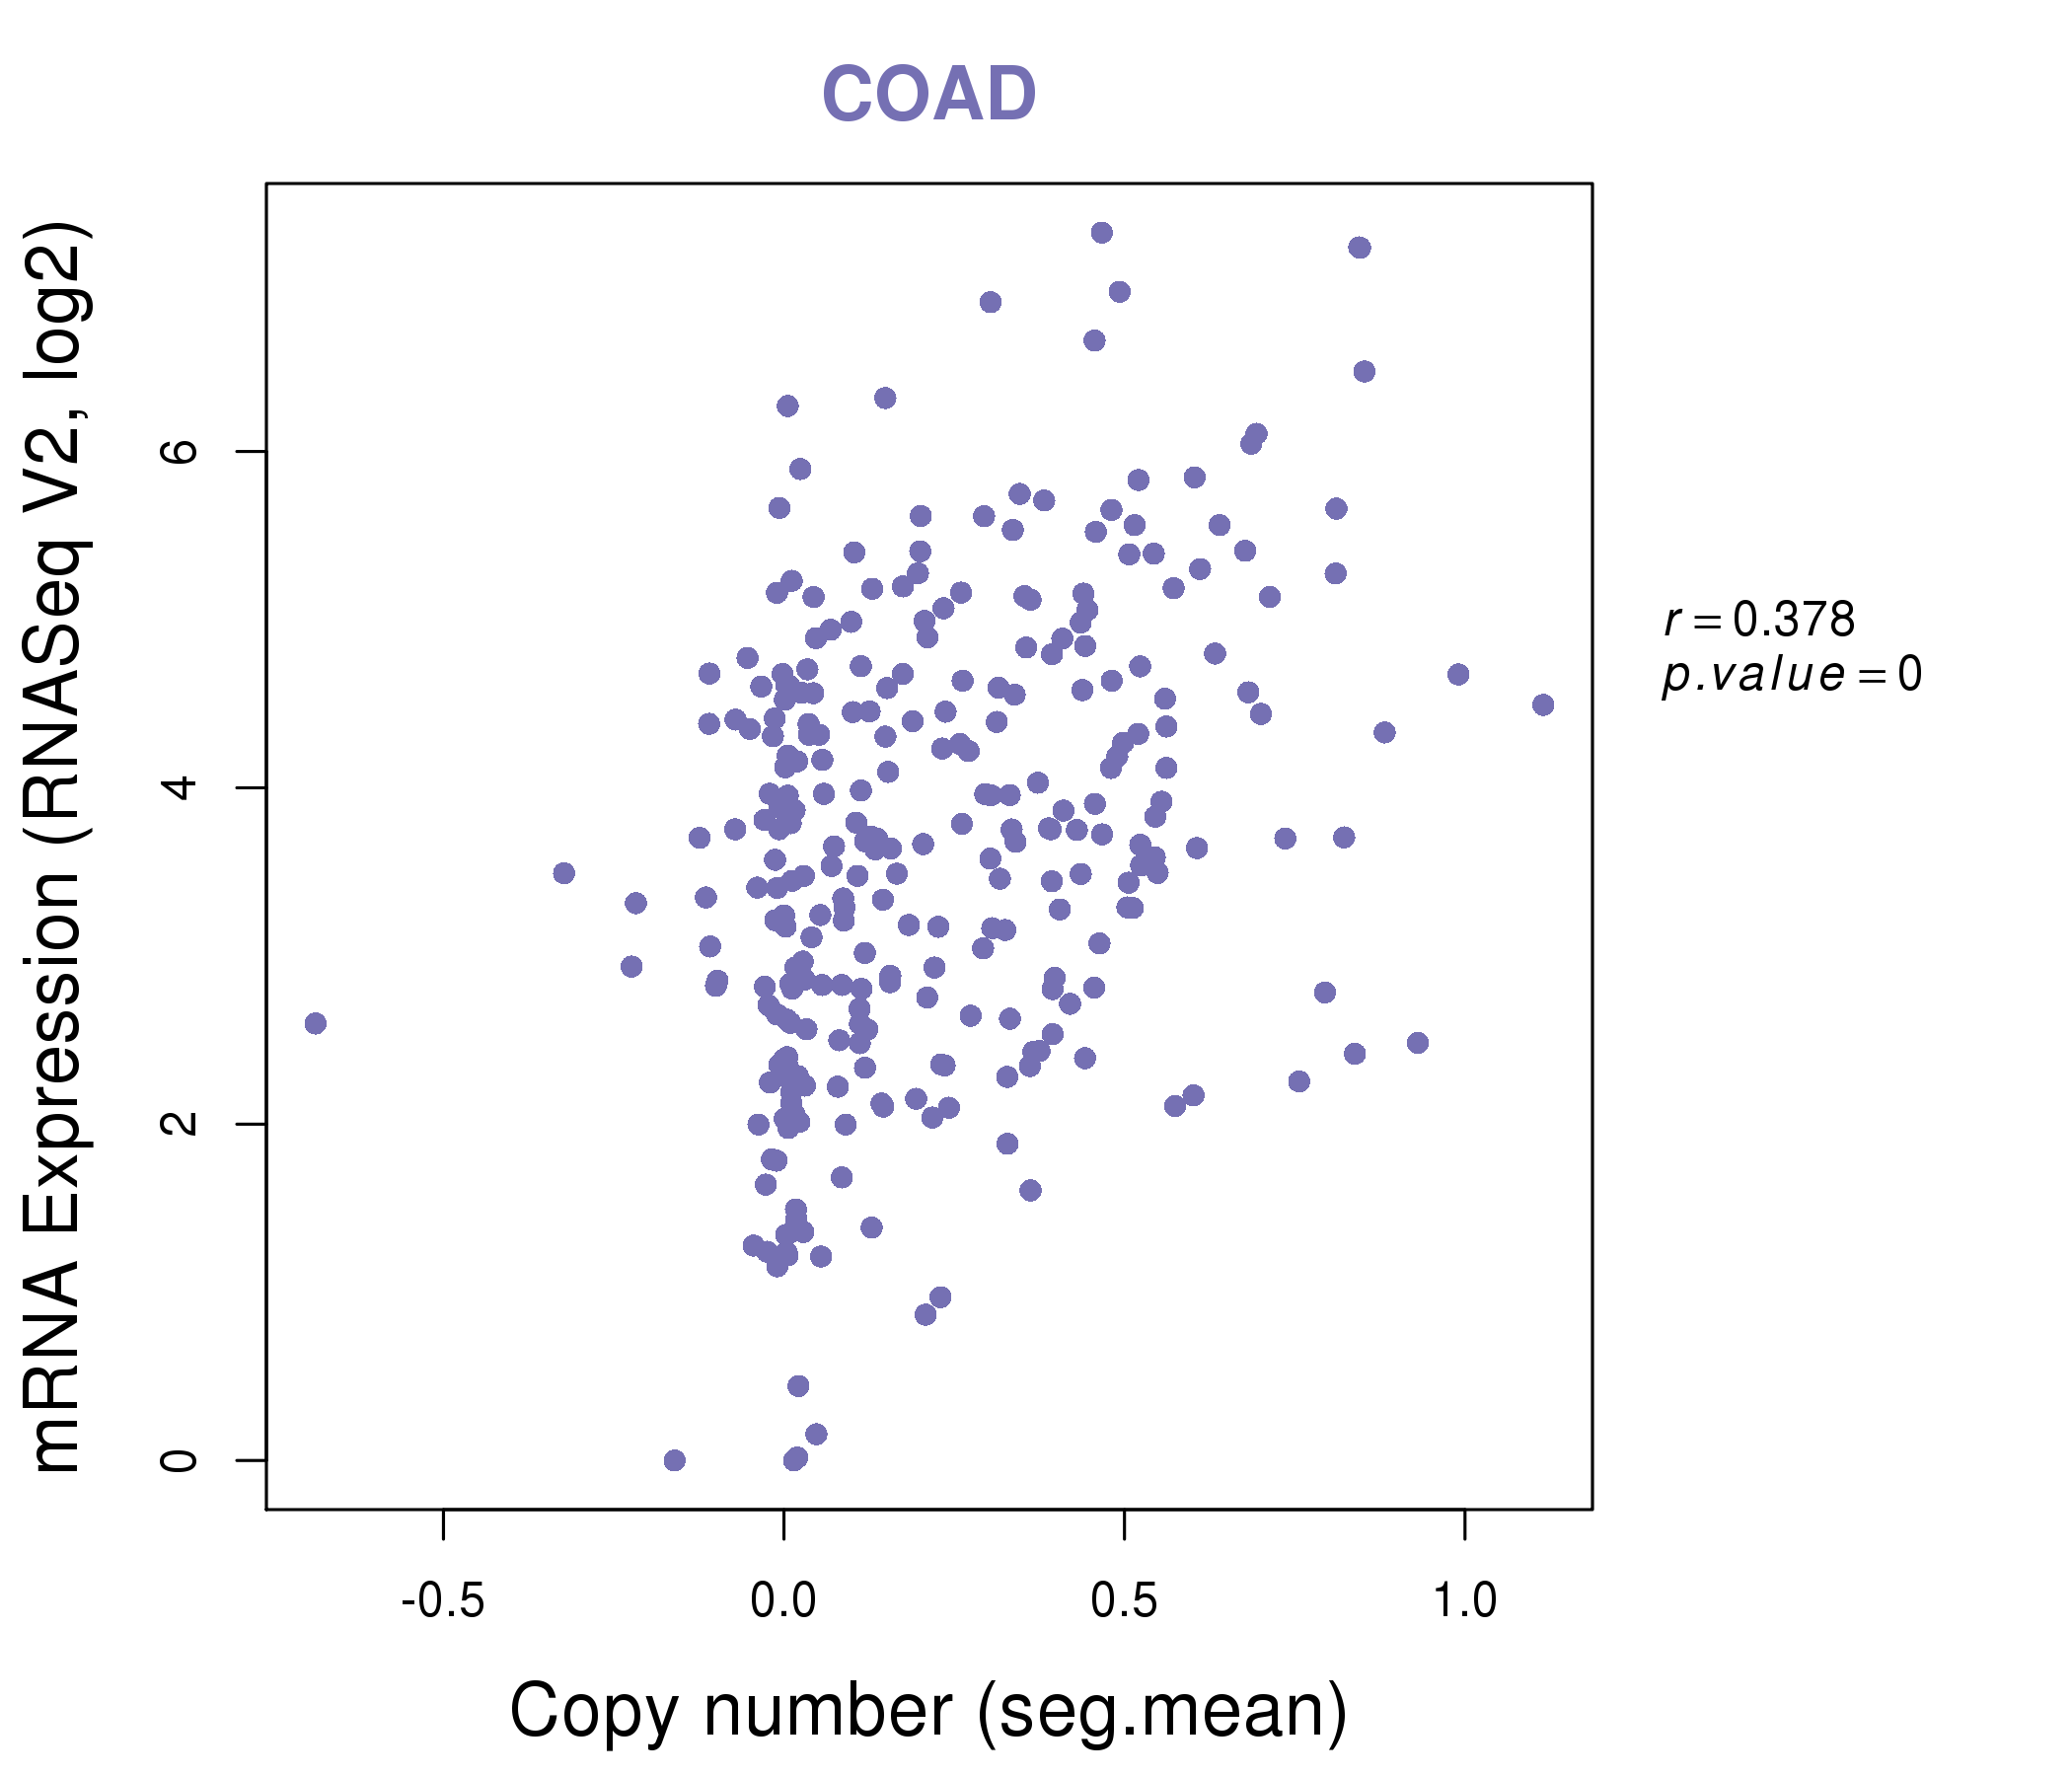
| * This plots show the correlation between CNV and gene expression. |
: Open all plots for all cancer types
 |
|
 |
|
| Top |
| Gene-Gene Network Information |
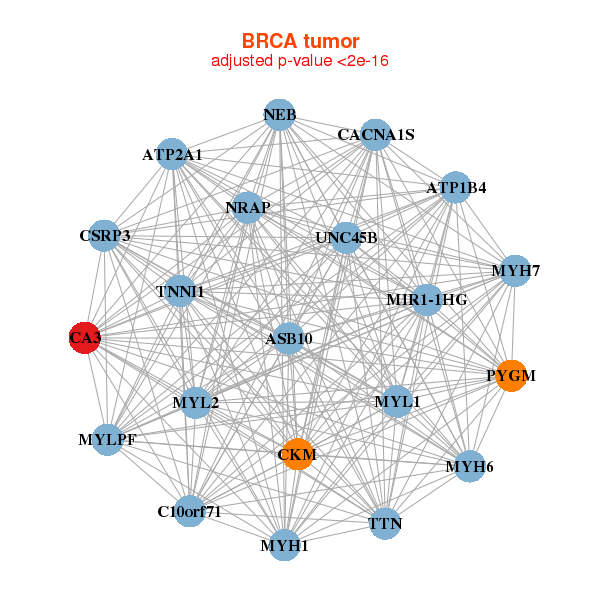
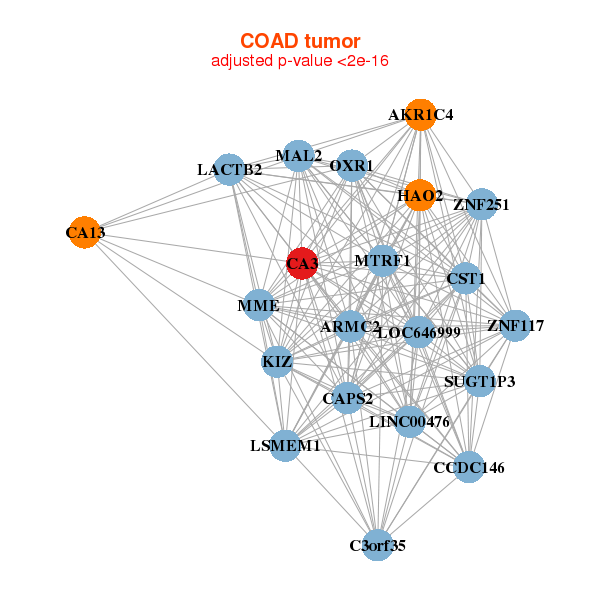
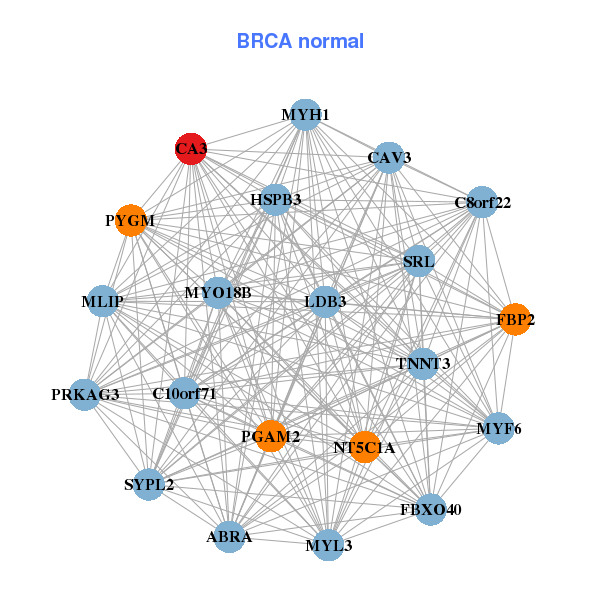
| * Co-Expression network figures were drawn using R package igraph. Only the top 20 genes with the highest correlations were shown. Red circle: input gene, orange circle: cell metabolism gene, sky circle: other gene |
: Open all plots for all cancer types
 |
| ||||
| ASB10,ATP1B4,ATP2A1,C10orf71,MIR1-1HG,CA3,CACNA1S, CKM,CSRP3,MYH1,MYH6,MYH7,MYL1,MYL2, MYLPF,NEB,NRAP,PYGM,TNNI1,TTN,UNC45B | ABRA,C10orf71,MLIP,C8orf22,CA3,CAV3,FBP2, FBXO40,HSPB3,LDB3,MYF6,MYH1,MYL3,MYO18B, NT5C1A,PGAM2,PRKAG3,PYGM,SRL,SYPL2,TNNT3 | ||||
 |
| ||||
| AKR1C4,ARMC2,C3orf35,LSMEM1,LINC00476,CA13,CA3, CAPS2,CCDC146,CST1,HAO2,LACTB2,LOC646999,MAL2, MME,MTRF1,OXR1,KIZ,SUGT1P3,ZNF117,ZNF251 | ADAMTSL5,AFP,AKR1C8P,APC,APOA5,AWAT1,BTNL2, CSNK1G2-AS1,TMEM74B,C6,CA3,CIDEC,CLCN5,ENAM, ESPNP,GPD1,HEATR4,HSD17B3,LINC01312,NEB,ZNF292 |
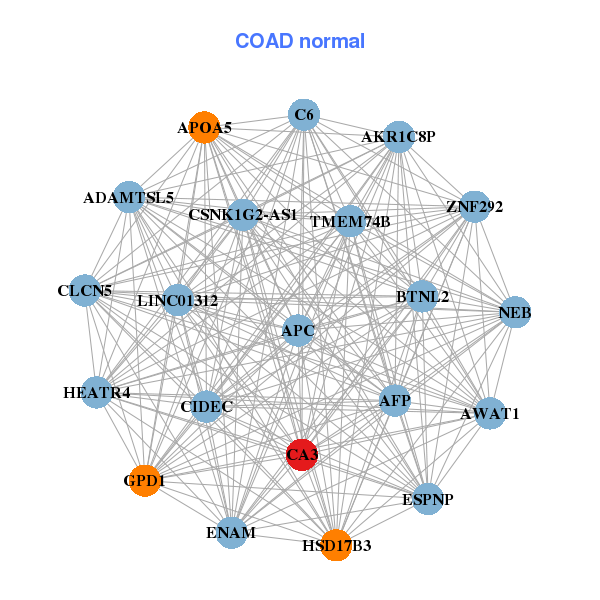
| * Co-Expression network figures were drawn using R package igraph. Only the top 20 genes with the highest correlations were shown. Red circle: input gene, orange circle: cell metabolism gene, sky circle: other gene |
: Open all plots for all cancer types
| Top |
: Open all interacting genes' information including KEGG pathway for all interacting genes from DAVID
| Top |
| Pharmacological Information for CA3 |
| DB Category | DB Name | DB's ID and Url link |
| * Gene Centered Interaction Network. |
 |
| * Drug Centered Interaction Network. |
| DrugBank ID | Target Name | Drug Groups | Generic Name | Drug Centered Network | Drug Structure |
| DB00819 | carbonic anhydrase III, muscle specific | approved | Acetazolamide | 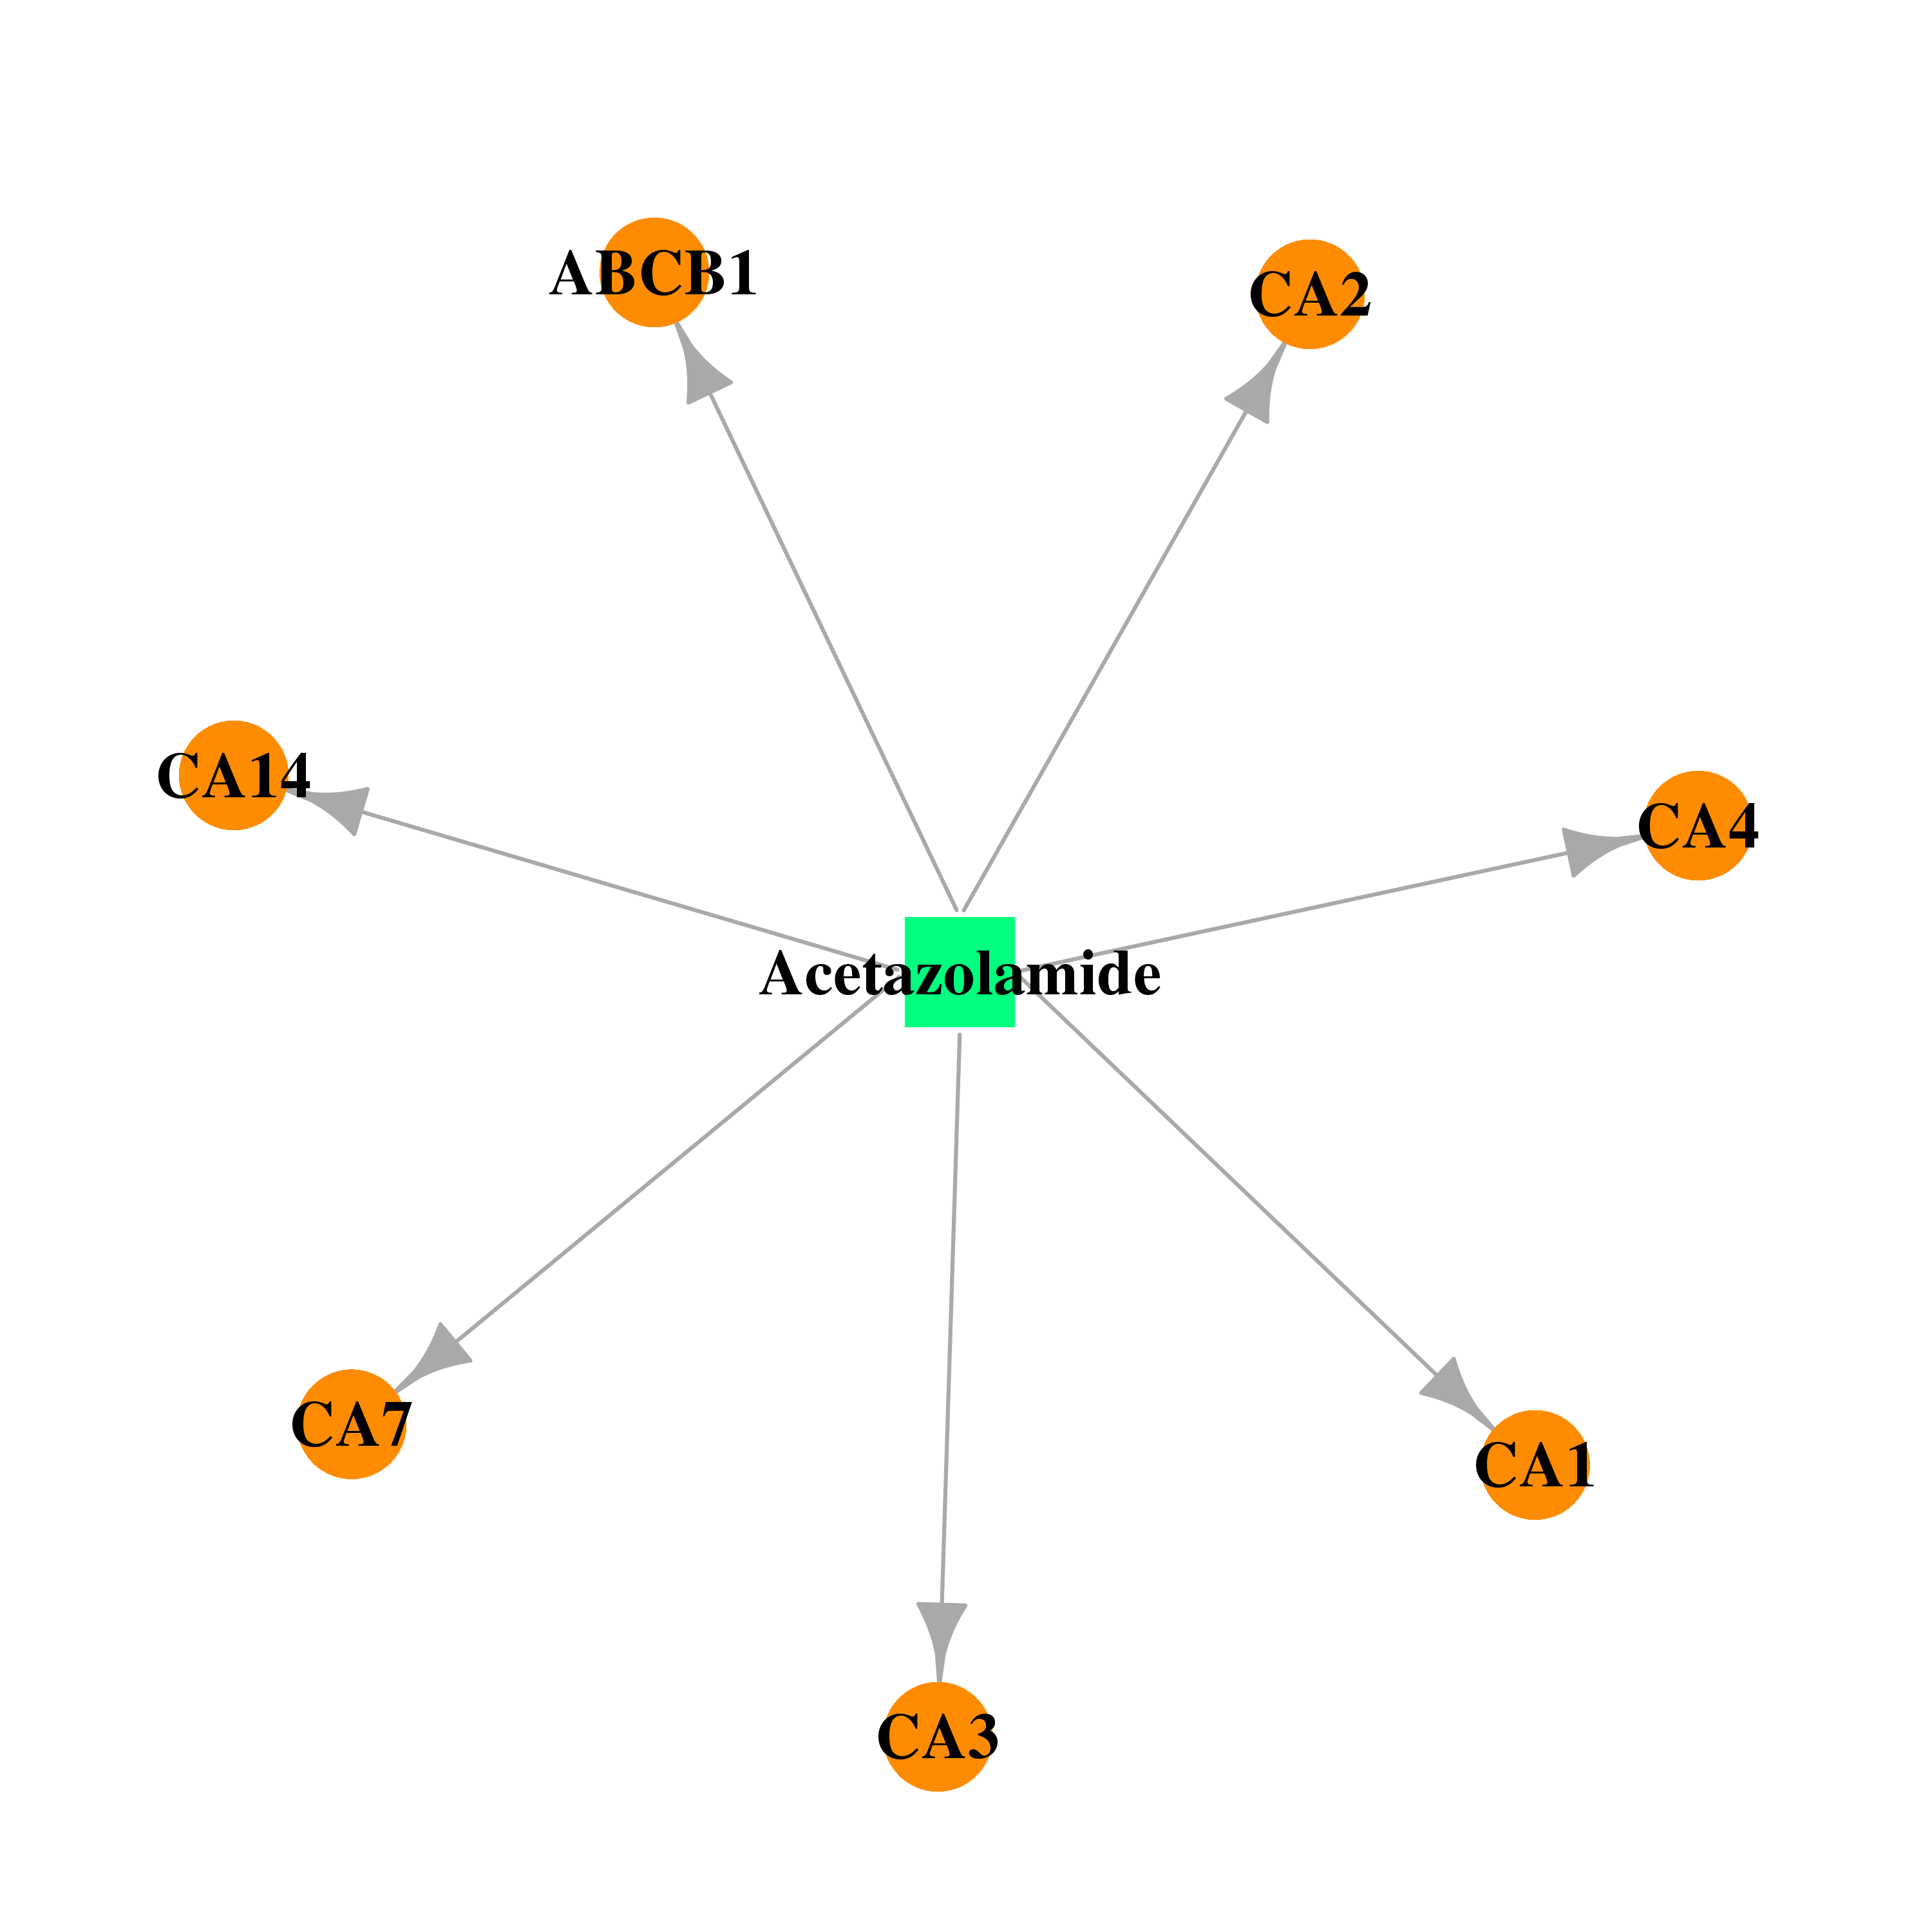 | 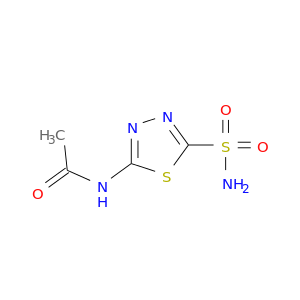 |
| DB00909 | carbonic anhydrase III, muscle specific | approved; investigational | Zonisamide | 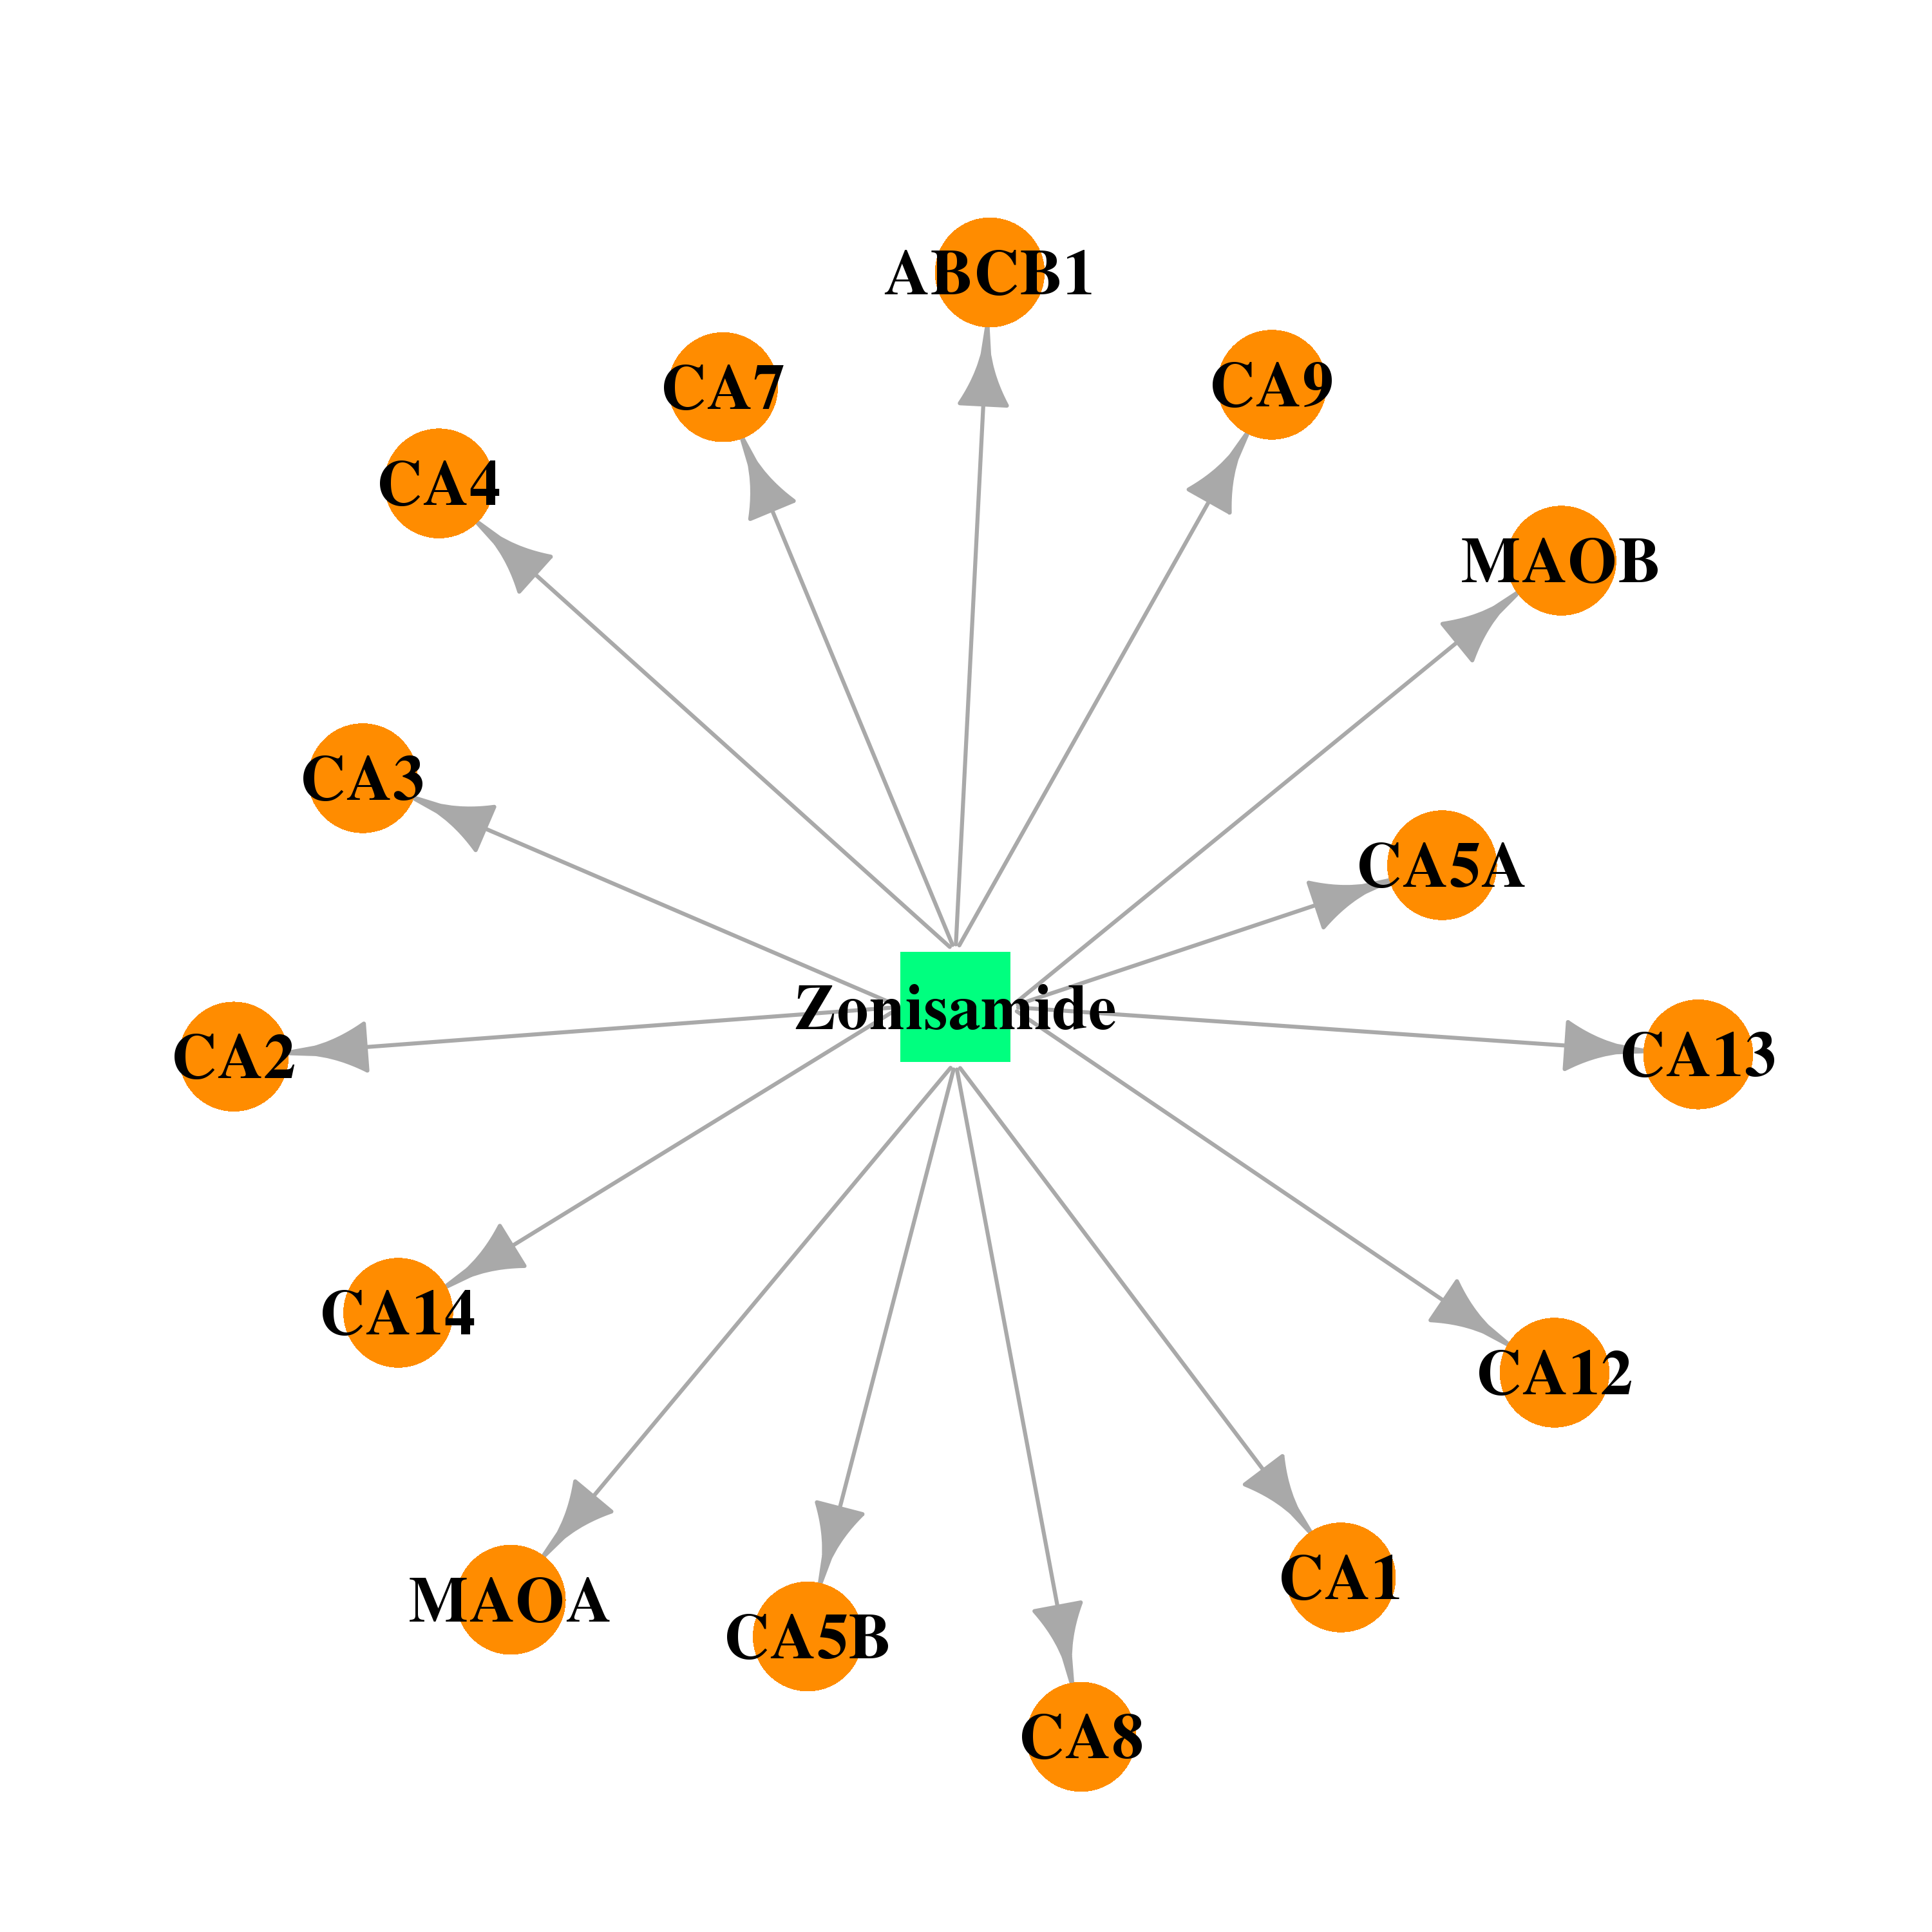 |  |
| DB01033 | carbonic anhydrase III, muscle specific | approved | Mercaptopurine | 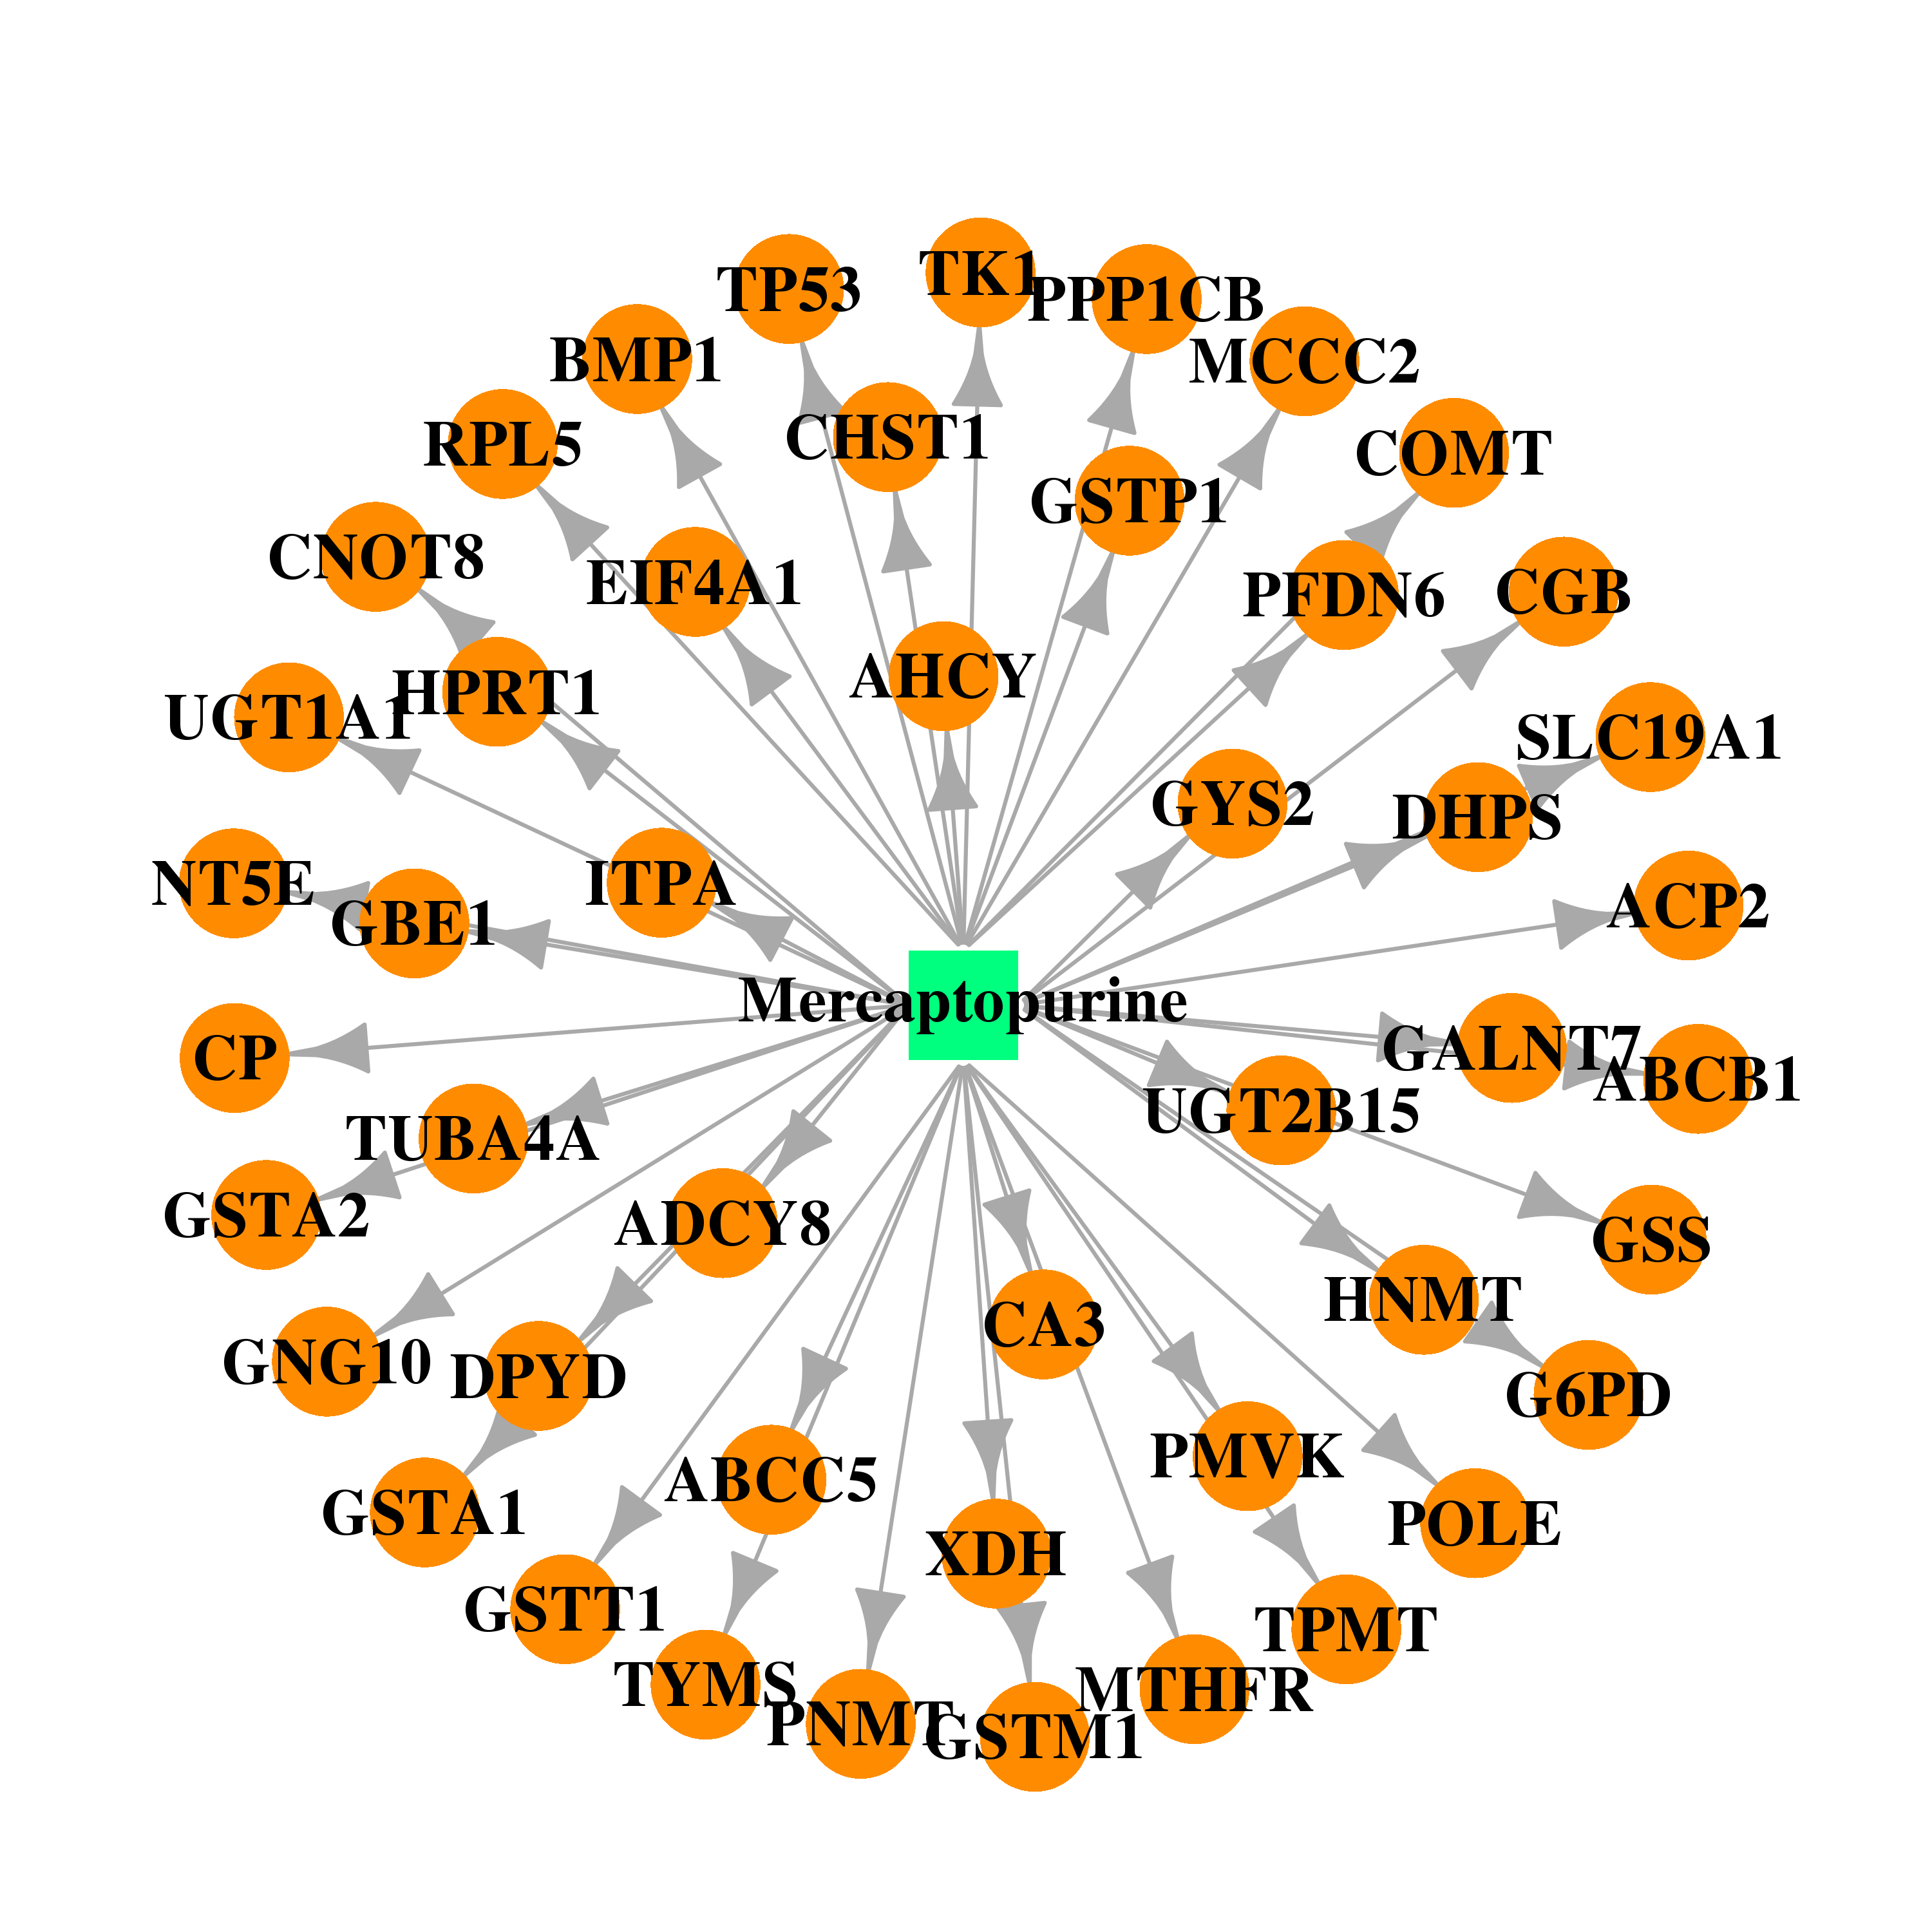 | 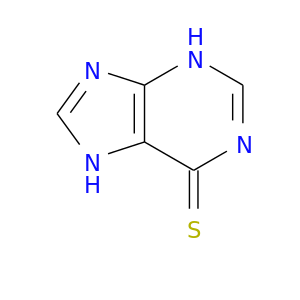 |
| DB00563 | carbonic anhydrase III, muscle specific | approved | Methotrexate |  |  |
| Top |
| Cross referenced IDs for CA3 |
| * We obtained these cross-references from Uniprot database. It covers 150 different DBs, 18 categories. http://www.uniprot.org/help/cross_references_section |
: Open all cross reference information
|
Copyright © 2016-Present - The Univsersity of Texas Health Science Center at Houston @ |