|
||||||||||||||||||||
| |
| Phenotypic Information (metabolism pathway, cancer, disease, phenome) |
| |
| |
| Gene-Gene Network Information: Co-Expression Network, Interacting Genes & KEGG |
| |
|


| Gene Summary for CA5A |
| Top |
| Phenotypic Information for CA5A(metabolism pathway, cancer, disease, phenome) |
| Cancer | CGAP: CA5A |
| Familial Cancer Database: CA5A | |
| * This gene is included in those cancer gene databases. |
|
|
|
|
|
|
| ||||||||||||||
Oncogene 1 | Significant driver gene in | |||||||||||||||||||
| cf) number; DB name 1 Oncogene; http://nar.oxfordjournals.org/content/35/suppl_1/D721.long, 2 Tumor Suppressor gene; https://bioinfo.uth.edu/TSGene/, 3 Cancer Gene Census; http://www.nature.com/nrc/journal/v4/n3/abs/nrc1299.html, 4 CancerGenes; http://nar.oxfordjournals.org/content/35/suppl_1/D721.long, 5 Network of Cancer Gene; http://ncg.kcl.ac.uk/index.php, 1Therapeutic Vulnerabilities in Cancer; http://cbio.mskcc.org/cancergenomics/statius/ |
| KEGG_NITROGEN_METABOLISM | |
| OMIM | |
| Orphanet | |
| Disease | KEGG Disease: CA5A |
| MedGen: CA5A (Human Medical Genetics with Condition) | |
| ClinVar: CA5A | |
| Phenotype | MGI: CA5A (International Mouse Phenotyping Consortium) |
| PhenomicDB: CA5A | |
| Mutations for CA5A |
| * Under tables are showing count per each tissue to give us broad intuition about tissue specific mutation patterns.You can go to the detailed page for each mutation database's web site. |
| - Statistics for Tissue and Mutation type | Top |
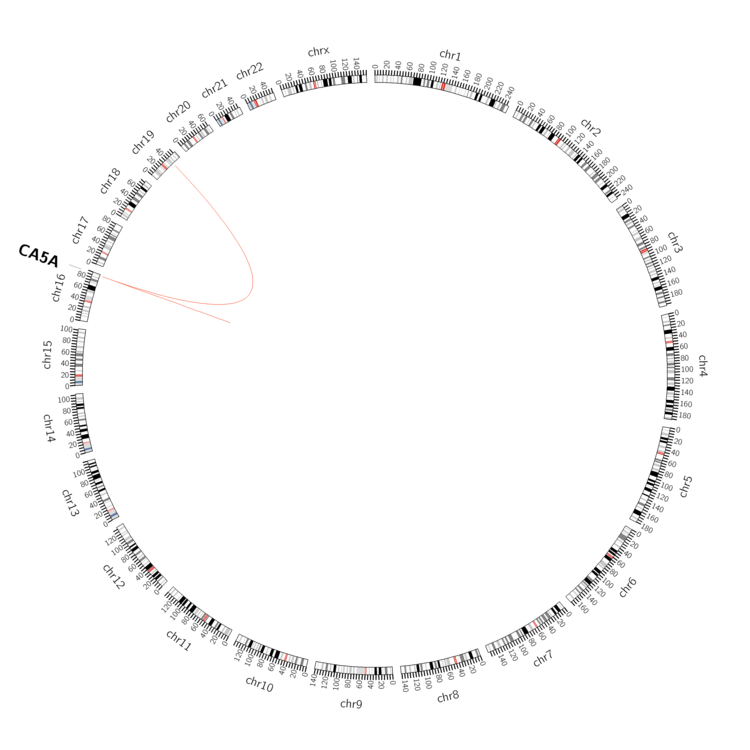 |
| - For Inter-chromosomal Variations |
| There's no inter-chromosomal structural variation. |
| - For Intra-chromosomal Variations |
| * Intra-chromosomal variantions includes 'intrachromosomal amplicon to amplicon', 'intrachromosomal amplicon to non-amplified dna', 'intrachromosomal deletion', 'intrachromosomal fold-back inversion', 'intrachromosomal inversion', 'intrachromosomal tandem duplication', 'Intrachromosomal unknown type', 'intrachromosomal with inverted orientation', 'intrachromosomal with non-inverted orientation'. |
 |
| Sample | Symbol_a | Chr_a | Start_a | End_a | Symbol_b | Chr_b | Start_b | End_b |
| ovary | CA5A | chr16 | 87949823 | 87949843 | CA5A | chr16 | 87953607 | 87953627 |
| ovary | CA5A | chr16 | 87949831 | 87949851 | CA5A | chr16 | 87953607 | 87953627 |
| ovary | CA5A | chr16 | 87964134 | 87964154 | chr19 | 42360388 | 42360408 |
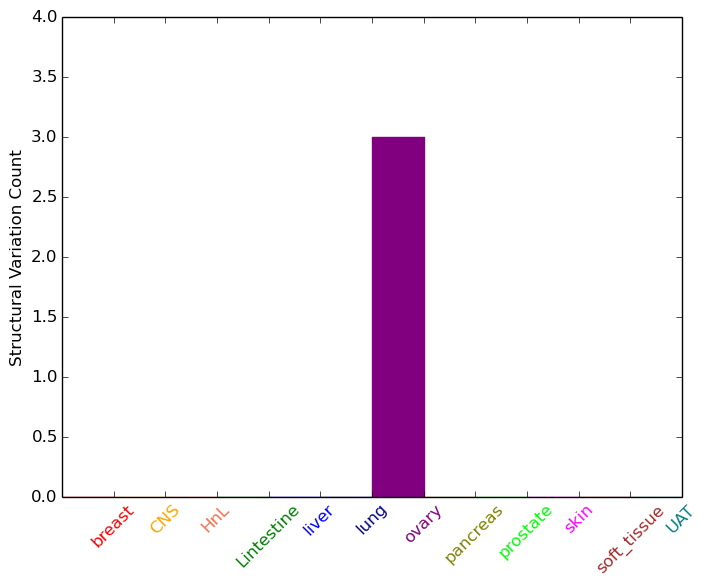
| cf) Tissue number; Tissue name (1;Breast, 2;Central_nervous_system, 3;Haematopoietic_and_lymphoid_tissue, 4;Large_intestine, 5;Liver, 6;Lung, 7;Ovary, 8;Pancreas, 9;Prostate, 10;Skin, 11;Soft_tissue, 12;Upper_aerodigestive_tract) |
| * From mRNA Sanger sequences, Chitars2.0 arranged chimeric transcripts. This table shows CA5A related fusion information. |
| ID | Head Gene | Tail Gene | Accession | Gene_a | qStart_a | qEnd_a | Chromosome_a | tStart_a | tEnd_a | Gene_a | qStart_a | qEnd_a | Chromosome_a | tStart_a | tEnd_a |
| Top |
| There's no copy number variation information in COSMIC data for this gene. |
| Top |
|
 |
| Top |
| Stat. for Non-Synonymous SNVs (# total SNVs=22) | (# total SNVs=11) |
 |  |
(# total SNVs=1) | (# total SNVs=1) |
 |  |
| Top |
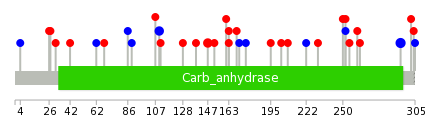
| * When you move the cursor on each content, you can see more deailed mutation information on the Tooltip. Those are primary_site,primary_histology,mutation(aa),pubmedID. |
| GRCh37 position | Mutation(aa) | Unique sampleID count |
| chr16:87921771-87921771 | p.A294A | 3 |
| chr16:87938412-87938412 | p.G147S | 2 |
| chr16:87960364-87960364 | p.T110T | 2 |
| chr16:87960427-87960427 | p.A89A | 1 |
| chr16:87921738-87921738 | p.S305S | 1 |
| chr16:87925488-87925488 | p.A231T | 1 |
| chr16:87936098-87936098 | p.K163T | 1 |
| chr16:87960436-87960436 | p.S86S | 1 |
| chr16:87921742-87921742 | p.R304K | 1 |
| chr16:87925504-87925504 | p.W225* | 1 |
| Top |
|
 |
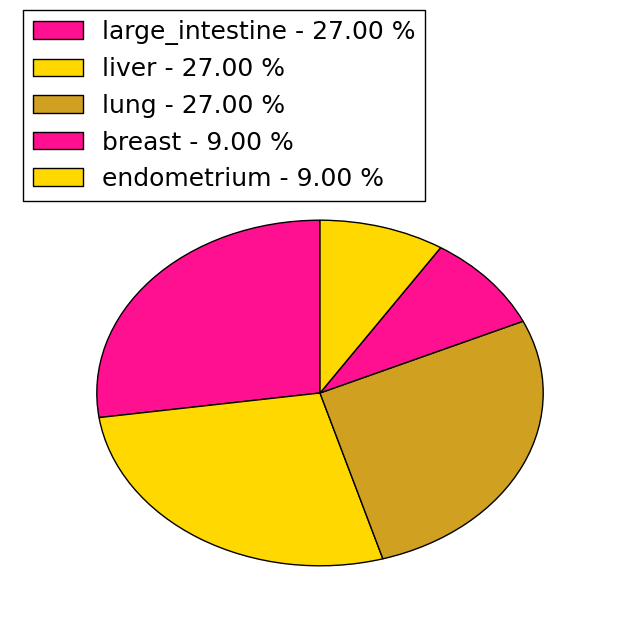
| Point Mutation/ Tissue ID | 1 | 2 | 3 | 4 | 5 | 6 | 7 | 8 | 9 | 10 | 11 | 12 | 13 | 14 | 15 | 16 | 17 | 18 | 19 | 20 |
| # sample | 1 | 1 | 4 | 2 | 1 | 6 | 3 | 1 | 1 | 6 | ||||||||||
| # mutation | 1 | 1 | 4 | 2 | 1 | 6 | 3 | 1 | 1 | 6 | ||||||||||
| nonsynonymous SNV | 2 | 1 | 1 | 4 | 2 | 1 | 1 | 5 | ||||||||||||
| synonymous SNV | 1 | 1 | 2 | 1 | 2 | 1 | 1 |
| cf) Tissue ID; Tissue type (1; BLCA[Bladder Urothelial Carcinoma], 2; BRCA[Breast invasive carcinoma], 3; CESC[Cervical squamous cell carcinoma and endocervical adenocarcinoma], 4; COAD[Colon adenocarcinoma], 5; GBM[Glioblastoma multiforme], 6; Glioma Low Grade, 7; HNSC[Head and Neck squamous cell carcinoma], 8; KICH[Kidney Chromophobe], 9; KIRC[Kidney renal clear cell carcinoma], 10; KIRP[Kidney renal papillary cell carcinoma], 11; LAML[Acute Myeloid Leukemia], 12; LUAD[Lung adenocarcinoma], 13; LUSC[Lung squamous cell carcinoma], 14; OV[Ovarian serous cystadenocarcinoma ], 15; PAAD[Pancreatic adenocarcinoma], 16; PRAD[Prostate adenocarcinoma], 17; SKCM[Skin Cutaneous Melanoma], 18:STAD[Stomach adenocarcinoma], 19:THCA[Thyroid carcinoma], 20:UCEC[Uterine Corpus Endometrial Carcinoma]) |
| Top |
| * We represented just top 10 SNVs. When you move the cursor on each content, you can see more deailed mutation information on the Tooltip. Those are primary_site, primary_histology, mutation(aa), pubmedID. |
| Genomic Position | Mutation(aa) | Unique sampleID count |
| chr16:87921738 | p.D107N | 1 |
| chr16:87936077 | p.S305S | 1 |
| chr16:87969917 | p.A89A | 1 |
| chr16:87921757 | p.T299I | 1 |
| chr16:87936104 | p.R84K | 1 |
| chr16:87969932 | p.A294A | 1 |
| chr16:87921771 | p.N68K | 1 |
| chr16:87938412 | p.V292V | 1 |
| chr16:87969951 | p.T62T | 1 |
| chr16:87921777 | p.K275K | 1 |
| * Copy number data were extracted from TCGA using R package TCGA-Assembler. The URLs of all public data files on TCGA DCC data server were gathered on Jan-05-2015. Function ProcessCNAData in TCGA-Assembler package was used to obtain gene-level copy number value which is calculated as the average copy number of the genomic region of a gene. |
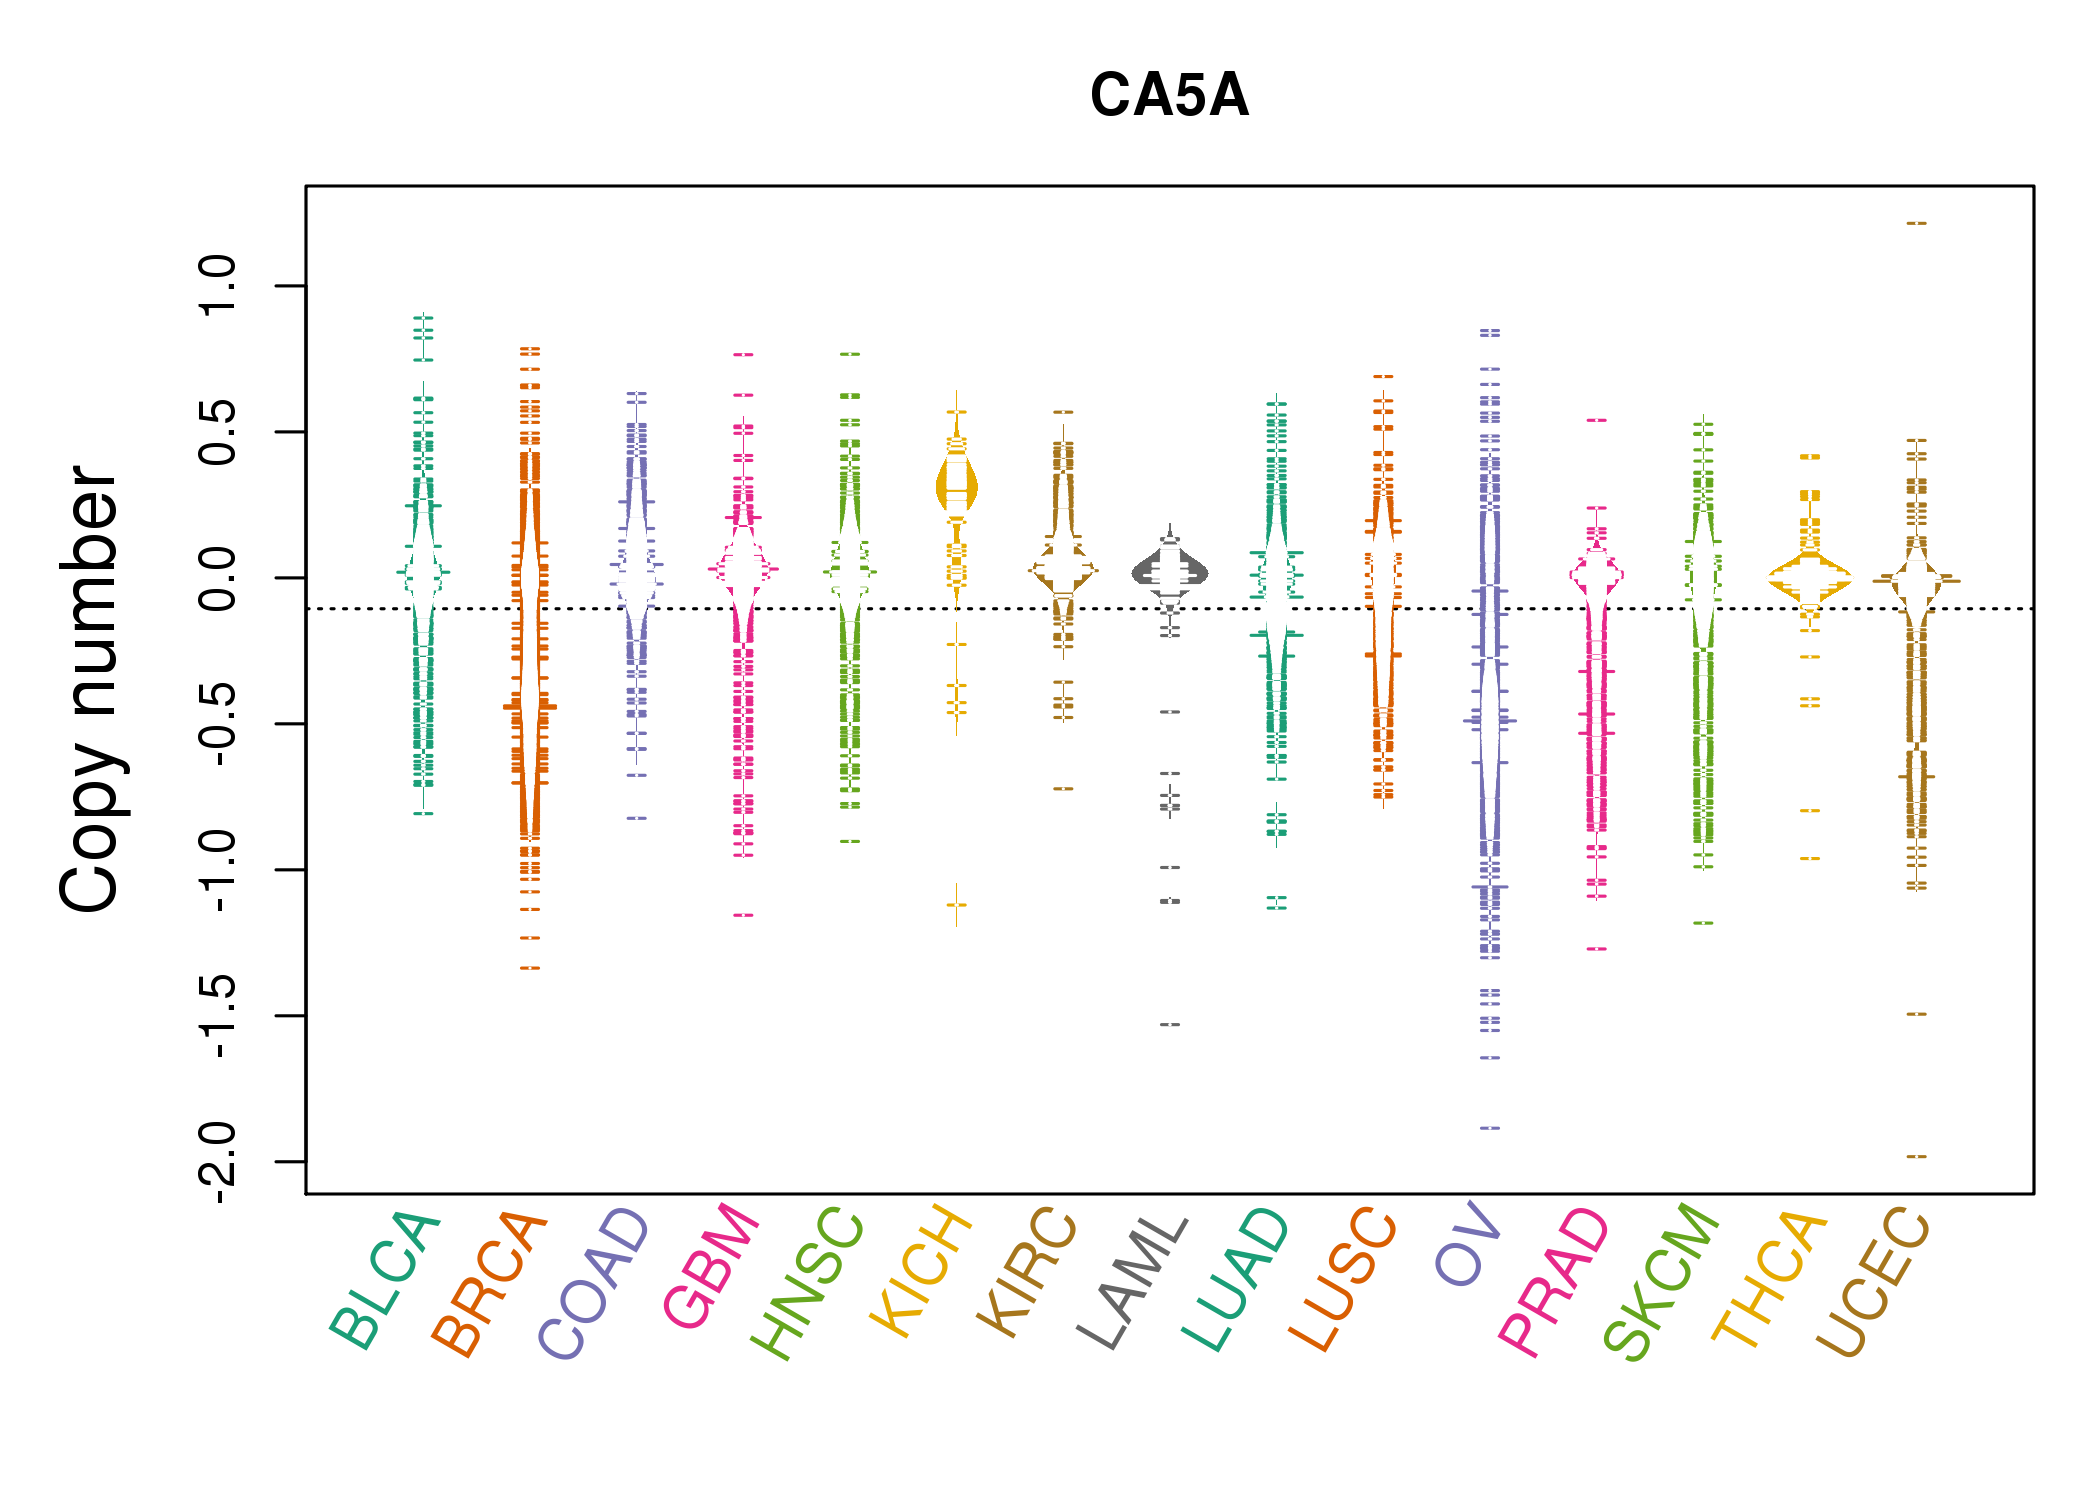 |
| cf) Tissue ID[Tissue type]: BLCA[Bladder Urothelial Carcinoma], BRCA[Breast invasive carcinoma], CESC[Cervical squamous cell carcinoma and endocervical adenocarcinoma], COAD[Colon adenocarcinoma], GBM[Glioblastoma multiforme], Glioma Low Grade, HNSC[Head and Neck squamous cell carcinoma], KICH[Kidney Chromophobe], KIRC[Kidney renal clear cell carcinoma], KIRP[Kidney renal papillary cell carcinoma], LAML[Acute Myeloid Leukemia], LUAD[Lung adenocarcinoma], LUSC[Lung squamous cell carcinoma], OV[Ovarian serous cystadenocarcinoma ], PAAD[Pancreatic adenocarcinoma], PRAD[Prostate adenocarcinoma], SKCM[Skin Cutaneous Melanoma], STAD[Stomach adenocarcinoma], THCA[Thyroid carcinoma], UCEC[Uterine Corpus Endometrial Carcinoma] |
| Top |
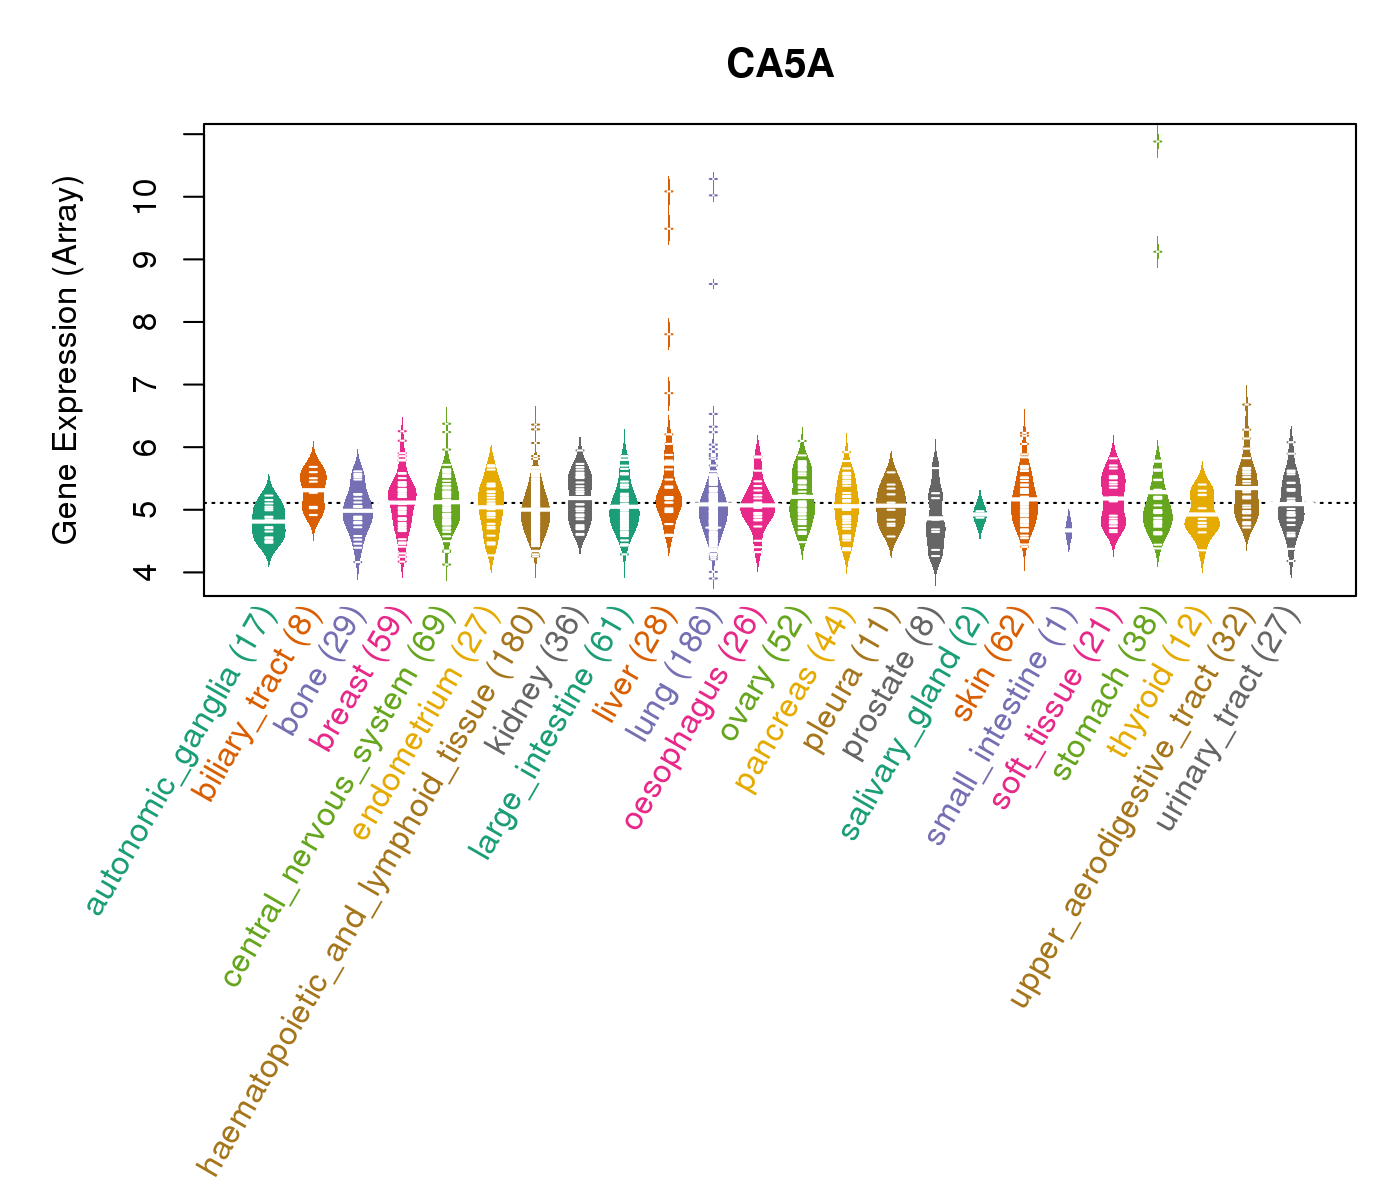
| Gene Expression for CA5A |
| * CCLE gene expression data were extracted from CCLE_Expression_Entrez_2012-10-18.res: Gene-centric RMA-normalized mRNA expression data. |
 |
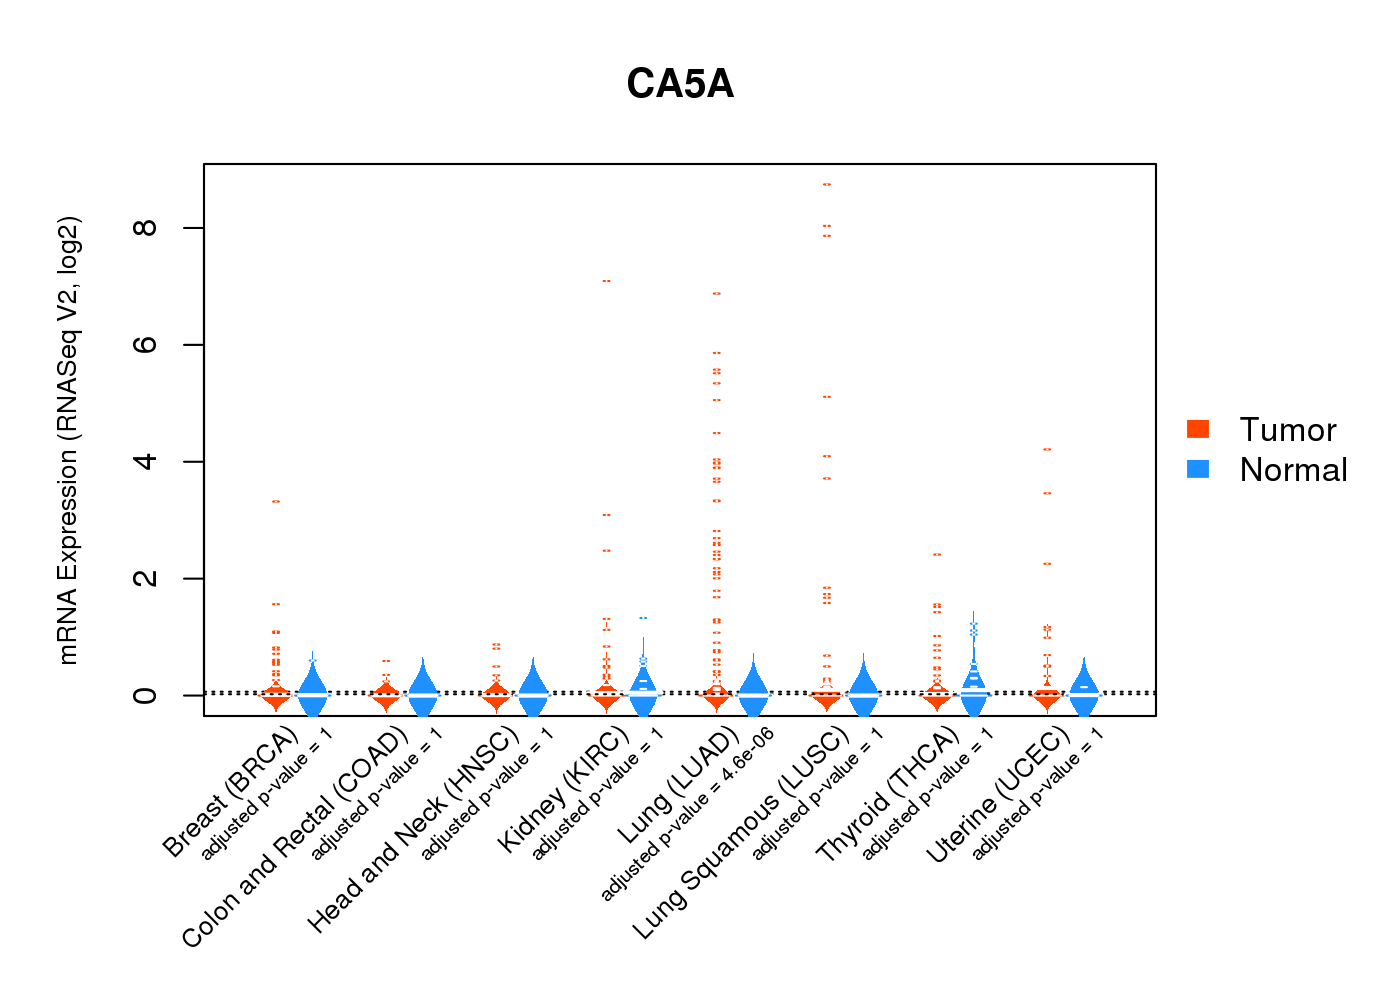
| * Normalized gene expression data of RNASeqV2 was extracted from TCGA using R package TCGA-Assembler. The URLs of all public data files on TCGA DCC data server were gathered at Jan-05-2015. Only eight cancer types have enough normal control samples for differential expression analysis. (t test, adjusted p<0.05 (using Benjamini-Hochberg FDR)) |
 |
| Top |
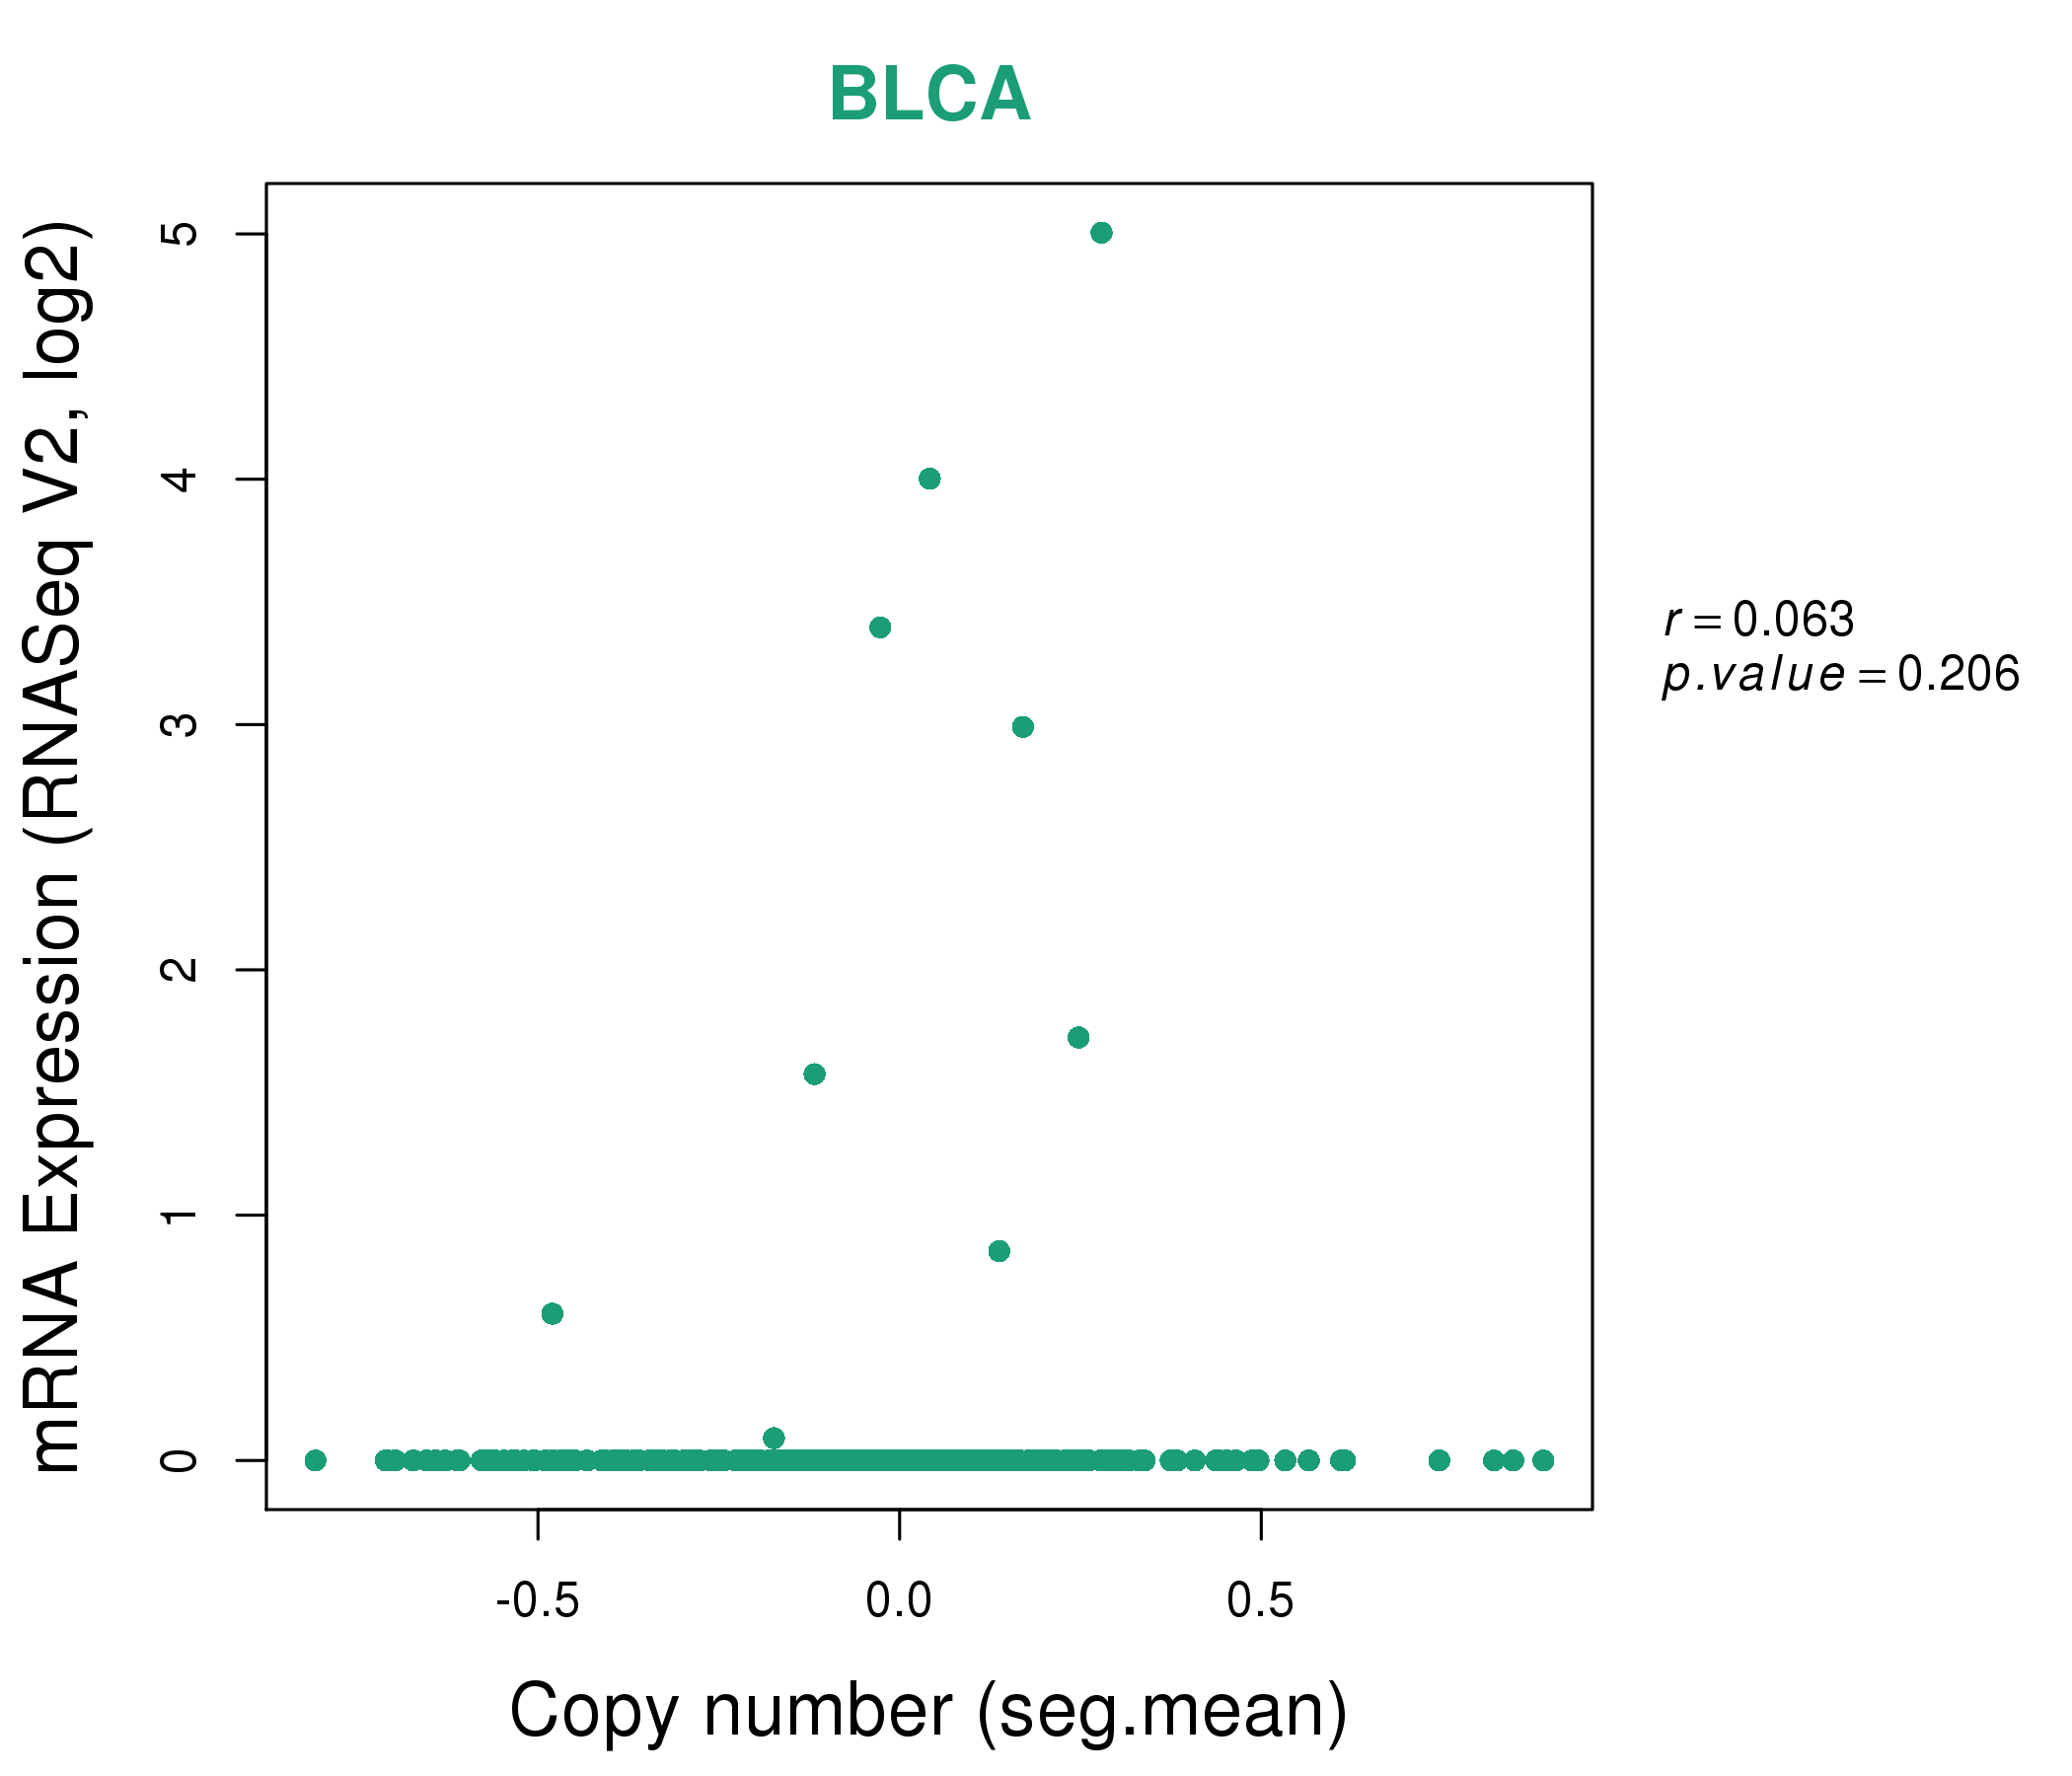
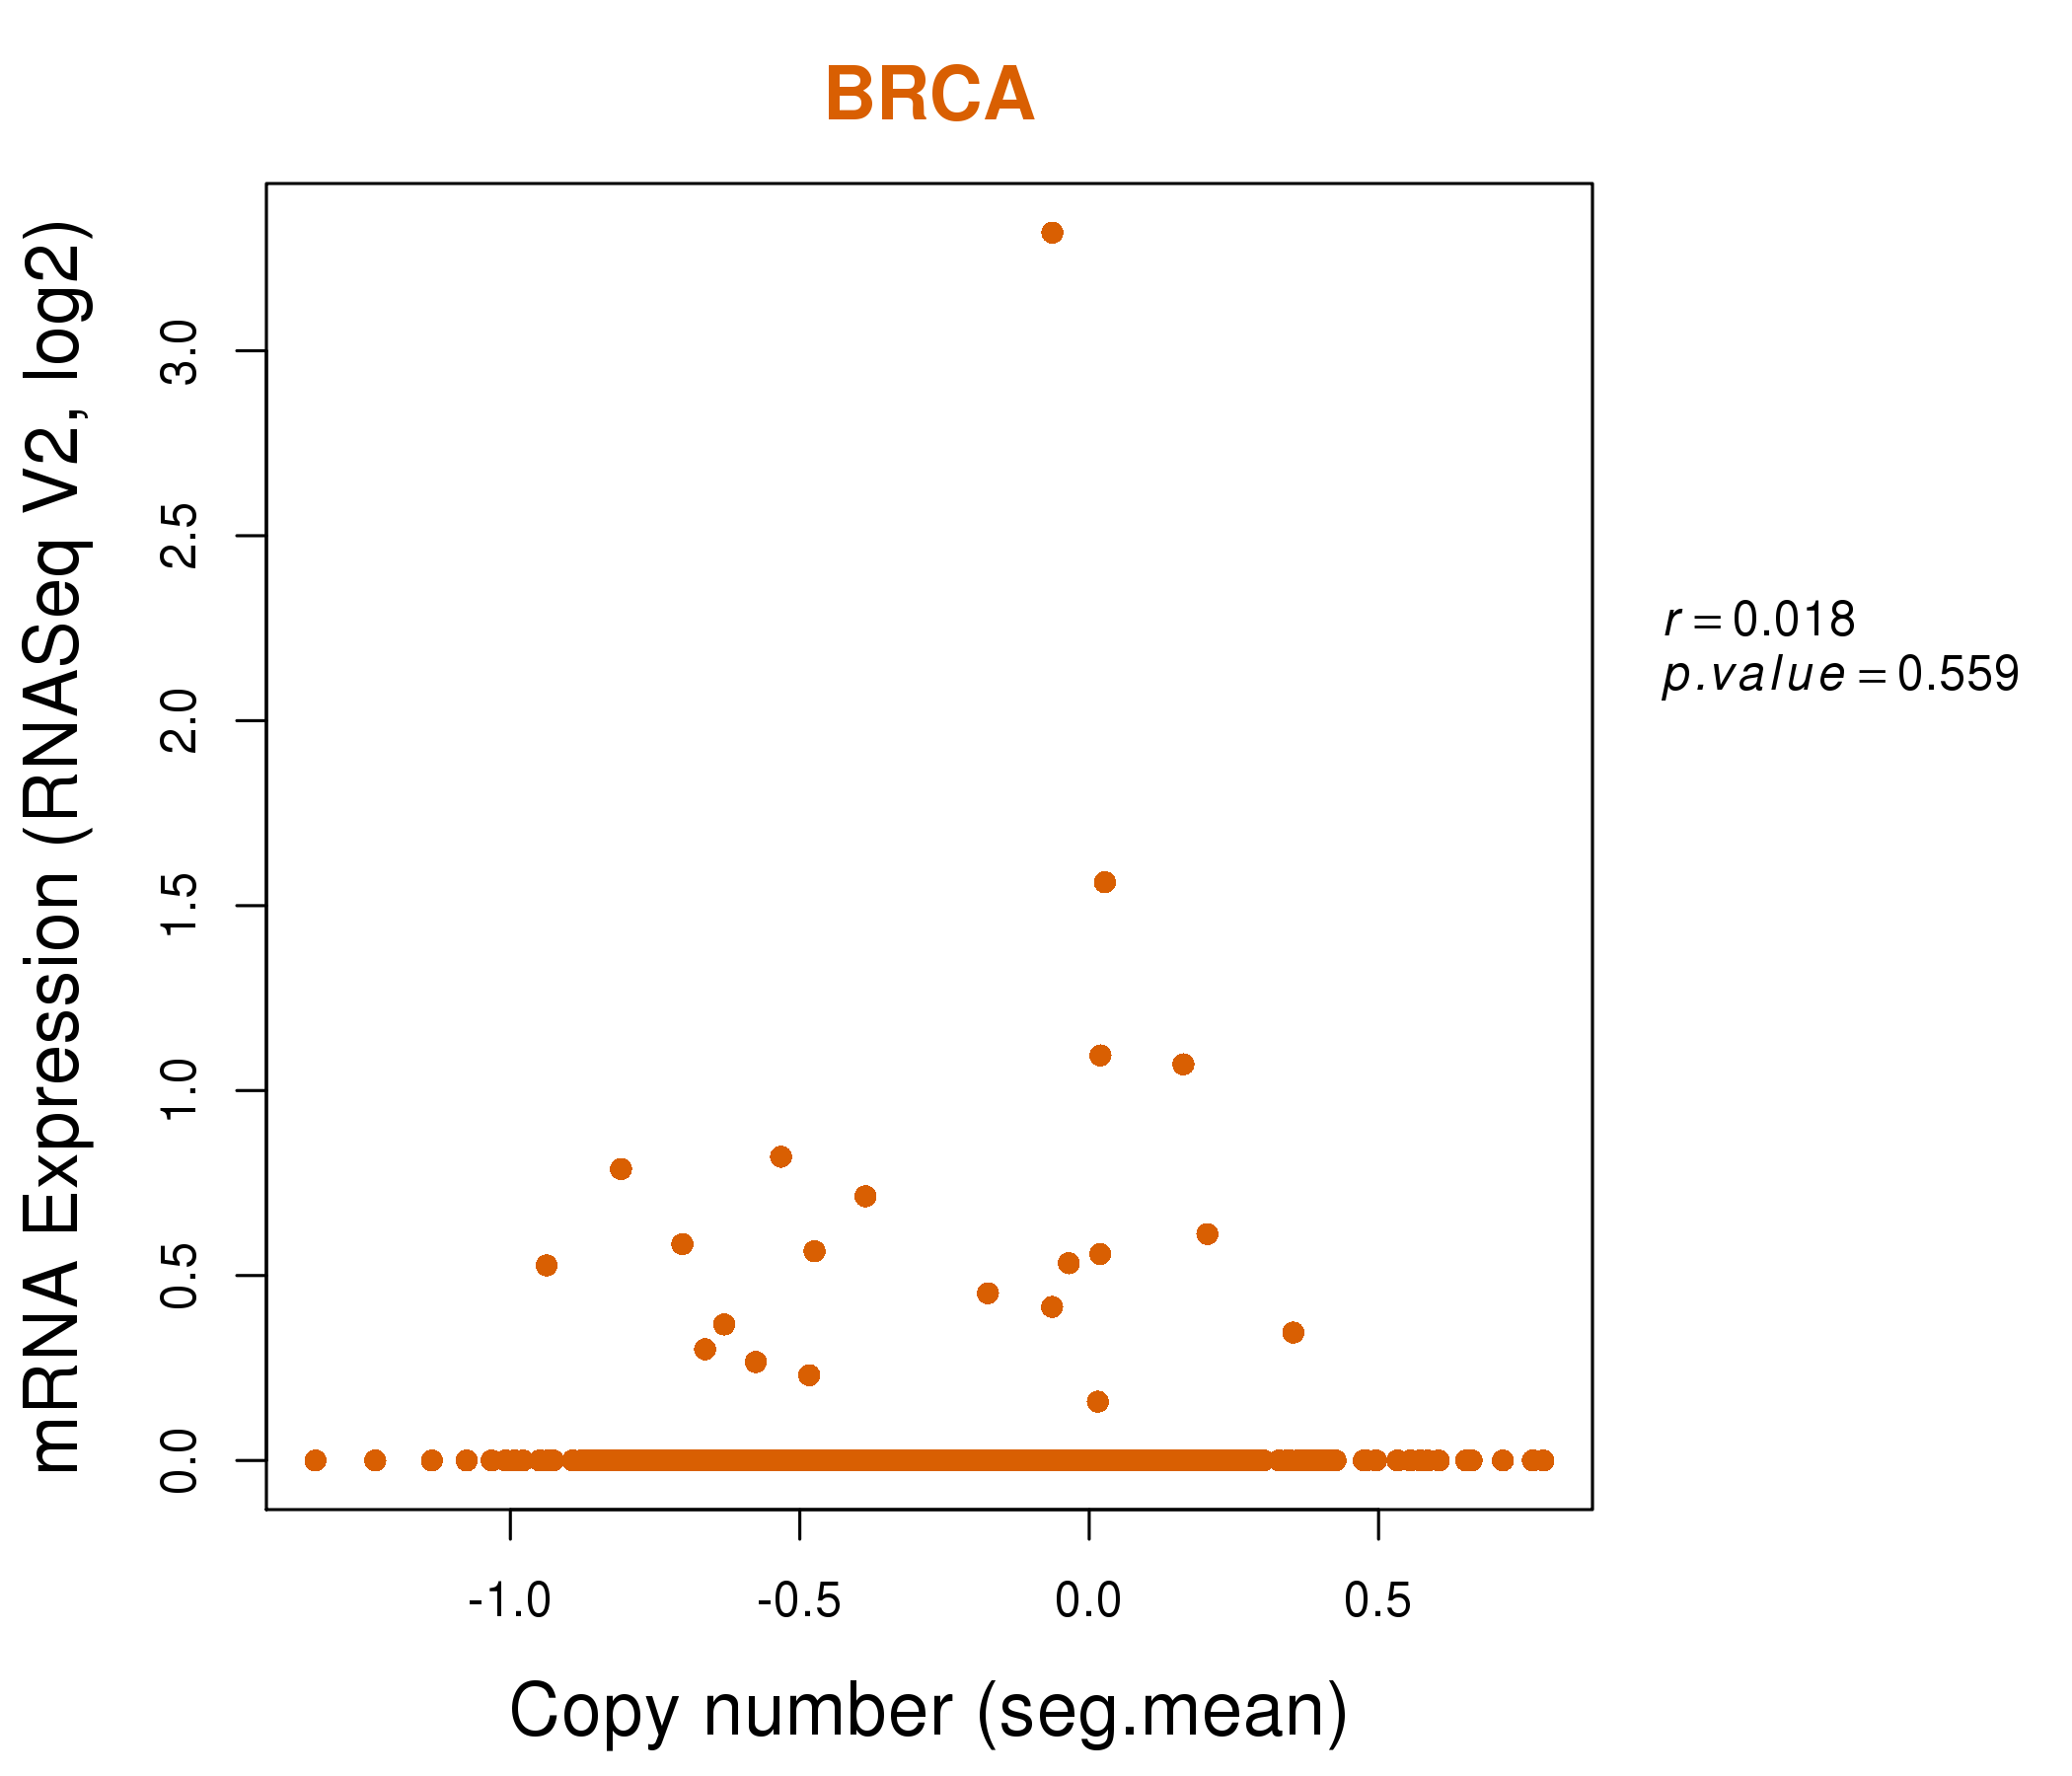
| * This plots show the correlation between CNV and gene expression. |
: Open all plots for all cancer types
 |
|
 |
|

| Top |
| Gene-Gene Network Information |
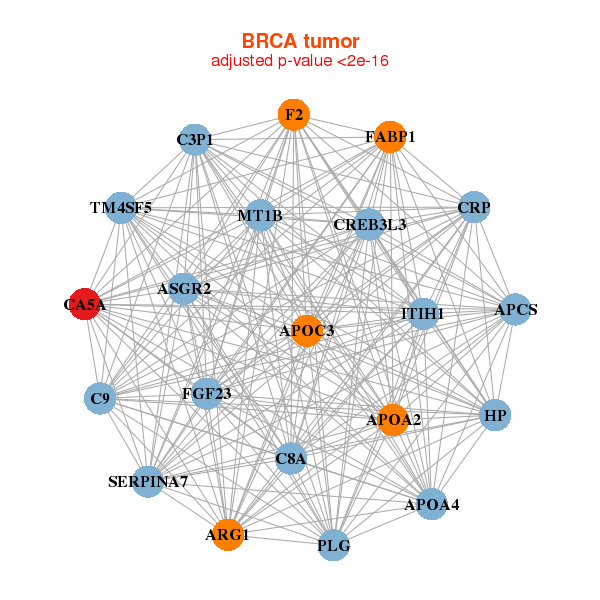
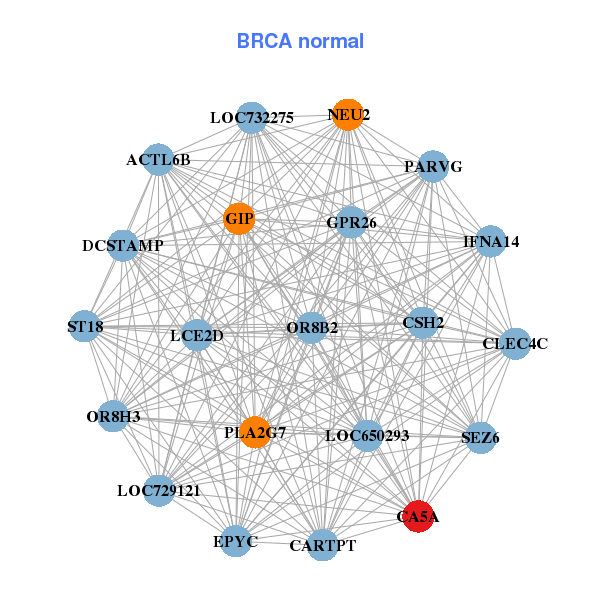
| * Co-Expression network figures were drawn using R package igraph. Only the top 20 genes with the highest correlations were shown. Red circle: input gene, orange circle: cell metabolism gene, sky circle: other gene |
: Open all plots for all cancer types
 |
| ||||
| APCS,APOA2,APOA4,APOC3,ARG1,ASGR2,C3P1, C8A,C9,CA5A,CREB3L3,CRP,F2,FABP1, FGF23,HP,ITIH1,MT1B,PLG,SERPINA7,TM4SF5 | ACTL6B,CA5A,CARTPT,CLEC4C,CSH2,EPYC,GIP, GPR26,IFNA14,LCE2D,LOC650293,LOC729121,LOC732275,NEU2, OR8B2,OR8H3,PARVG,PLA2G7,SEZ6,ST18,DCSTAMP | ||||
 |
| ||||
| ADAMTS20,CA5A,CSN3,CT47A1,DPPA2,DSCR8,FTHL17, GABRG2,GCG,ITGA2B,KCNH5,KREMEN2,MT1H,LINC00052, PLCZ1,PLG,SLC24A2,SPANXD,TAC3,TPTE,XAGE2 | ALOX15B,ANTXRL,C15orf43,CA5A,HIST1H1A,ITGA10,KCNS2, LOC731789,LY6K,MC3R,MYH13,OR10J3,OR1L6,PSCA, SDHAP2,SIGLEC8,SLC22A8,SNORA71D,SP9,T |
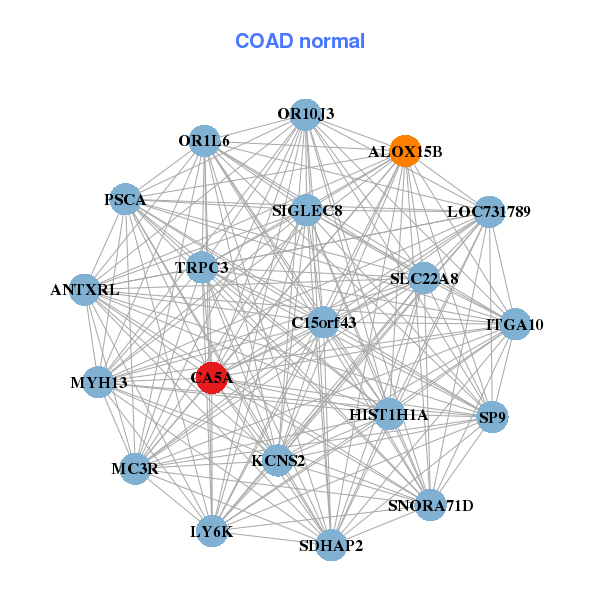
| * Co-Expression network figures were drawn using R package igraph. Only the top 20 genes with the highest correlations were shown. Red circle: input gene, orange circle: cell metabolism gene, sky circle: other gene |
: Open all plots for all cancer types
| Top |
: Open all interacting genes' information including KEGG pathway for all interacting genes from DAVID
| Top |
| Pharmacological Information for CA5A |
| DB Category | DB Name | DB's ID and Url link |
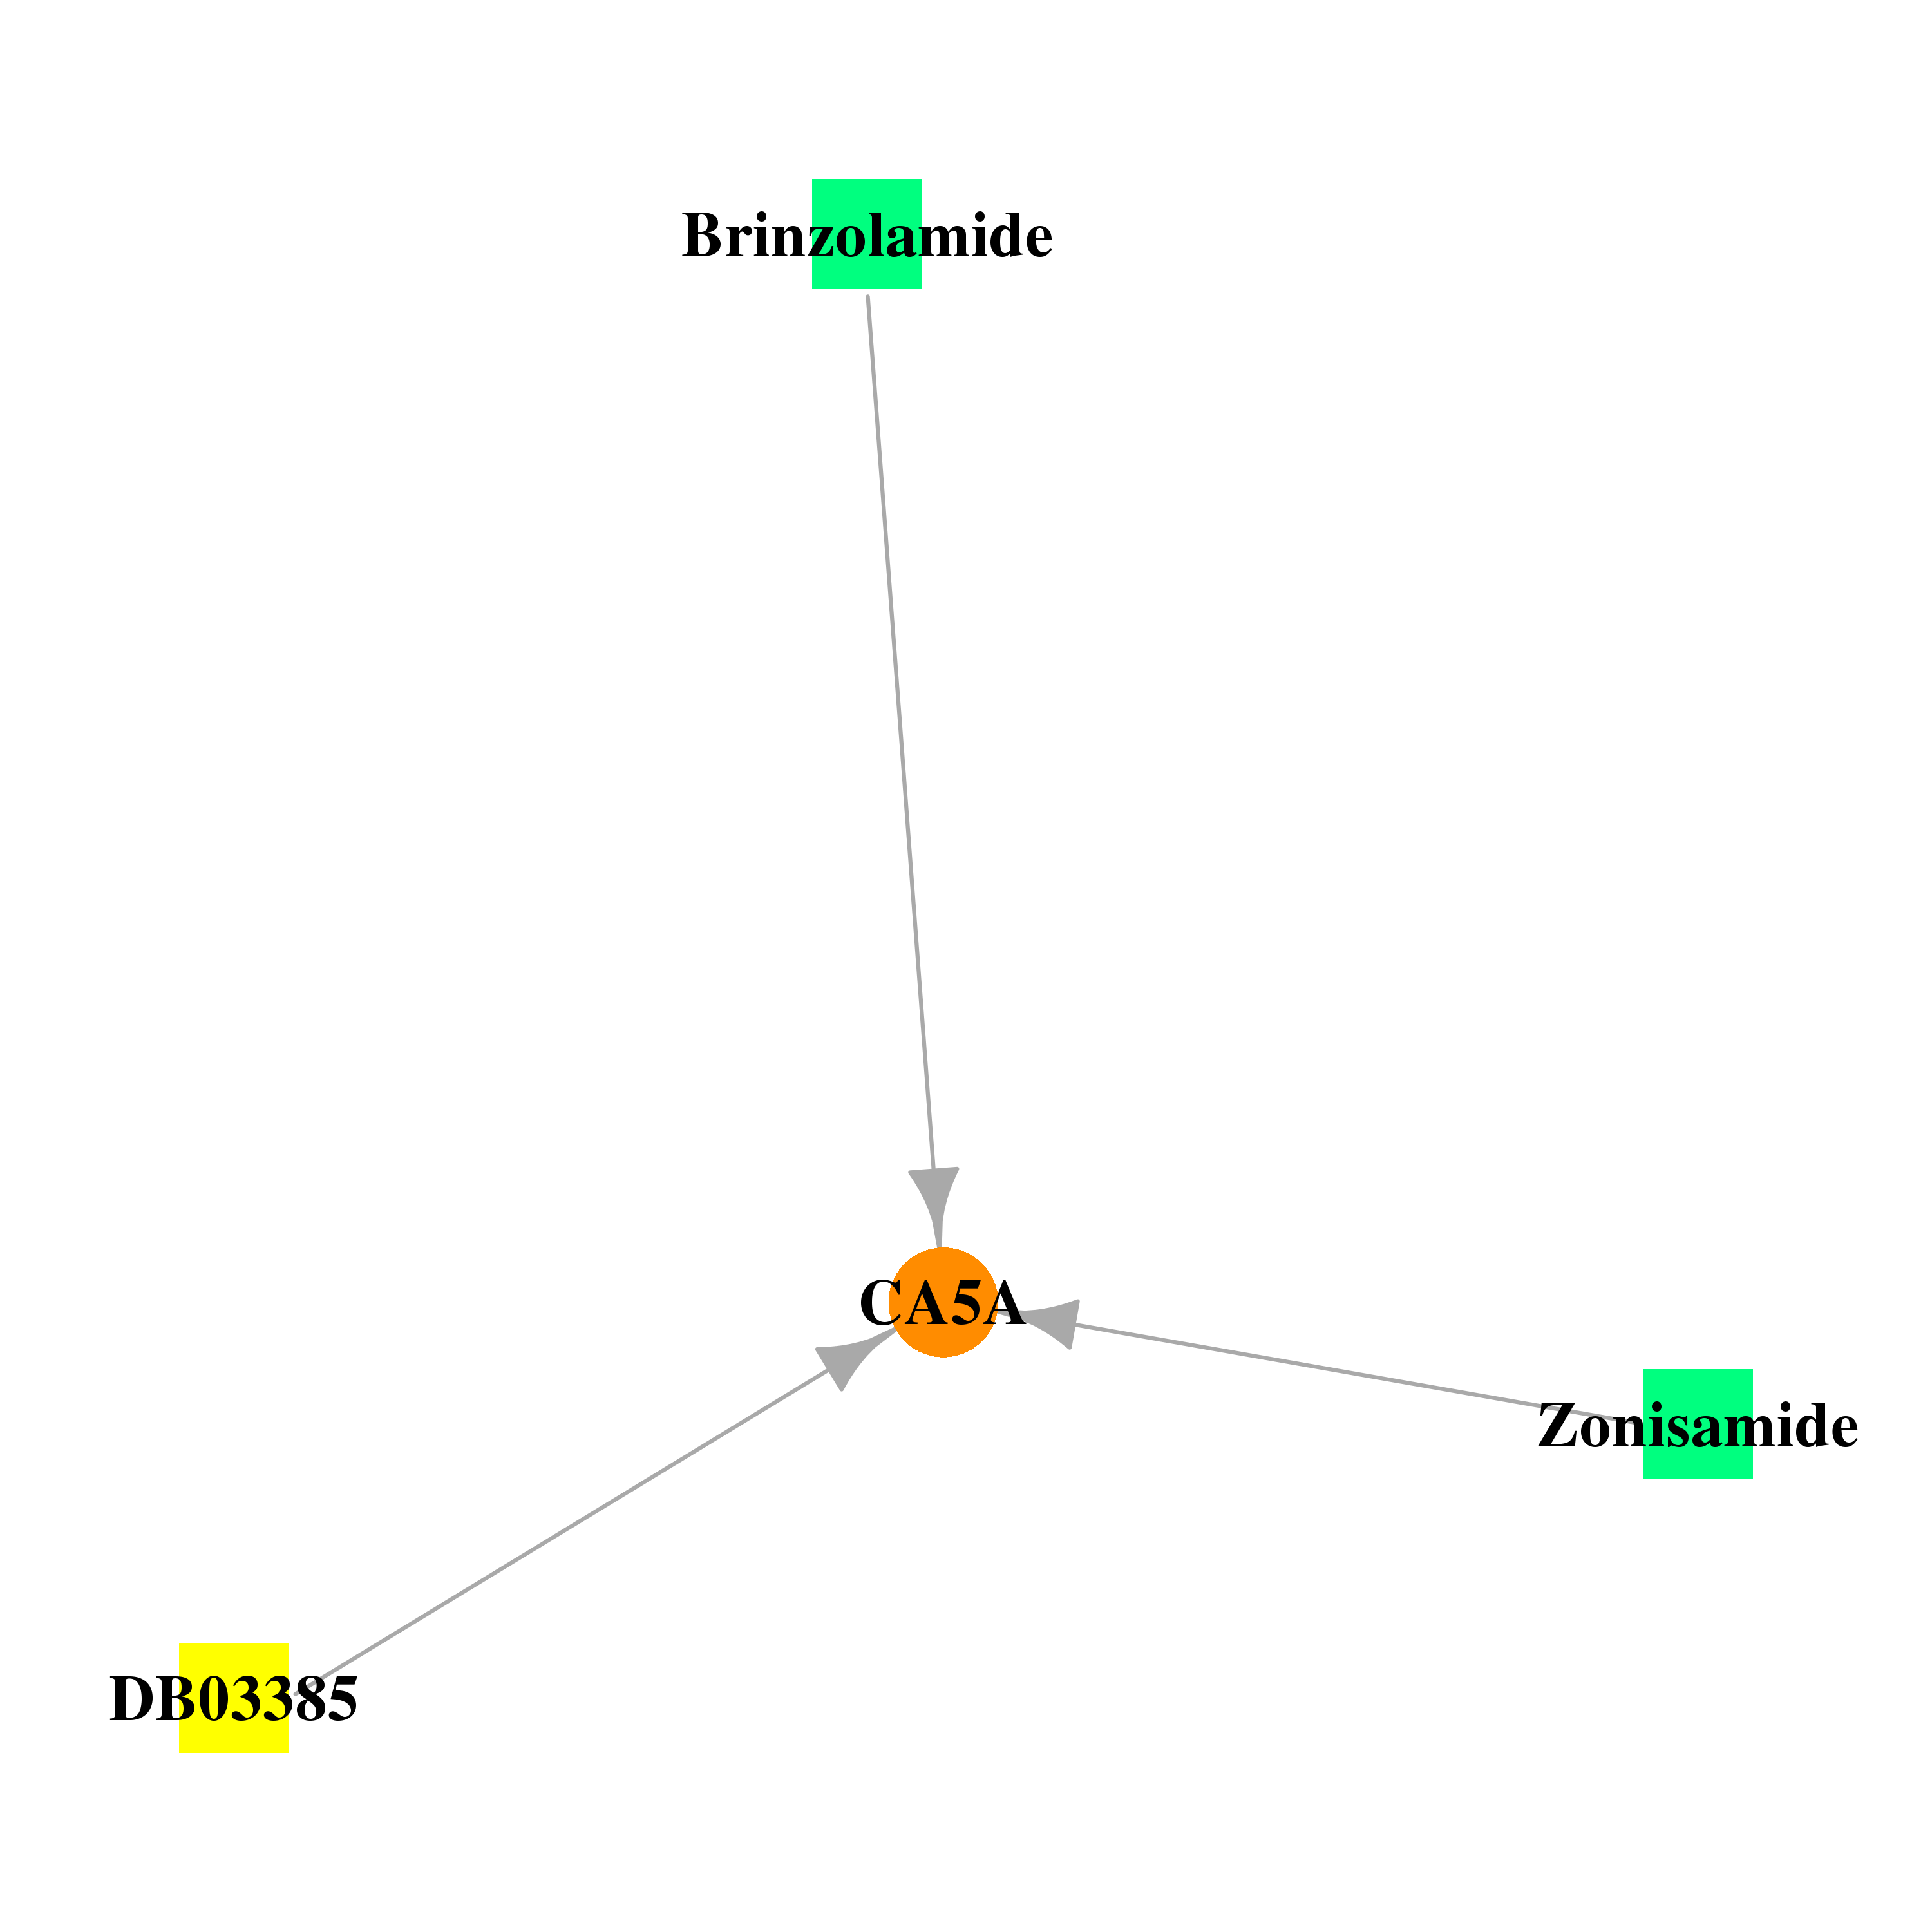
| * Gene Centered Interaction Network. |
 |
| * Drug Centered Interaction Network. |
| DrugBank ID | Target Name | Drug Groups | Generic Name | Drug Centered Network | Drug Structure |
| DB00909 | carbonic anhydrase VA, mitochondrial | approved; investigational | Zonisamide | 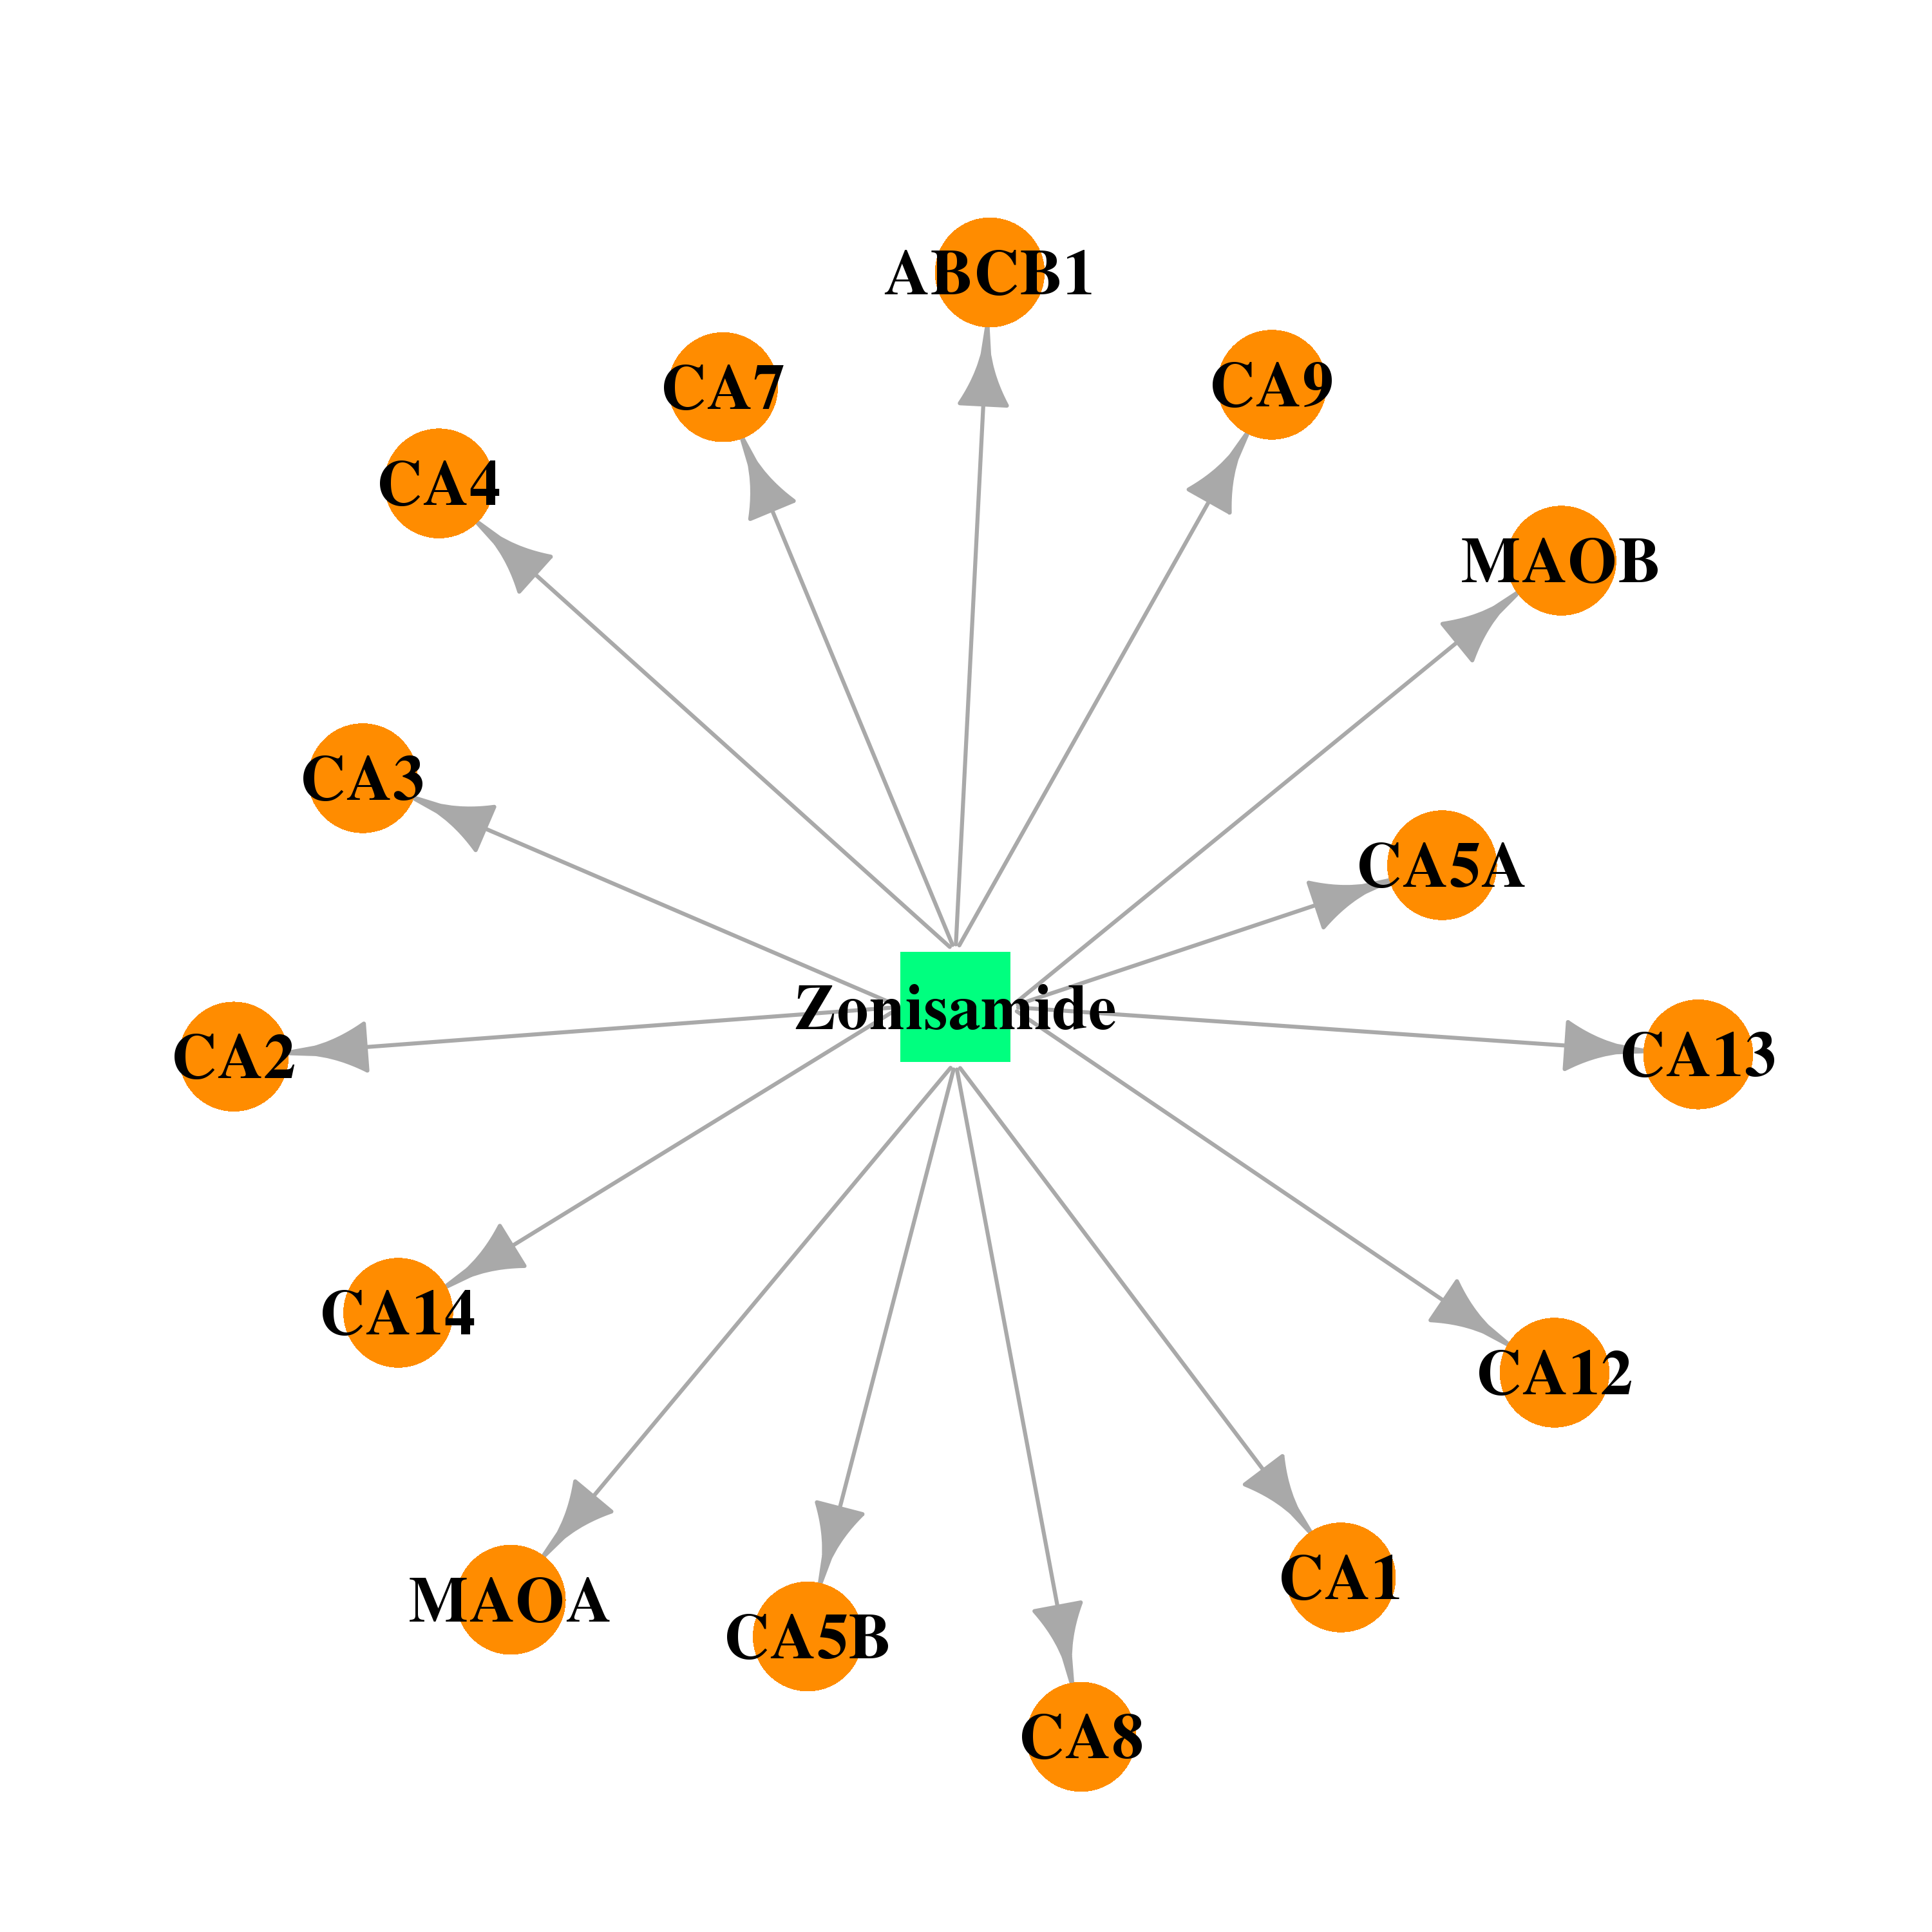 |  |
| DB01194 | carbonic anhydrase VA, mitochondrial | approved | Brinzolamide |  | 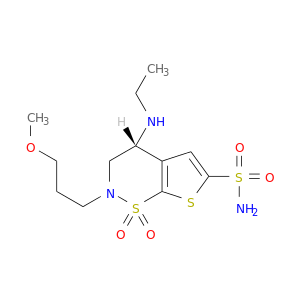 |
| DB03385 | carbonic anhydrase VA, mitochondrial | experimental | 4-Methylimidazole | 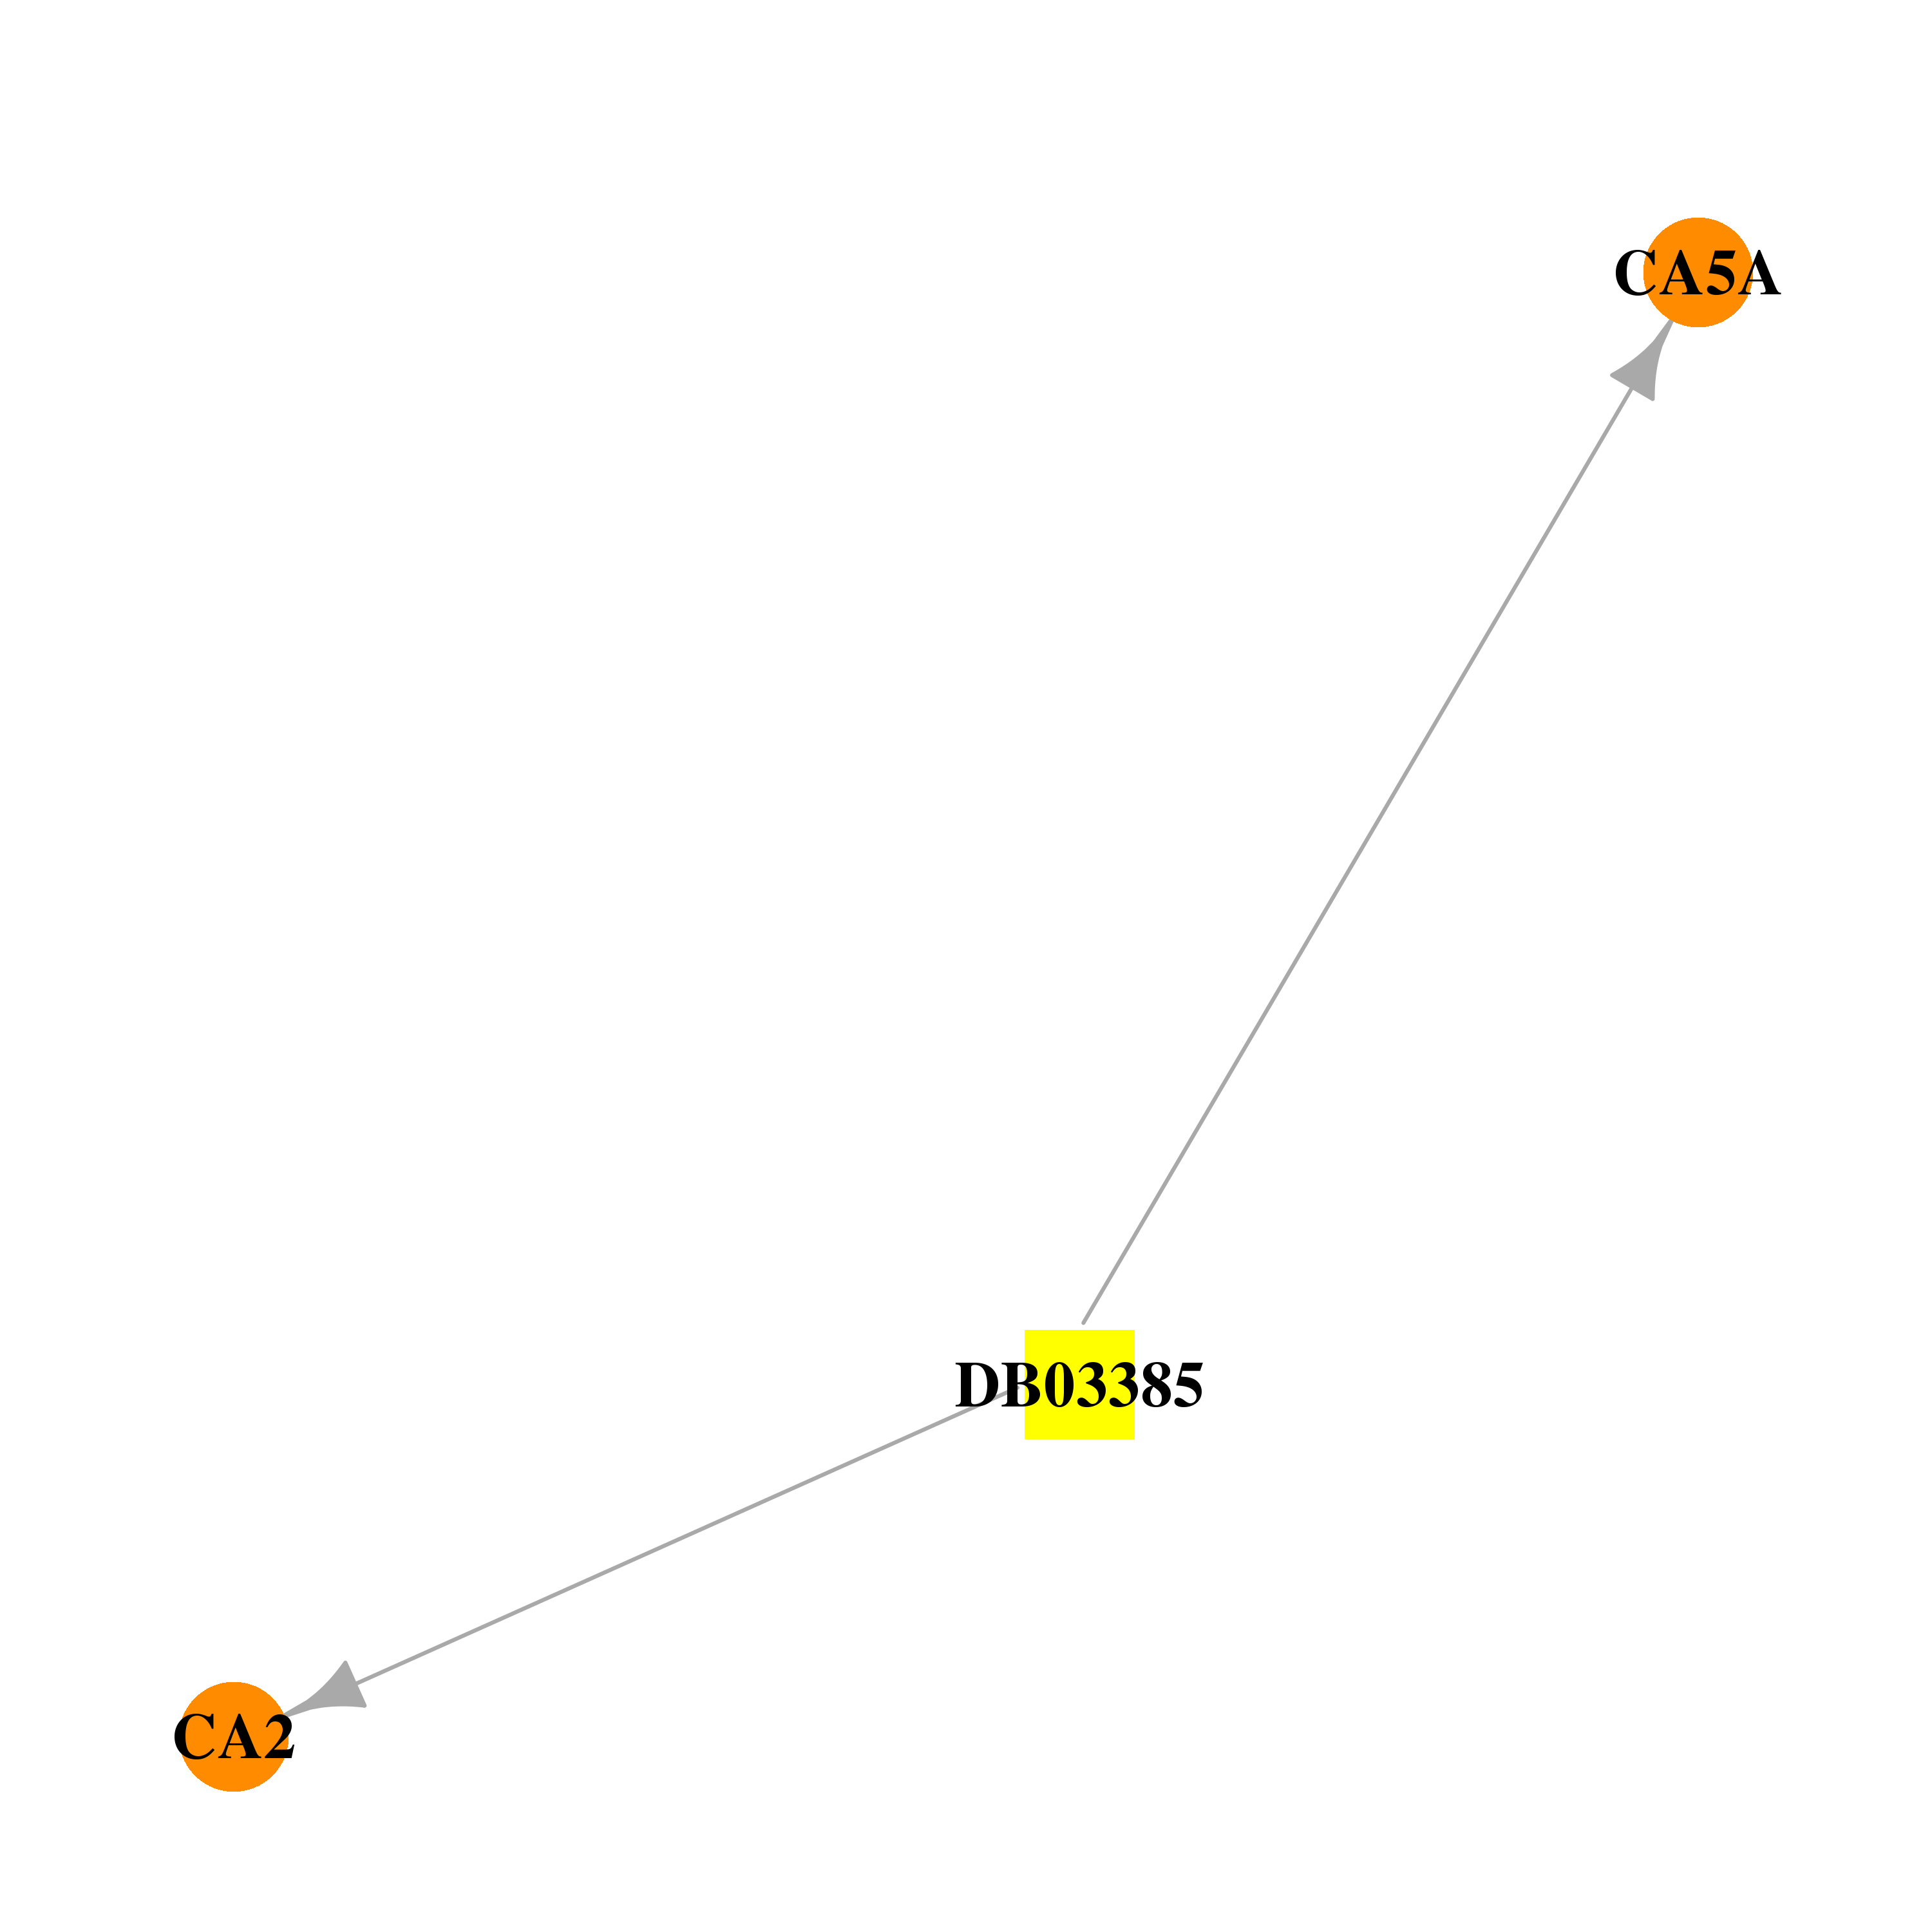 | 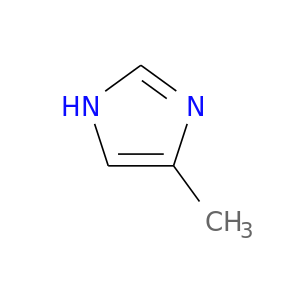 |
| Top |
| Cross referenced IDs for CA5A |
| * We obtained these cross-references from Uniprot database. It covers 150 different DBs, 18 categories. http://www.uniprot.org/help/cross_references_section |
: Open all cross reference information
|
Copyright © 2016-Present - The Univsersity of Texas Health Science Center at Houston @ |