|
|||||||||||||||||||||||||||||||||||||||||||||||||||||||||||||||||||||||||||||||||||||||||||||||||||||||||||||||||||||||||||||||||||||||||||||||||||||||||||||||||||||||||||||||||||||||||||||||||||||||||||||||||||||||||||||||||||||||||||||||||||||||||||||||||||||||||||||||||||||||||||||||||||||||||||||||||||||||||||||||||||||||||||||
| |
| Phenotypic Information (metabolism pathway, cancer, disease, phenome) |
| |
| |
| Gene-Gene Network Information: Co-Expression Network, Interacting Genes & KEGG |
| |
|


| Gene Summary for CA8 |
| Basic gene info. | Gene symbol | CA8 |
| Gene name | carbonic anhydrase VIII | |
| Synonyms | CA-VIII|CALS|CAMRQ3|CARP | |
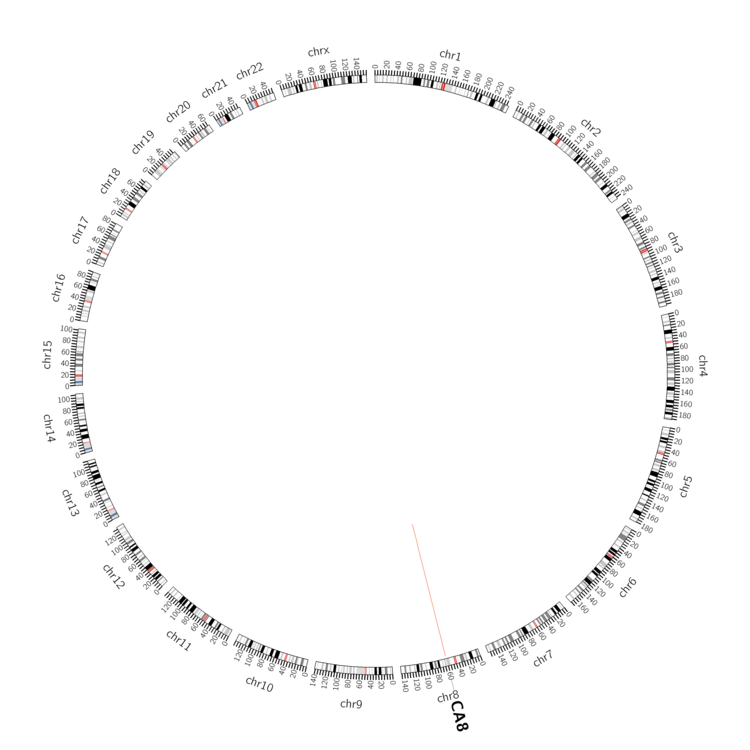
| Cytomap | UCSC genome browser: 8q12.1 | |
| Genomic location | chr8 :61101422-61193954 | |
| Type of gene | protein-coding | |
| RefGenes | NM_004056.4, | |
| Ensembl id | ENSG00000178538 | |
| Description | CA-related proteincarbonate dehydratasecarbonic anhydrase-like sequencecarbonic anhydrase-related protein | |
| Modification date | 20141207 | |
| dbXrefs | MIM : 114815 | |
| HGNC : HGNC | ||
| HPRD : 00266 | ||
| Protein | UniProt: go to UniProt's Cross Reference DB Table | |
| Expression | CleanEX: HS_CA8 | |
| BioGPS: 767 | ||
| Gene Expression Atlas: ENSG00000178538 | ||
| The Human Protein Atlas: ENSG00000178538 | ||
| Pathway | NCI Pathway Interaction Database: CA8 | |
| KEGG: CA8 | ||
| REACTOME: CA8 | ||
| ConsensusPathDB | ||
| Pathway Commons: CA8 | ||
| Metabolism | MetaCyc: CA8 | |
| HUMANCyc: CA8 | ||
| Regulation | Ensembl's Regulation: ENSG00000178538 | |
| miRBase: chr8 :61,101,422-61,193,954 | ||
| TargetScan: NM_004056 | ||
| cisRED: ENSG00000178538 | ||
| Context | iHOP: CA8 | |
| cancer metabolism search in PubMed: CA8 | ||
| UCL Cancer Institute: CA8 | ||
| Assigned class in ccmGDB | C | |
| Top |
| Phenotypic Information for CA8(metabolism pathway, cancer, disease, phenome) |
| Cancer | CGAP: CA8 |
| Familial Cancer Database: CA8 | |
| * This gene is included in those cancer gene databases. |
|
|
|
|
|
| . | |||||||||||||||||||||||||||||||||||||||||||||||||||||||||||||||||||||||||||||||||||||||||||||||||||||||||||||||||||||||||||||||||||||||||||||||||||||||||||||||||||||||||||||||||||||||||||||||||||||||||||||||||||||||||||||||||||||||||||||||||||||||||||||||||||||||||||||||||||||||||||||||||||||||||||||||||||||||||||||||||||||||
Oncogene 1 | Significant driver gene in | ||||||||||||||||||||||||||||||||||||||||||||||||||||||||||||||||||||||||||||||||||||||||||||||||||||||||||||||||||||||||||||||||||||||||||||||||||||||||||||||||||||||||||||||||||||||||||||||||||||||||||||||||||||||||||||||||||||||||||||||||||||||||||||||||||||||||||||||||||||||||||||||||||||||||||||||||||||||||||||||||||||||||||||
| cf) number; DB name 1 Oncogene; http://nar.oxfordjournals.org/content/35/suppl_1/D721.long, 2 Tumor Suppressor gene; https://bioinfo.uth.edu/TSGene/, 3 Cancer Gene Census; http://www.nature.com/nrc/journal/v4/n3/abs/nrc1299.html, 4 CancerGenes; http://nar.oxfordjournals.org/content/35/suppl_1/D721.long, 5 Network of Cancer Gene; http://ncg.kcl.ac.uk/index.php, 1Therapeutic Vulnerabilities in Cancer; http://cbio.mskcc.org/cancergenomics/statius/ |
| KEGG_NITROGEN_METABOLISM | |
| OMIM | |
| Orphanet | |
| Disease | KEGG Disease: CA8 |
| MedGen: CA8 (Human Medical Genetics with Condition) | |
| ClinVar: CA8 | |
| Phenotype | MGI: CA8 (International Mouse Phenotyping Consortium) |
| PhenomicDB: CA8 | |
| Mutations for CA8 |
| * Under tables are showing count per each tissue to give us broad intuition about tissue specific mutation patterns.You can go to the detailed page for each mutation database's web site. |
| - Statistics for Tissue and Mutation type | Top |
 |
| - For Inter-chromosomal Variations |
| There's no inter-chromosomal structural variation. |
| - For Intra-chromosomal Variations |
| * Intra-chromosomal variantions includes 'intrachromosomal amplicon to amplicon', 'intrachromosomal amplicon to non-amplified dna', 'intrachromosomal deletion', 'intrachromosomal fold-back inversion', 'intrachromosomal inversion', 'intrachromosomal tandem duplication', 'Intrachromosomal unknown type', 'intrachromosomal with inverted orientation', 'intrachromosomal with non-inverted orientation'. |
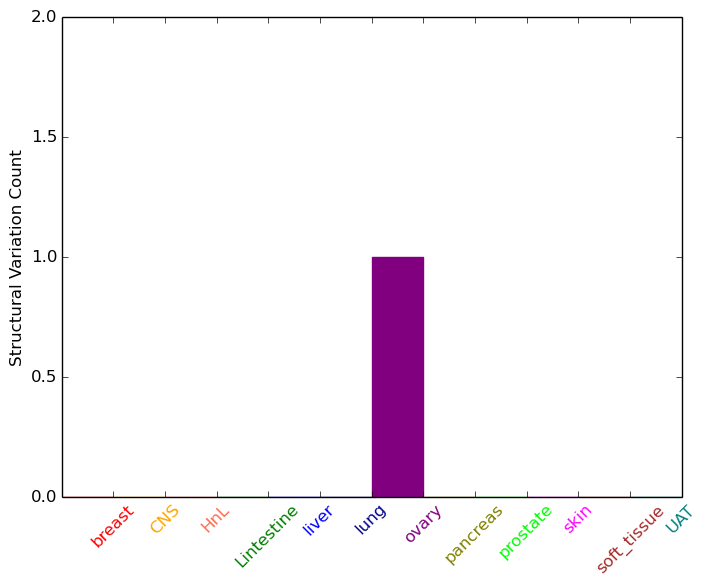 |
| Sample | Symbol_a | Chr_a | Start_a | End_a | Symbol_b | Chr_b | Start_b | End_b |
| ovary | CA8 | chr8 | 61180611 | 61180631 | CA8 | chr8 | 61180700 | 61180720 |
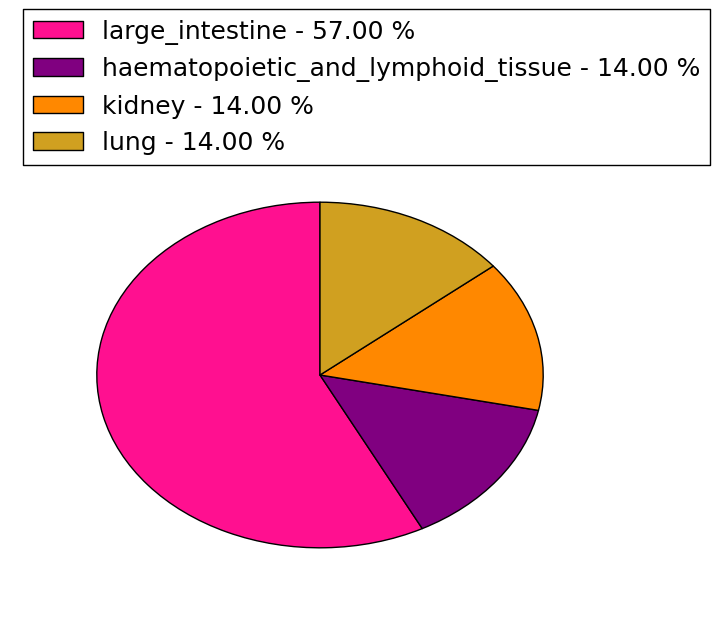
| cf) Tissue number; Tissue name (1;Breast, 2;Central_nervous_system, 3;Haematopoietic_and_lymphoid_tissue, 4;Large_intestine, 5;Liver, 6;Lung, 7;Ovary, 8;Pancreas, 9;Prostate, 10;Skin, 11;Soft_tissue, 12;Upper_aerodigestive_tract) |
| * From mRNA Sanger sequences, Chitars2.0 arranged chimeric transcripts. This table shows CA8 related fusion information. |
| ID | Head Gene | Tail Gene | Accession | Gene_a | qStart_a | qEnd_a | Chromosome_a | tStart_a | tEnd_a | Gene_a | qStart_a | qEnd_a | Chromosome_a | tStart_a | tEnd_a |
| DA070111 | CA8 | 1 | 51 | 8 | 61193904 | 61193954 | CORO2B | 51 | 578 | 15 | 68987546 | 69006943 | |
| Top |
| Mutation type/ Tissue ID | brca | cns | cerv | endome | haematopo | kidn | Lintest | liver | lung | ns | ovary | pancre | prost | skin | stoma | thyro | urina | |||
| Total # sample | 5 | 1 | 1 | 1 | ||||||||||||||||
| GAIN (# sample) | 5 | 1 | 1 | 1 | ||||||||||||||||
| LOSS (# sample) |
| cf) Tissue ID; Tissue type (1; Breast, 2; Central_nervous_system, 3; Cervix, 4; Endometrium, 5; Haematopoietic_and_lymphoid_tissue, 6; Kidney, 7; Large_intestine, 8; Liver, 9; Lung, 10; NS, 11; Ovary, 12; Pancreas, 13; Prostate, 14; Skin, 15; Stomach, 16; Thyroid, 17; Urinary_tract) |
| Top |
|
 |
| Top |
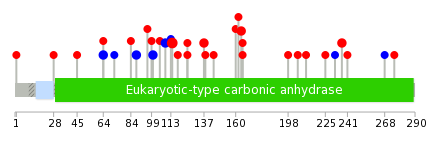
| Stat. for Non-Synonymous SNVs (# total SNVs=24) | (# total SNVs=7) |
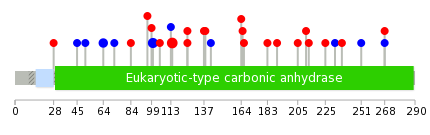
 |  |
(# total SNVs=0) | (# total SNVs=0) |
| Top |
| * When you move the cursor on each content, you can see more deailed mutation information on the Tooltip. Those are primary_site,primary_histology,mutation(aa),pubmedID. |
| GRCh37 position | Mutation(aa) | Unique sampleID count |
| chr8:61178561-61178561 | p.E114K | 4 |
| chr8:61178601-61178601 | p.S100S | 2 |
| chr8:61178492-61178492 | p.P137S | 2 |
| chr8:61192276-61192276 | p.T88T | 2 |
| chr8:61192348-61192348 | p.S64S | 2 |
| chr8:61135236-61135236 | p.R237Q | 2 |
| chr8:61144866-61144866 | p.A164T | 2 |
| chr8:61144872-61144872 | p.G162* | 2 |
| chr8:61178574-61178574 | p.E109E | 2 |
| chr8:61144878-61144878 | p.P160S | 1 |
| Top |
|
 |
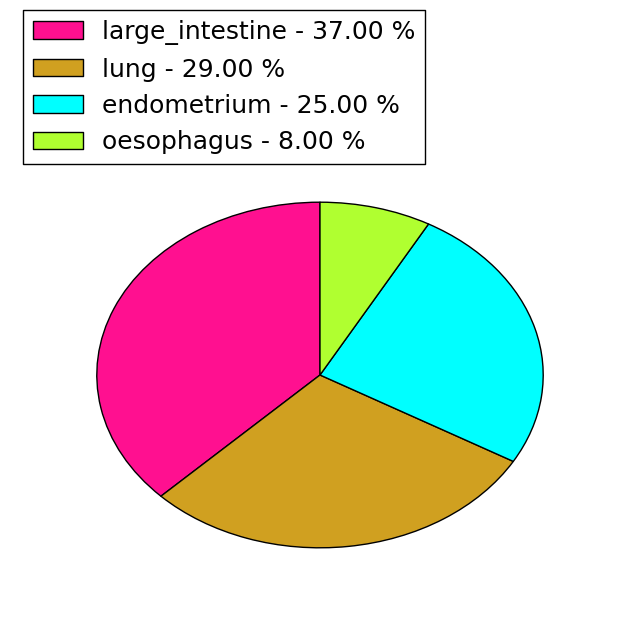
| Point Mutation/ Tissue ID | 1 | 2 | 3 | 4 | 5 | 6 | 7 | 8 | 9 | 10 | 11 | 12 | 13 | 14 | 15 | 16 | 17 | 18 | 19 | 20 |
| # sample | 8 | 4 | 1 | 5 | 1 | 1 | 2 | 6 | 4 | 5 | ||||||||||
| # mutation | 7 | 4 | 1 | 5 | 1 | 1 | 2 | 6 | 4 | 4 | ||||||||||
| nonsynonymous SNV | 5 | 3 | 3 | 1 | 2 | 4 | 1 | 4 | ||||||||||||
| synonymous SNV | 2 | 1 | 1 | 2 | 1 | 2 | 3 |
| cf) Tissue ID; Tissue type (1; BLCA[Bladder Urothelial Carcinoma], 2; BRCA[Breast invasive carcinoma], 3; CESC[Cervical squamous cell carcinoma and endocervical adenocarcinoma], 4; COAD[Colon adenocarcinoma], 5; GBM[Glioblastoma multiforme], 6; Glioma Low Grade, 7; HNSC[Head and Neck squamous cell carcinoma], 8; KICH[Kidney Chromophobe], 9; KIRC[Kidney renal clear cell carcinoma], 10; KIRP[Kidney renal papillary cell carcinoma], 11; LAML[Acute Myeloid Leukemia], 12; LUAD[Lung adenocarcinoma], 13; LUSC[Lung squamous cell carcinoma], 14; OV[Ovarian serous cystadenocarcinoma ], 15; PAAD[Pancreatic adenocarcinoma], 16; PRAD[Prostate adenocarcinoma], 17; SKCM[Skin Cutaneous Melanoma], 18:STAD[Stomach adenocarcinoma], 19:THCA[Thyroid carcinoma], 20:UCEC[Uterine Corpus Endometrial Carcinoma]) |
| Top |
| * We represented just top 10 SNVs. When you move the cursor on each content, you can see more deailed mutation information on the Tooltip. Those are primary_site, primary_histology, mutation(aa), pubmedID. |
| Genomic Position | Mutation(aa) | Unique sampleID count |
| chr8:61178561 | p.E114K | 4 |
| chr8:61178601 | p.S100S | 3 |
| chr8:61192348 | p.S64S | 2 |
| chr8:61178528 | p.I166T | 1 |
| chr8:61192405 | p.P51P | 1 |
| chr8:61137107 | p.I165S | 1 |
| chr8:61193624 | p.N45N | 1 |
| chr8:61139438 | p.A164T | 1 |
| chr8:61178562 | p.E28V | 1 |
| chr8:61139461 | p.L142L | 1 |
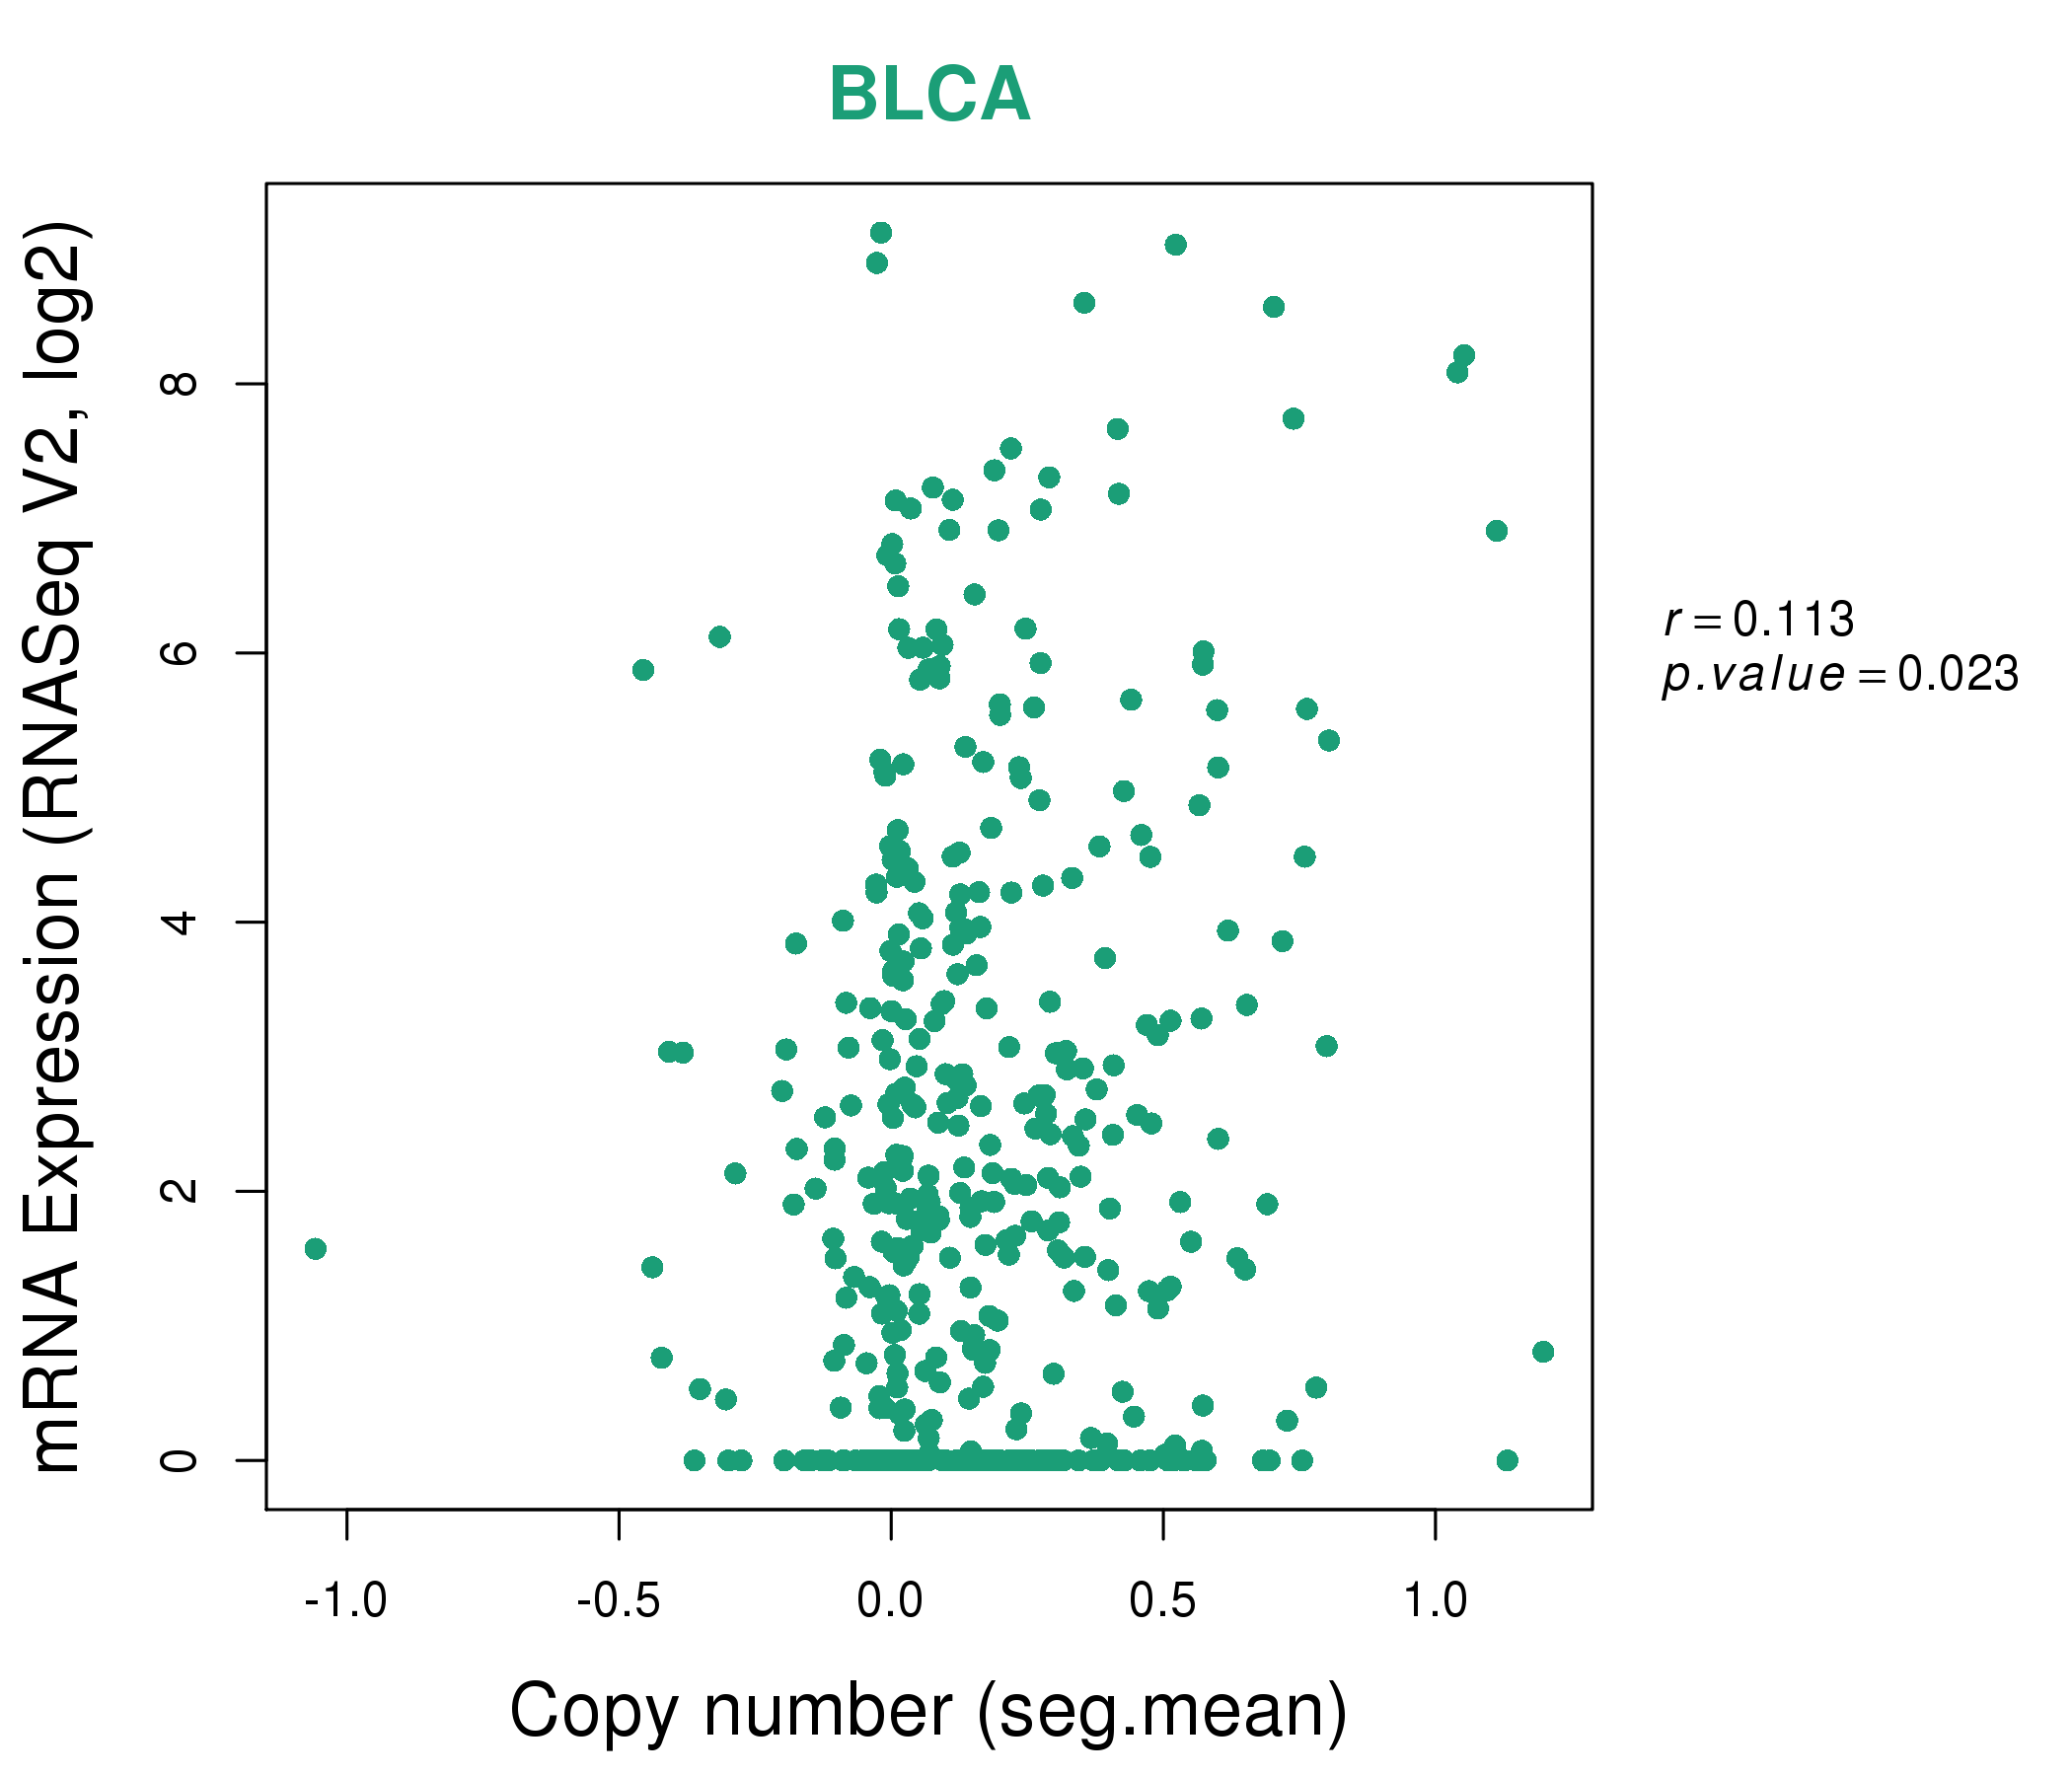
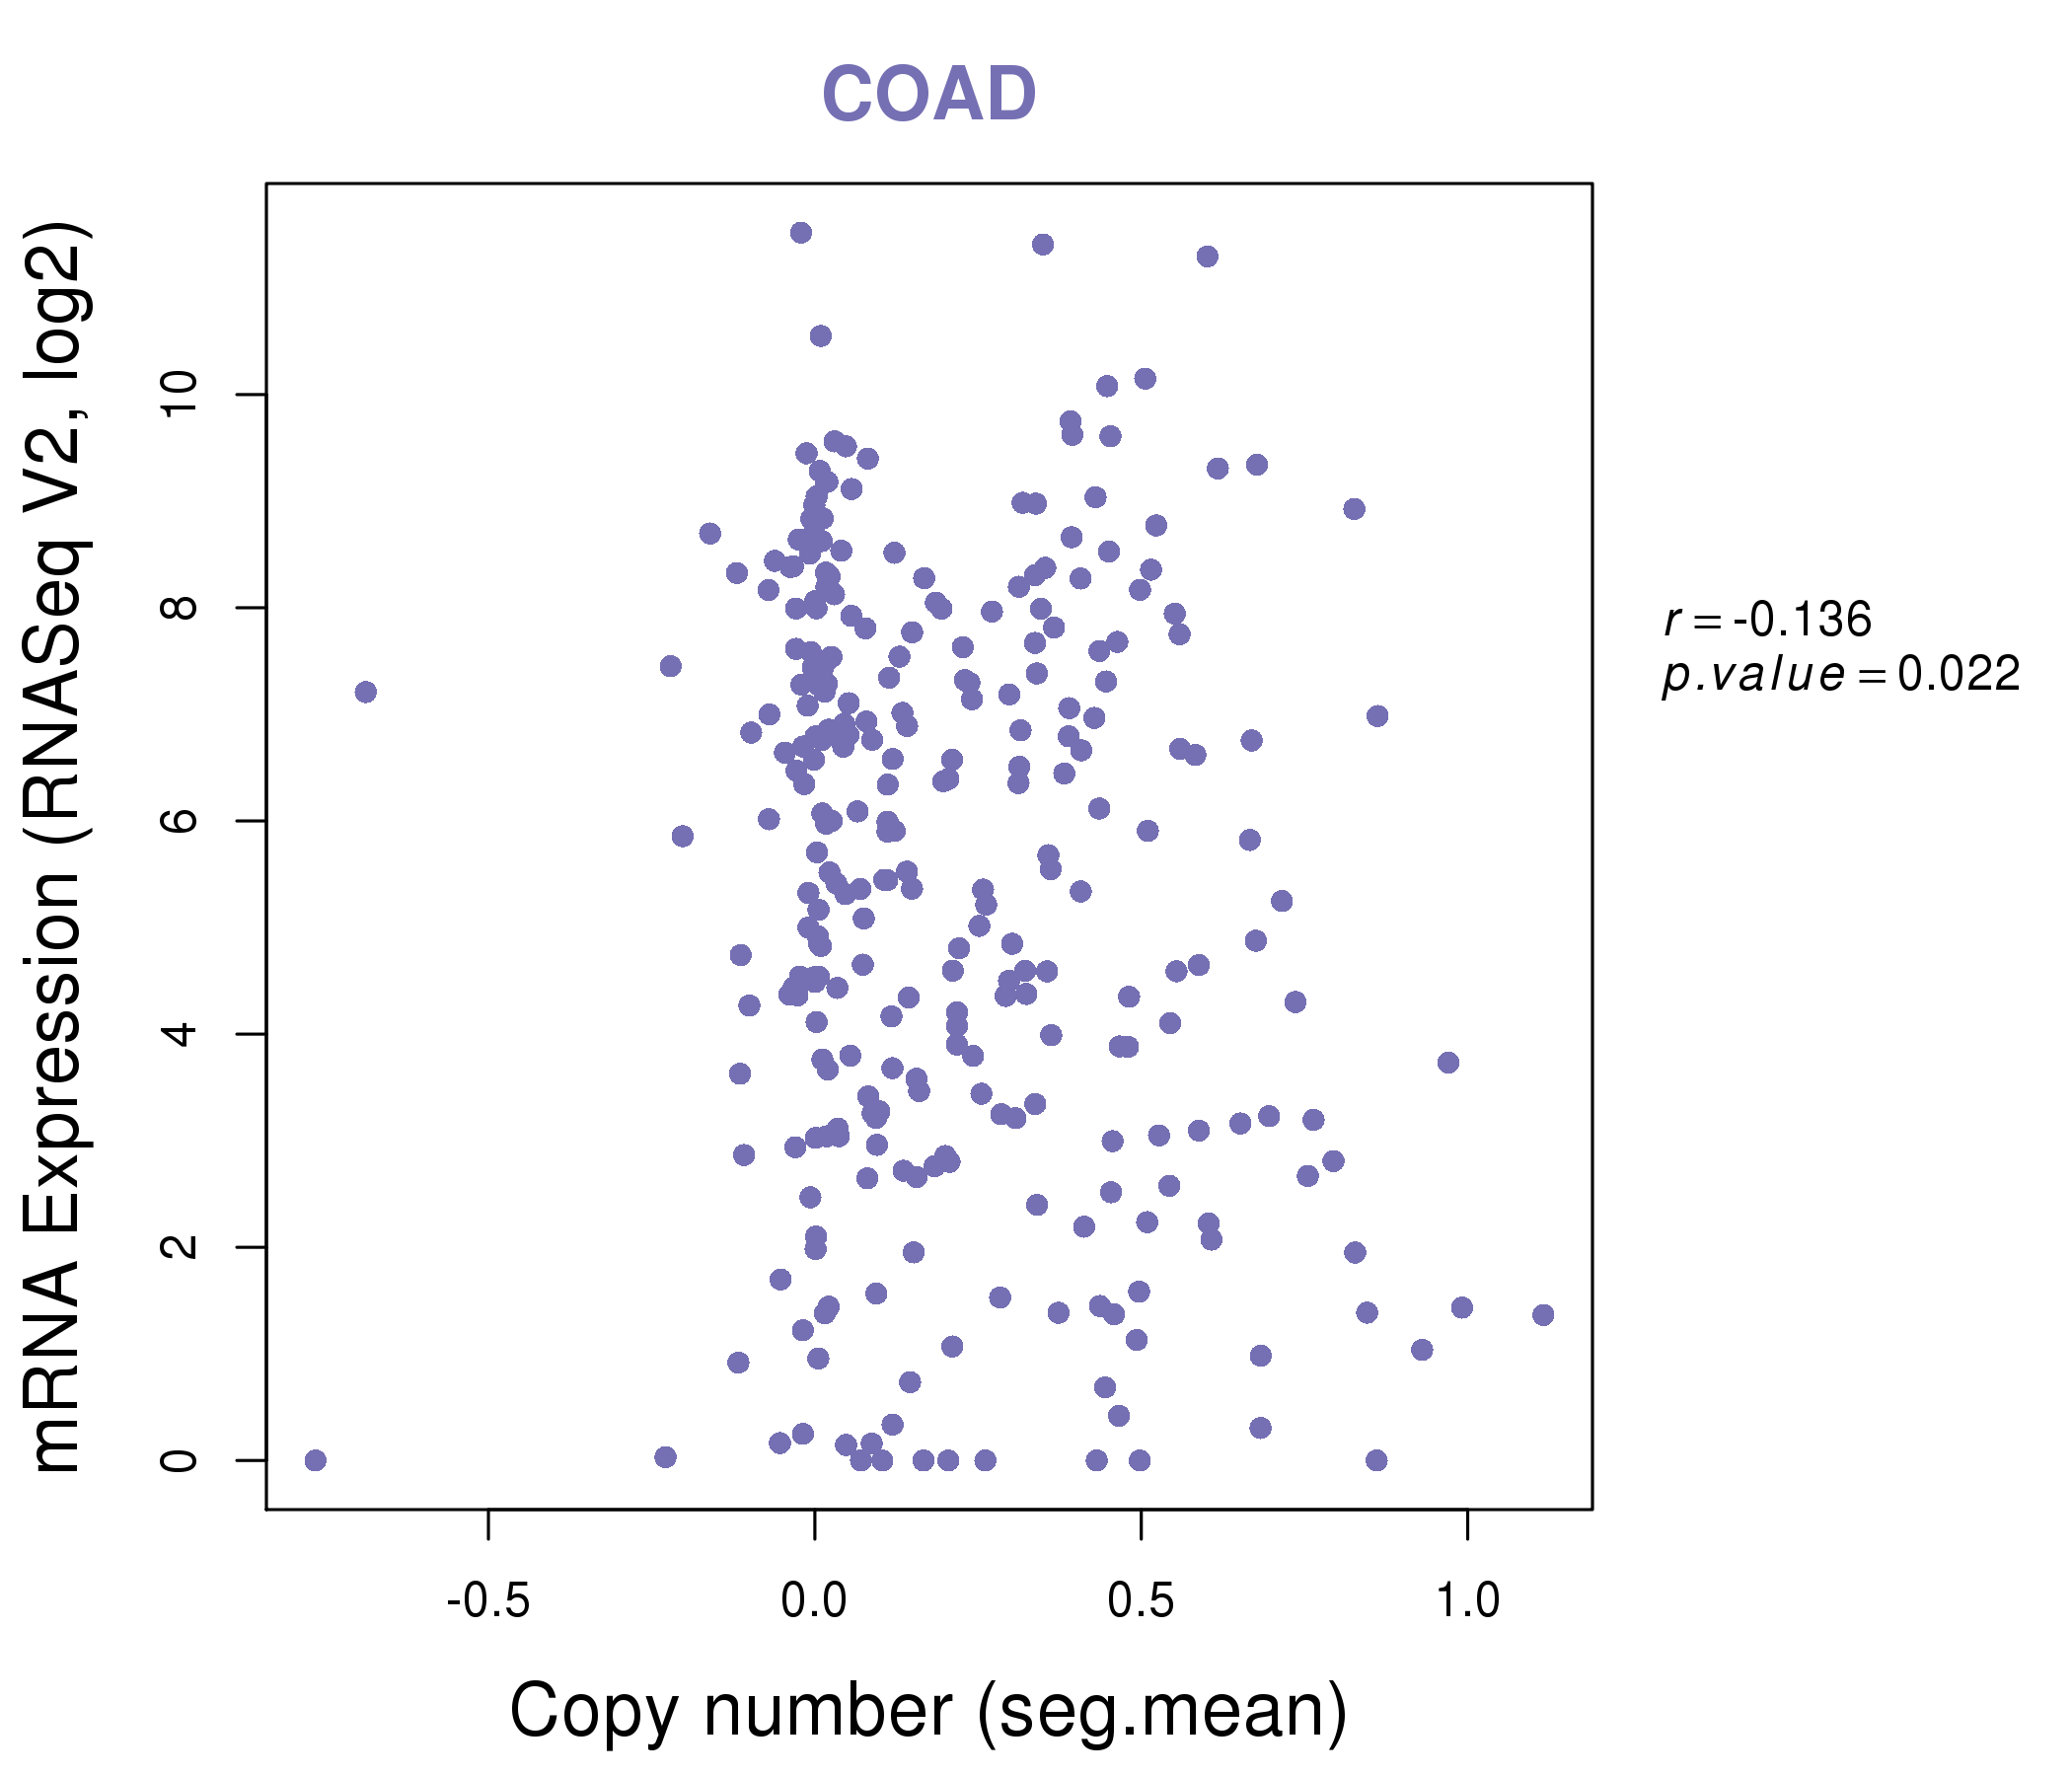
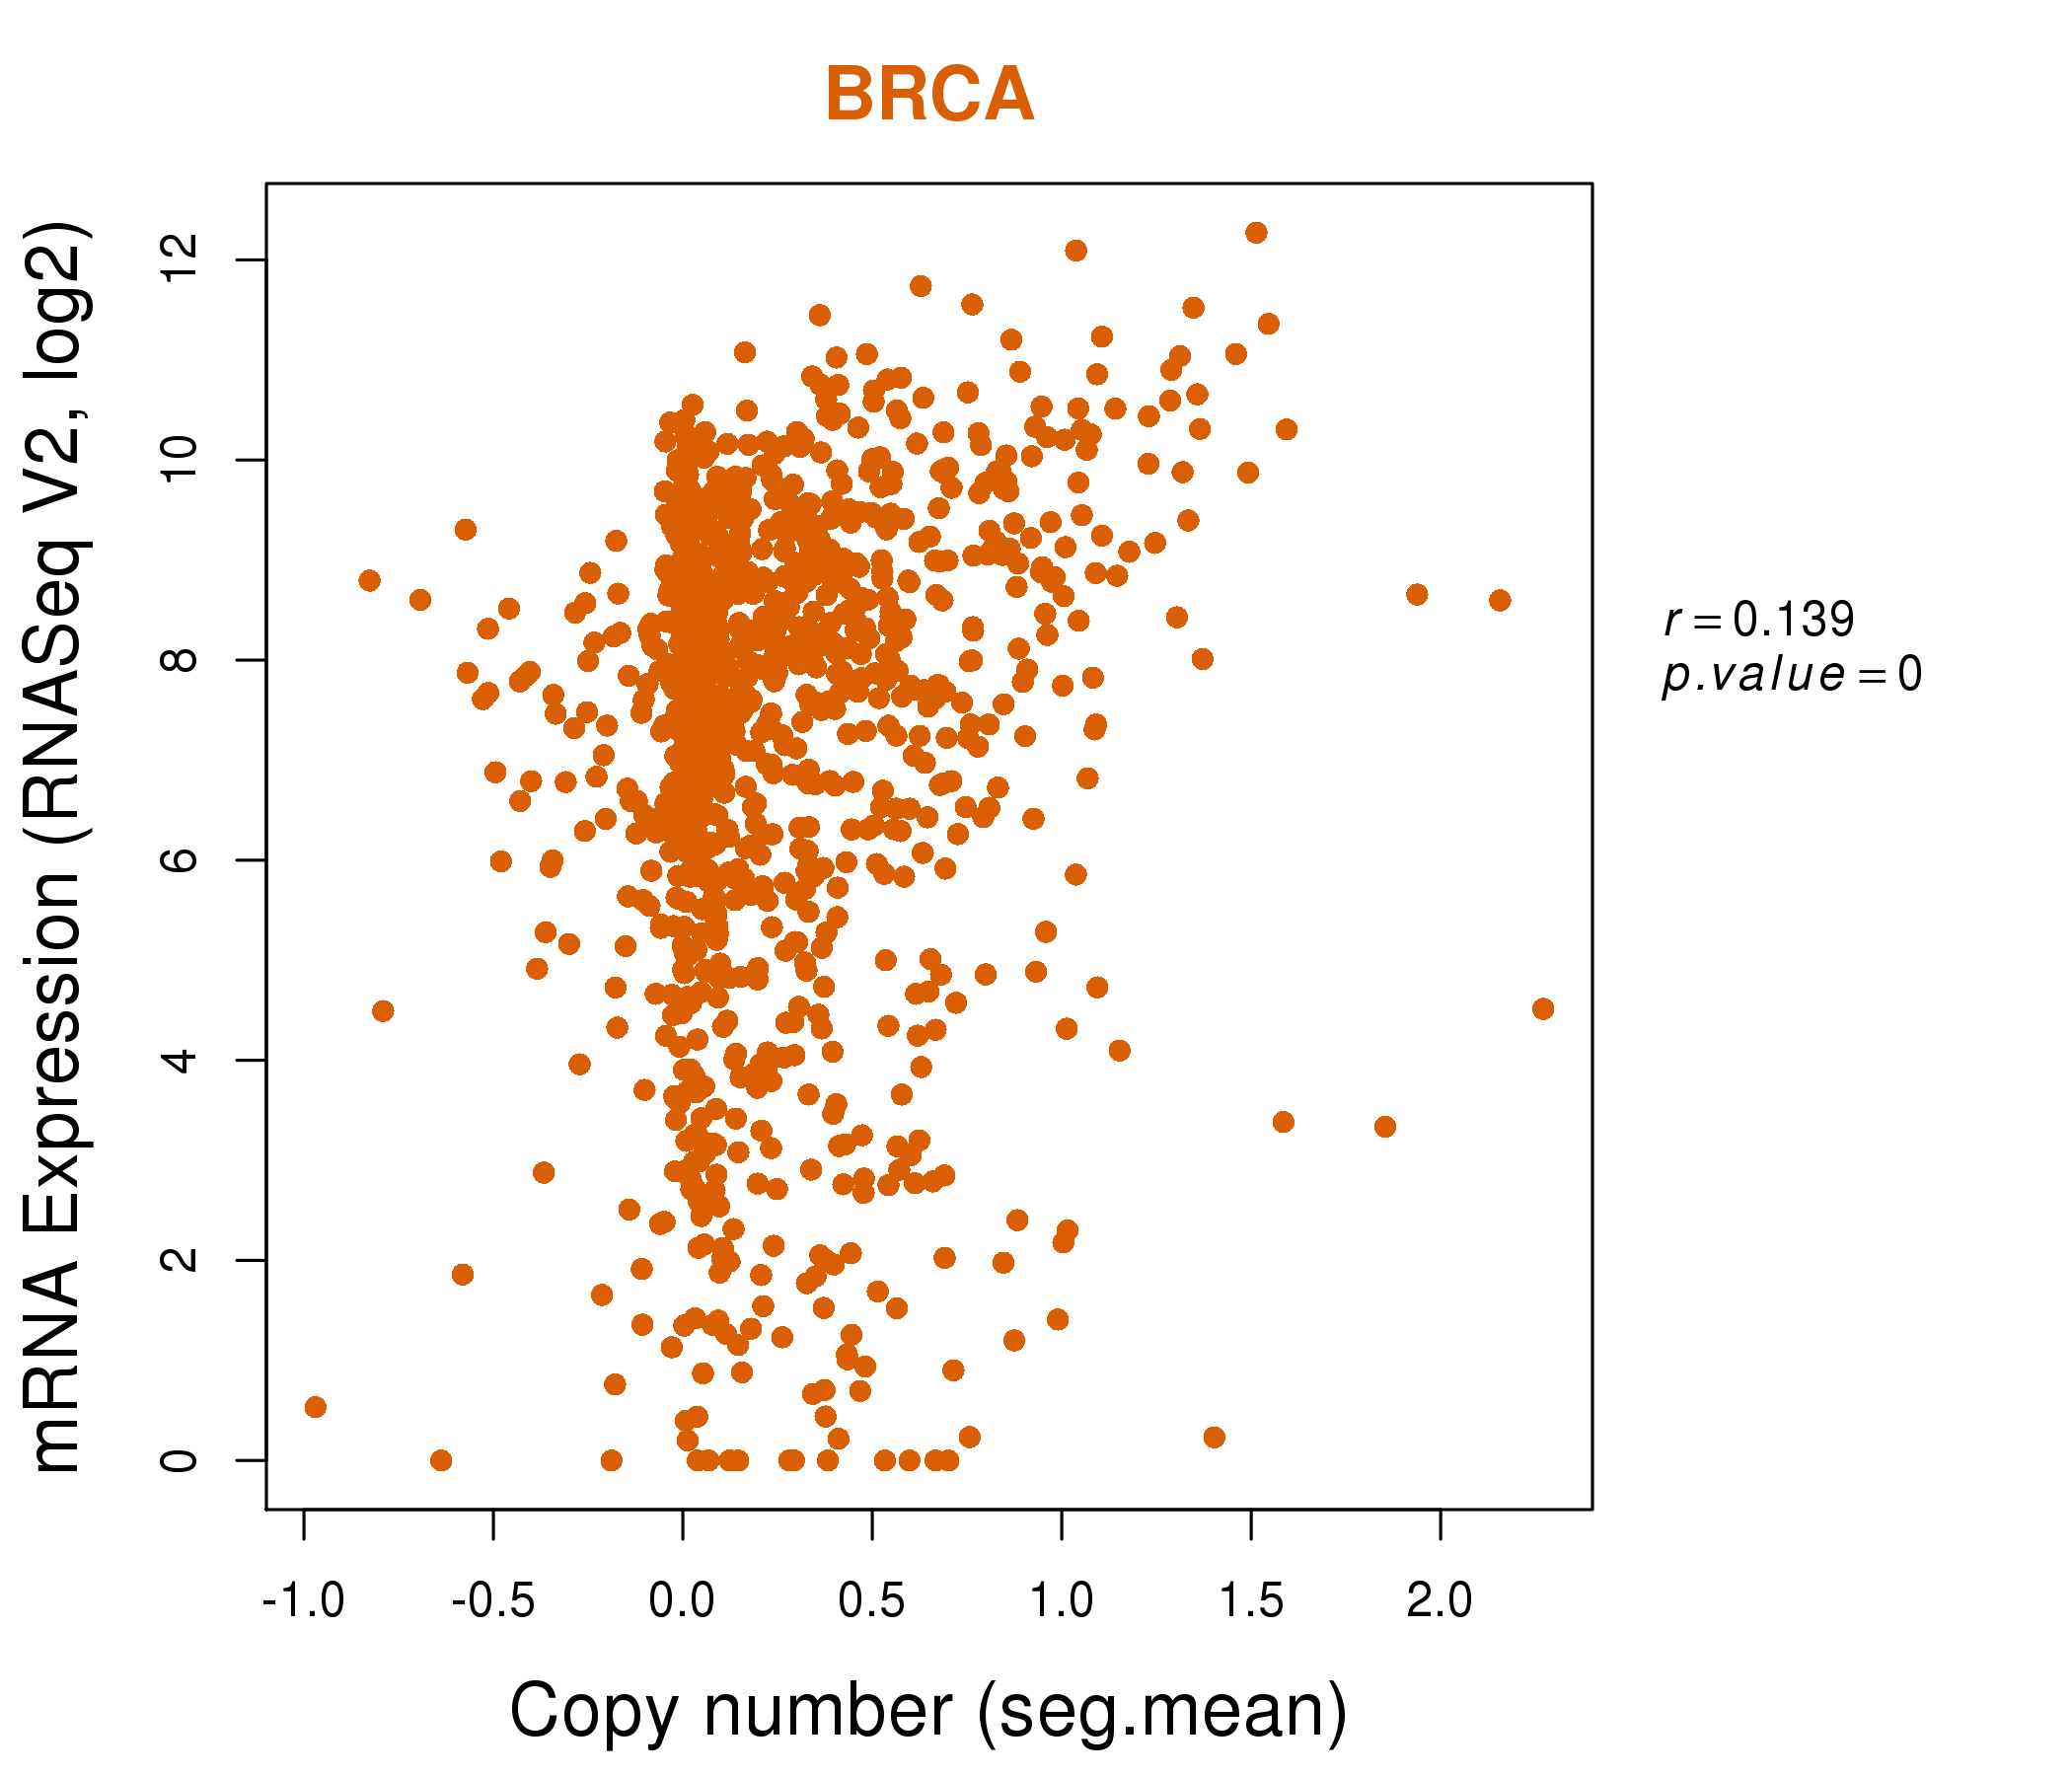
| * Copy number data were extracted from TCGA using R package TCGA-Assembler. The URLs of all public data files on TCGA DCC data server were gathered on Jan-05-2015. Function ProcessCNAData in TCGA-Assembler package was used to obtain gene-level copy number value which is calculated as the average copy number of the genomic region of a gene. |
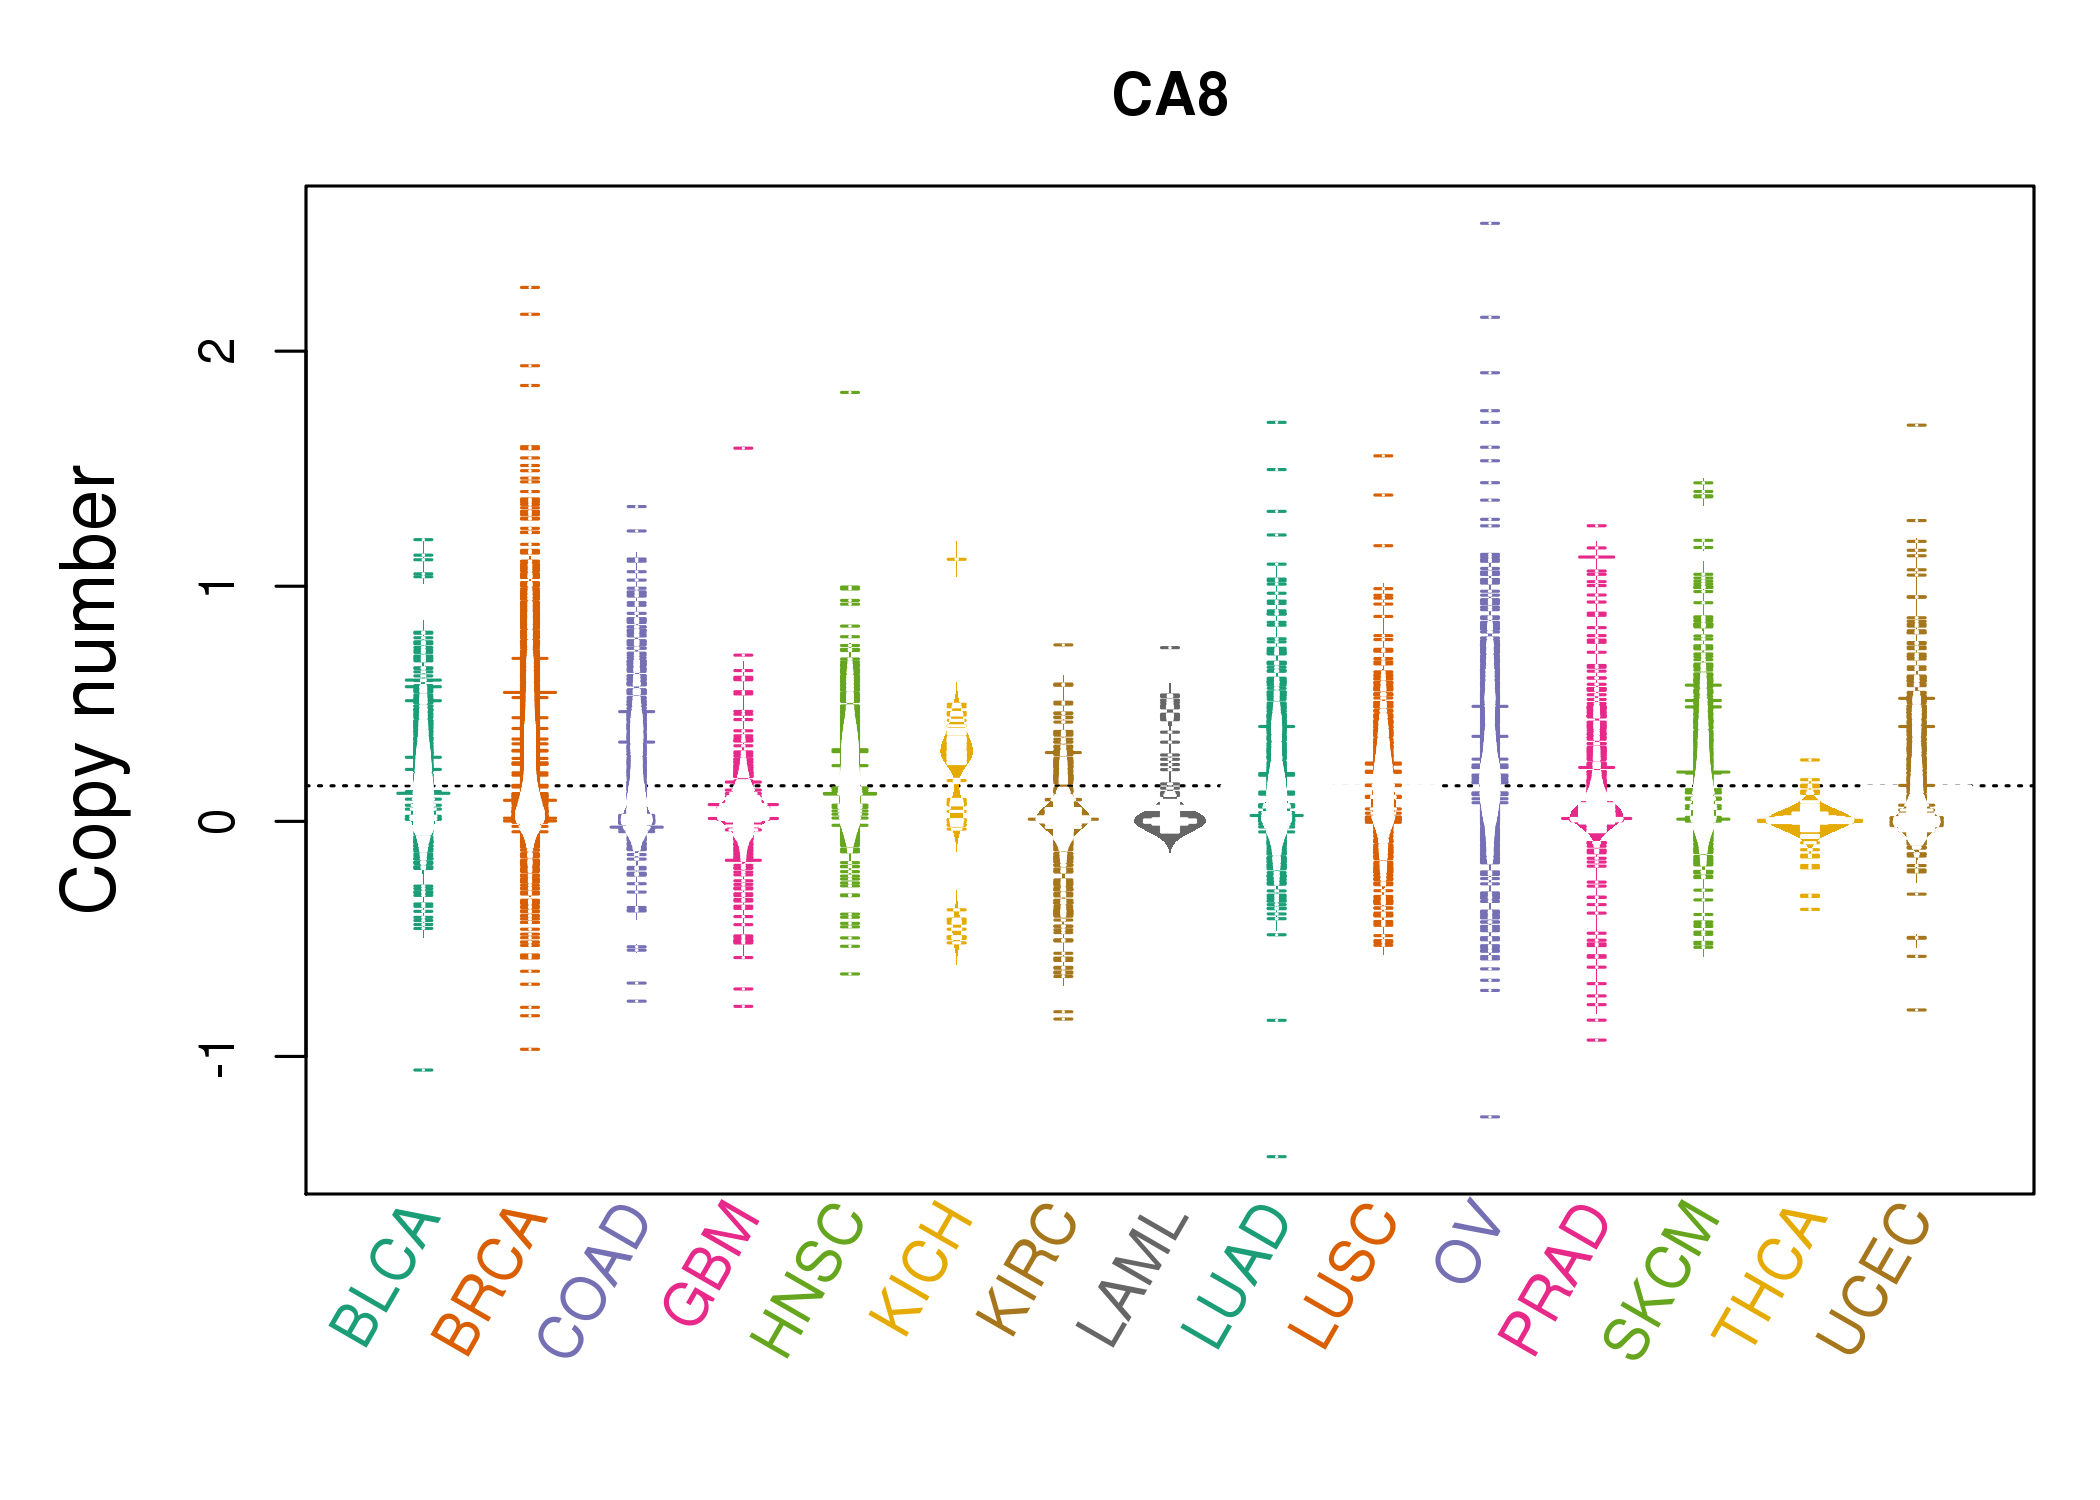 |
| cf) Tissue ID[Tissue type]: BLCA[Bladder Urothelial Carcinoma], BRCA[Breast invasive carcinoma], CESC[Cervical squamous cell carcinoma and endocervical adenocarcinoma], COAD[Colon adenocarcinoma], GBM[Glioblastoma multiforme], Glioma Low Grade, HNSC[Head and Neck squamous cell carcinoma], KICH[Kidney Chromophobe], KIRC[Kidney renal clear cell carcinoma], KIRP[Kidney renal papillary cell carcinoma], LAML[Acute Myeloid Leukemia], LUAD[Lung adenocarcinoma], LUSC[Lung squamous cell carcinoma], OV[Ovarian serous cystadenocarcinoma ], PAAD[Pancreatic adenocarcinoma], PRAD[Prostate adenocarcinoma], SKCM[Skin Cutaneous Melanoma], STAD[Stomach adenocarcinoma], THCA[Thyroid carcinoma], UCEC[Uterine Corpus Endometrial Carcinoma] |
| Top |
| Gene Expression for CA8 |
| * CCLE gene expression data were extracted from CCLE_Expression_Entrez_2012-10-18.res: Gene-centric RMA-normalized mRNA expression data. |
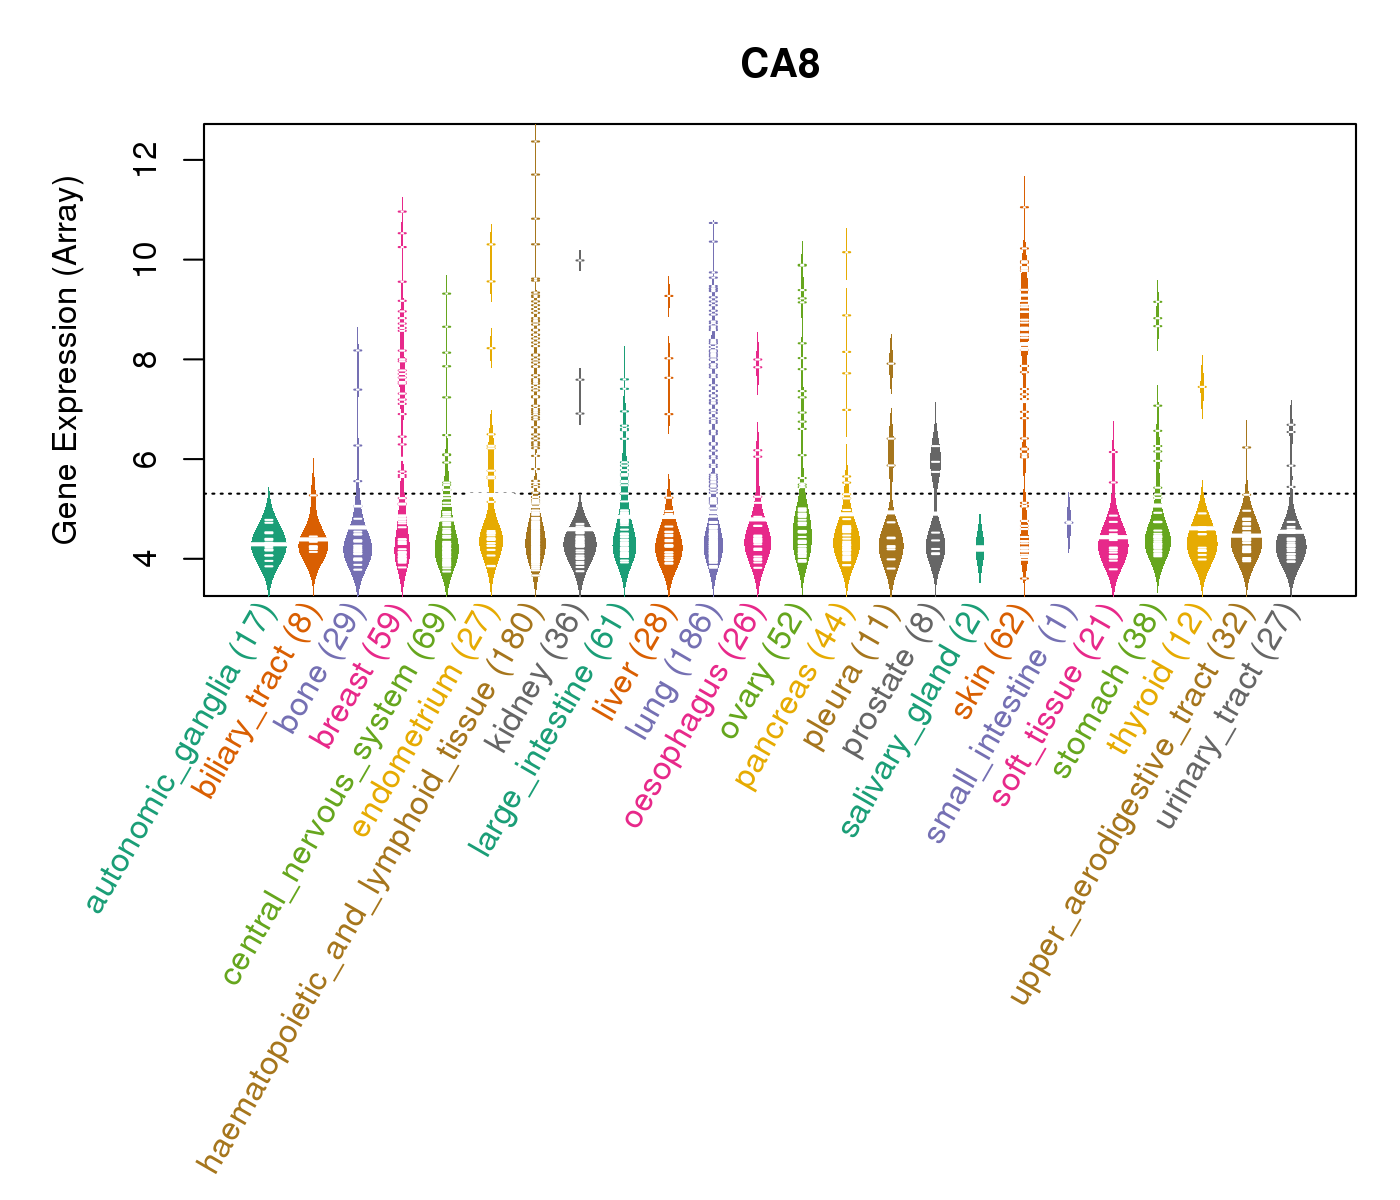 |
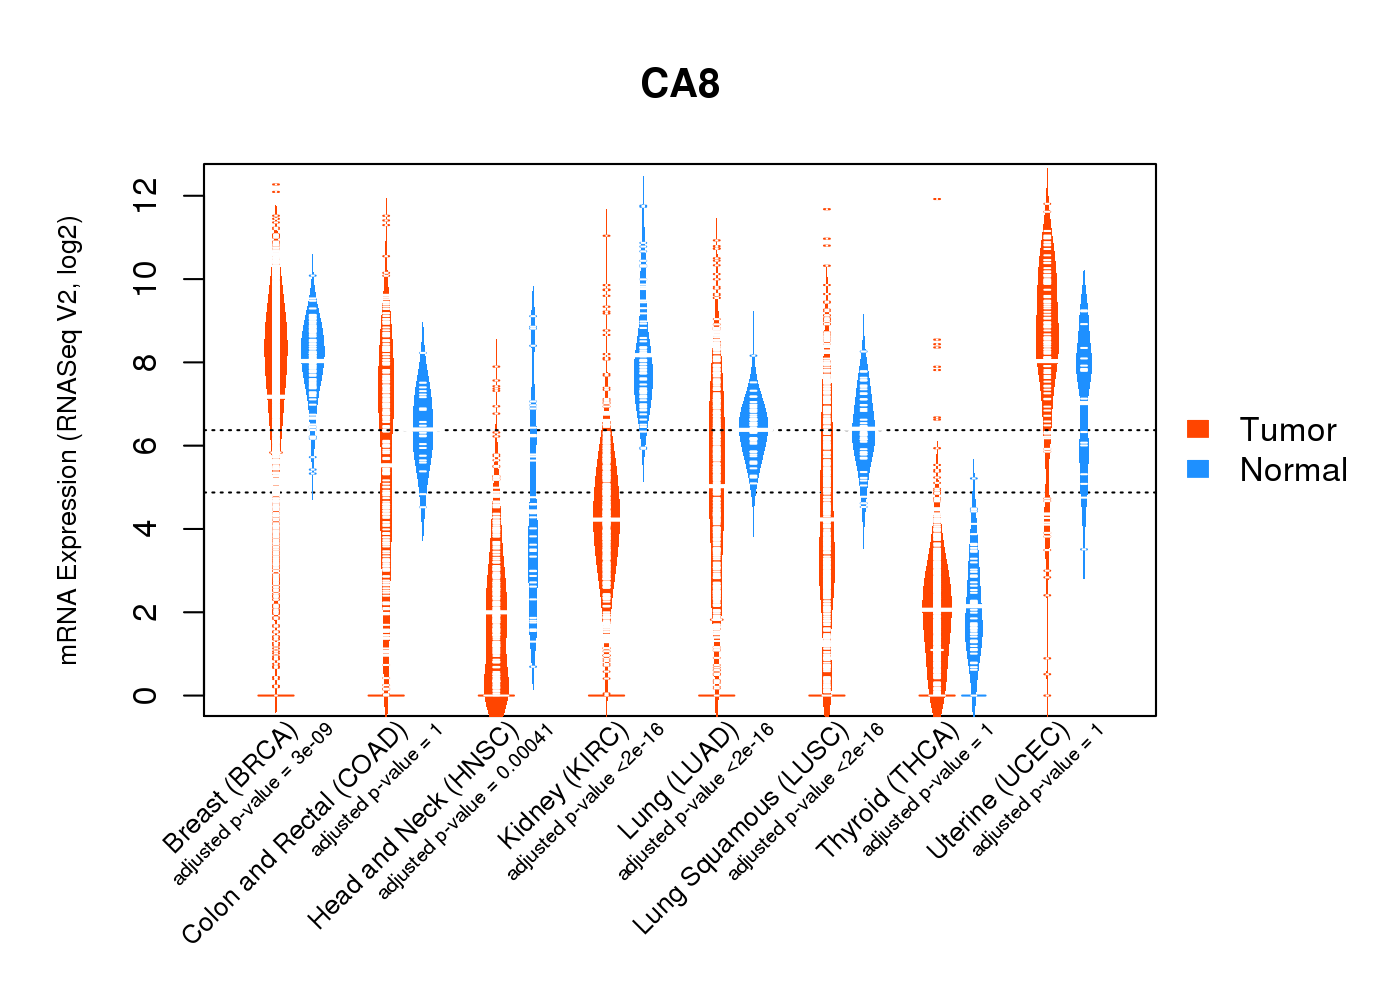
| * Normalized gene expression data of RNASeqV2 was extracted from TCGA using R package TCGA-Assembler. The URLs of all public data files on TCGA DCC data server were gathered at Jan-05-2015. Only eight cancer types have enough normal control samples for differential expression analysis. (t test, adjusted p<0.05 (using Benjamini-Hochberg FDR)) |
 |
| Top |
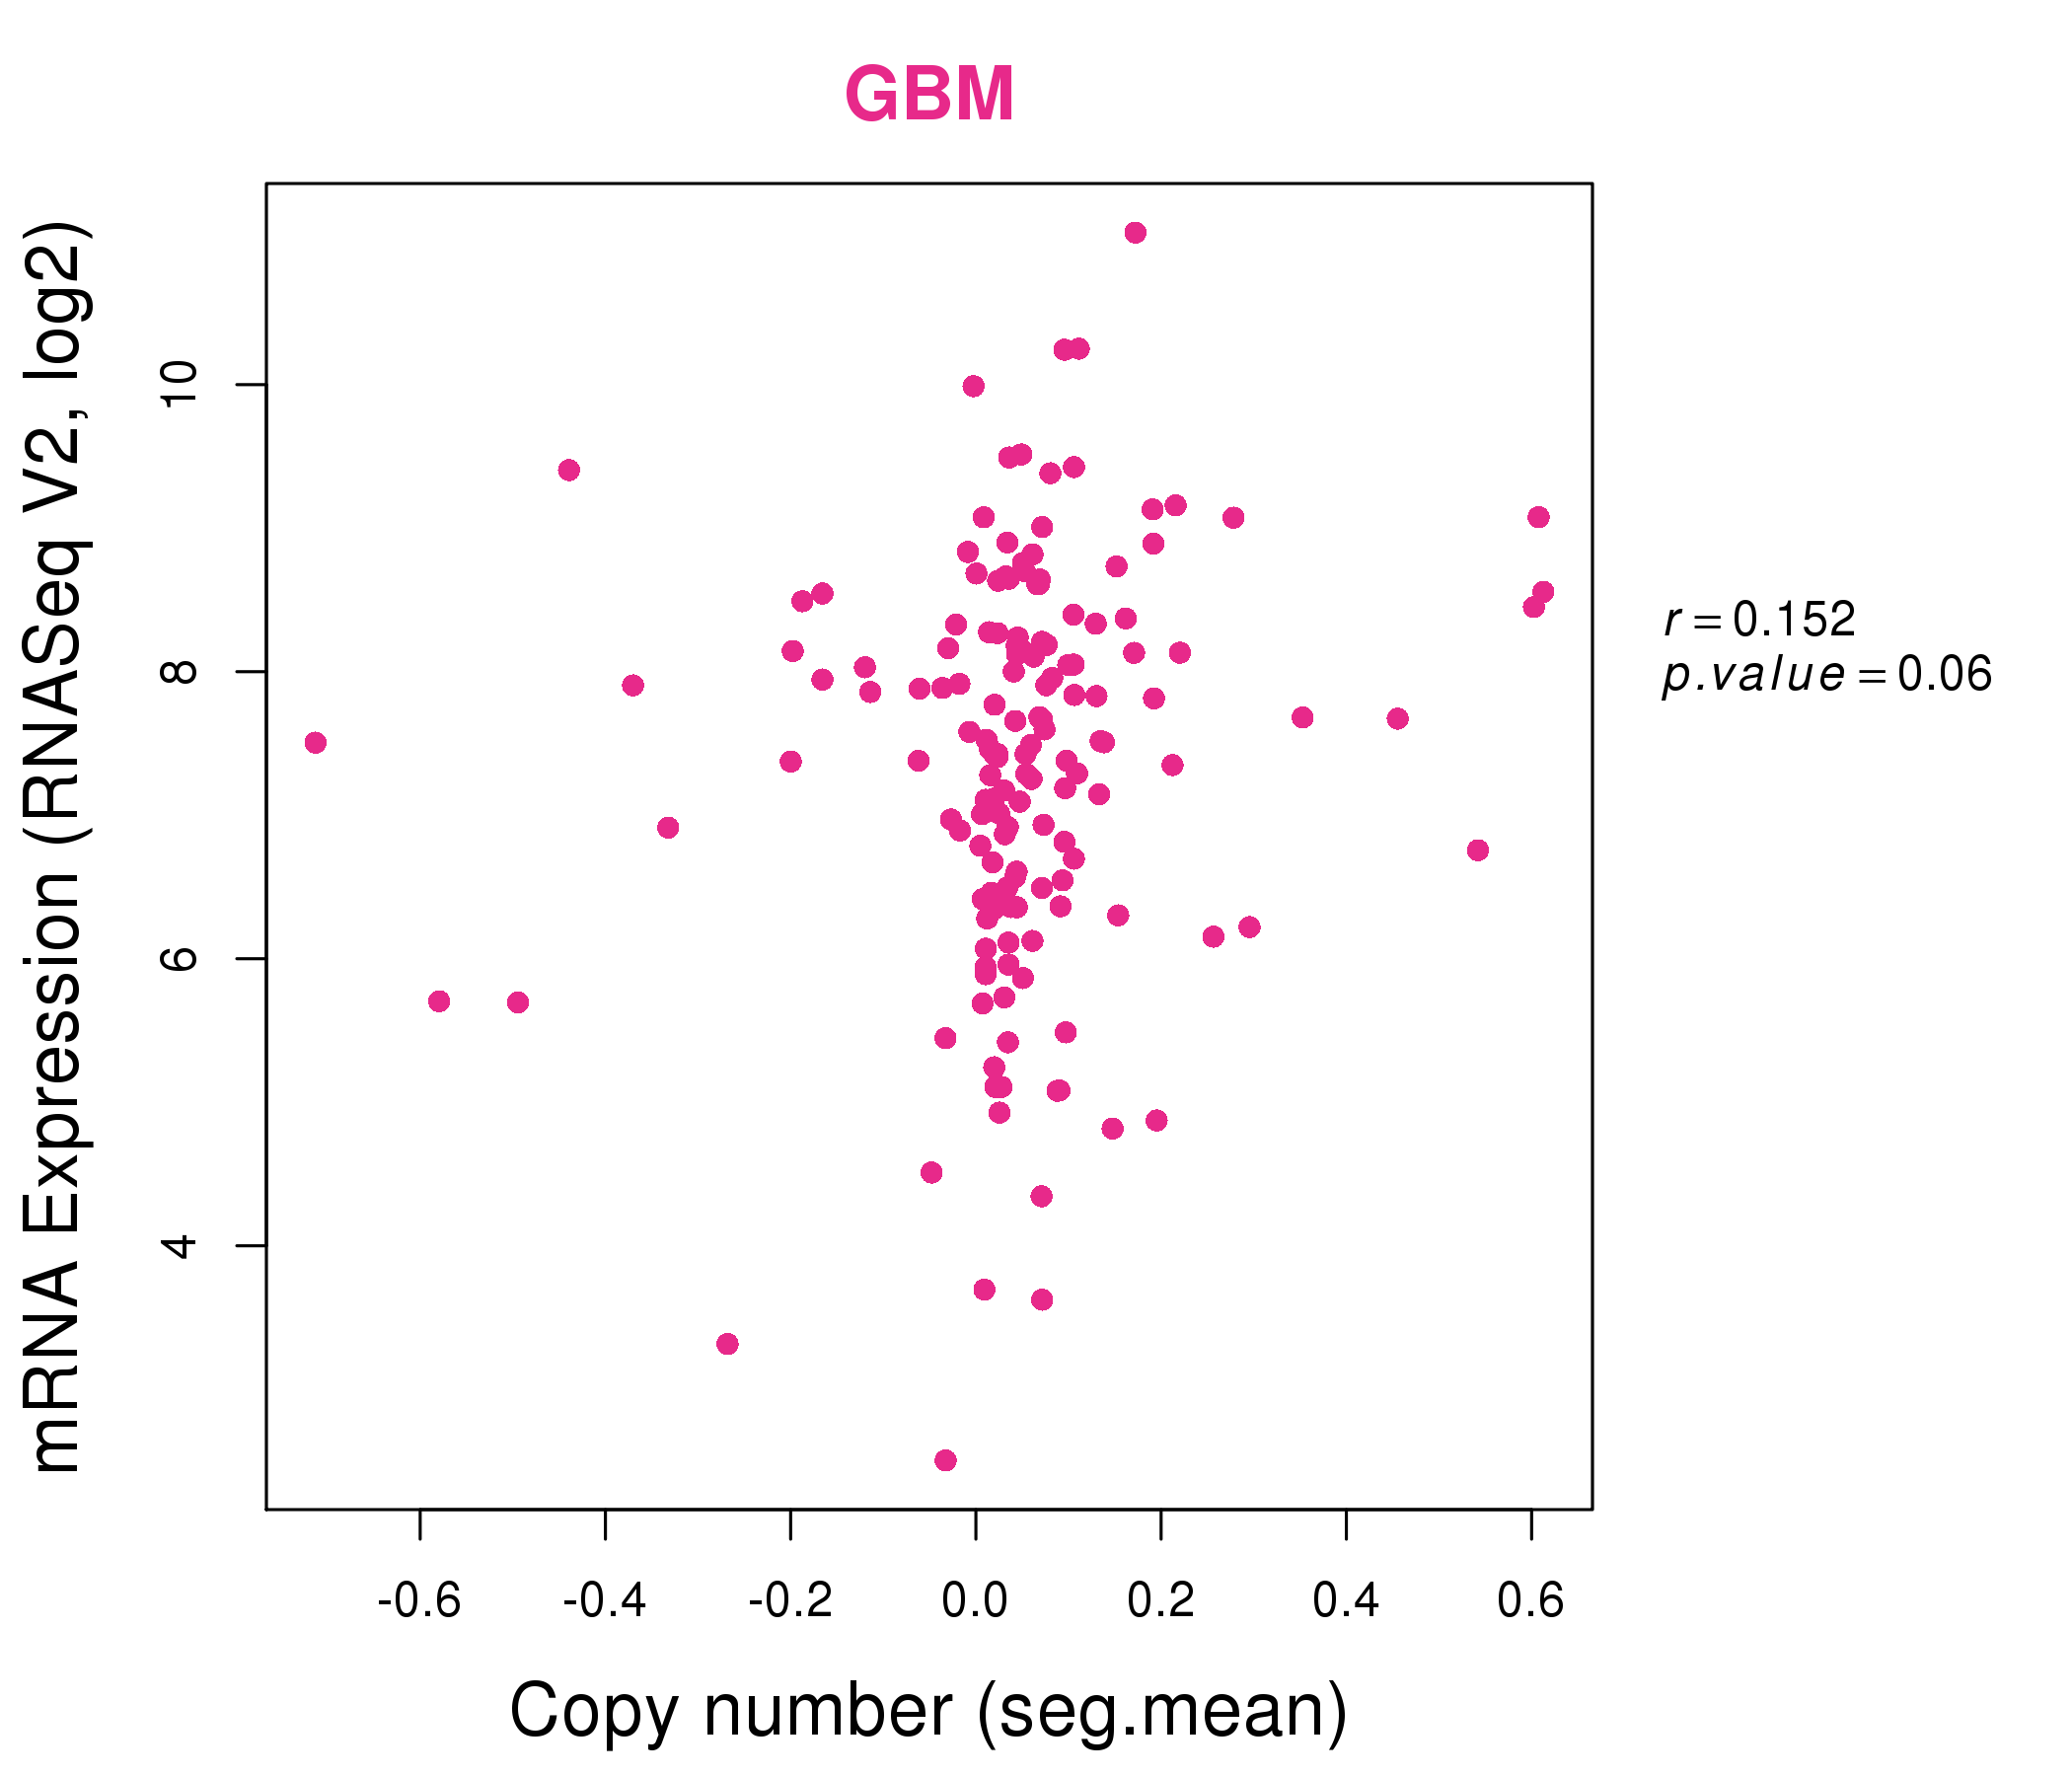
| * This plots show the correlation between CNV and gene expression. |
: Open all plots for all cancer types
 |
|
 |
|
| Top |
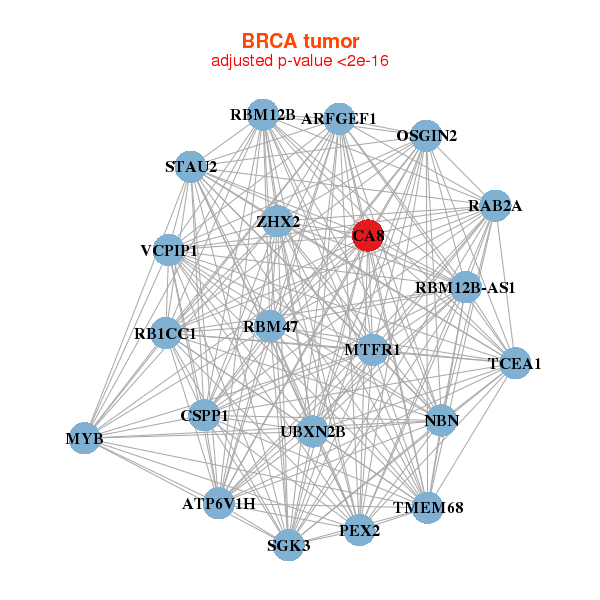
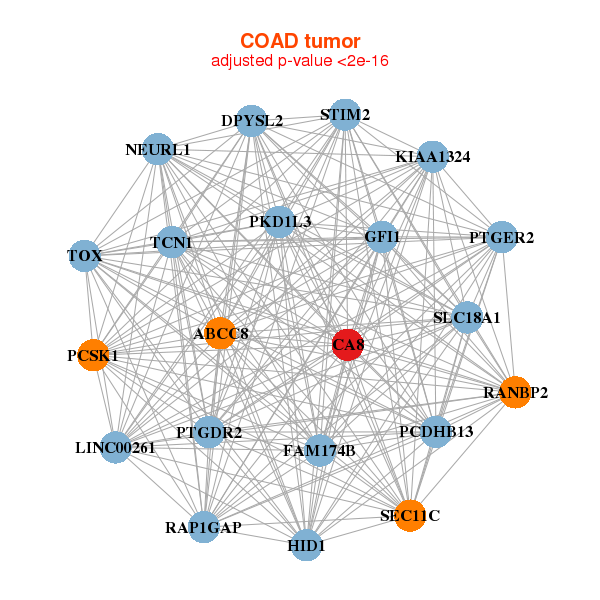
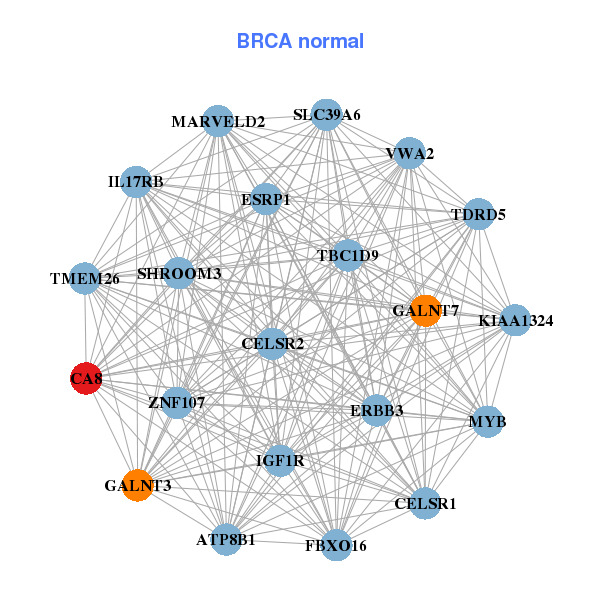
| Gene-Gene Network Information |
| * Co-Expression network figures were drawn using R package igraph. Only the top 20 genes with the highest correlations were shown. Red circle: input gene, orange circle: cell metabolism gene, sky circle: other gene |
: Open all plots for all cancer types
 |
| ||||
| ARFGEF1,ATP6V1H,RBM12B-AS1,CA8,CSPP1,MTFR1,MYB, NBN,OSGIN2,PEX2,RAB2A,RB1CC1,RBM12B,RBM47, SGK3,STAU2,TCEA1,TMEM68,UBXN2B,VCPIP1,ZHX2 | ATP8B1,CA8,CELSR1,CELSR2,ERBB3,ESRP1,FBXO16, GALNT3,GALNT7,IGF1R,IL17RB,KIAA1324,MARVELD2,MYB, SHROOM3,SLC39A6,TBC1D9,TDRD5,TMEM26,VWA2,ZNF107 | ||||
 |
| ||||
| ABCC8,HID1,LINC00261,CA8,DPYSL2,FAM174B,GFI1, PTGDR2,KIAA1324,NEURL1,PCDHB13,PCSK1,PKD1L3,PTGER2, RANBP2,RAP1GAP,SEC11C,SLC18A1,STIM2,TCN1,TOX | SPTSSB,CA8,CHRM1,COG5,CREB3L4,DCDC2,DNAJC12, FMOD,GALNT8,GLYATL3,KCTD14,KIAA1324,LOC286002,NEBL, NKX2-2,PTPRN2,RNASE4,SCG5,SLC2A10,SPEF2,WFDC2 |
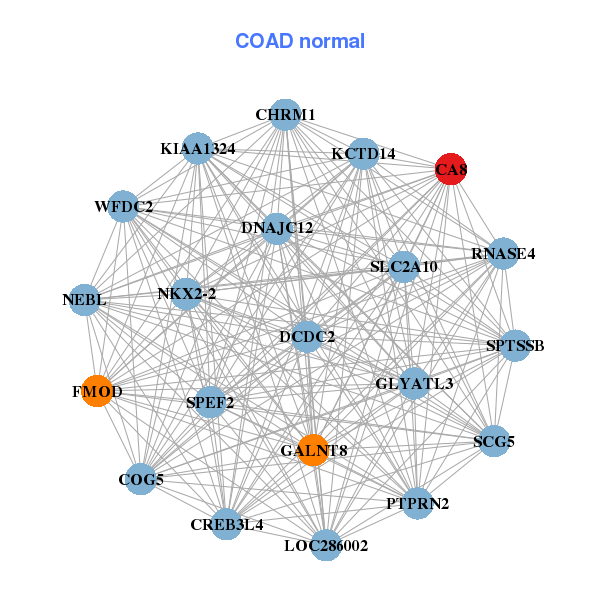
| * Co-Expression network figures were drawn using R package igraph. Only the top 20 genes with the highest correlations were shown. Red circle: input gene, orange circle: cell metabolism gene, sky circle: other gene |
: Open all plots for all cancer types
| Top |
: Open all interacting genes' information including KEGG pathway for all interacting genes from DAVID
| Top |
| Pharmacological Information for CA8 |
| DB Category | DB Name | DB's ID and Url link |
| * Gene Centered Interaction Network. |
 |
| * Drug Centered Interaction Network. |
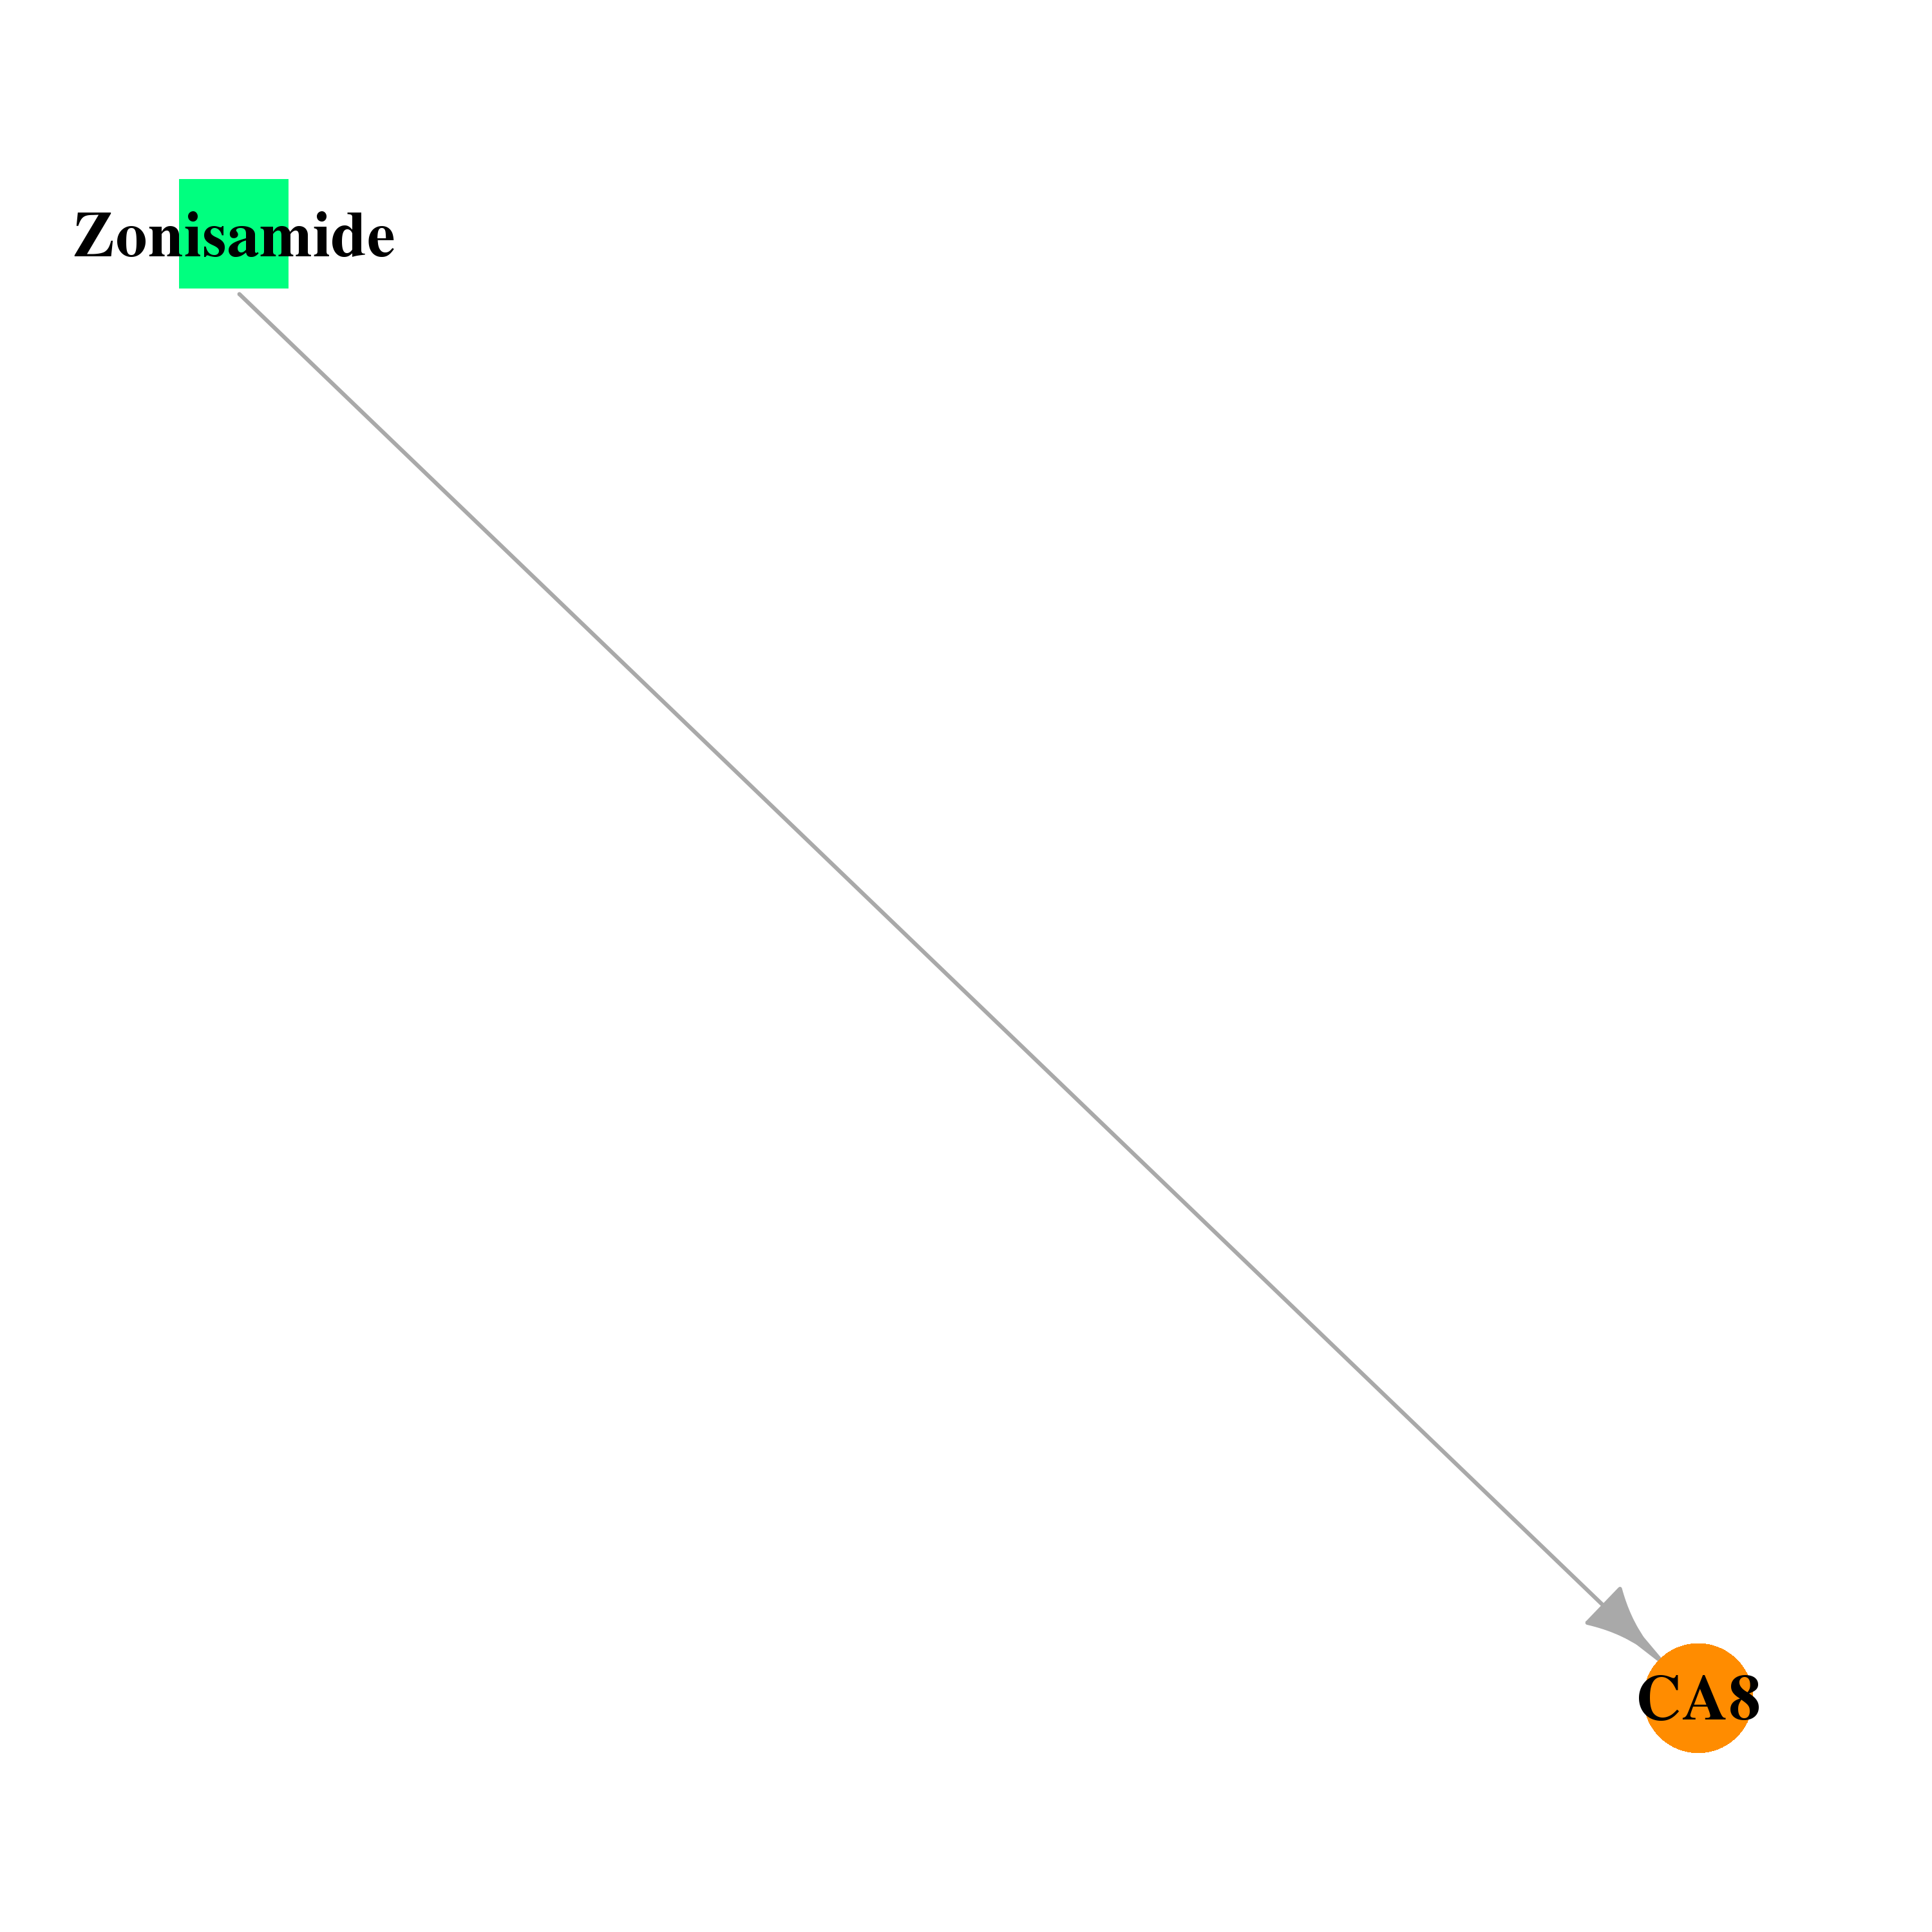
| DrugBank ID | Target Name | Drug Groups | Generic Name | Drug Centered Network | Drug Structure |
| DB00909 | carbonic anhydrase VIII | approved; investigational | Zonisamide | 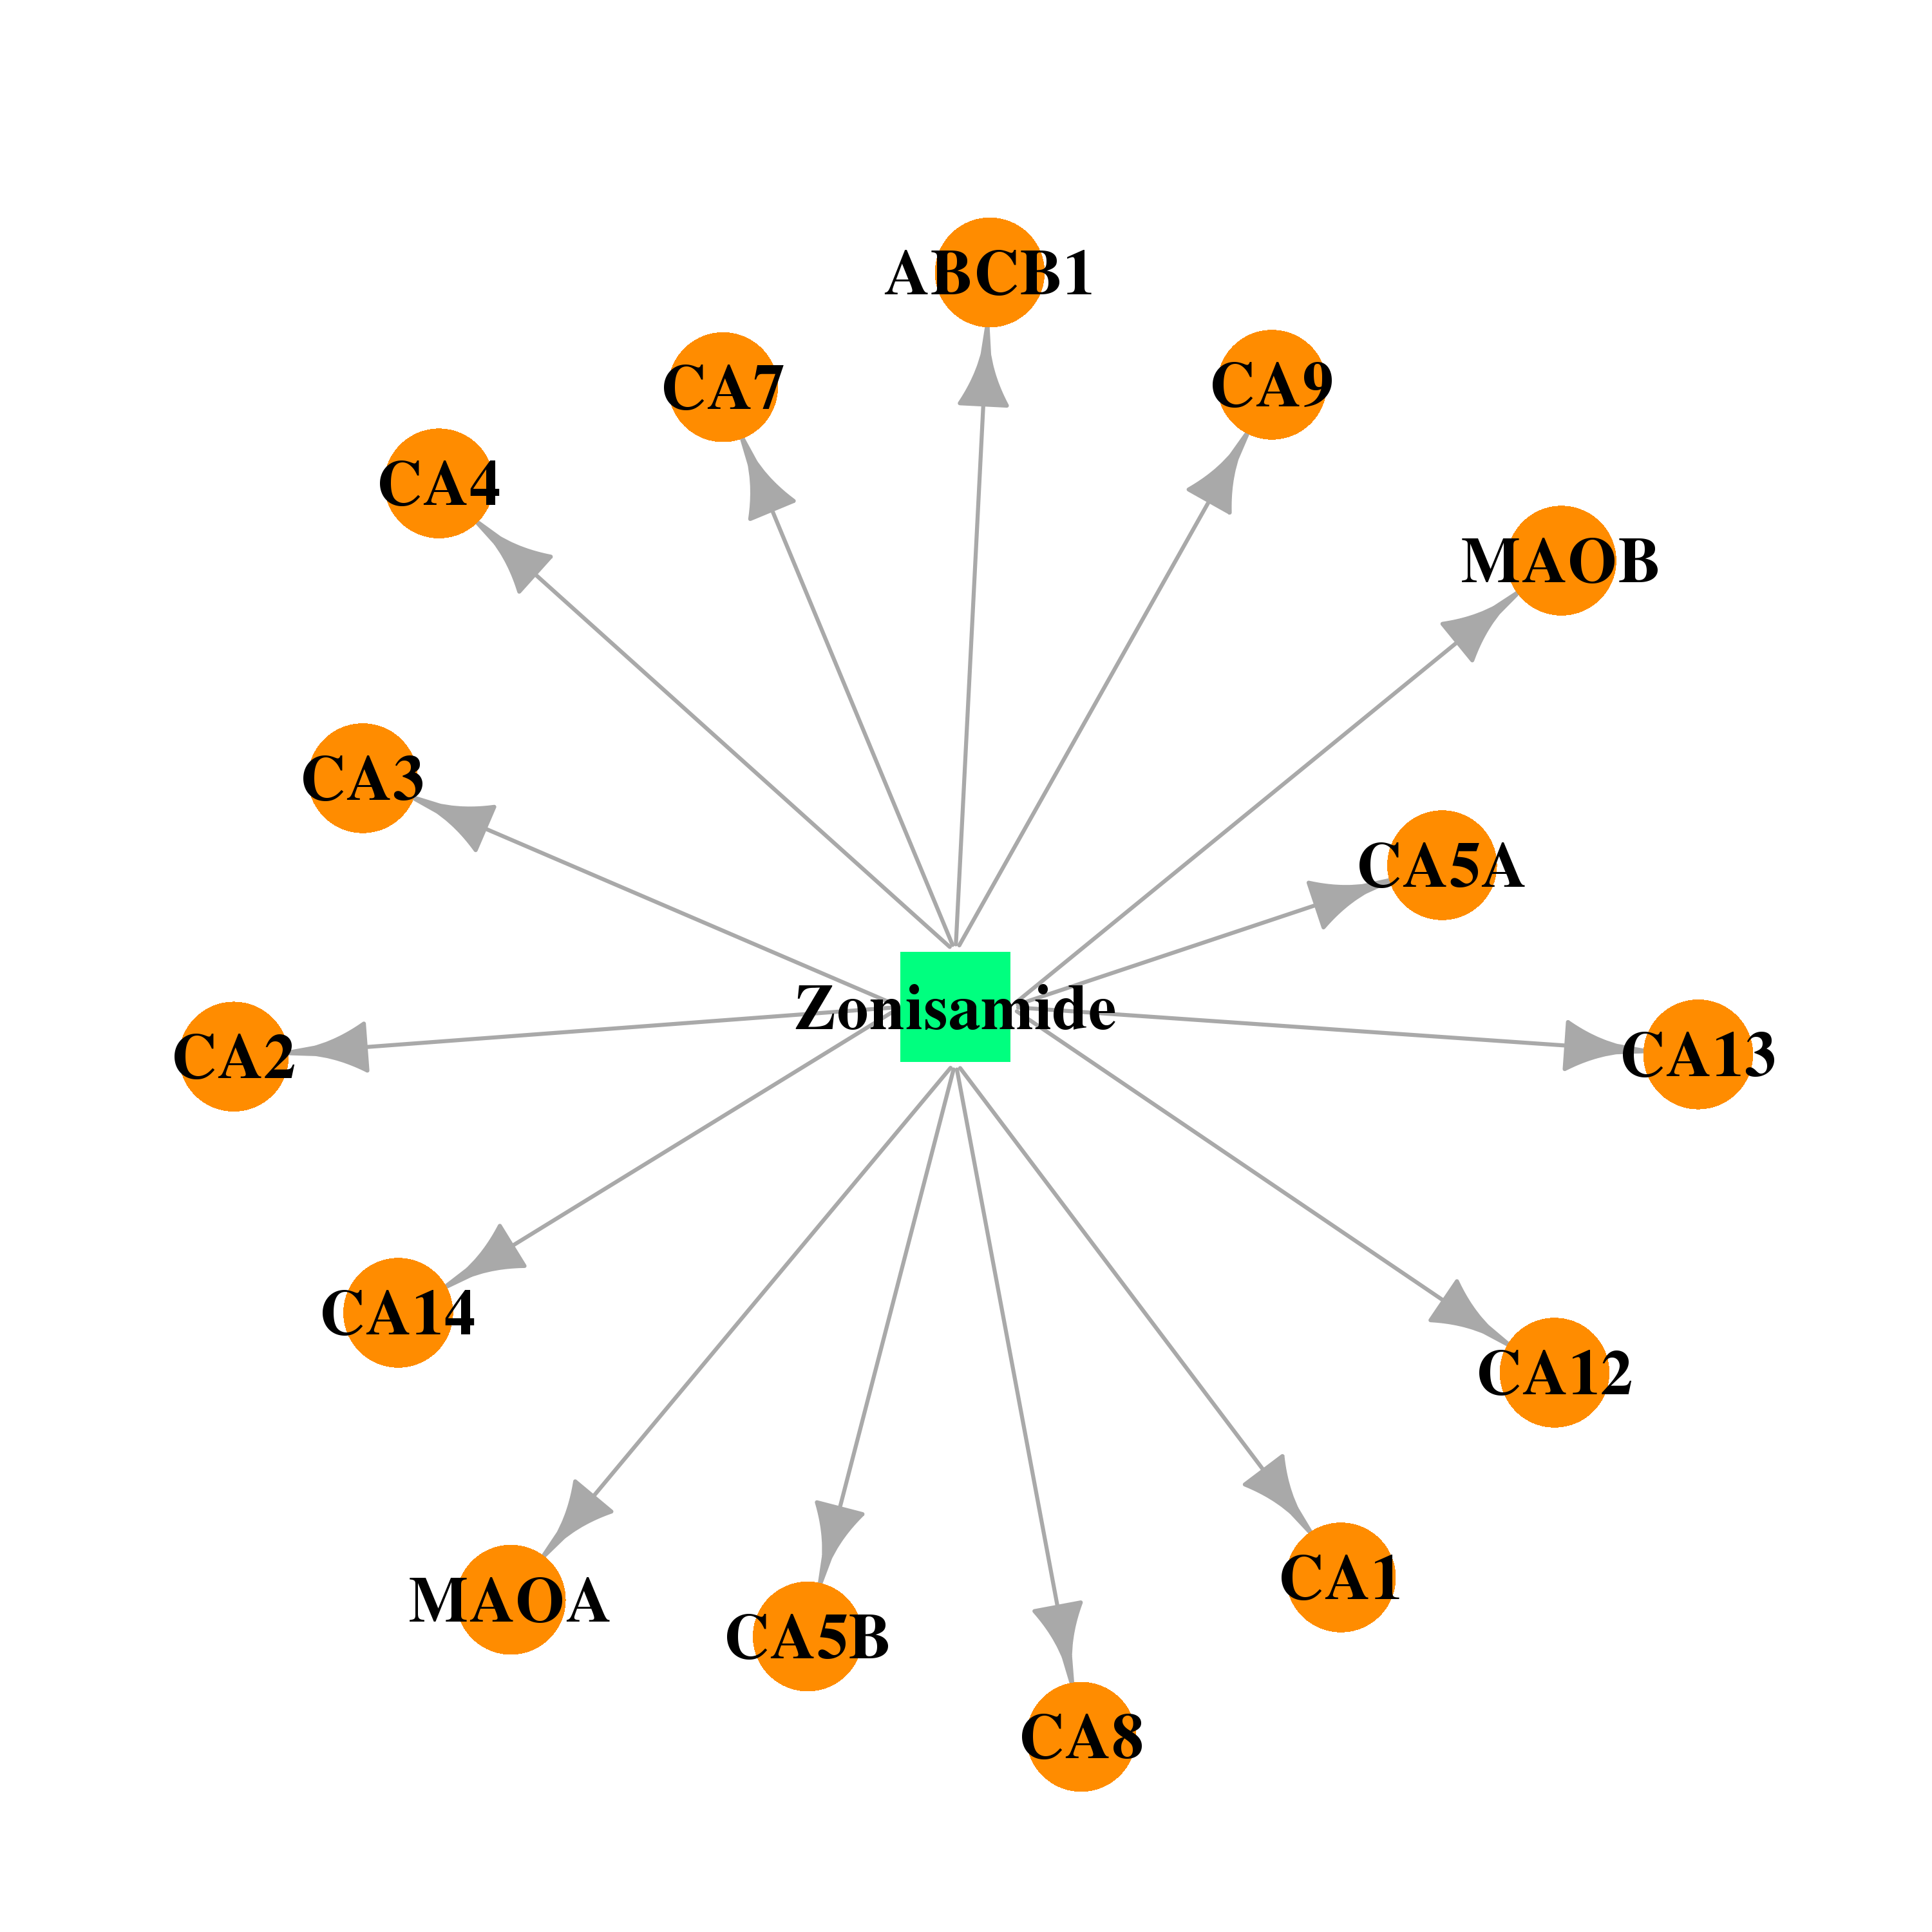 |  |
| Top |
| Cross referenced IDs for CA8 |
| * We obtained these cross-references from Uniprot database. It covers 150 different DBs, 18 categories. http://www.uniprot.org/help/cross_references_section |
: Open all cross reference information
|
Copyright © 2016-Present - The Univsersity of Texas Health Science Center at Houston @ |