|
|||||||||||||||||||||||||||||||||||||||||||||||||||||||||||||||||||||||||||||||||||||||||||||||||||||||||||||||||||||||||||||||||||||||||||||||||||||||||||||||||||||||||||||||||||||||||||||||||||||||||||||||||||||||||||||||||||||||||||||||||||||||||||||||||||||||||||||||||||||||||||||||||||||||||||||||||||||||||||||||||||||||||||||||||||||||||||||||||||||||||||
| |
| Phenotypic Information (metabolism pathway, cancer, disease, phenome) |
| |
| |
| Gene-Gene Network Information: Co-Expression Network, Interacting Genes & KEGG |
| |
|


| Gene Summary for CA9 |
| Basic gene info. | Gene symbol | CA9 |
| Gene name | carbonic anhydrase IX | |
| Synonyms | CAIX|MN | |
| Cytomap | UCSC genome browser: 9p13.3 | |
| Genomic location | chr9 :35673914-35681154 | |
| Type of gene | protein-coding | |
| RefGenes | NM_001216.2, | |
| Ensembl id | ENSG00000107159 | |
| Description | CA-IXP54/58NRCC-associated antigen G250RCC-associated protein G250carbonate dehydratase IXcarbonic anhydrase 9carbonic dehydratasemembrane antigen MNpMW1renal cell carcinoma-associated antigen G250 | |
| Modification date | 20141222 | |
| dbXrefs | MIM : 603179 | |
| HGNC : HGNC | ||
| Ensembl : ENSG00000107159 | ||
| HPRD : 04417 | ||
| Vega : OTTHUMG00000021029 | ||
| Protein | UniProt: Q16790 go to UniProt's Cross Reference DB Table | |
| Expression | CleanEX: HS_CA9 | |
| BioGPS: 768 | ||
| Gene Expression Atlas: ENSG00000107159 | ||
| The Human Protein Atlas: ENSG00000107159 | ||
| Pathway | NCI Pathway Interaction Database: CA9 | |
| KEGG: CA9 | ||
| REACTOME: CA9 | ||
| ConsensusPathDB | ||
| Pathway Commons: CA9 | ||
| Metabolism | MetaCyc: CA9 | |
| HUMANCyc: CA9 | ||
| Regulation | Ensembl's Regulation: ENSG00000107159 | |
| miRBase: chr9 :35,673,914-35,681,154 | ||
| TargetScan: NM_001216 | ||
| cisRED: ENSG00000107159 | ||
| Context | iHOP: CA9 | |
| cancer metabolism search in PubMed: CA9 | ||
| UCL Cancer Institute: CA9 | ||
| Assigned class in ccmGDB | A - This gene has a literature evidence and it belongs to cancer gene. | |
| References showing role of CA9 in cancer cell metabolism | 1. Motzer RJ, Hutson TE, Hudes GR, Figlin RA, Martini JF, et al. (2014) Investigation of novel circulating proteins, germ line single-nucleotide polymorphisms, and molecular tumor markers as potential efficacy biomarkers of first-line sunitinib therapy for advanced renal cell carcinoma. Cancer Chemother Pharmacol 74: 739-750. doi: 10.1007/s00280-014-2539-0. pmid: 4175044 go to article 2. Sheng W, Dong M, Zhou J, Li X, Dong Q (2013) Down regulation of CAII is associated with tumor differentiation and poor prognosis in patients with pancreatic cancer. J Surg Oncol 107: 536-543. doi: 10.1002/jso.23282. go to article 3. Zhou R, Huang W, Yao Y, Wang Y, Li Z, et al. (2013) CA II, a potential biomarker by proteomic analysis, exerts significant inhibitory effect on the growth of colorectal cancer cells. Int J Oncol 43: 611-621. doi: 10.3892/ijo.2013.1972. go to article 4. Riafrecha LE, Rodriguez OM, Vullo D, Supuran CT, Colinas PA (2014) Attachment of carbohydrates to methoxyaryl moieties leads to highly selective inhibitors of the cancer associated carbonic anhydrase isoforms IX and XII. Bioorg Med Chem 22: 5308-5314. doi: 10.1016/j.bmc.2014.07.052. go to article 5. Soltysova A, Breza J, Takacova M, Feruszova J, Hudecova S, et al. (2015) Deregulation of energetic metabolism in the clear cell renal cell carcinoma: A multiple pathway analysis based on microarray profiling. Int J Oncol 47: 287-295. doi: 10.3892/ijo.2015.3014. go to article | |
| Top |
| Phenotypic Information for CA9(metabolism pathway, cancer, disease, phenome) |
| Cancer | CGAP: CA9 |
| Familial Cancer Database: CA9 | |
| * This gene is included in those cancer gene databases. |
|
|
|
|
|
|
| |||||||||||||||||||||||||||||||||||||||||||||||||||||||||||||||||||||||||||||||||||||||||||||||||||||||||||||||||||||||||||||||||||||||||||||||||||||||||||||||||||||||||||||||||||||||||||||||||||||||||||||||||||||||||||||||||||||||||||||||||||||||||||||||||||||||||||||||||||||||||||||||||||||||||||||||||||||||||||||||||||||||||||||||||||||||||||||||||||||
Oncogene 1 | Significant driver gene in | ||||||||||||||||||||||||||||||||||||||||||||||||||||||||||||||||||||||||||||||||||||||||||||||||||||||||||||||||||||||||||||||||||||||||||||||||||||||||||||||||||||||||||||||||||||||||||||||||||||||||||||||||||||||||||||||||||||||||||||||||||||||||||||||||||||||||||||||||||||||||||||||||||||||||||||||||||||||||||||||||||||||||||||||||||||||||||||||||||||||||||
| cf) number; DB name 1 Oncogene; http://nar.oxfordjournals.org/content/35/suppl_1/D721.long, 2 Tumor Suppressor gene; https://bioinfo.uth.edu/TSGene/, 3 Cancer Gene Census; http://www.nature.com/nrc/journal/v4/n3/abs/nrc1299.html, 4 CancerGenes; http://nar.oxfordjournals.org/content/35/suppl_1/D721.long, 5 Network of Cancer Gene; http://ncg.kcl.ac.uk/index.php, 1Therapeutic Vulnerabilities in Cancer; http://cbio.mskcc.org/cancergenomics/statius/ |
| KEGG_NITROGEN_METABOLISM | |
| OMIM | 603179; gene. |
| Orphanet | |
| Disease | KEGG Disease: CA9 |
| MedGen: CA9 (Human Medical Genetics with Condition) | |
| ClinVar: CA9 | |
| Phenotype | MGI: CA9 (International Mouse Phenotyping Consortium) |
| PhenomicDB: CA9 | |
| Mutations for CA9 |
| * Under tables are showing count per each tissue to give us broad intuition about tissue specific mutation patterns.You can go to the detailed page for each mutation database's web site. |
| - Statistics for Tissue and Mutation type | Top |
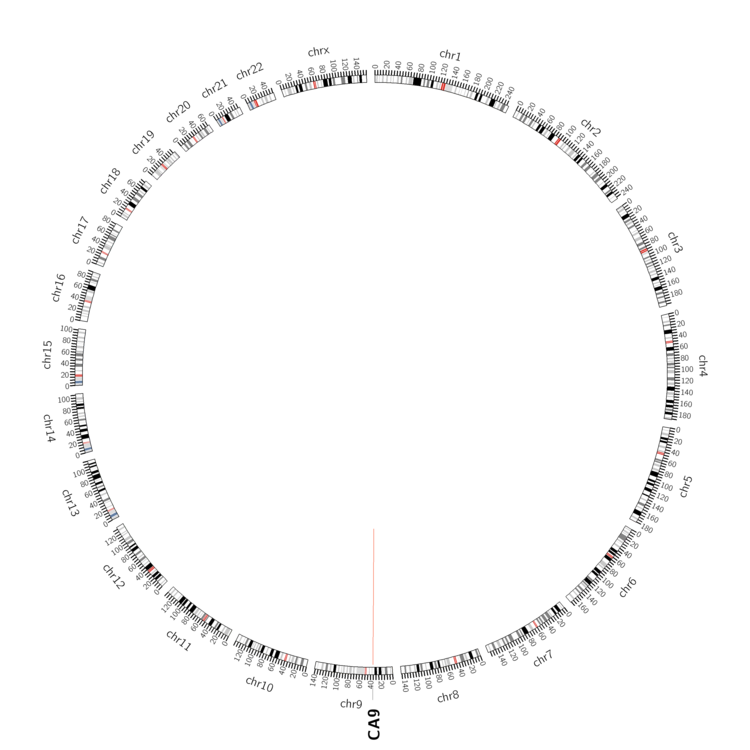 |
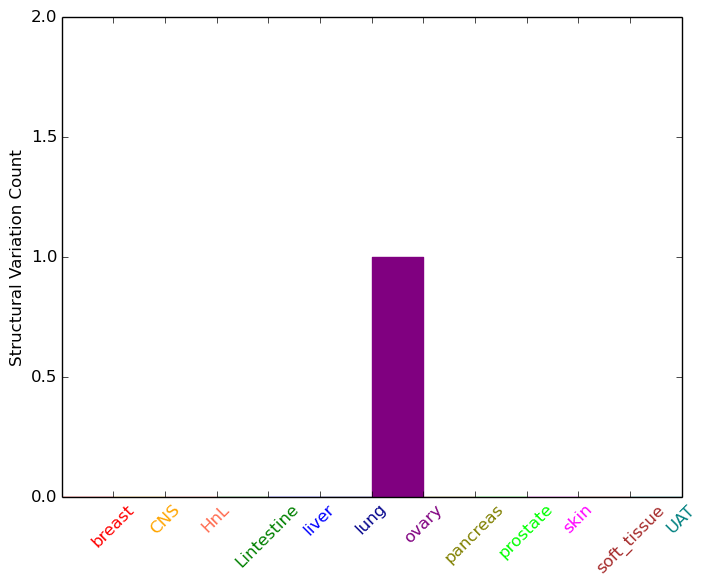
| - For Inter-chromosomal Variations |
| There's no inter-chromosomal structural variation. |
| - For Intra-chromosomal Variations |
| * Intra-chromosomal variantions includes 'intrachromosomal amplicon to amplicon', 'intrachromosomal amplicon to non-amplified dna', 'intrachromosomal deletion', 'intrachromosomal fold-back inversion', 'intrachromosomal inversion', 'intrachromosomal tandem duplication', 'Intrachromosomal unknown type', 'intrachromosomal with inverted orientation', 'intrachromosomal with non-inverted orientation'. |
 |
| Sample | Symbol_a | Chr_a | Start_a | End_a | Symbol_b | Chr_b | Start_b | End_b |
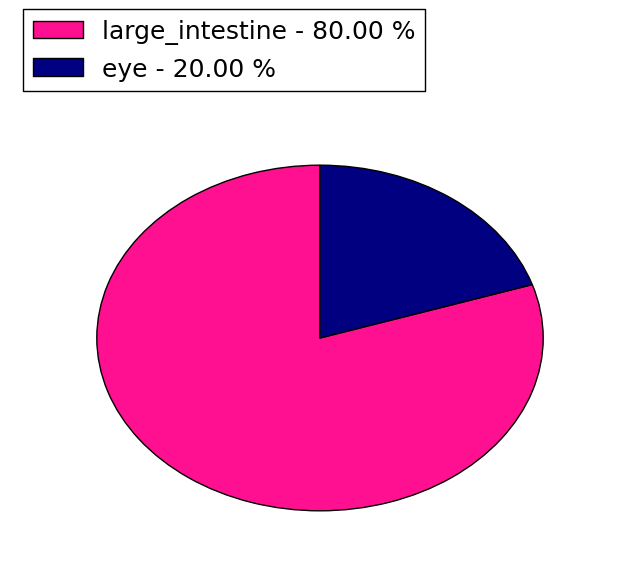
| ovary | CA9 | chr9 | 35676861 | 35676881 | chr9 | 35671879 | 35671899 |
| cf) Tissue number; Tissue name (1;Breast, 2;Central_nervous_system, 3;Haematopoietic_and_lymphoid_tissue, 4;Large_intestine, 5;Liver, 6;Lung, 7;Ovary, 8;Pancreas, 9;Prostate, 10;Skin, 11;Soft_tissue, 12;Upper_aerodigestive_tract) |
| * From mRNA Sanger sequences, Chitars2.0 arranged chimeric transcripts. This table shows CA9 related fusion information. |
| ID | Head Gene | Tail Gene | Accession | Gene_a | qStart_a | qEnd_a | Chromosome_a | tStart_a | tEnd_a | Gene_a | qStart_a | qEnd_a | Chromosome_a | tStart_a | tEnd_a |
| Top |
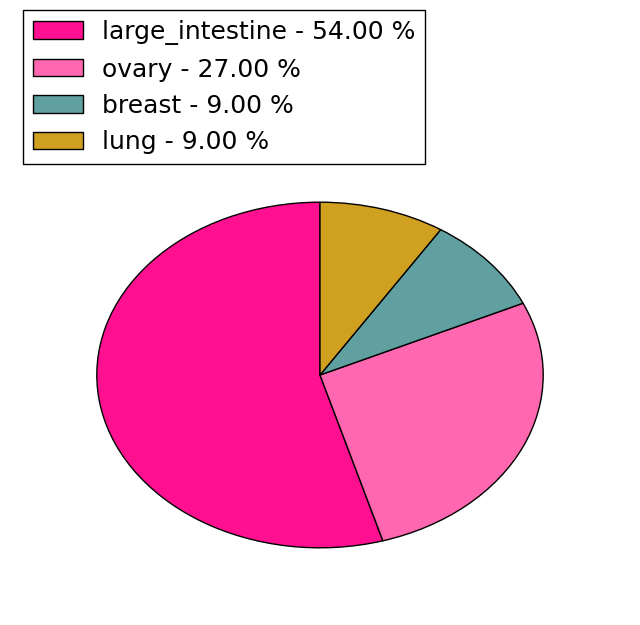
| Mutation type/ Tissue ID | brca | cns | cerv | endome | haematopo | kidn | Lintest | liver | lung | ns | ovary | pancre | prost | skin | stoma | thyro | urina | |||
| Total # sample | 1 | 1 | ||||||||||||||||||
| GAIN (# sample) | 1 | 1 | ||||||||||||||||||
| LOSS (# sample) |
| cf) Tissue ID; Tissue type (1; Breast, 2; Central_nervous_system, 3; Cervix, 4; Endometrium, 5; Haematopoietic_and_lymphoid_tissue, 6; Kidney, 7; Large_intestine, 8; Liver, 9; Lung, 10; NS, 11; Ovary, 12; Pancreas, 13; Prostate, 14; Skin, 15; Stomach, 16; Thyroid, 17; Urinary_tract) |
| Top |
|
 |
| Top |
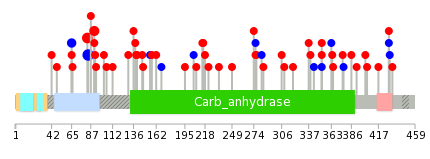
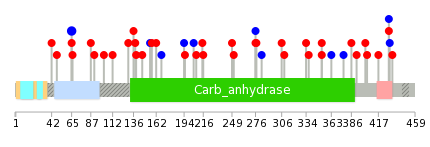
| Stat. for Non-Synonymous SNVs (# total SNVs=39) | (# total SNVs=11) |
 |  |
(# total SNVs=5) | (# total SNVs=0) |
 |
| Top |
| * When you move the cursor on each content, you can see more deailed mutation information on the Tooltip. Those are primary_site,primary_histology,mutation(aa),pubmedID. |
| GRCh37 position | Mutation(aa) | Unique sampleID count |
| chr9:35674208-35674208 | p.P84P | 6 |
| chr9:35674191-35674208 | p.G79_P84delGEEDLP | 5 |
| chr9:35674204-35674204 | p.L83P | 4 |
| chr9:35674228-35674228 | p.G91E | 3 |
| chr9:35674151-35674151 | p.L65L | 2 |
| chr9:35675549-35675549 | p.H140N | 1 |
| chr9:35679329-35679329 | p.S352I | 1 |
| chr9:35674098-35674098 | p.P48S | 1 |
| chr9:35676099-35676099 | p.G215S | 1 |
| chr9:35680762-35680762 | p.A417V | 1 |
| Top |
|
 |
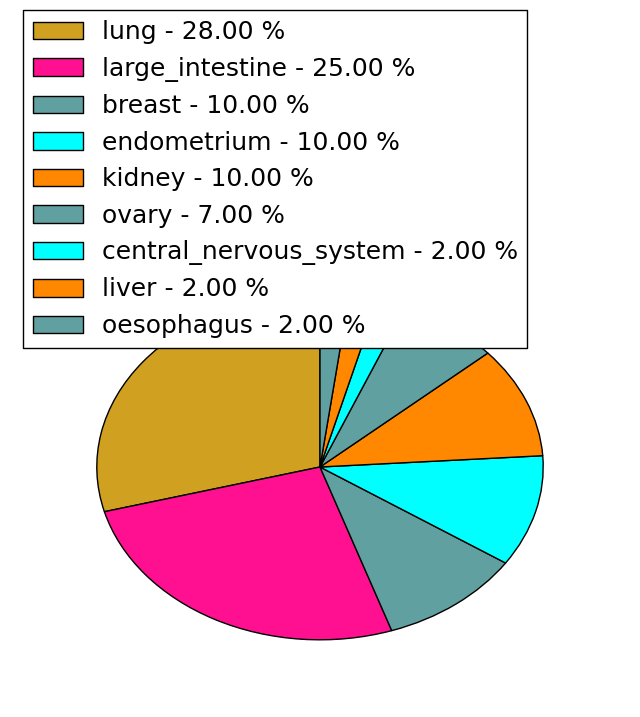
| Point Mutation/ Tissue ID | 1 | 2 | 3 | 4 | 5 | 6 | 7 | 8 | 9 | 10 | 11 | 12 | 13 | 14 | 15 | 16 | 17 | 18 | 19 | 20 |
| # sample | 1 | 3 | 12 | 1 | 1 | 5 | 1 | 5 | 1 | 7 | 5 | 3 | ||||||||
| # mutation | 1 | 3 | 12 | 1 | 1 | 5 | 1 | 5 | 1 | 9 | 5 | 3 | ||||||||
| nonsynonymous SNV | 1 | 3 | 7 | 1 | 1 | 5 | 1 | 3 | 1 | 6 | 4 | 3 | ||||||||
| synonymous SNV | 5 | 2 | 3 | 1 |
| cf) Tissue ID; Tissue type (1; BLCA[Bladder Urothelial Carcinoma], 2; BRCA[Breast invasive carcinoma], 3; CESC[Cervical squamous cell carcinoma and endocervical adenocarcinoma], 4; COAD[Colon adenocarcinoma], 5; GBM[Glioblastoma multiforme], 6; Glioma Low Grade, 7; HNSC[Head and Neck squamous cell carcinoma], 8; KICH[Kidney Chromophobe], 9; KIRC[Kidney renal clear cell carcinoma], 10; KIRP[Kidney renal papillary cell carcinoma], 11; LAML[Acute Myeloid Leukemia], 12; LUAD[Lung adenocarcinoma], 13; LUSC[Lung squamous cell carcinoma], 14; OV[Ovarian serous cystadenocarcinoma ], 15; PAAD[Pancreatic adenocarcinoma], 16; PRAD[Prostate adenocarcinoma], 17; SKCM[Skin Cutaneous Melanoma], 18:STAD[Stomach adenocarcinoma], 19:THCA[Thyroid carcinoma], 20:UCEC[Uterine Corpus Endometrial Carcinoma]) |
| Top |
| * We represented just top 10 SNVs. When you move the cursor on each content, you can see more deailed mutation information on the Tooltip. Those are primary_site, primary_histology, mutation(aa), pubmedID. |
| Genomic Position | Mutation(aa) | Unique sampleID count |
| chr9:35674151 | p.L65L | 2 |
| chr9:35676099 | p.P48S | 1 |
| chr9:35674098 | p.P168P | 1 |
| chr9:35679284 | p.A337V | 1 |
| chr9:35675547 | p.L65Q | 1 |
| chr9:35680799 | p.R194R | 1 |
| chr9:35676103 | p.S352G | 1 |
| chr9:35674150 | p.L195R | 1 |
| chr9:35679328 | p.S352I | 1 |
| chr9:35675761 | p.P66S | 1 |
| * Copy number data were extracted from TCGA using R package TCGA-Assembler. The URLs of all public data files on TCGA DCC data server were gathered on Jan-05-2015. Function ProcessCNAData in TCGA-Assembler package was used to obtain gene-level copy number value which is calculated as the average copy number of the genomic region of a gene. |
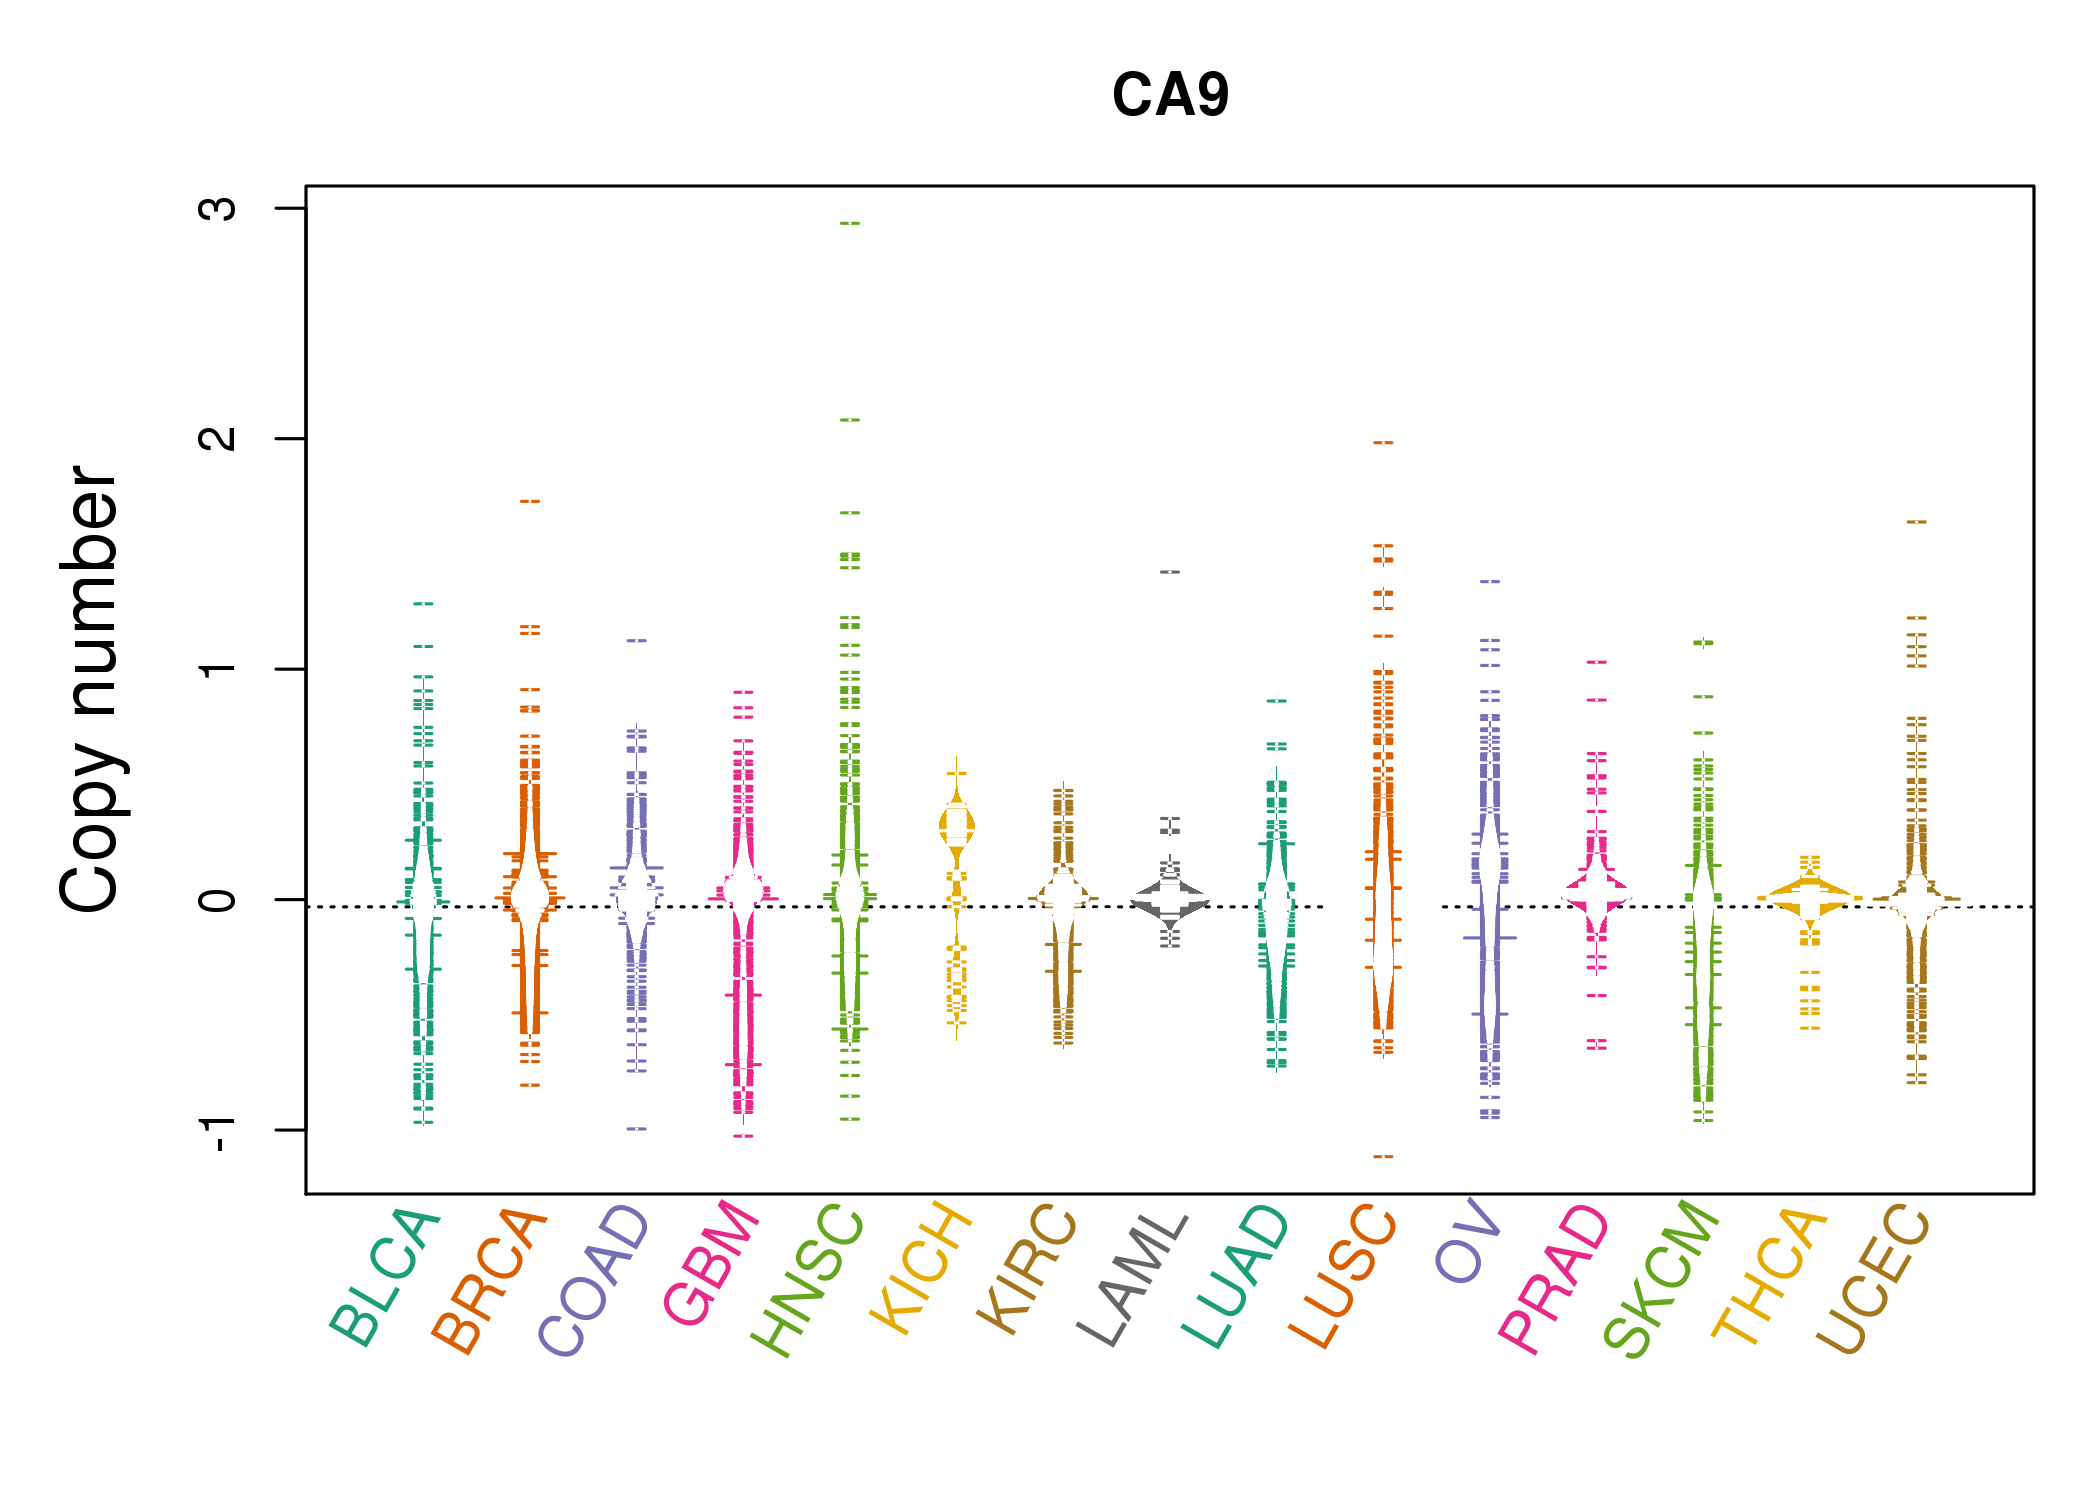 |
| cf) Tissue ID[Tissue type]: BLCA[Bladder Urothelial Carcinoma], BRCA[Breast invasive carcinoma], CESC[Cervical squamous cell carcinoma and endocervical adenocarcinoma], COAD[Colon adenocarcinoma], GBM[Glioblastoma multiforme], Glioma Low Grade, HNSC[Head and Neck squamous cell carcinoma], KICH[Kidney Chromophobe], KIRC[Kidney renal clear cell carcinoma], KIRP[Kidney renal papillary cell carcinoma], LAML[Acute Myeloid Leukemia], LUAD[Lung adenocarcinoma], LUSC[Lung squamous cell carcinoma], OV[Ovarian serous cystadenocarcinoma ], PAAD[Pancreatic adenocarcinoma], PRAD[Prostate adenocarcinoma], SKCM[Skin Cutaneous Melanoma], STAD[Stomach adenocarcinoma], THCA[Thyroid carcinoma], UCEC[Uterine Corpus Endometrial Carcinoma] |
| Top |
| Gene Expression for CA9 |
| * CCLE gene expression data were extracted from CCLE_Expression_Entrez_2012-10-18.res: Gene-centric RMA-normalized mRNA expression data. |
 |
| * Normalized gene expression data of RNASeqV2 was extracted from TCGA using R package TCGA-Assembler. The URLs of all public data files on TCGA DCC data server were gathered at Jan-05-2015. Only eight cancer types have enough normal control samples for differential expression analysis. (t test, adjusted p<0.05 (using Benjamini-Hochberg FDR)) |
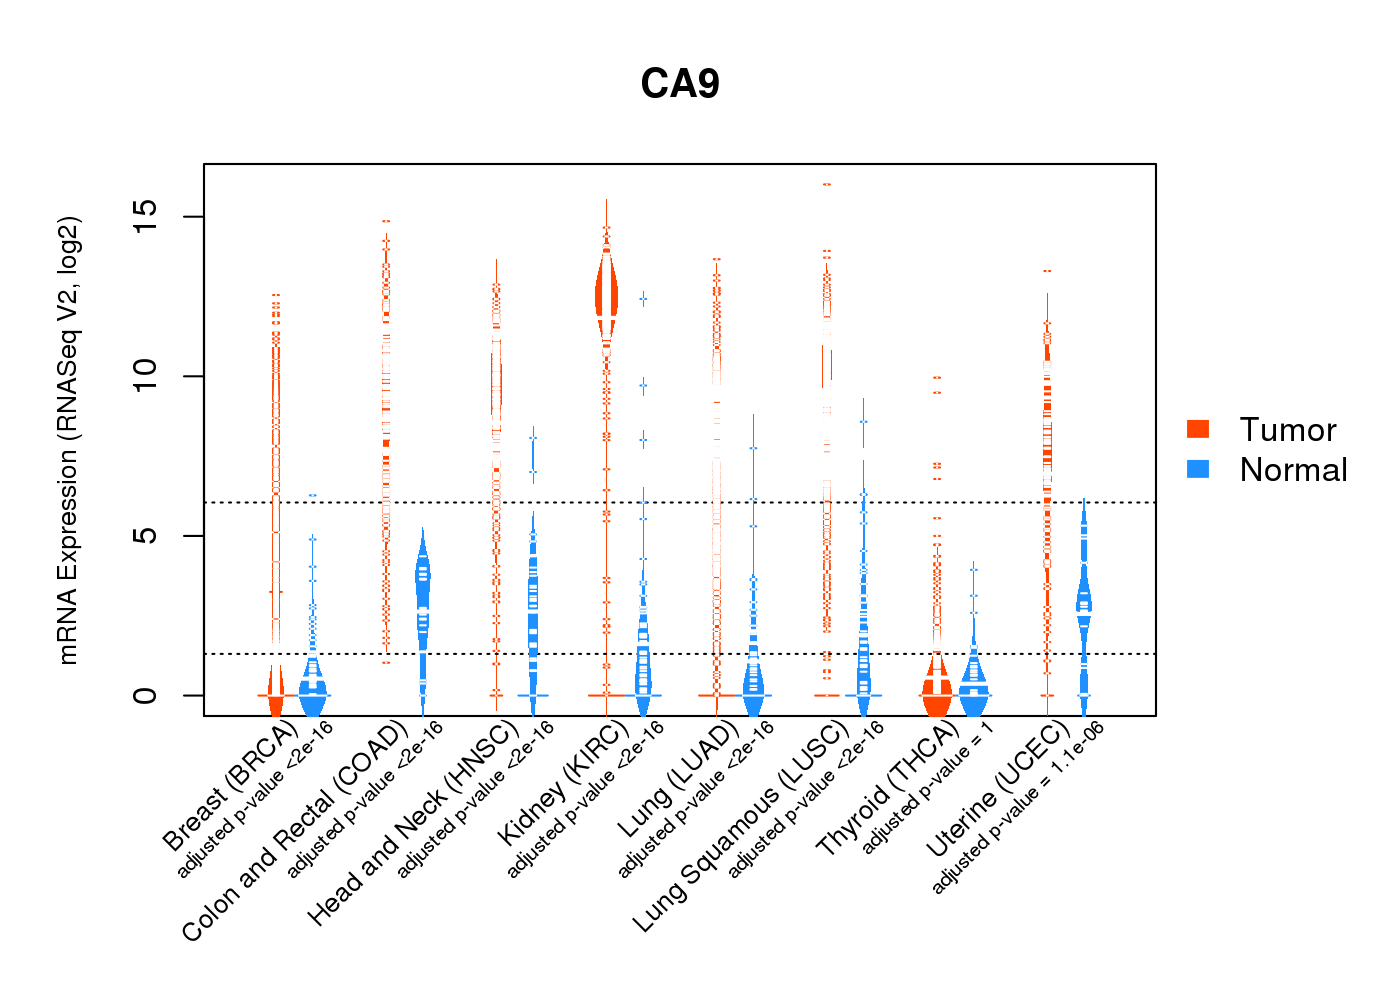 |
| Top |
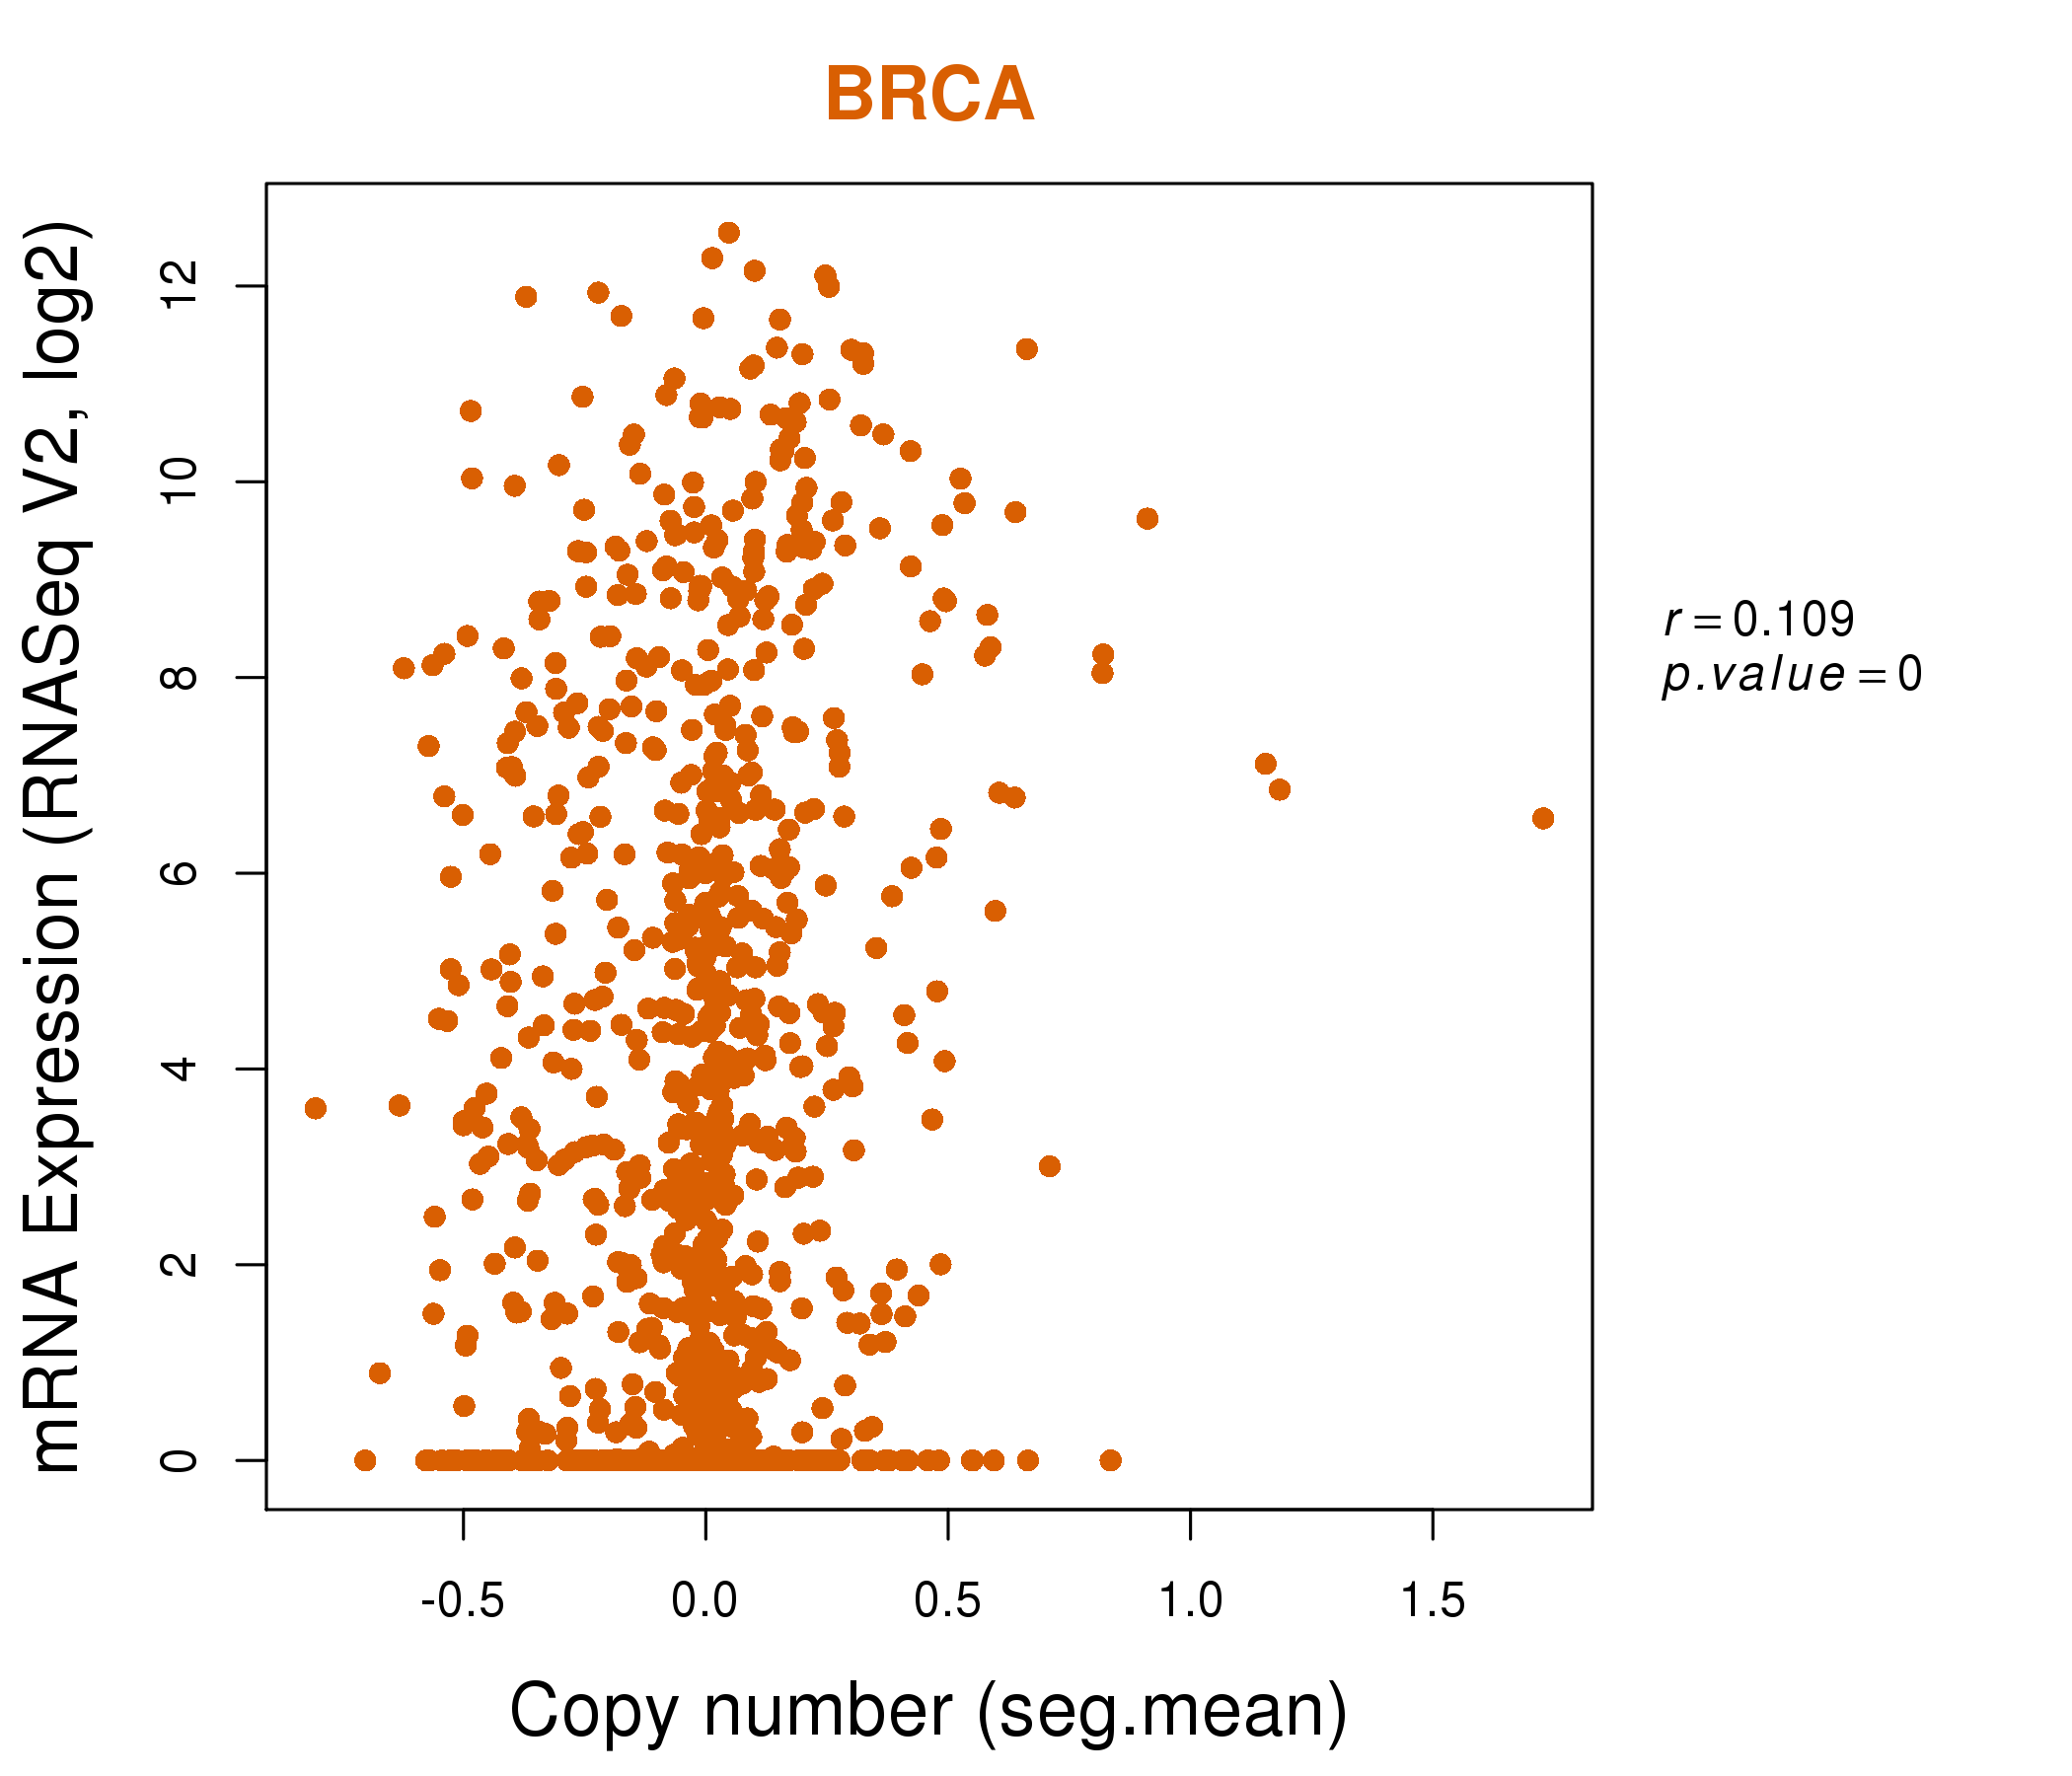
| * This plots show the correlation between CNV and gene expression. |
: Open all plots for all cancer types
 |
|
 |
|

| Top |
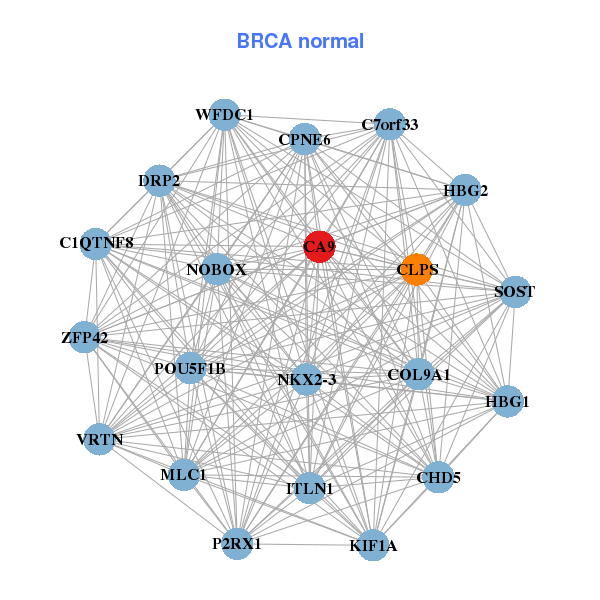
| Gene-Gene Network Information |
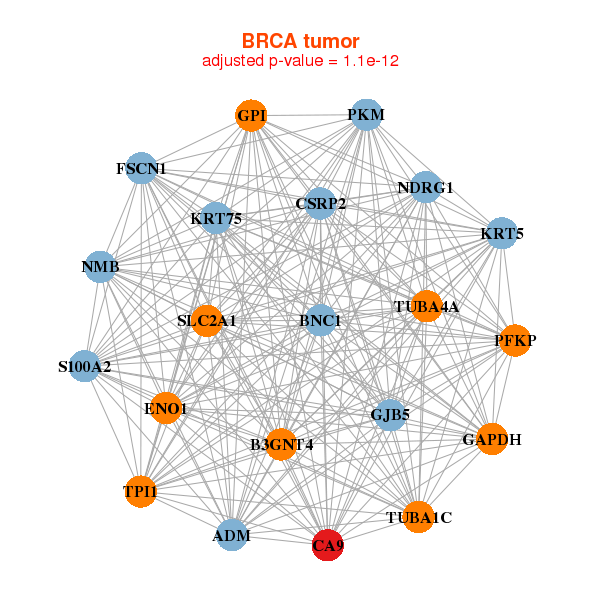
| * Co-Expression network figures were drawn using R package igraph. Only the top 20 genes with the highest correlations were shown. Red circle: input gene, orange circle: cell metabolism gene, sky circle: other gene |
: Open all plots for all cancer types
 |
| ||||
| ADM,B3GNT4,BNC1,CA9,CSRP2,ENO1,FSCN1, GAPDH,GJB5,GPI,KRT5,KRT75,NDRG1,NMB, PFKP,PKM,S100A2,SLC2A1,TPI1,TUBA1C,TUBA4A | VRTN,C1QTNF8,C7orf33,CA9,CHD5,CLPS,COL9A1, CPNE6,DRP2,HBG1,HBG2,ITLN1,KIF1A,MLC1, NKX2-3,NOBOX,P2RX1,POU5F1B,SOST,WFDC1,ZFP42 | ||||
 |
| ||||
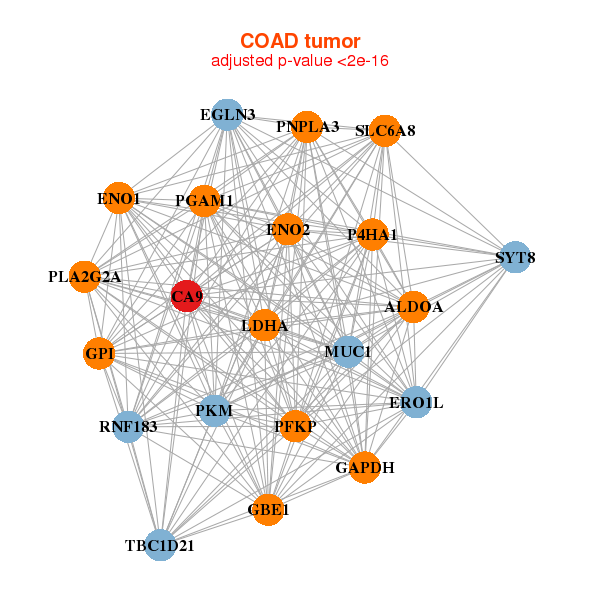
| ALDOA,CA9,EGLN3,ENO1,ENO2,ERO1L,GAPDH, GBE1,GPI,LDHA,MUC1,P4HA1,PFKP,PGAM1, PKM,PLA2G2A,PNPLA3,RNF183,SLC6A8,SYT8,TBC1D21 | ASPDH,TMEM252,CA9,CLDN15,CPS1,DAK,DEFA5, DEFA6,DPEP1,FBP1,GGN,KDM8,KHK,OTC, PDZD7,PRSS1,REG3A,SLC10A2,SULT2B1,TBX3,TTC36 |
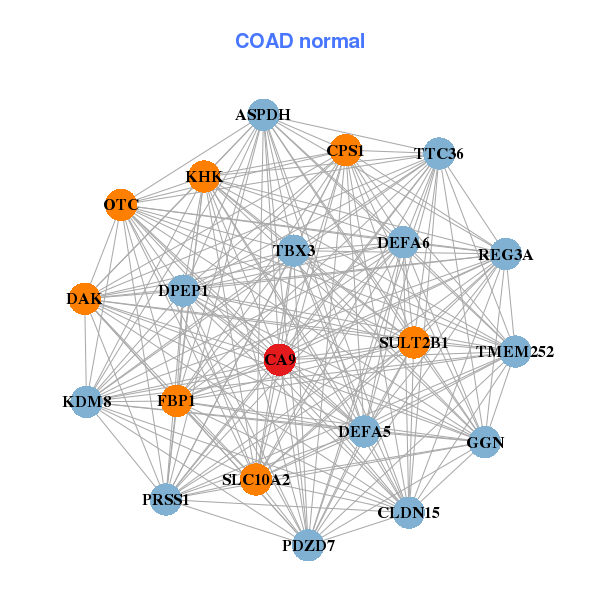
| * Co-Expression network figures were drawn using R package igraph. Only the top 20 genes with the highest correlations were shown. Red circle: input gene, orange circle: cell metabolism gene, sky circle: other gene |
: Open all plots for all cancer types
| Top |
: Open all interacting genes' information including KEGG pathway for all interacting genes from DAVID
| Top |
| Pharmacological Information for CA9 |
| DB Category | DB Name | DB's ID and Url link |
| Chemistry | BindingDB | Q16790; -. |
| Chemistry | ChEMBL | CHEMBL2095180; -. |
| Organism-specific databases | PharmGKB | PA25998; -. |
| Organism-specific databases | CTD | 768; -. |
| * Gene Centered Interaction Network. |
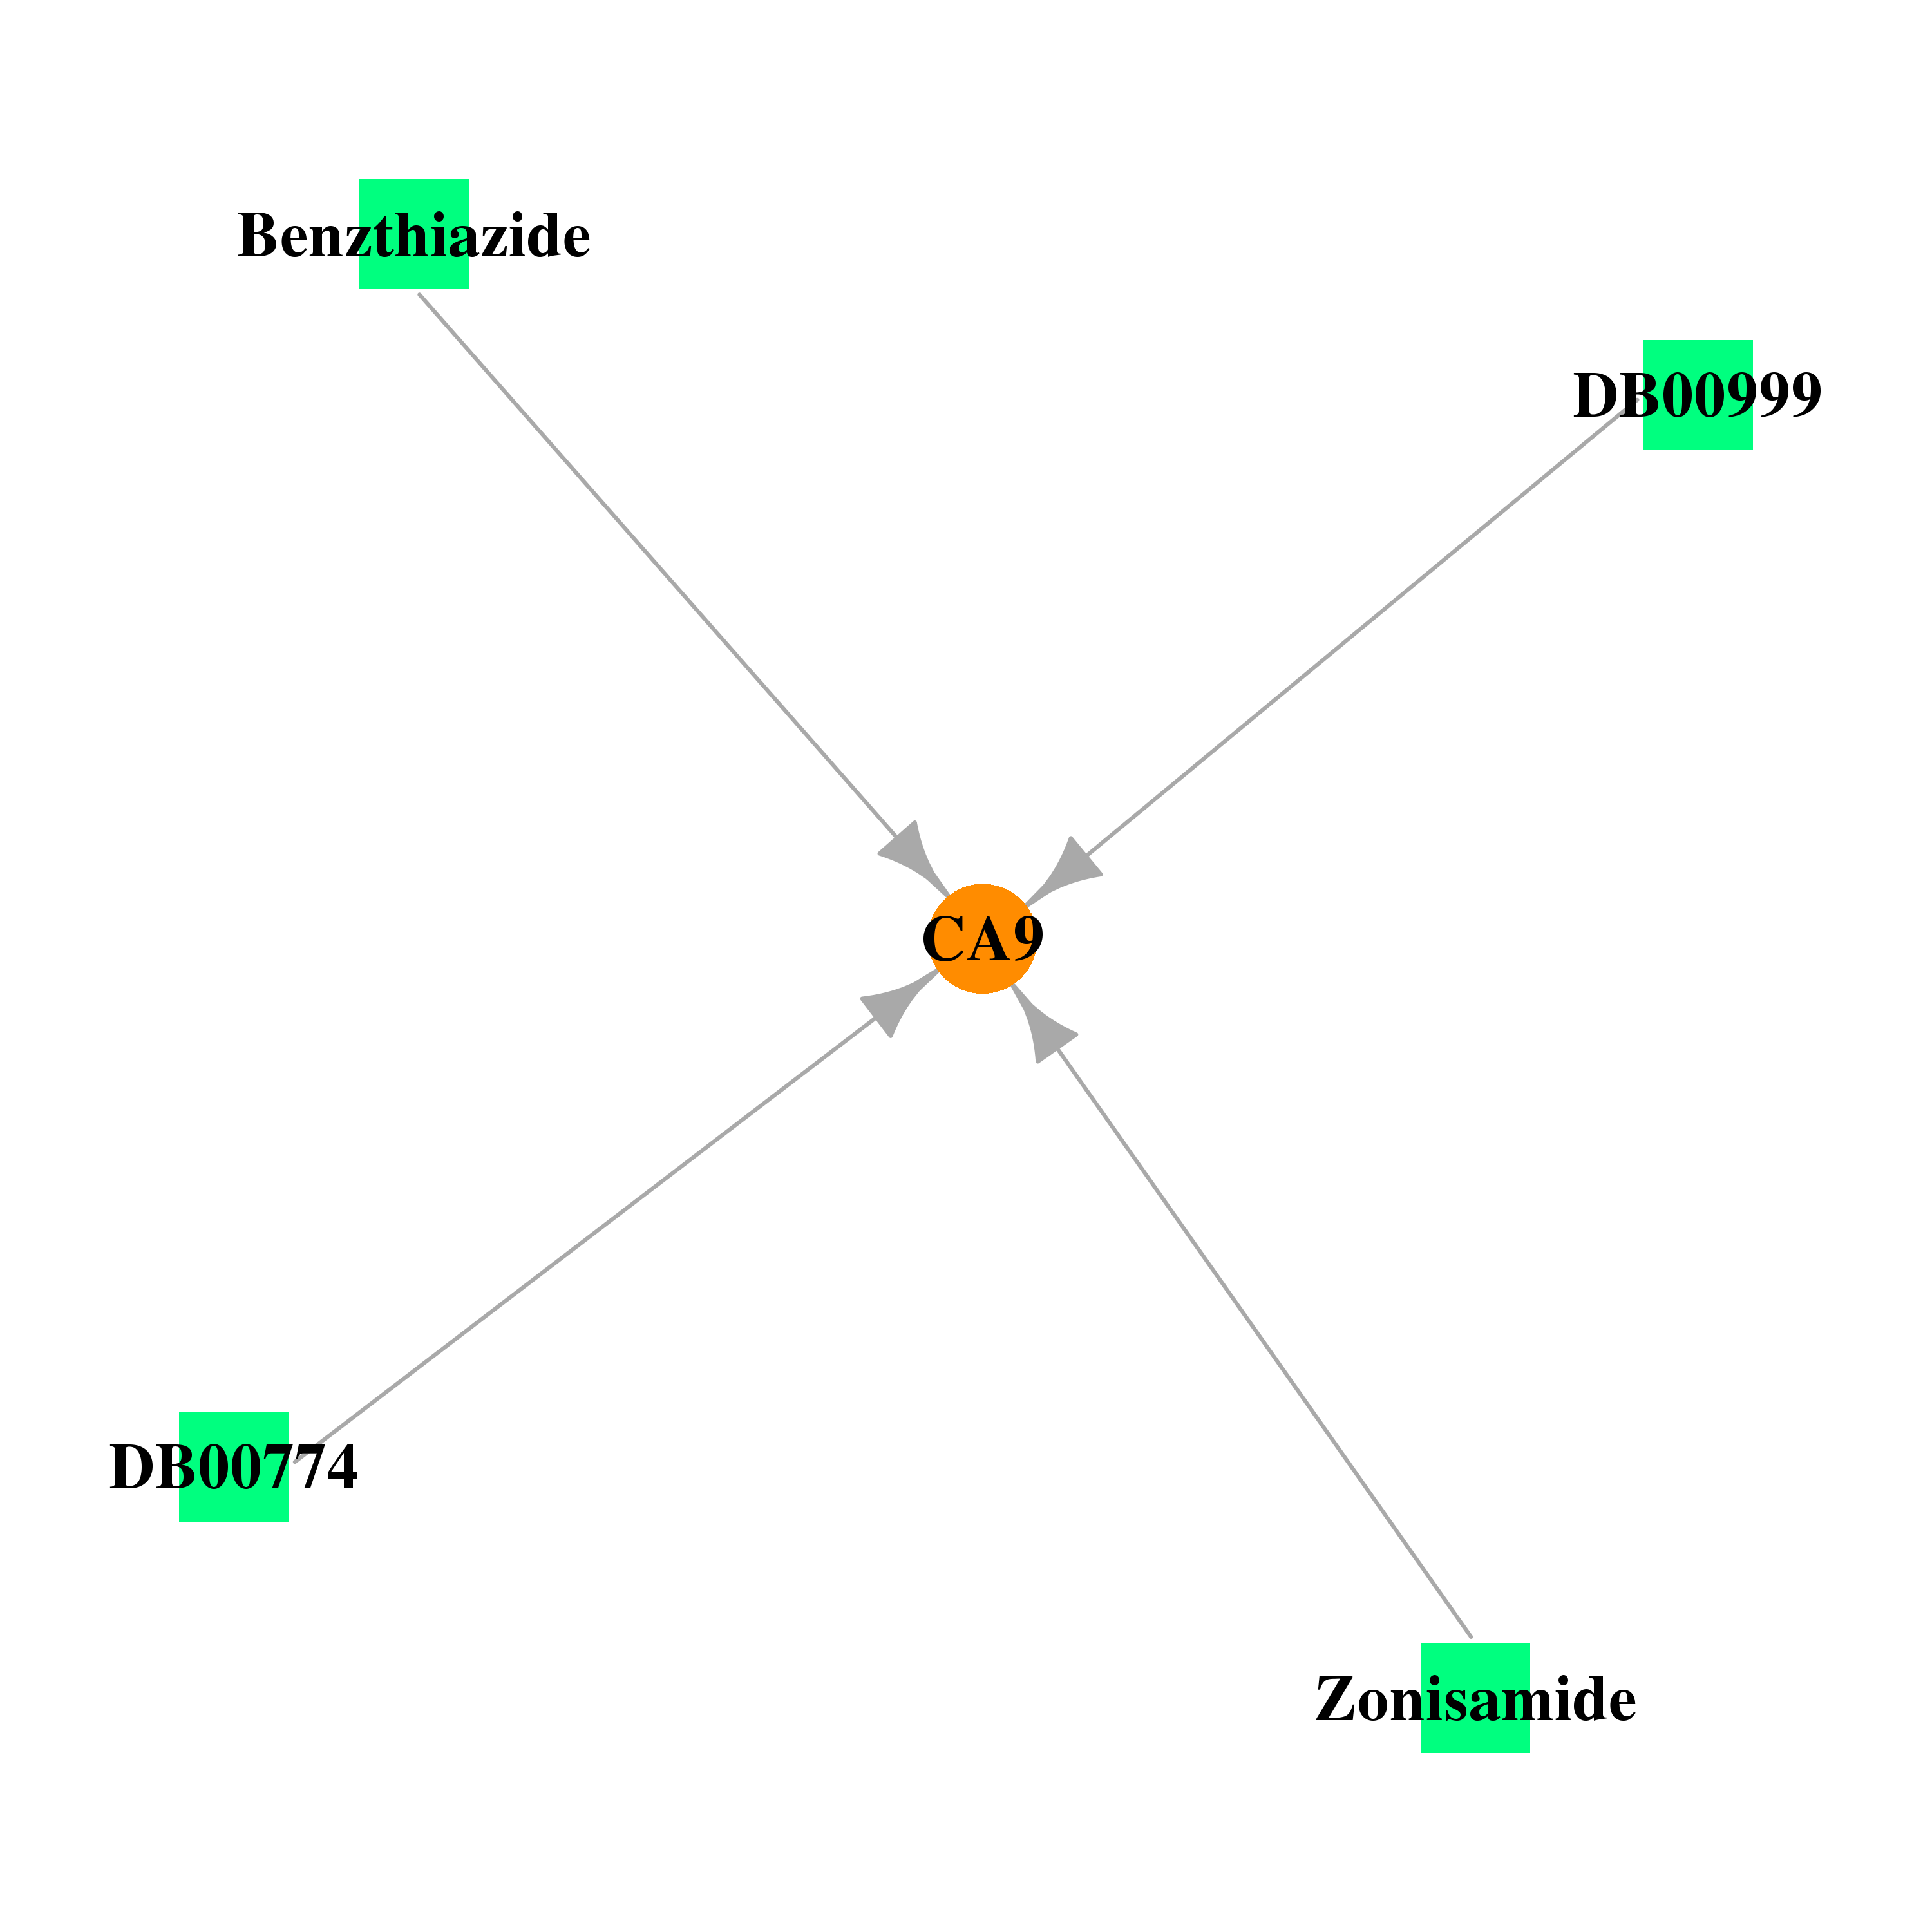 |
| * Drug Centered Interaction Network. |
| DrugBank ID | Target Name | Drug Groups | Generic Name | Drug Centered Network | Drug Structure |
| DB00562 | carbonic anhydrase IX | approved | Benzthiazide |  | 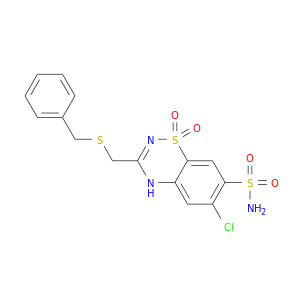 |
| DB00774 | carbonic anhydrase IX | approved | Hydroflumethiazide | 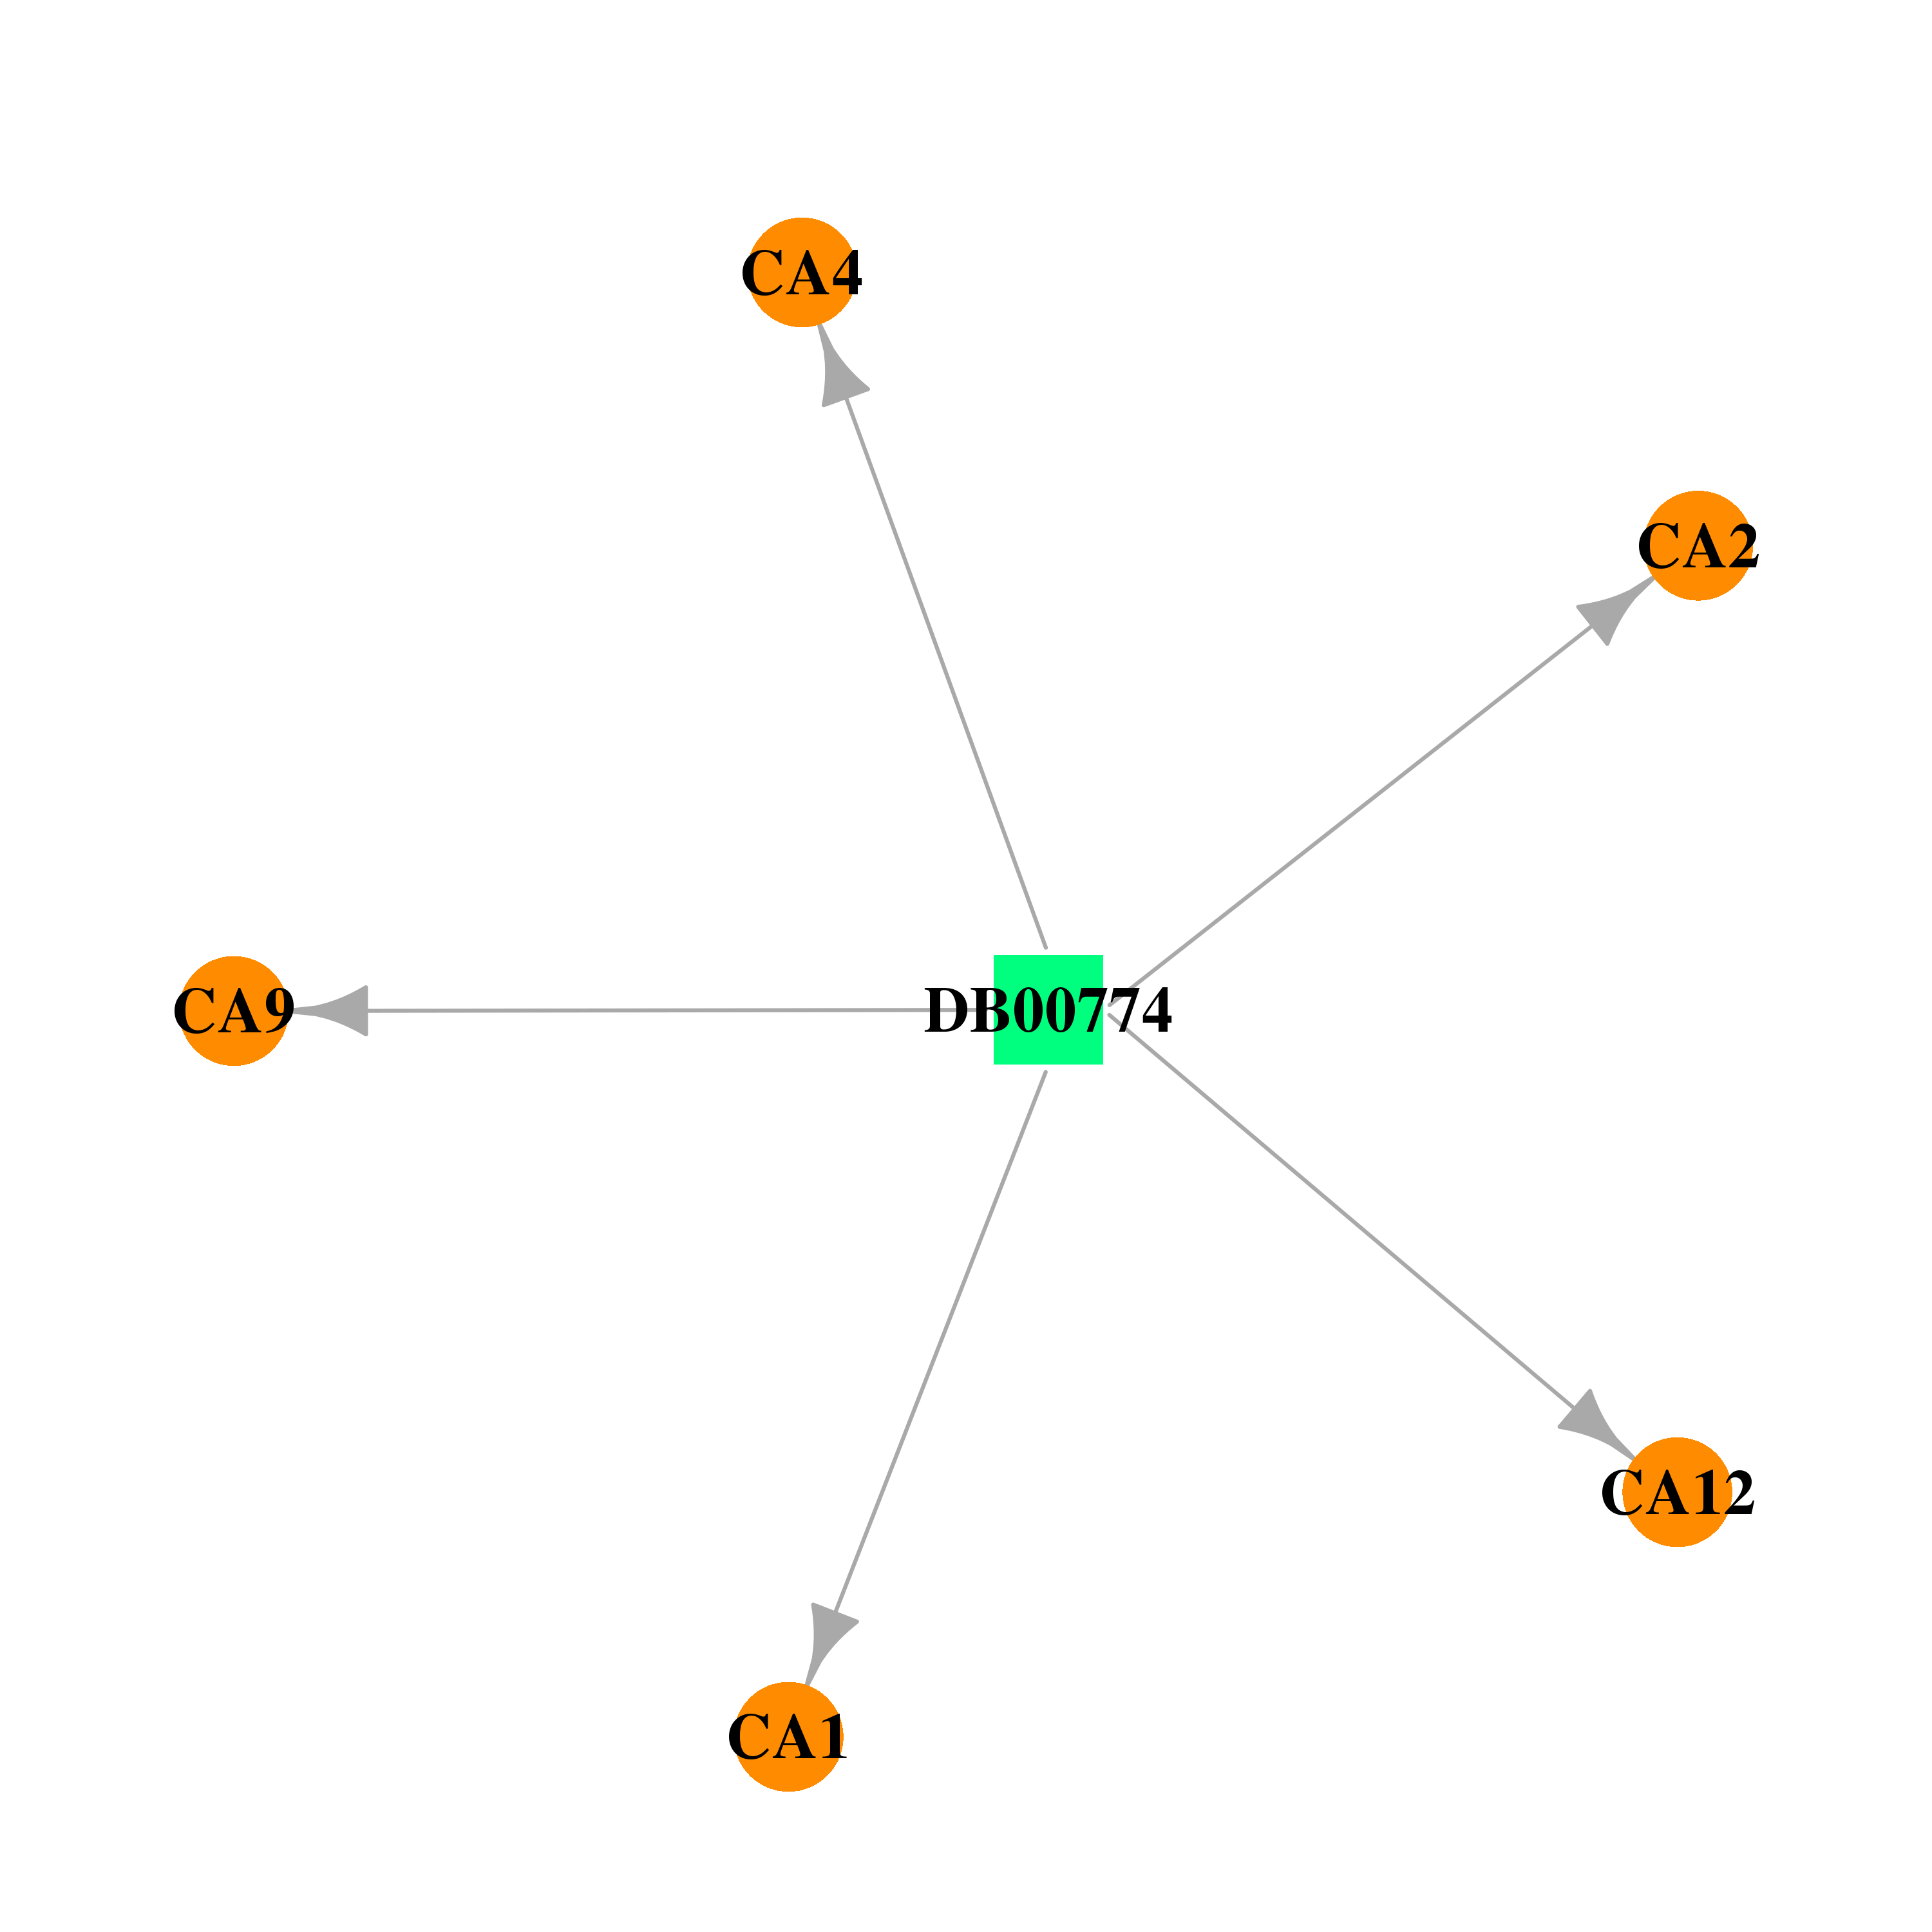 | 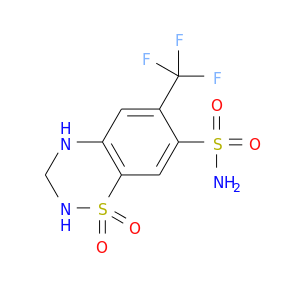 |
| DB00909 | carbonic anhydrase IX | approved; investigational | Zonisamide | 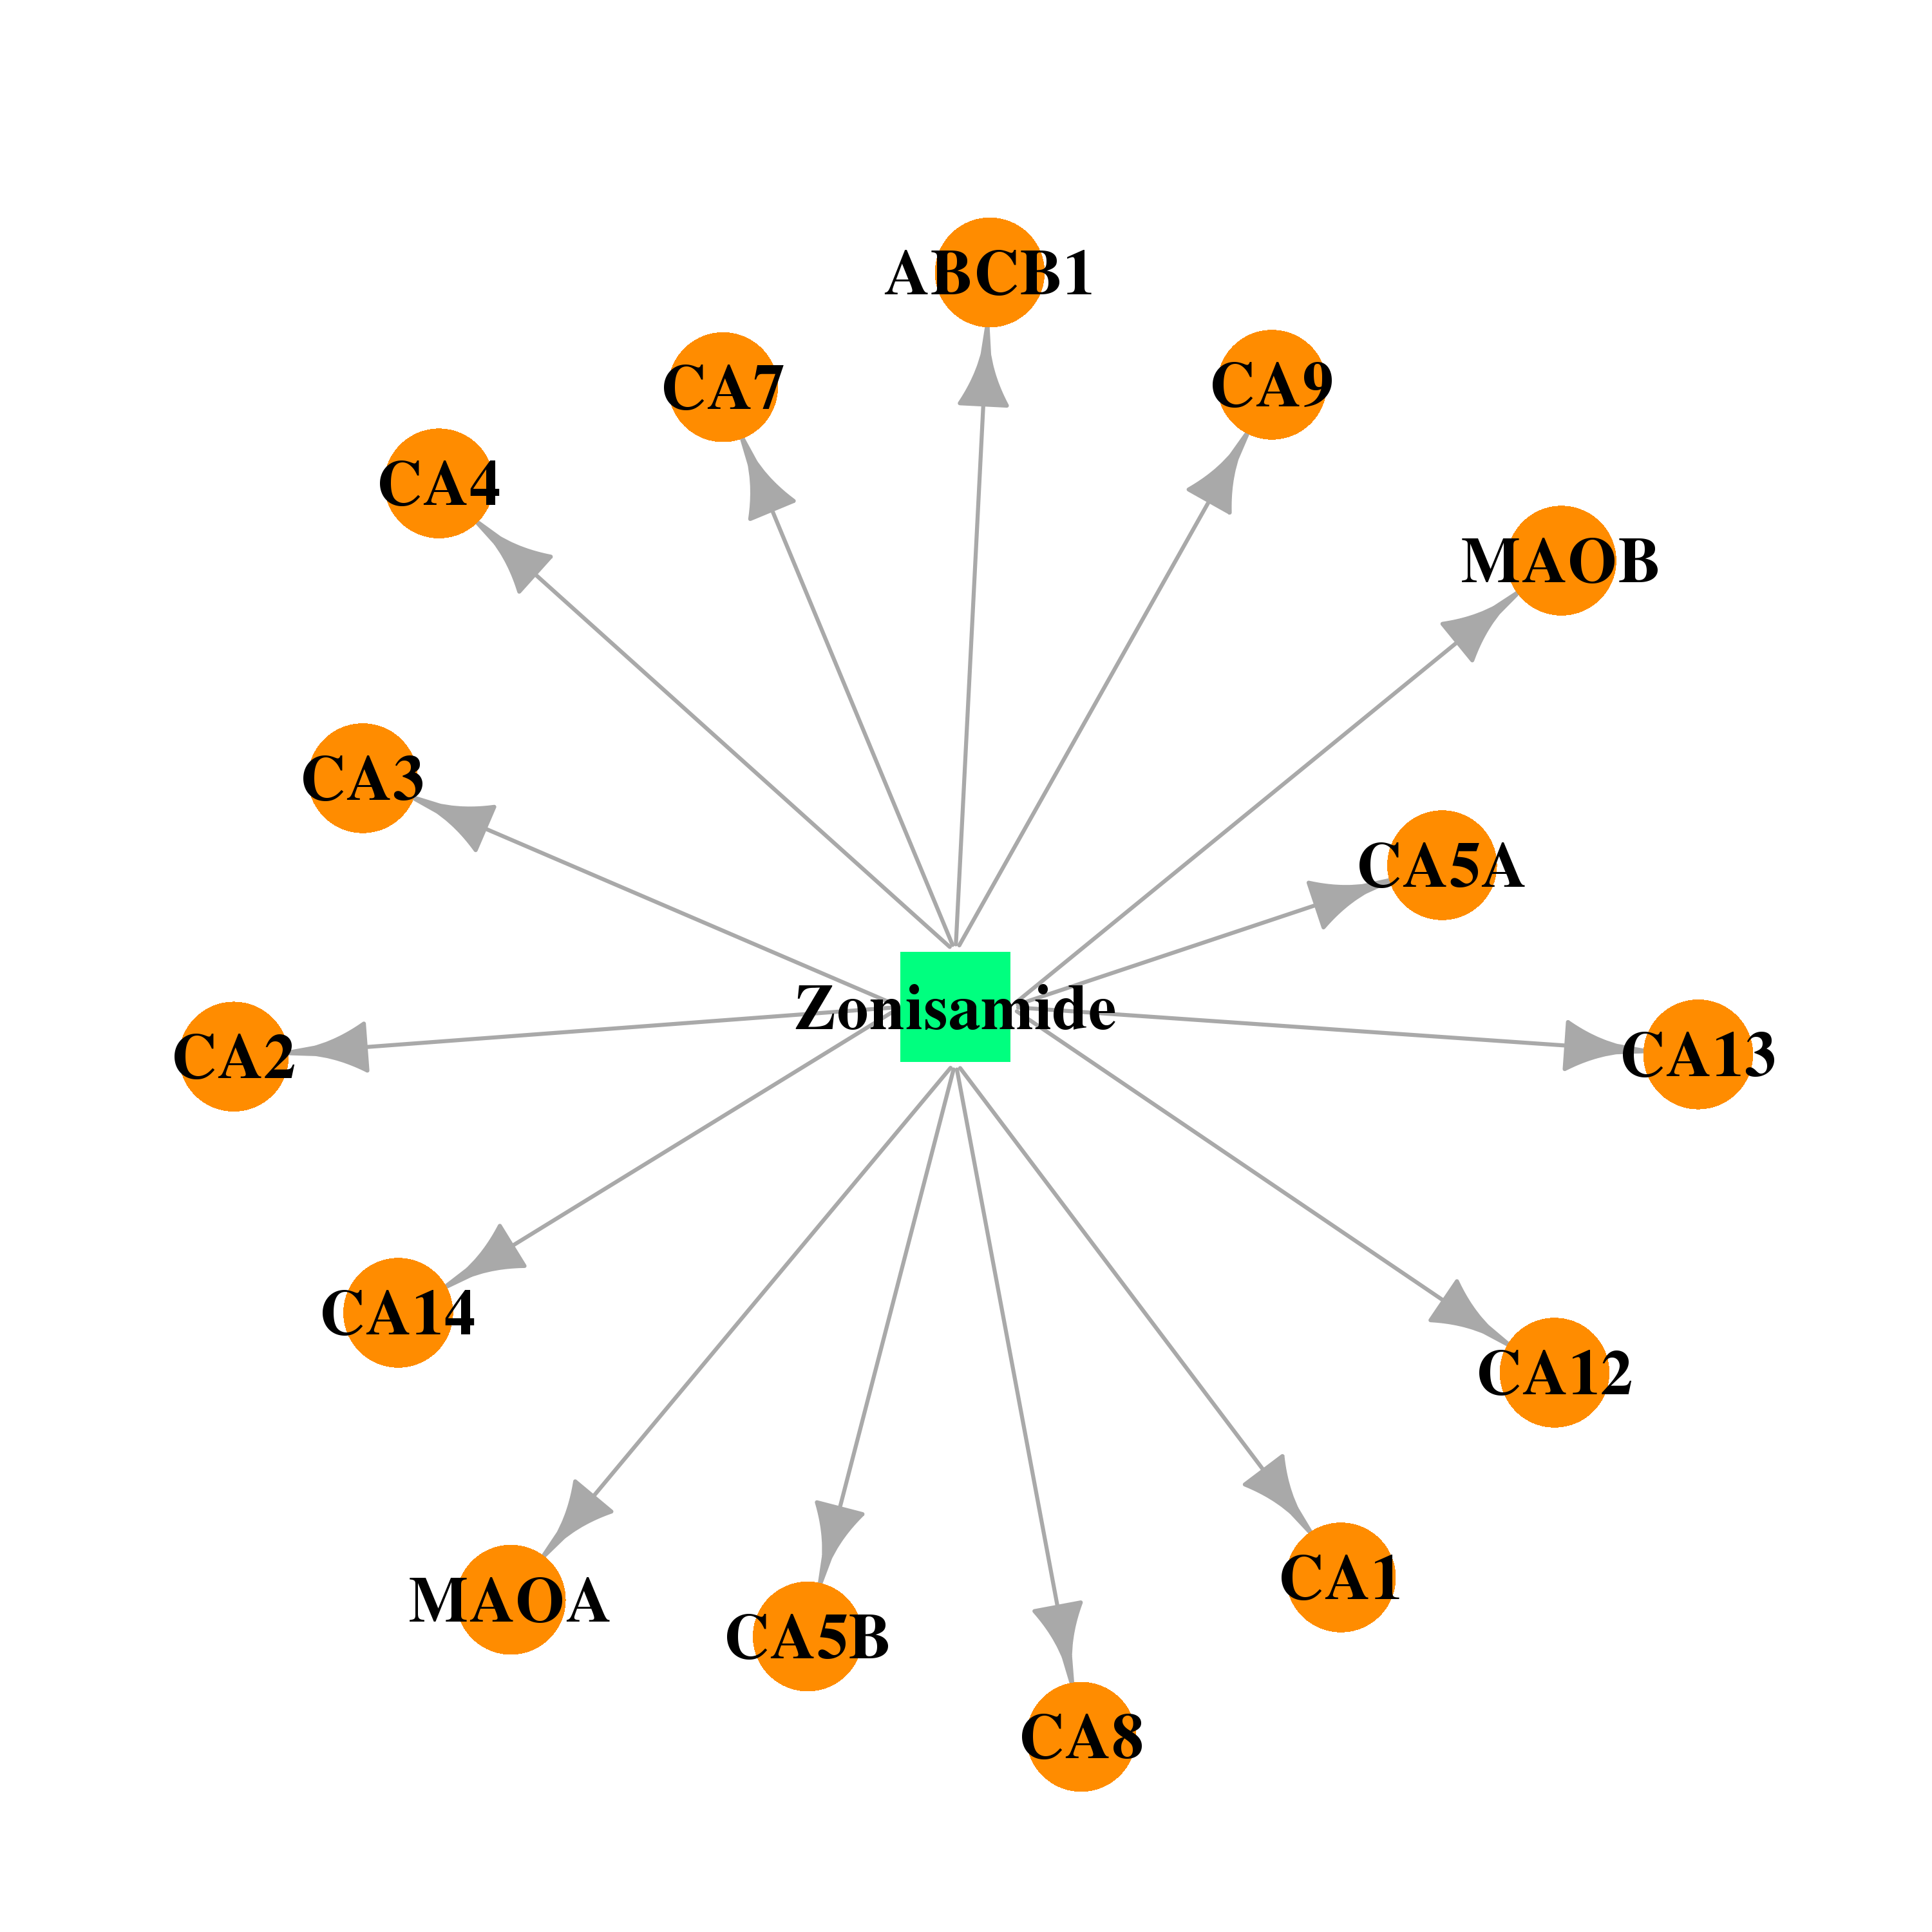 |  |
| DB00999 | carbonic anhydrase IX | approved | Hydrochlorothiazide | 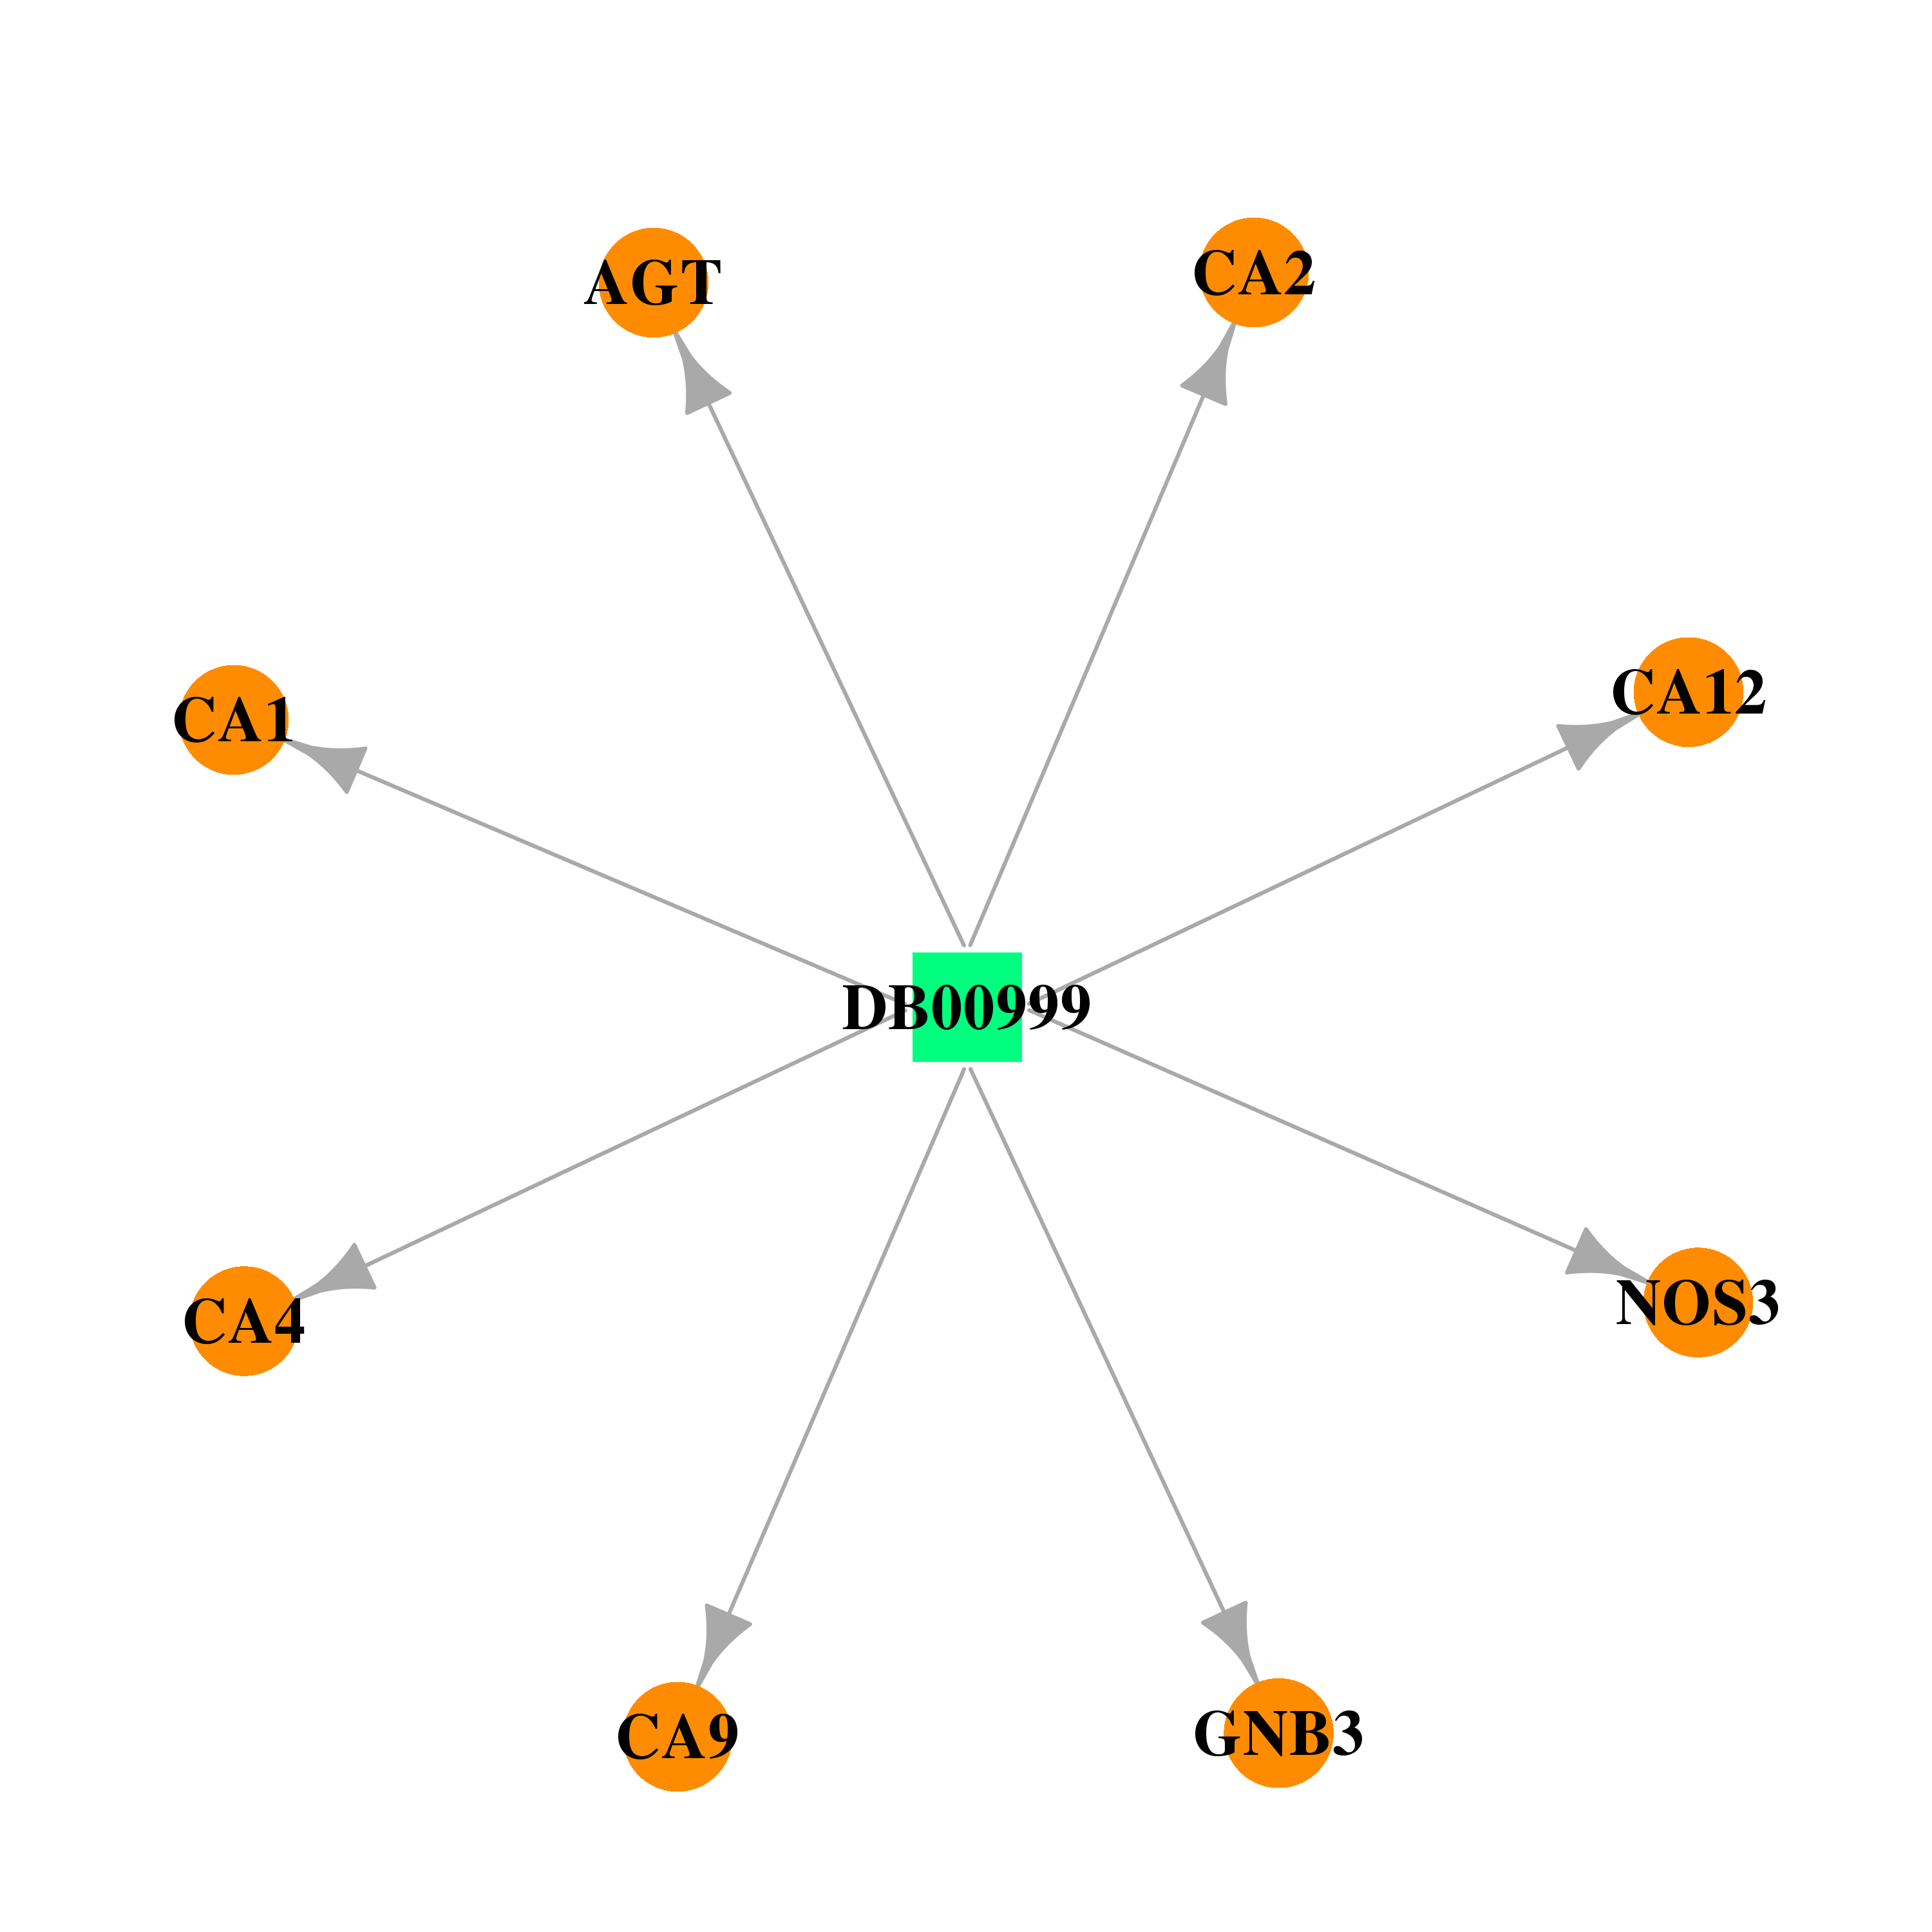 | 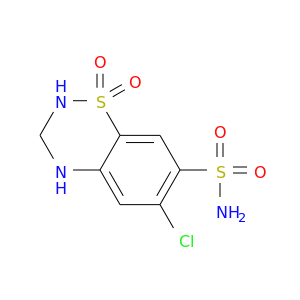 |
| Top |
| Cross referenced IDs for CA9 |
| * We obtained these cross-references from Uniprot database. It covers 150 different DBs, 18 categories. http://www.uniprot.org/help/cross_references_section |
: Open all cross reference information
|
Copyright © 2016-Present - The Univsersity of Texas Health Science Center at Houston @ |