|
||||||||||||||||||||||||||||||||||||||||||||||||||||||||||||||||||||||||||||||||||||||||||||||||||||||||||||||||||||||||||||||||||||||||||||||||||||||||||||||||||||||||||||||||||||||||||||||||||||||||||||||||||||||||||||||||||||||||||||||||||||||||||||||||||||||||||||||||||||||||||||||||||||||||||||||||||||||||||||||||||||||||||||||||||||||||||||||||||||||||||||||
| |
| Phenotypic Information (metabolism pathway, cancer, disease, phenome) |
| |
| |
| Gene-Gene Network Information: Co-Expression Network, Interacting Genes & KEGG |
| |
|


| Gene Summary for CA12 |
| Basic gene info. | Gene symbol | CA12 |
| Gene name | carbonic anhydrase XII | |
| Synonyms | CAXII|HsT18816 | |
| Cytomap | UCSC genome browser: 15q22 | |
| Genomic location | chr15 :63615729-63674075 | |
| Type of gene | protein-coding | |
| RefGenes | NM_001218.4, NM_001293642.1,NM_206925.2, | |
| Ensembl id | ENSG00000074410 | |
| Description | CA-XIIcarbonate dehydratase XIIcarbonic anhydrase 12carbonic dehydratasetumor antigen HOM-RCC-3.1.3 | |
| Modification date | 20141207 | |
| dbXrefs | MIM : 603263 | |
| HGNC : HGNC | ||
| HPRD : 04464 | ||
| Protein | UniProt: O43570 go to UniProt's Cross Reference DB Table | |
| Expression | CleanEX: HS_CA12 | |
| BioGPS: 771 | ||
| Gene Expression Atlas: ENSG00000074410 | ||
| The Human Protein Atlas: ENSG00000074410 | ||
| Pathway | NCI Pathway Interaction Database: CA12 | |
| KEGG: CA12 | ||
| REACTOME: CA12 | ||
| ConsensusPathDB | ||
| Pathway Commons: CA12 | ||
| Metabolism | MetaCyc: CA12 | |
| HUMANCyc: CA12 | ||
| Regulation | Ensembl's Regulation: ENSG00000074410 | |
| miRBase: chr15 :63,615,729-63,674,075 | ||
| TargetScan: NM_001218 | ||
| cisRED: ENSG00000074410 | ||
| Context | iHOP: CA12 | |
| cancer metabolism search in PubMed: CA12 | ||
| UCL Cancer Institute: CA12 | ||
| Assigned class in ccmGDB | A - This gene has a literature evidence and it belongs to cancer gene. | |
| References showing role of CA12 in cancer cell metabolism | 1. Wykoff CC, Beasley NJ, Watson PH, Turner KJ, Pastorek J, et al. (2000) Hypoxia-inducible expression of tumor-associated carbonic anhydrases. Cancer Res 60: 7075-7083. go to article 2. Tozlu S, Girault I, Vacher S, Vendrell J, Andrieu C, et al. (2006) Identification of novel genes that co-cluster with estrogen receptor alpha in breast tumor biopsy specimens, using a large-scale real-time reverse transcription-PCR approach. Endocr Relat Cancer 13: 1109-1120. doi: 10.1677/erc.1.01120. go to article | |
| Top |
| Phenotypic Information for CA12(metabolism pathway, cancer, disease, phenome) |
| Cancer | CGAP: CA12 |
| Familial Cancer Database: CA12 | |
| * This gene is included in those cancer gene databases. |
|
|
|
|
|
|
| ||||||||||||||||||||||||||||||||||||||||||||||||||||||||||||||||||||||||||||||||||||||||||||||||||||||||||||||||||||||||||||||||||||||||||||||||||||||||||||||||||||||||||||||||||||||||||||||||||||||||||||||||||||||||||||||||||||||||||||||||||||||||||||||||||||||||||||||||||||||||||||||||||||||||||||||||||||||||||||||||||||||||||||||||||||||||||||||||||||||||
Oncogene 1 | Significant driver gene in | |||||||||||||||||||||||||||||||||||||||||||||||||||||||||||||||||||||||||||||||||||||||||||||||||||||||||||||||||||||||||||||||||||||||||||||||||||||||||||||||||||||||||||||||||||||||||||||||||||||||||||||||||||||||||||||||||||||||||||||||||||||||||||||||||||||||||||||||||||||||||||||||||||||||||||||||||||||||||||||||||||||||||||||||||||||||||||||||||||||||||||||
| cf) number; DB name 1 Oncogene; http://nar.oxfordjournals.org/content/35/suppl_1/D721.long, 2 Tumor Suppressor gene; https://bioinfo.uth.edu/TSGene/, 3 Cancer Gene Census; http://www.nature.com/nrc/journal/v4/n3/abs/nrc1299.html, 4 CancerGenes; http://nar.oxfordjournals.org/content/35/suppl_1/D721.long, 5 Network of Cancer Gene; http://ncg.kcl.ac.uk/index.php, 1Therapeutic Vulnerabilities in Cancer; http://cbio.mskcc.org/cancergenomics/statius/ |
| KEGG_NITROGEN_METABOLISM | |
| OMIM | 143860; phenotype. 603263; gene. |
| Orphanet | |
| Disease | KEGG Disease: CA12 |
| MedGen: CA12 (Human Medical Genetics with Condition) | |
| ClinVar: CA12 | |
| Phenotype | MGI: CA12 (International Mouse Phenotyping Consortium) |
| PhenomicDB: CA12 | |
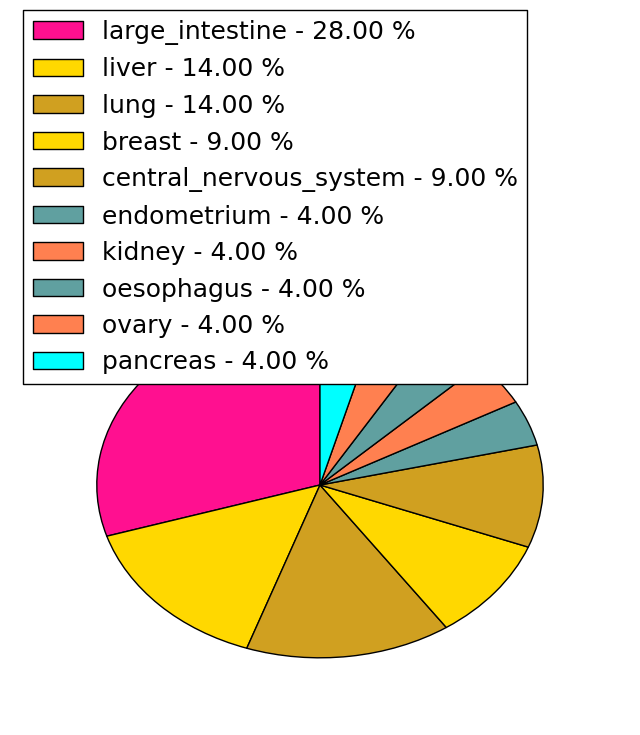
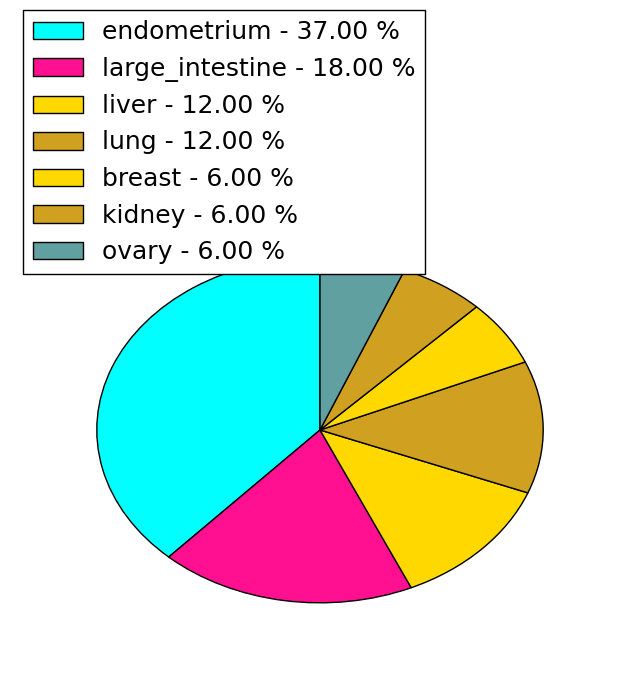
| Mutations for CA12 |
| * Under tables are showing count per each tissue to give us broad intuition about tissue specific mutation patterns.You can go to the detailed page for each mutation database's web site. |
| - Statistics for Tissue and Mutation type | Top |
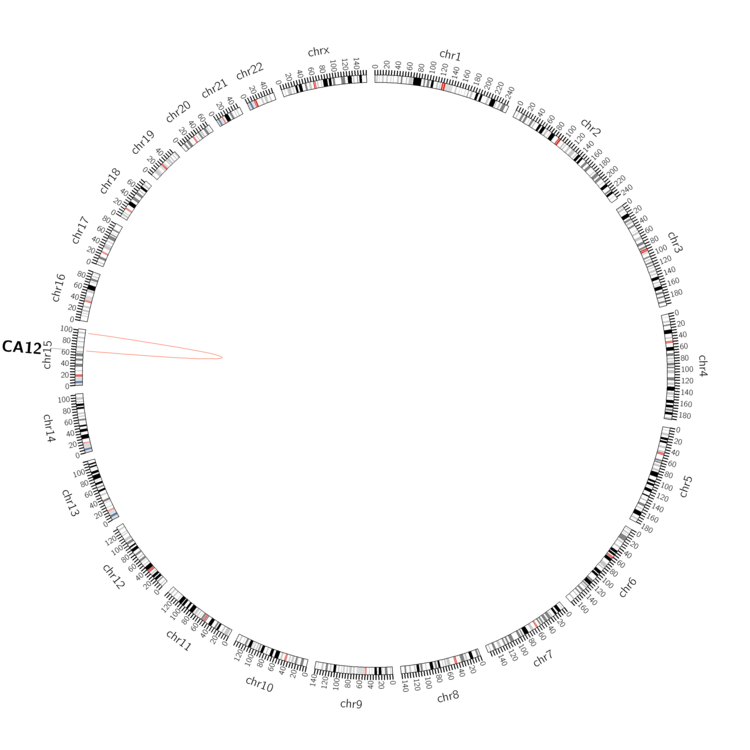 |
| - For Inter-chromosomal Variations |
| There's no inter-chromosomal structural variation. |
| - For Intra-chromosomal Variations |
| * Intra-chromosomal variantions includes 'intrachromosomal amplicon to amplicon', 'intrachromosomal amplicon to non-amplified dna', 'intrachromosomal deletion', 'intrachromosomal fold-back inversion', 'intrachromosomal inversion', 'intrachromosomal tandem duplication', 'Intrachromosomal unknown type', 'intrachromosomal with inverted orientation', 'intrachromosomal with non-inverted orientation'. |
 |
| Sample | Symbol_a | Chr_a | Start_a | End_a | Symbol_b | Chr_b | Start_b | End_b |
| pancreas | CA12 | chr15 | 63640010 | 63640030 | chr15 | 96712140 | 96712160 |
| cf) Tissue number; Tissue name (1;Breast, 2;Central_nervous_system, 3;Haematopoietic_and_lymphoid_tissue, 4;Large_intestine, 5;Liver, 6;Lung, 7;Ovary, 8;Pancreas, 9;Prostate, 10;Skin, 11;Soft_tissue, 12;Upper_aerodigestive_tract) |
| * From mRNA Sanger sequences, Chitars2.0 arranged chimeric transcripts. This table shows CA12 related fusion information. |
| ID | Head Gene | Tail Gene | Accession | Gene_a | qStart_a | qEnd_a | Chromosome_a | tStart_a | tEnd_a | Gene_a | qStart_a | qEnd_a | Chromosome_a | tStart_a | tEnd_a |
| AL050025 | AP1G1 | 4 | 2803 | 16 | 71776185 | 71805102 | CA12 | 2798 | 3994 | 15 | 63615733 | 63616925 | |
| AI343531 | RPL32 | 1 | 116 | 3 | 12877539 | 12877654 | CA12 | 112 | 446 | 15 | 63617526 | 63618065 | |
| AI478632 | CA12 | 1 | 343 | 15 | 63619716 | 63620058 | CA12 | 339 | 512 | 15 | 63619575 | 63619748 | |
| BQ325609 | MTPN | 18 | 158 | 7 | 135613319 | 135613459 | CA12 | 154 | 282 | 15 | 63617236 | 63617364 | |
| CA312936 | CA12 | 18 | 352 | 15 | 63615730 | 63616064 | CA12 | 346 | 410 | 15 | 63616294 | 63616358 | |
| Top |
| Mutation type/ Tissue ID | brca | cns | cerv | endome | haematopo | kidn | Lintest | liver | lung | ns | ovary | pancre | prost | skin | stoma | thyro | urina | |||
| Total # sample | 1 | |||||||||||||||||||
| GAIN (# sample) | 1 | |||||||||||||||||||
| LOSS (# sample) |
| cf) Tissue ID; Tissue type (1; Breast, 2; Central_nervous_system, 3; Cervix, 4; Endometrium, 5; Haematopoietic_and_lymphoid_tissue, 6; Kidney, 7; Large_intestine, 8; Liver, 9; Lung, 10; NS, 11; Ovary, 12; Pancreas, 13; Prostate, 14; Skin, 15; Stomach, 16; Thyroid, 17; Urinary_tract) |
| Top |
|
 |
| Top |
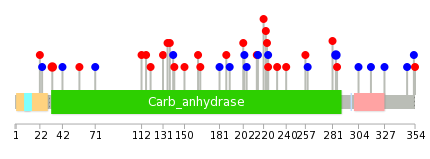
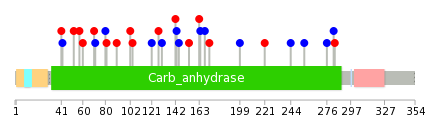
| Stat. for Non-Synonymous SNVs (# total SNVs=21) | (# total SNVs=16) |
 |  |
(# total SNVs=0) | (# total SNVs=0) |
| Top |
| * When you move the cursor on each content, you can see more deailed mutation information on the Tooltip. Those are primary_site,primary_histology,mutation(aa),pubmedID. |
| GRCh37 position | Mutation(aa) | Unique sampleID count |
| chr15:63631040-63631040 | p.L284L | 2 |
| chr15:63667866-63667866 | p.T33A | 2 |
| chr15:63632965-63632965 | p.P181P | 1 |
| chr15:63619428-63619428 | p.I304I | 1 |
| chr15:63637770-63637770 | p.R112H | 1 |
| chr15:63632566-63632566 | p.G223V | 1 |
| chr15:63634235-63634235 | p.S164L | 1 |
| chr15:63631039-63631039 | p.V285I | 1 |
| chr15:63638802-63638802 | p.L71L | 1 |
| chr15:63632569-63632569 | p.R222Q | 1 |
| Top |
|
 |
| Point Mutation/ Tissue ID | 1 | 2 | 3 | 4 | 5 | 6 | 7 | 8 | 9 | 10 | 11 | 12 | 13 | 14 | 15 | 16 | 17 | 18 | 19 | 20 |
| # sample | 1 | 1 | 6 | 2 | 1 | 1 | 3 | 2 | 1 | 1 | 3 | 1 | 7 | |||||||
| # mutation | 1 | 1 | 6 | 2 | 1 | 1 | 3 | 2 | 1 | 1 | 3 | 1 | 7 | |||||||
| nonsynonymous SNV | 1 | 3 | 2 | 1 | 1 | 1 | 2 | 1 | 3 | 1 | ||||||||||
| synonymous SNV | 1 | 3 | 2 | 1 | 1 | 6 |
| cf) Tissue ID; Tissue type (1; BLCA[Bladder Urothelial Carcinoma], 2; BRCA[Breast invasive carcinoma], 3; CESC[Cervical squamous cell carcinoma and endocervical adenocarcinoma], 4; COAD[Colon adenocarcinoma], 5; GBM[Glioblastoma multiforme], 6; Glioma Low Grade, 7; HNSC[Head and Neck squamous cell carcinoma], 8; KICH[Kidney Chromophobe], 9; KIRC[Kidney renal clear cell carcinoma], 10; KIRP[Kidney renal papillary cell carcinoma], 11; LAML[Acute Myeloid Leukemia], 12; LUAD[Lung adenocarcinoma], 13; LUSC[Lung squamous cell carcinoma], 14; OV[Ovarian serous cystadenocarcinoma ], 15; PAAD[Pancreatic adenocarcinoma], 16; PRAD[Prostate adenocarcinoma], 17; SKCM[Skin Cutaneous Melanoma], 18:STAD[Stomach adenocarcinoma], 19:THCA[Thyroid carcinoma], 20:UCEC[Uterine Corpus Endometrial Carcinoma]) |
| Top |
| * We represented just top 10 SNVs. When you move the cursor on each content, you can see more deailed mutation information on the Tooltip. Those are primary_site, primary_histology, mutation(aa), pubmedID. |
| Genomic Position | Mutation(aa) | Unique sampleID count |
| chr15:63638802 | p.C199C,CA12 | 1 |
| chr15:63631051 | p.F80F,CA12 | 1 |
| chr15:63632949 | p.P172T,CA12 | 1 |
| chr15:63638807 | p.L60M,CA12 | 1 |
| chr15:63631115 | p.P168P,CA12 | 1 |
| chr15:63632965 | p.R52H,CA12 | 1 |
| chr15:63638846 | p.S164S,CA12 | 1 |
| chr15:63632540 | p.P41H,CA12 | 1 |
| chr15:63634235 | p.G163V,CA12 | 1 |
| chr15:63638889 | p.L71L,CA12 | 1 |
| * Copy number data were extracted from TCGA using R package TCGA-Assembler. The URLs of all public data files on TCGA DCC data server were gathered on Jan-05-2015. Function ProcessCNAData in TCGA-Assembler package was used to obtain gene-level copy number value which is calculated as the average copy number of the genomic region of a gene. |
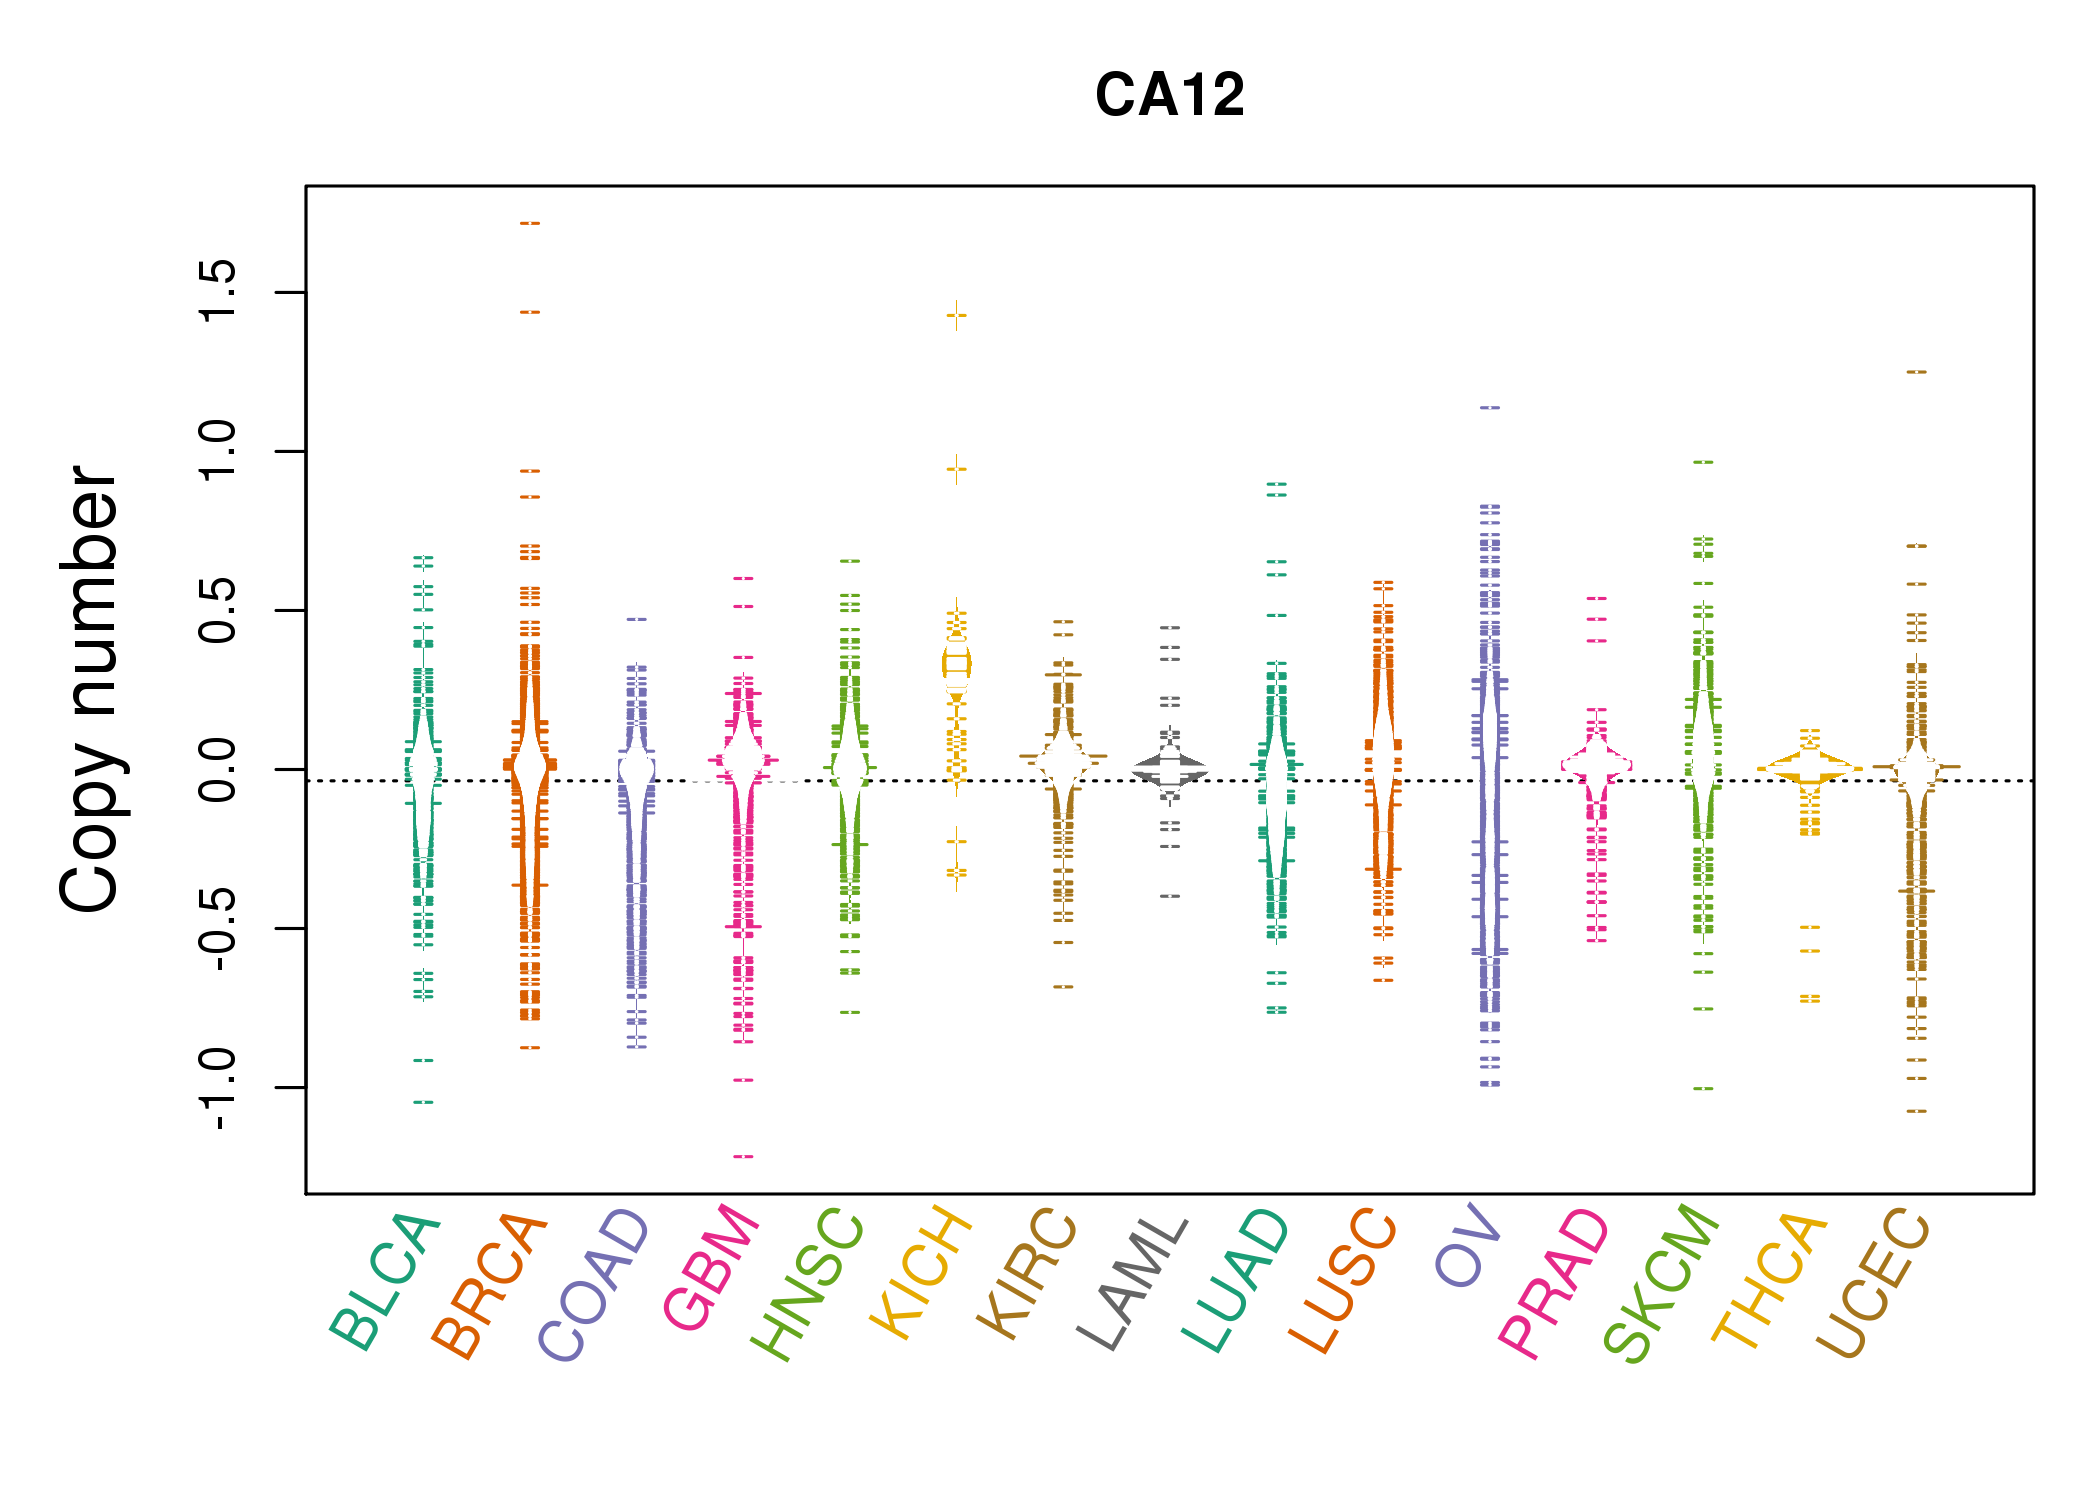 |
| cf) Tissue ID[Tissue type]: BLCA[Bladder Urothelial Carcinoma], BRCA[Breast invasive carcinoma], CESC[Cervical squamous cell carcinoma and endocervical adenocarcinoma], COAD[Colon adenocarcinoma], GBM[Glioblastoma multiforme], Glioma Low Grade, HNSC[Head and Neck squamous cell carcinoma], KICH[Kidney Chromophobe], KIRC[Kidney renal clear cell carcinoma], KIRP[Kidney renal papillary cell carcinoma], LAML[Acute Myeloid Leukemia], LUAD[Lung adenocarcinoma], LUSC[Lung squamous cell carcinoma], OV[Ovarian serous cystadenocarcinoma ], PAAD[Pancreatic adenocarcinoma], PRAD[Prostate adenocarcinoma], SKCM[Skin Cutaneous Melanoma], STAD[Stomach adenocarcinoma], THCA[Thyroid carcinoma], UCEC[Uterine Corpus Endometrial Carcinoma] |
| Top |
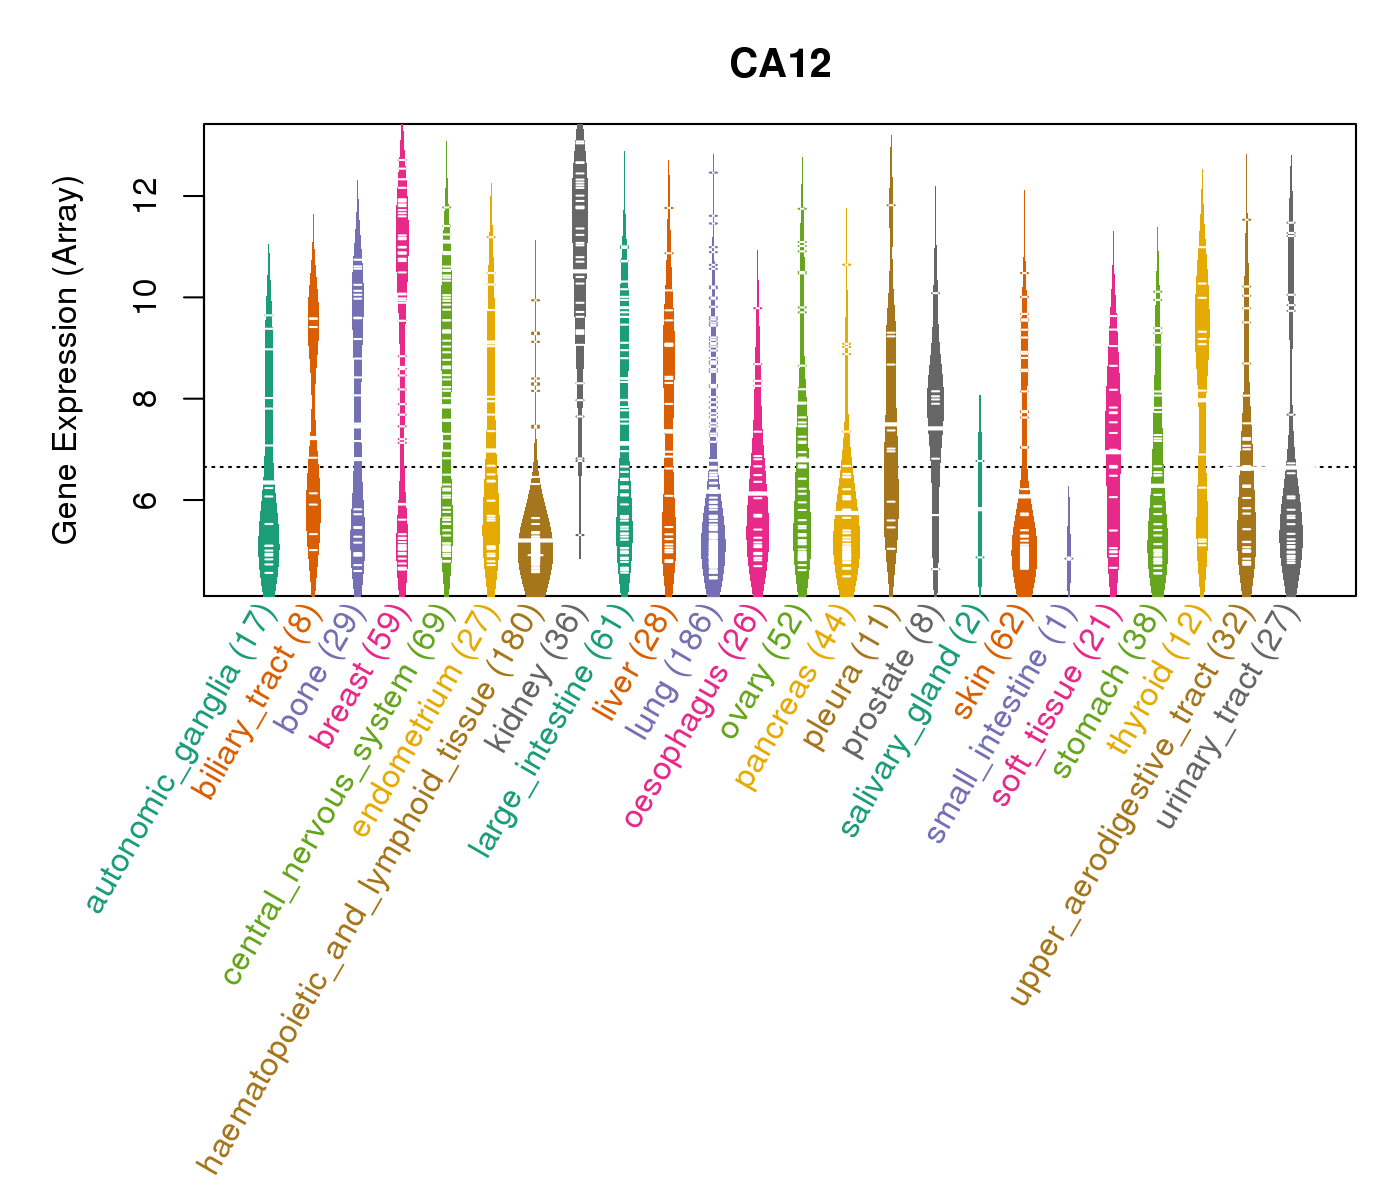
| Gene Expression for CA12 |
| * CCLE gene expression data were extracted from CCLE_Expression_Entrez_2012-10-18.res: Gene-centric RMA-normalized mRNA expression data. |
 |
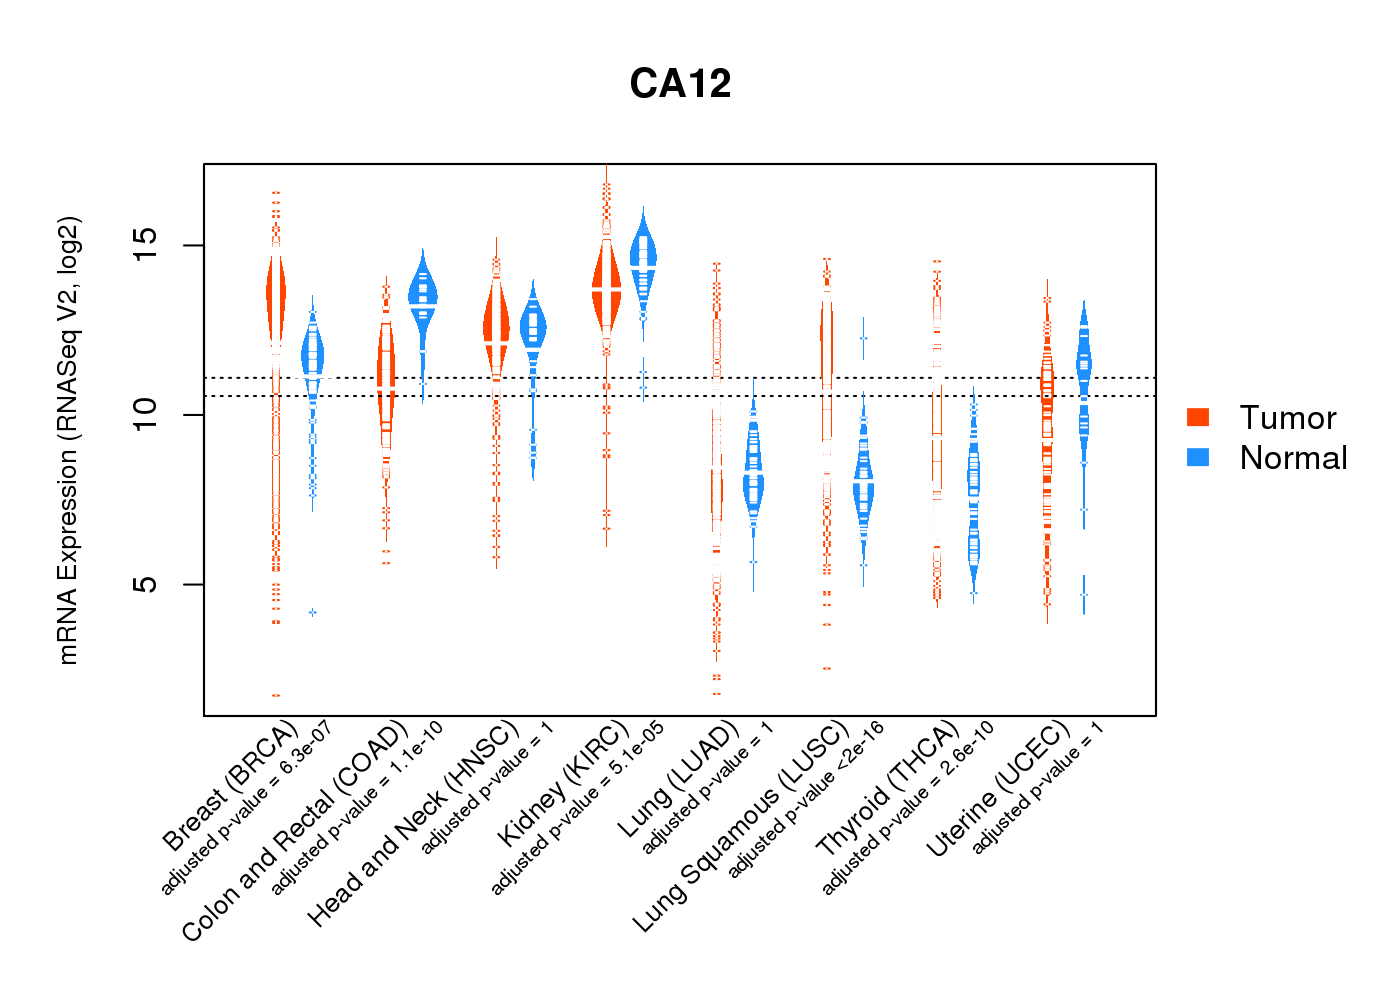
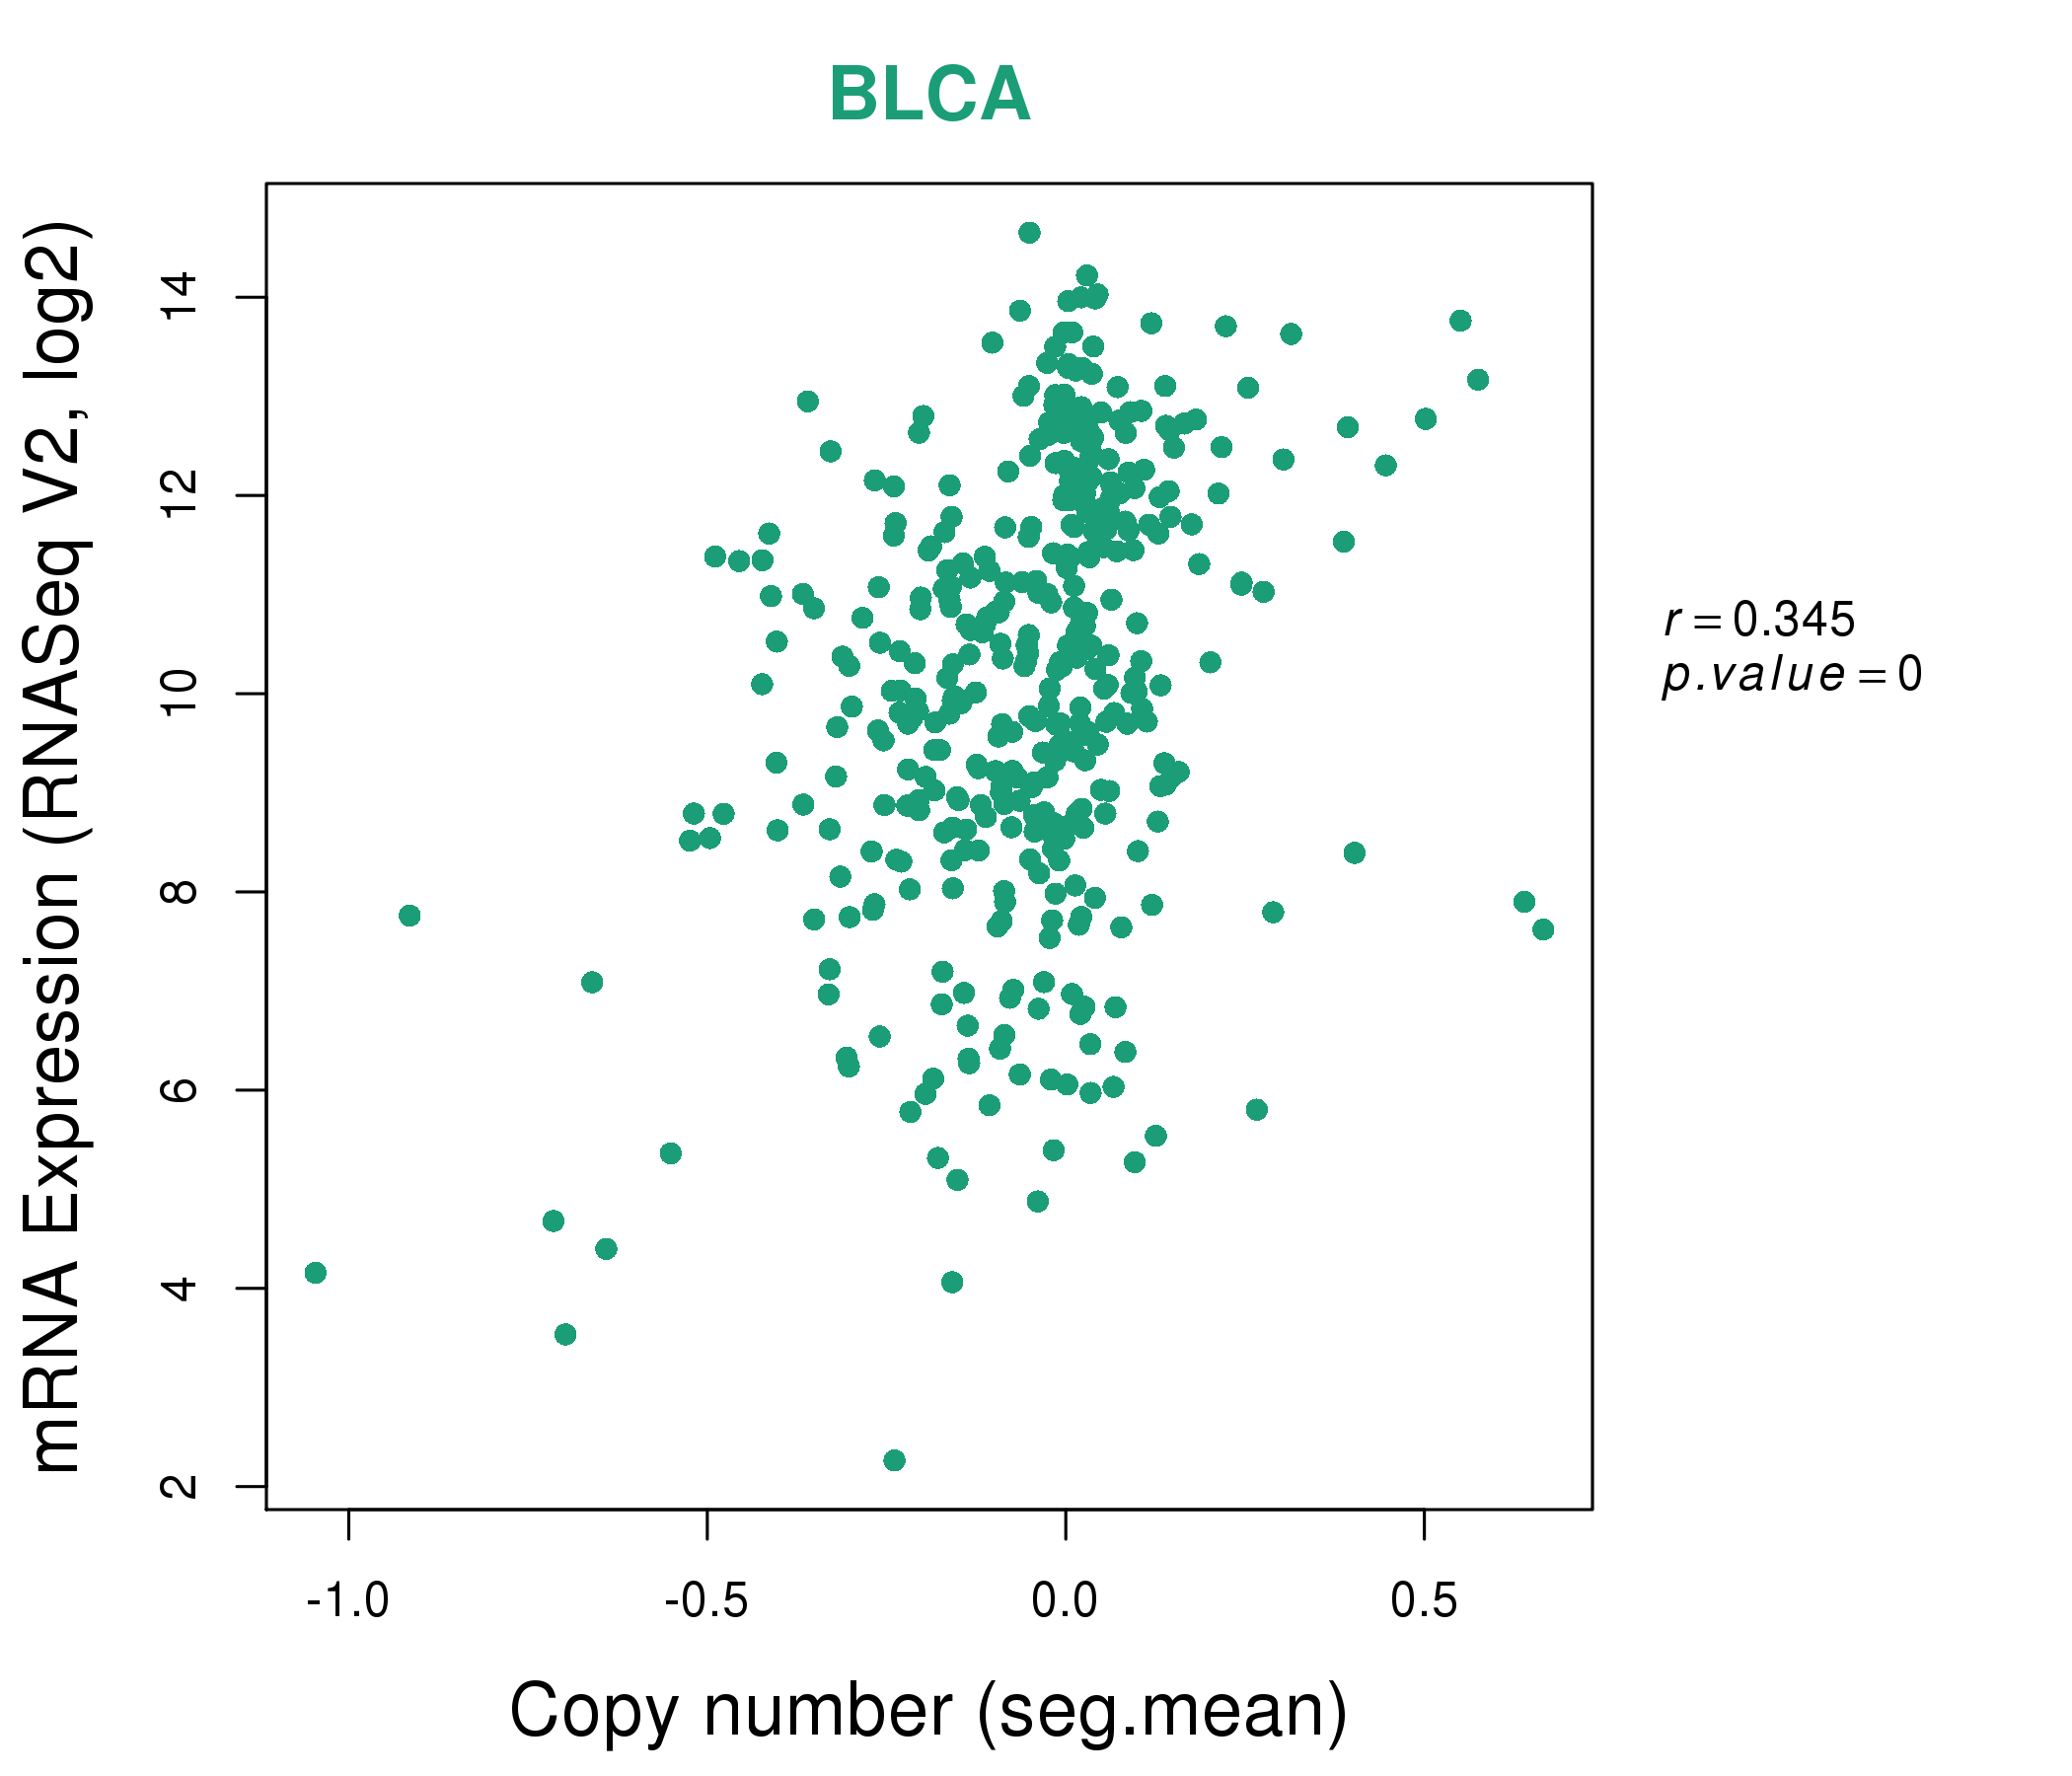
| * Normalized gene expression data of RNASeqV2 was extracted from TCGA using R package TCGA-Assembler. The URLs of all public data files on TCGA DCC data server were gathered at Jan-05-2015. Only eight cancer types have enough normal control samples for differential expression analysis. (t test, adjusted p<0.05 (using Benjamini-Hochberg FDR)) |
 |
| Top |
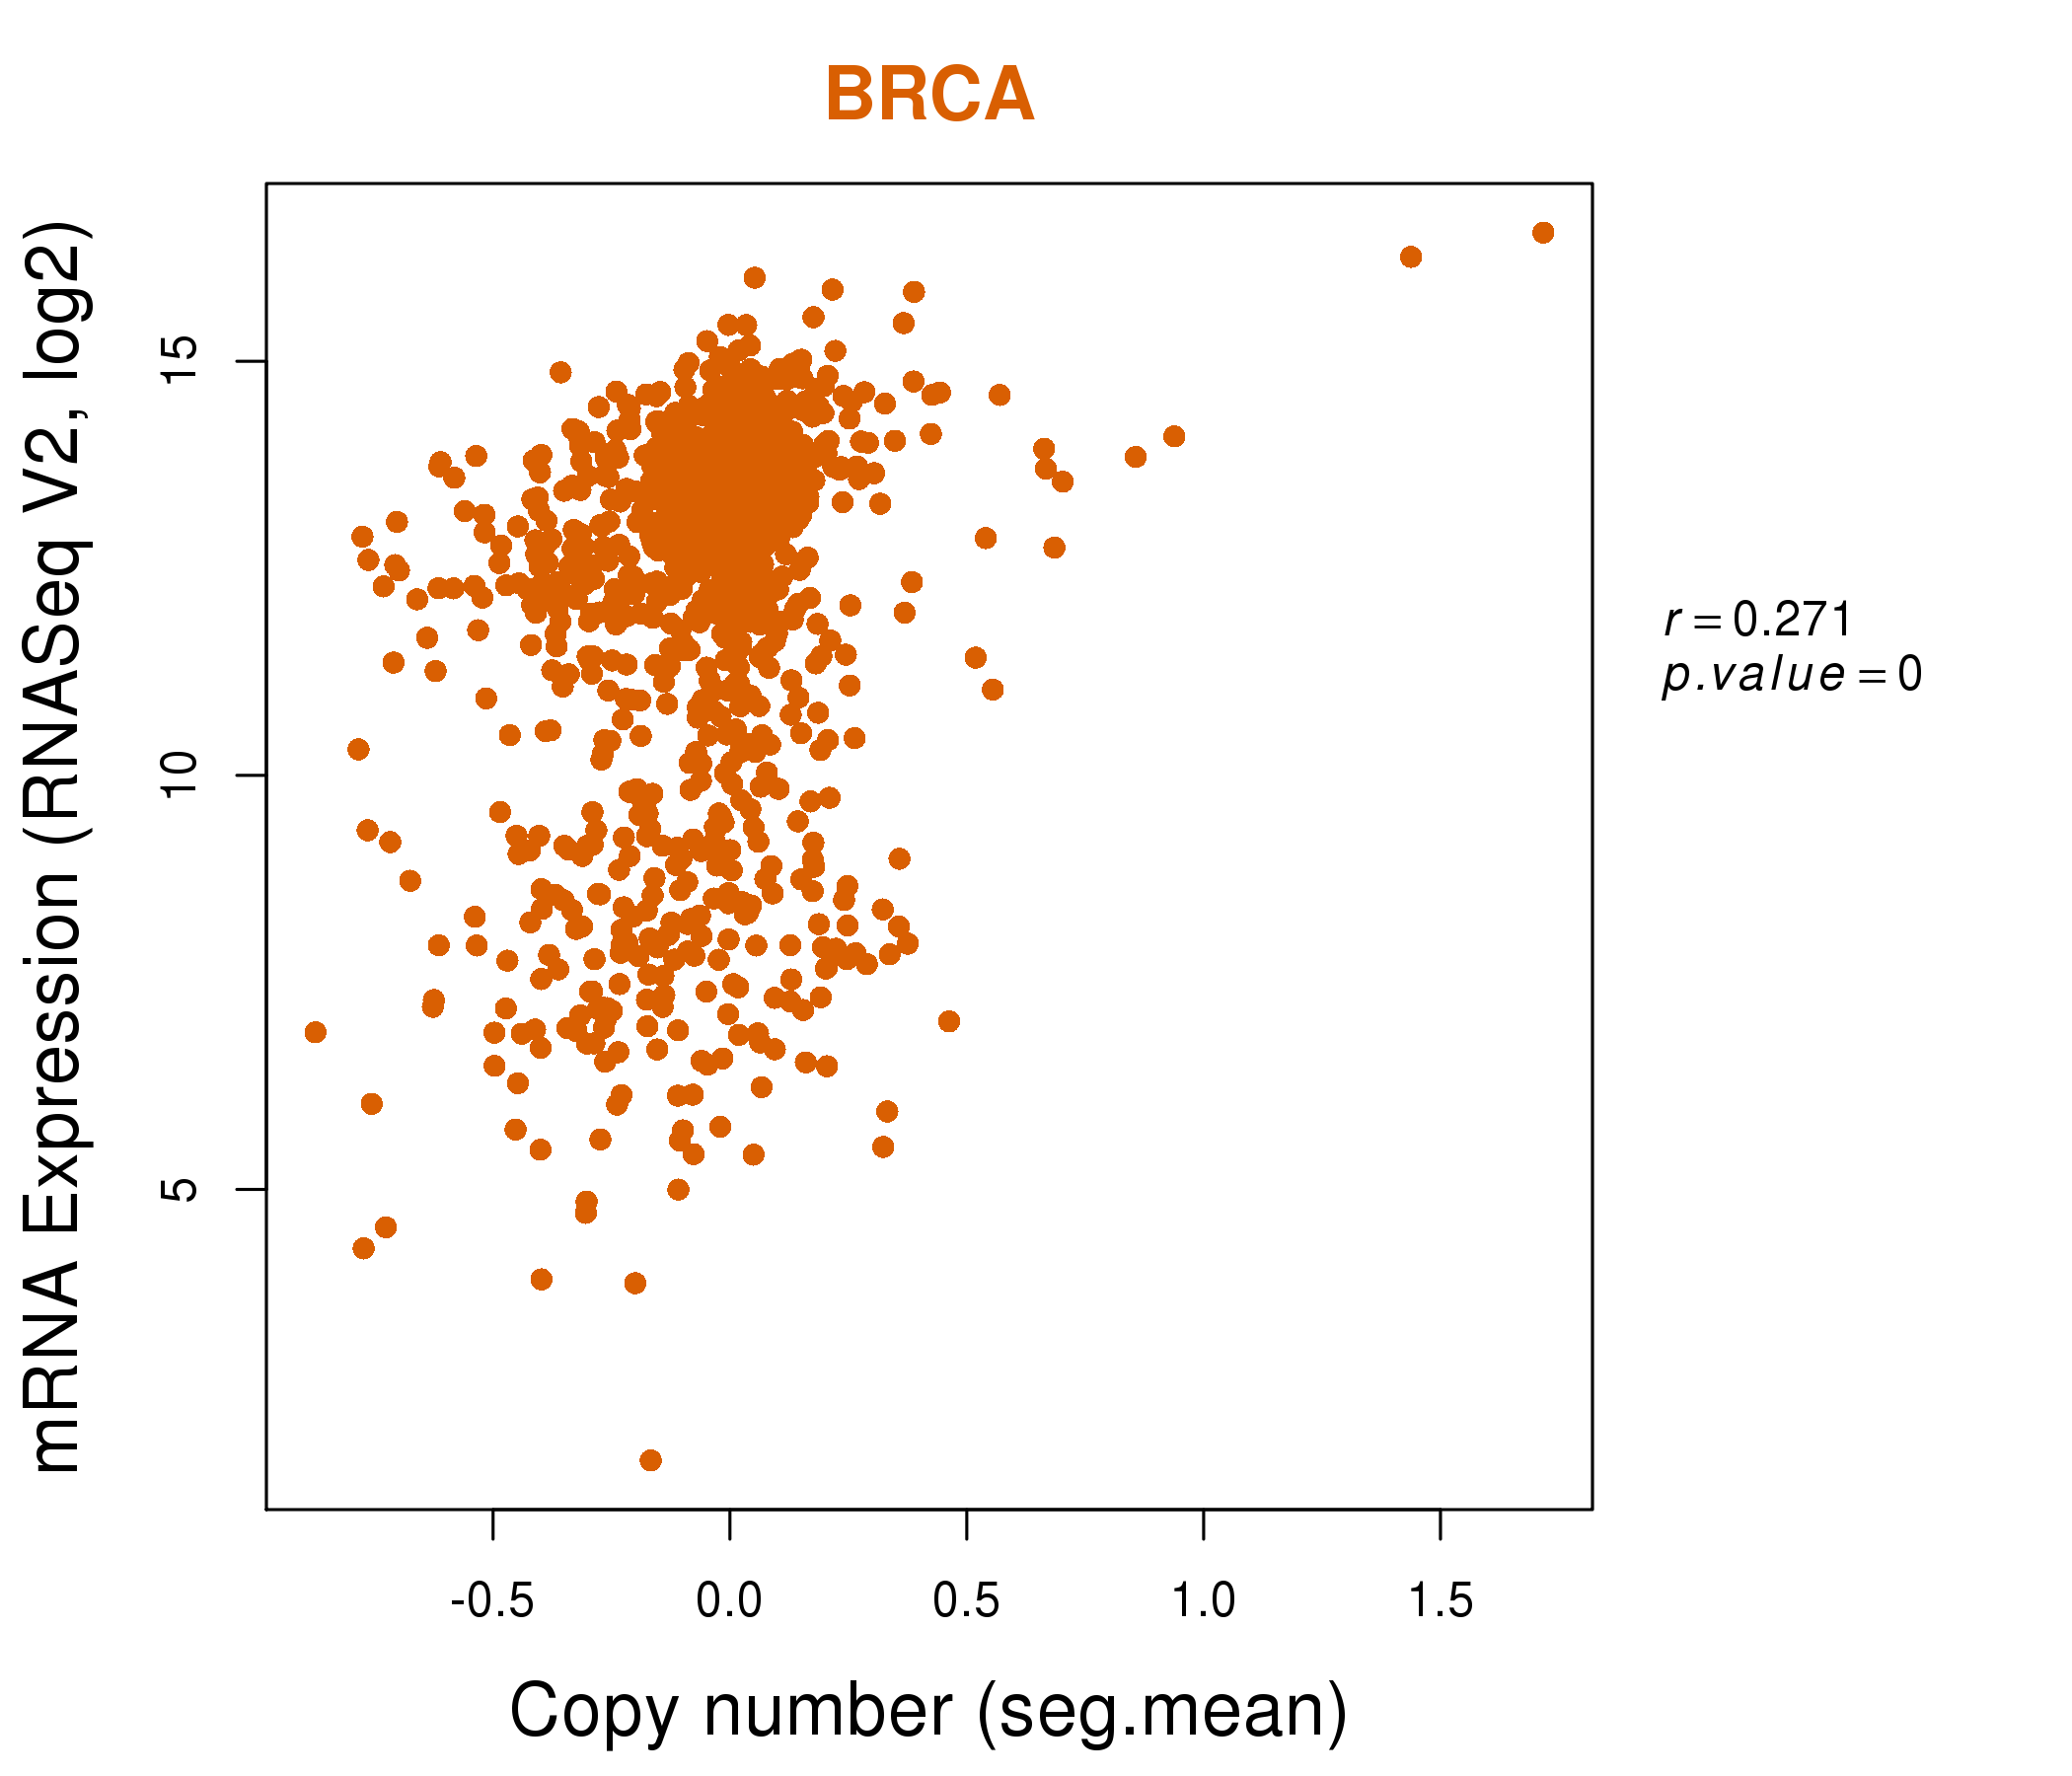
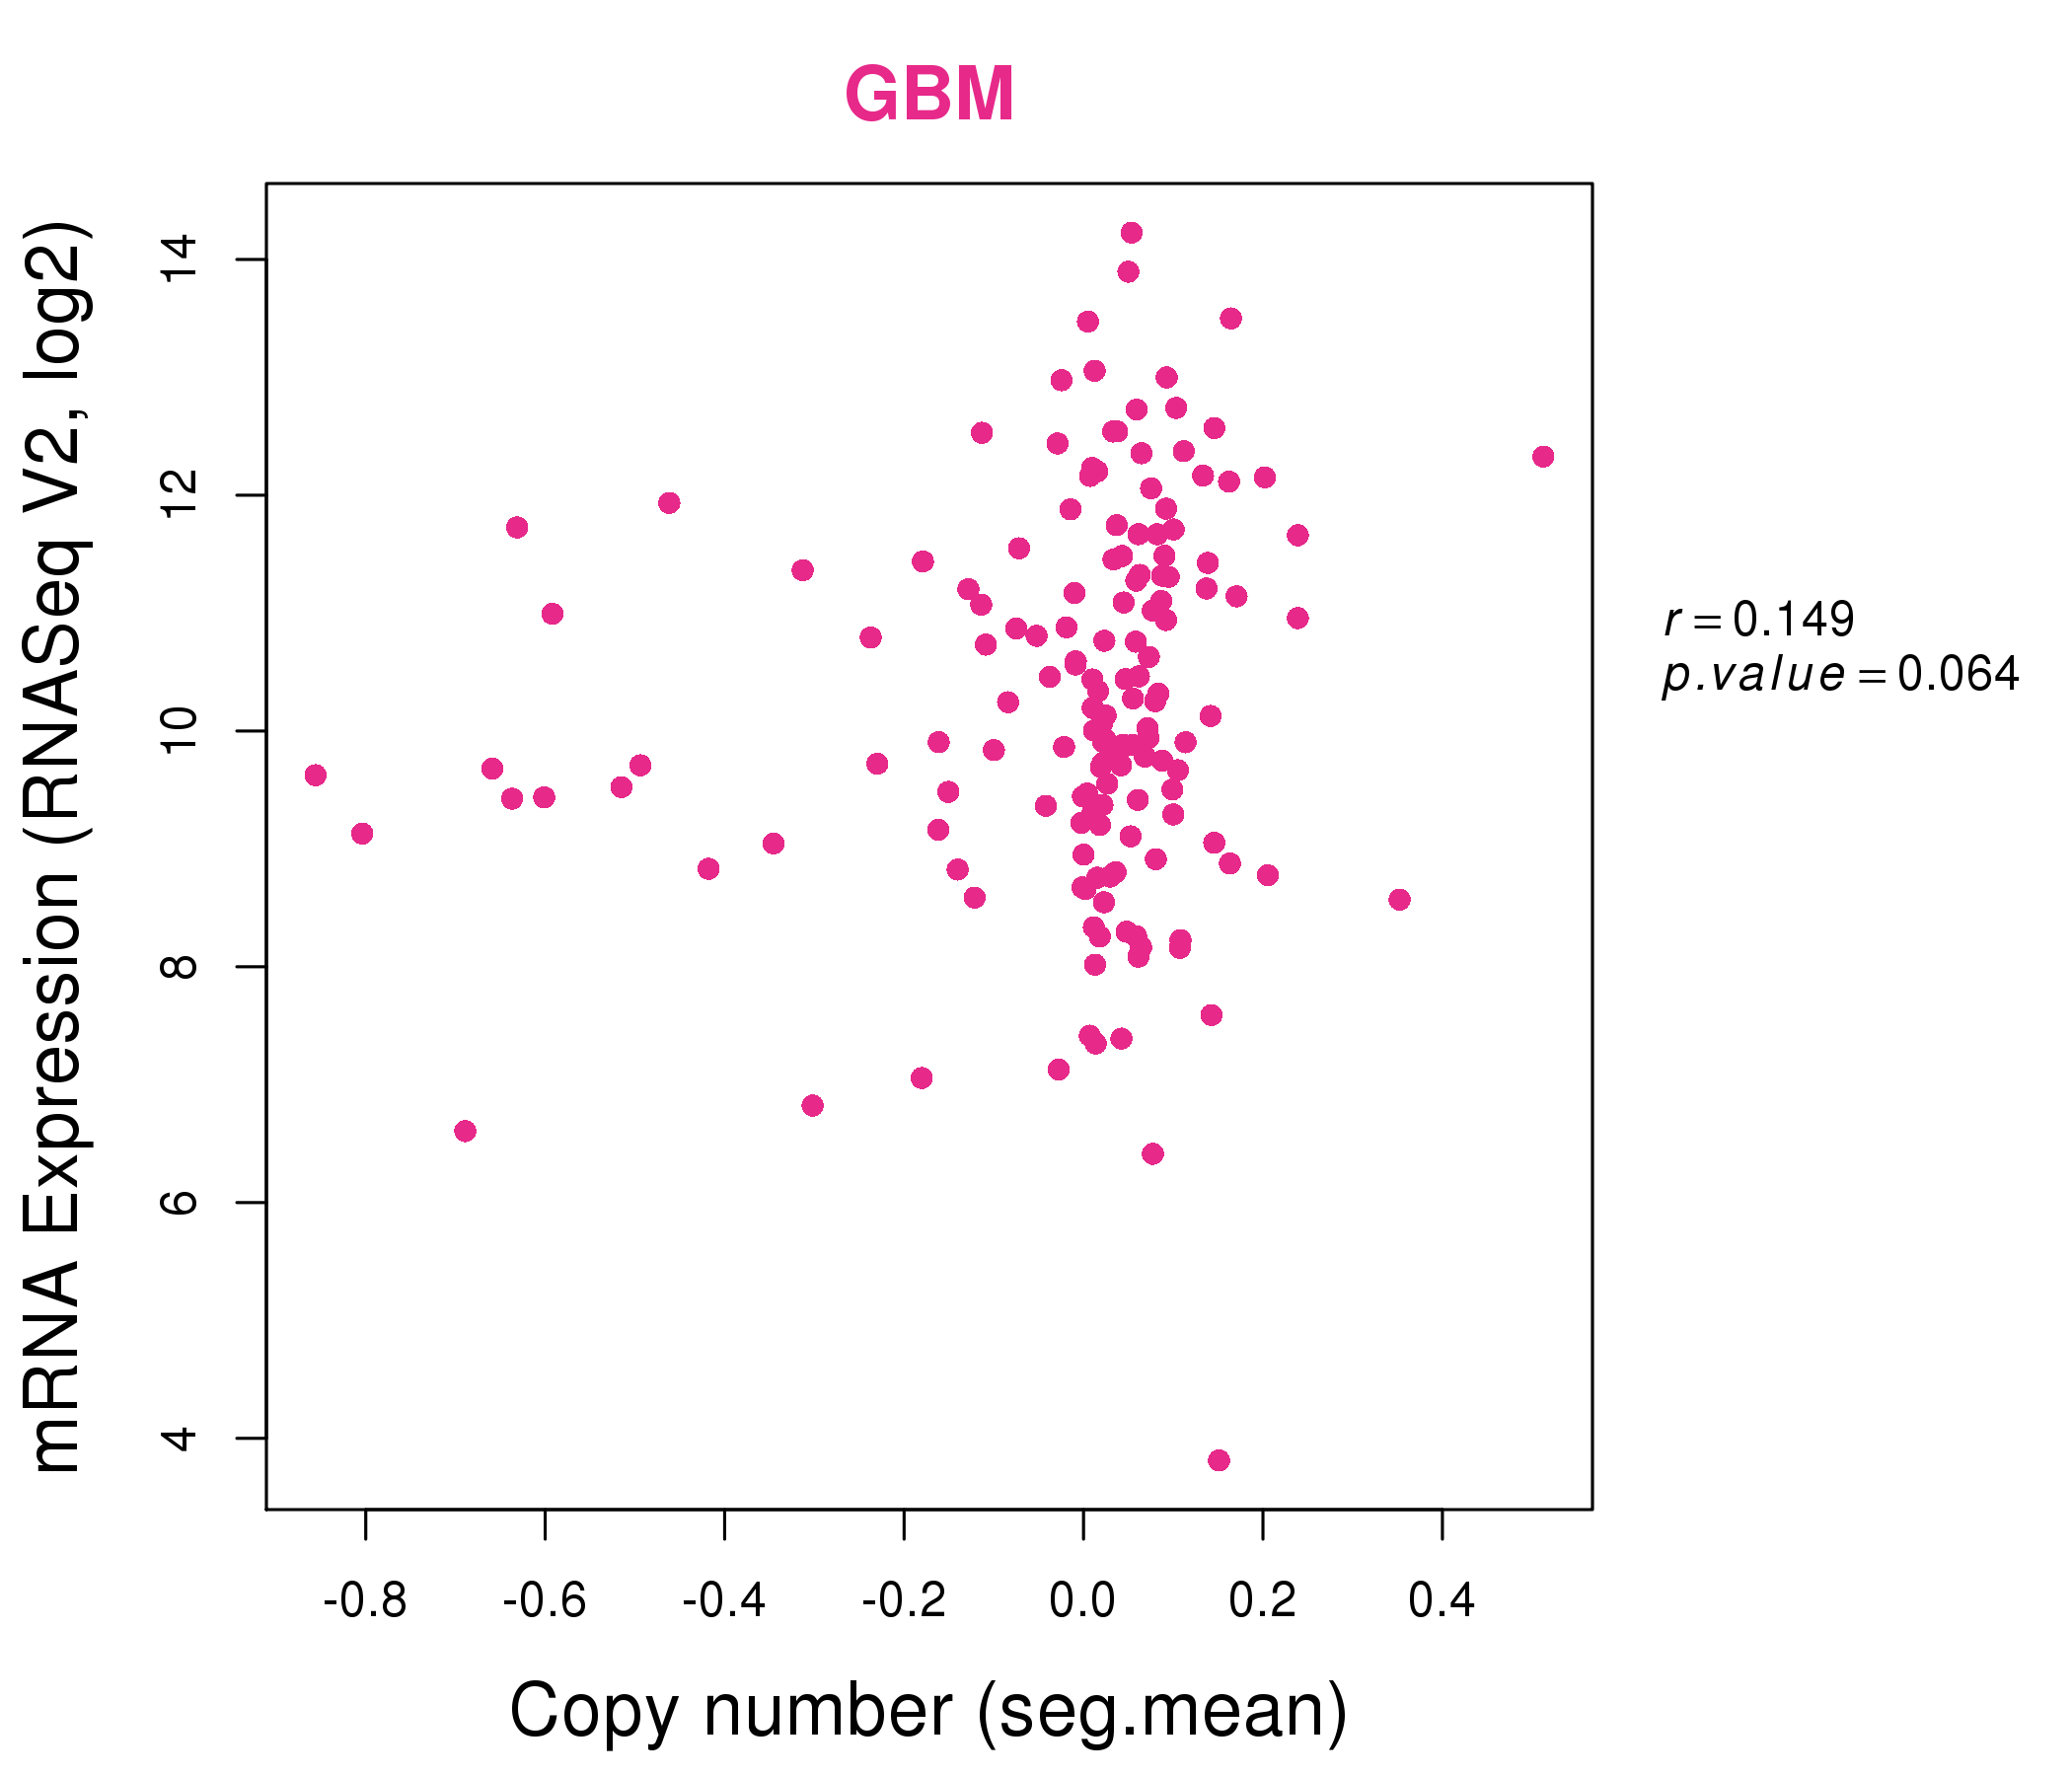
| * This plots show the correlation between CNV and gene expression. |
: Open all plots for all cancer types
 |
|
 |
|
| Top |
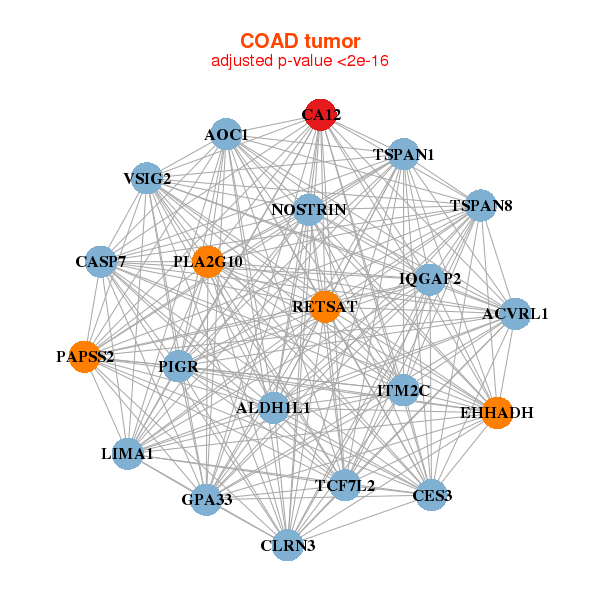
| Gene-Gene Network Information |
| * Co-Expression network figures were drawn using R package igraph. Only the top 20 genes with the highest correlations were shown. Red circle: input gene, orange circle: cell metabolism gene, sky circle: other gene |
: Open all plots for all cancer types
 |
| ||||
| AAGAB,ABCD3,ANXA9,APH1B,BBS4,CA12,CELSR1, CSNK1G1,DIS3L,ESR1,FBXL5,GATA3,PTPLAD1,RAB11A, SIN3A,SKP1,SLC24A1,SNX1,TBC1D9,THSD4,XBP1 | ABAT,ARSD,CA12,CDH1,CELSR1,GOLM1,HHAT, MARVELD2,MBOAT1,MTL5,MYB,PIP4K2C,PRRG4,SHROOM3, SLC39A6,TBC1D9,TPBG,TTC8,XBP1,ZNF544,ZNF552 | ||||
 |
| ||||
| AOC1,ACVRL1,ALDH1L1,CA12,CASP7,CES3,CLRN3, EHHADH,GPA33,IQGAP2,ITM2C,LIMA1,NOSTRIN,PAPSS2, PIGR,PLA2G10,RETSAT,TCF7L2,TSPAN1,TSPAN8,VSIG2 | ABCC3,AHCYL2,CA12,CNNM4,DSG2,FA2H,FBXO34, KLF4,LETM1,NCEH1,PLCE1,PPM1B,PPP1R14C,SATB2, SH3BGRL2,SLC35D1,SLC44A1,SLC4A4,TMEM63B,TMEM65,ZBTB7C |
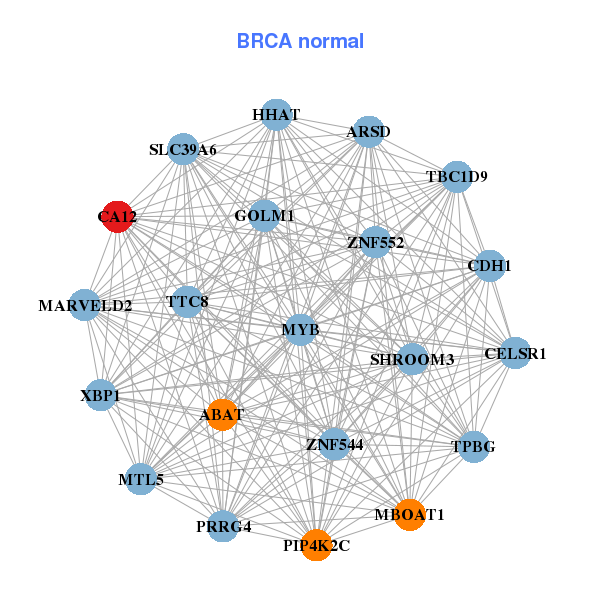
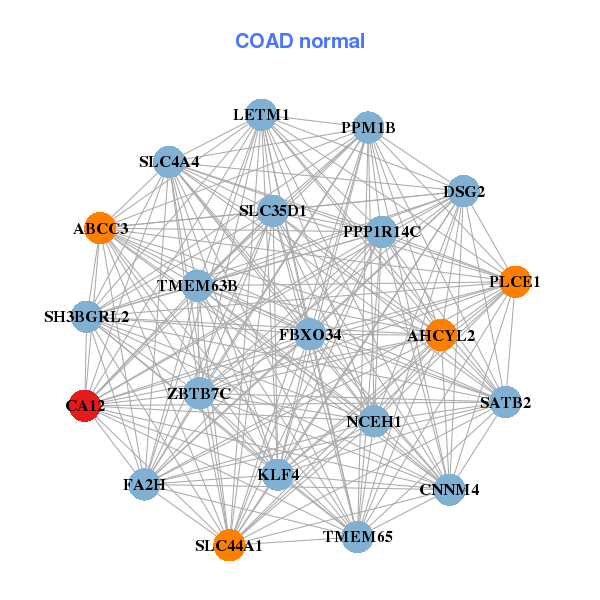
| * Co-Expression network figures were drawn using R package igraph. Only the top 20 genes with the highest correlations were shown. Red circle: input gene, orange circle: cell metabolism gene, sky circle: other gene |
: Open all plots for all cancer types
| Top |
: Open all interacting genes' information including KEGG pathway for all interacting genes from DAVID
| Top |
| Pharmacological Information for CA12 |
| DB Category | DB Name | DB's ID and Url link |
| Chemistry | BindingDB | O43570; -. |
| Chemistry | ChEMBL | CHEMBL3242; -. |
| Chemistry | GuidetoPHARMACOLOGY | 2747; -. |
| Organism-specific databases | PharmGKB | PA25987; -. |
| Organism-specific databases | CTD | 771; -. |
| * Gene Centered Interaction Network. |
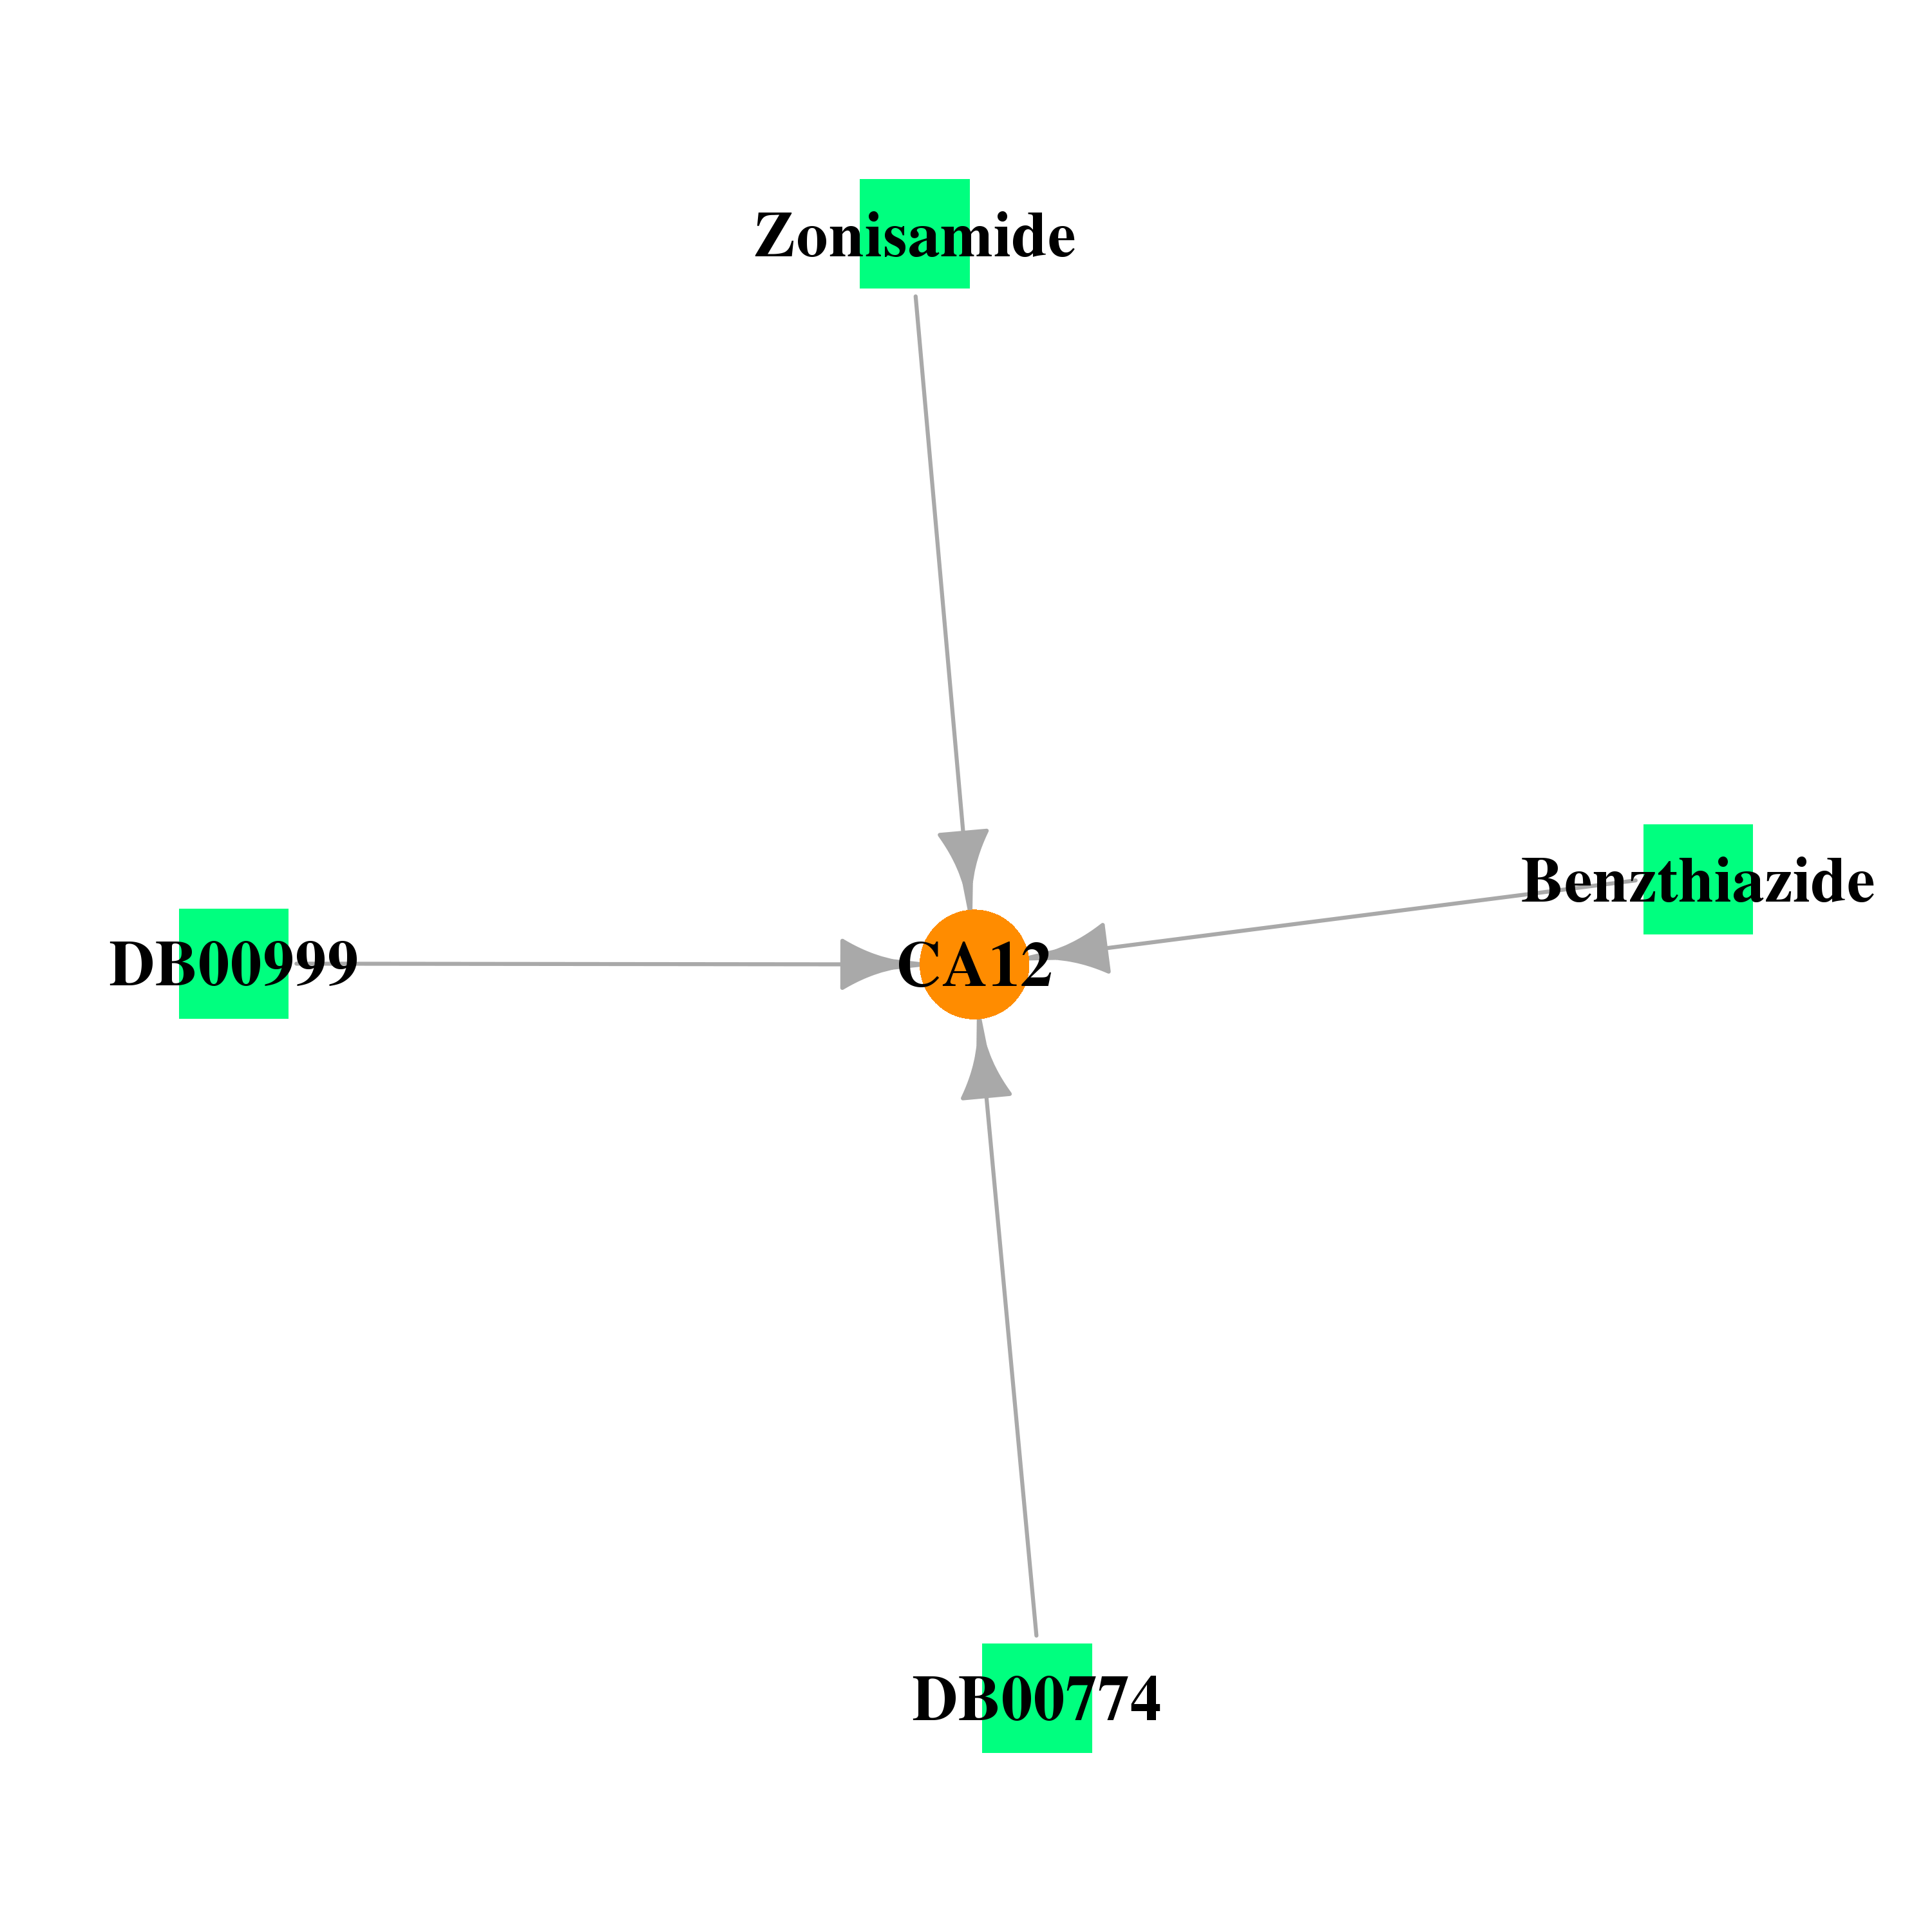 |
| * Drug Centered Interaction Network. |
| DrugBank ID | Target Name | Drug Groups | Generic Name | Drug Centered Network | Drug Structure |
| DB00562 | carbonic anhydrase XII | approved | Benzthiazide |  | 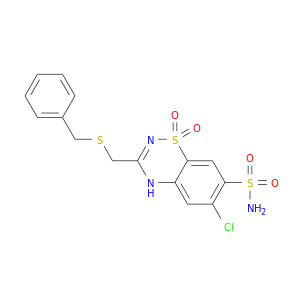 |
| DB00774 | carbonic anhydrase XII | approved | Hydroflumethiazide | 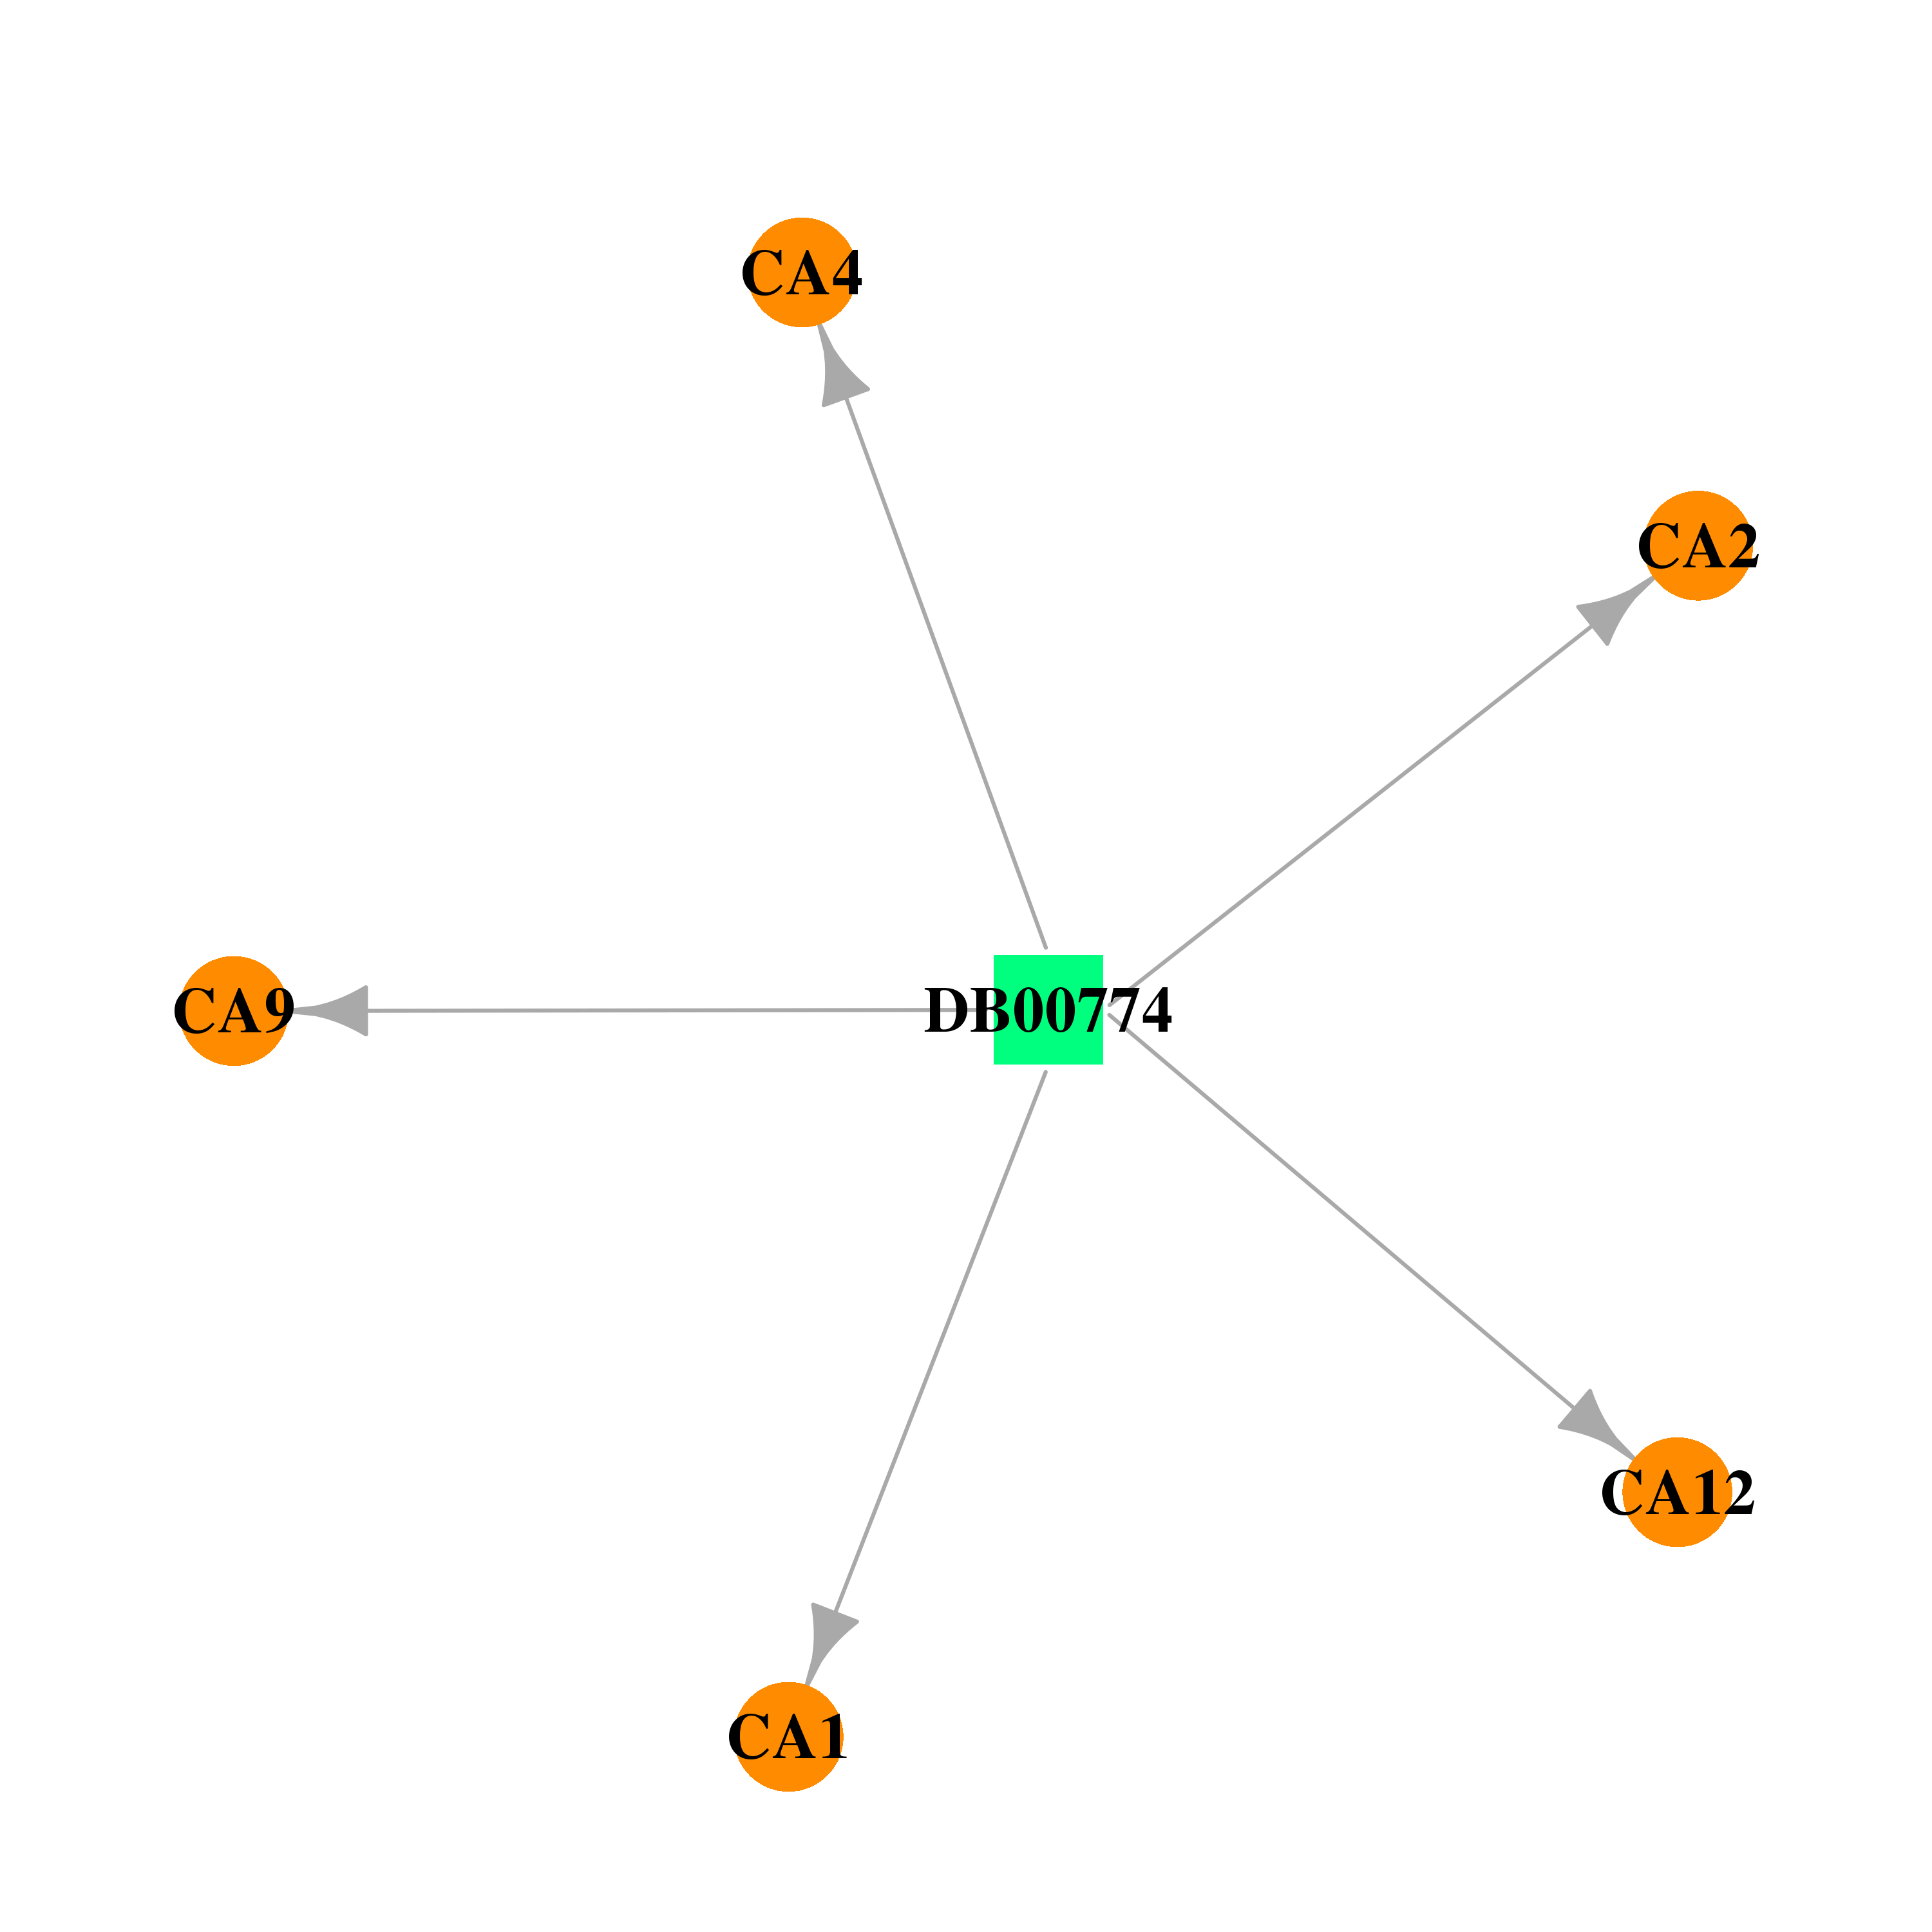 | 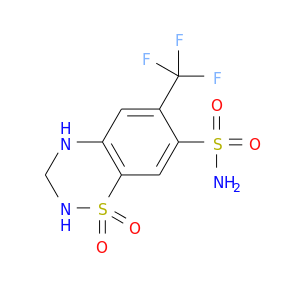 |
| DB00909 | carbonic anhydrase XII | approved; investigational | Zonisamide | 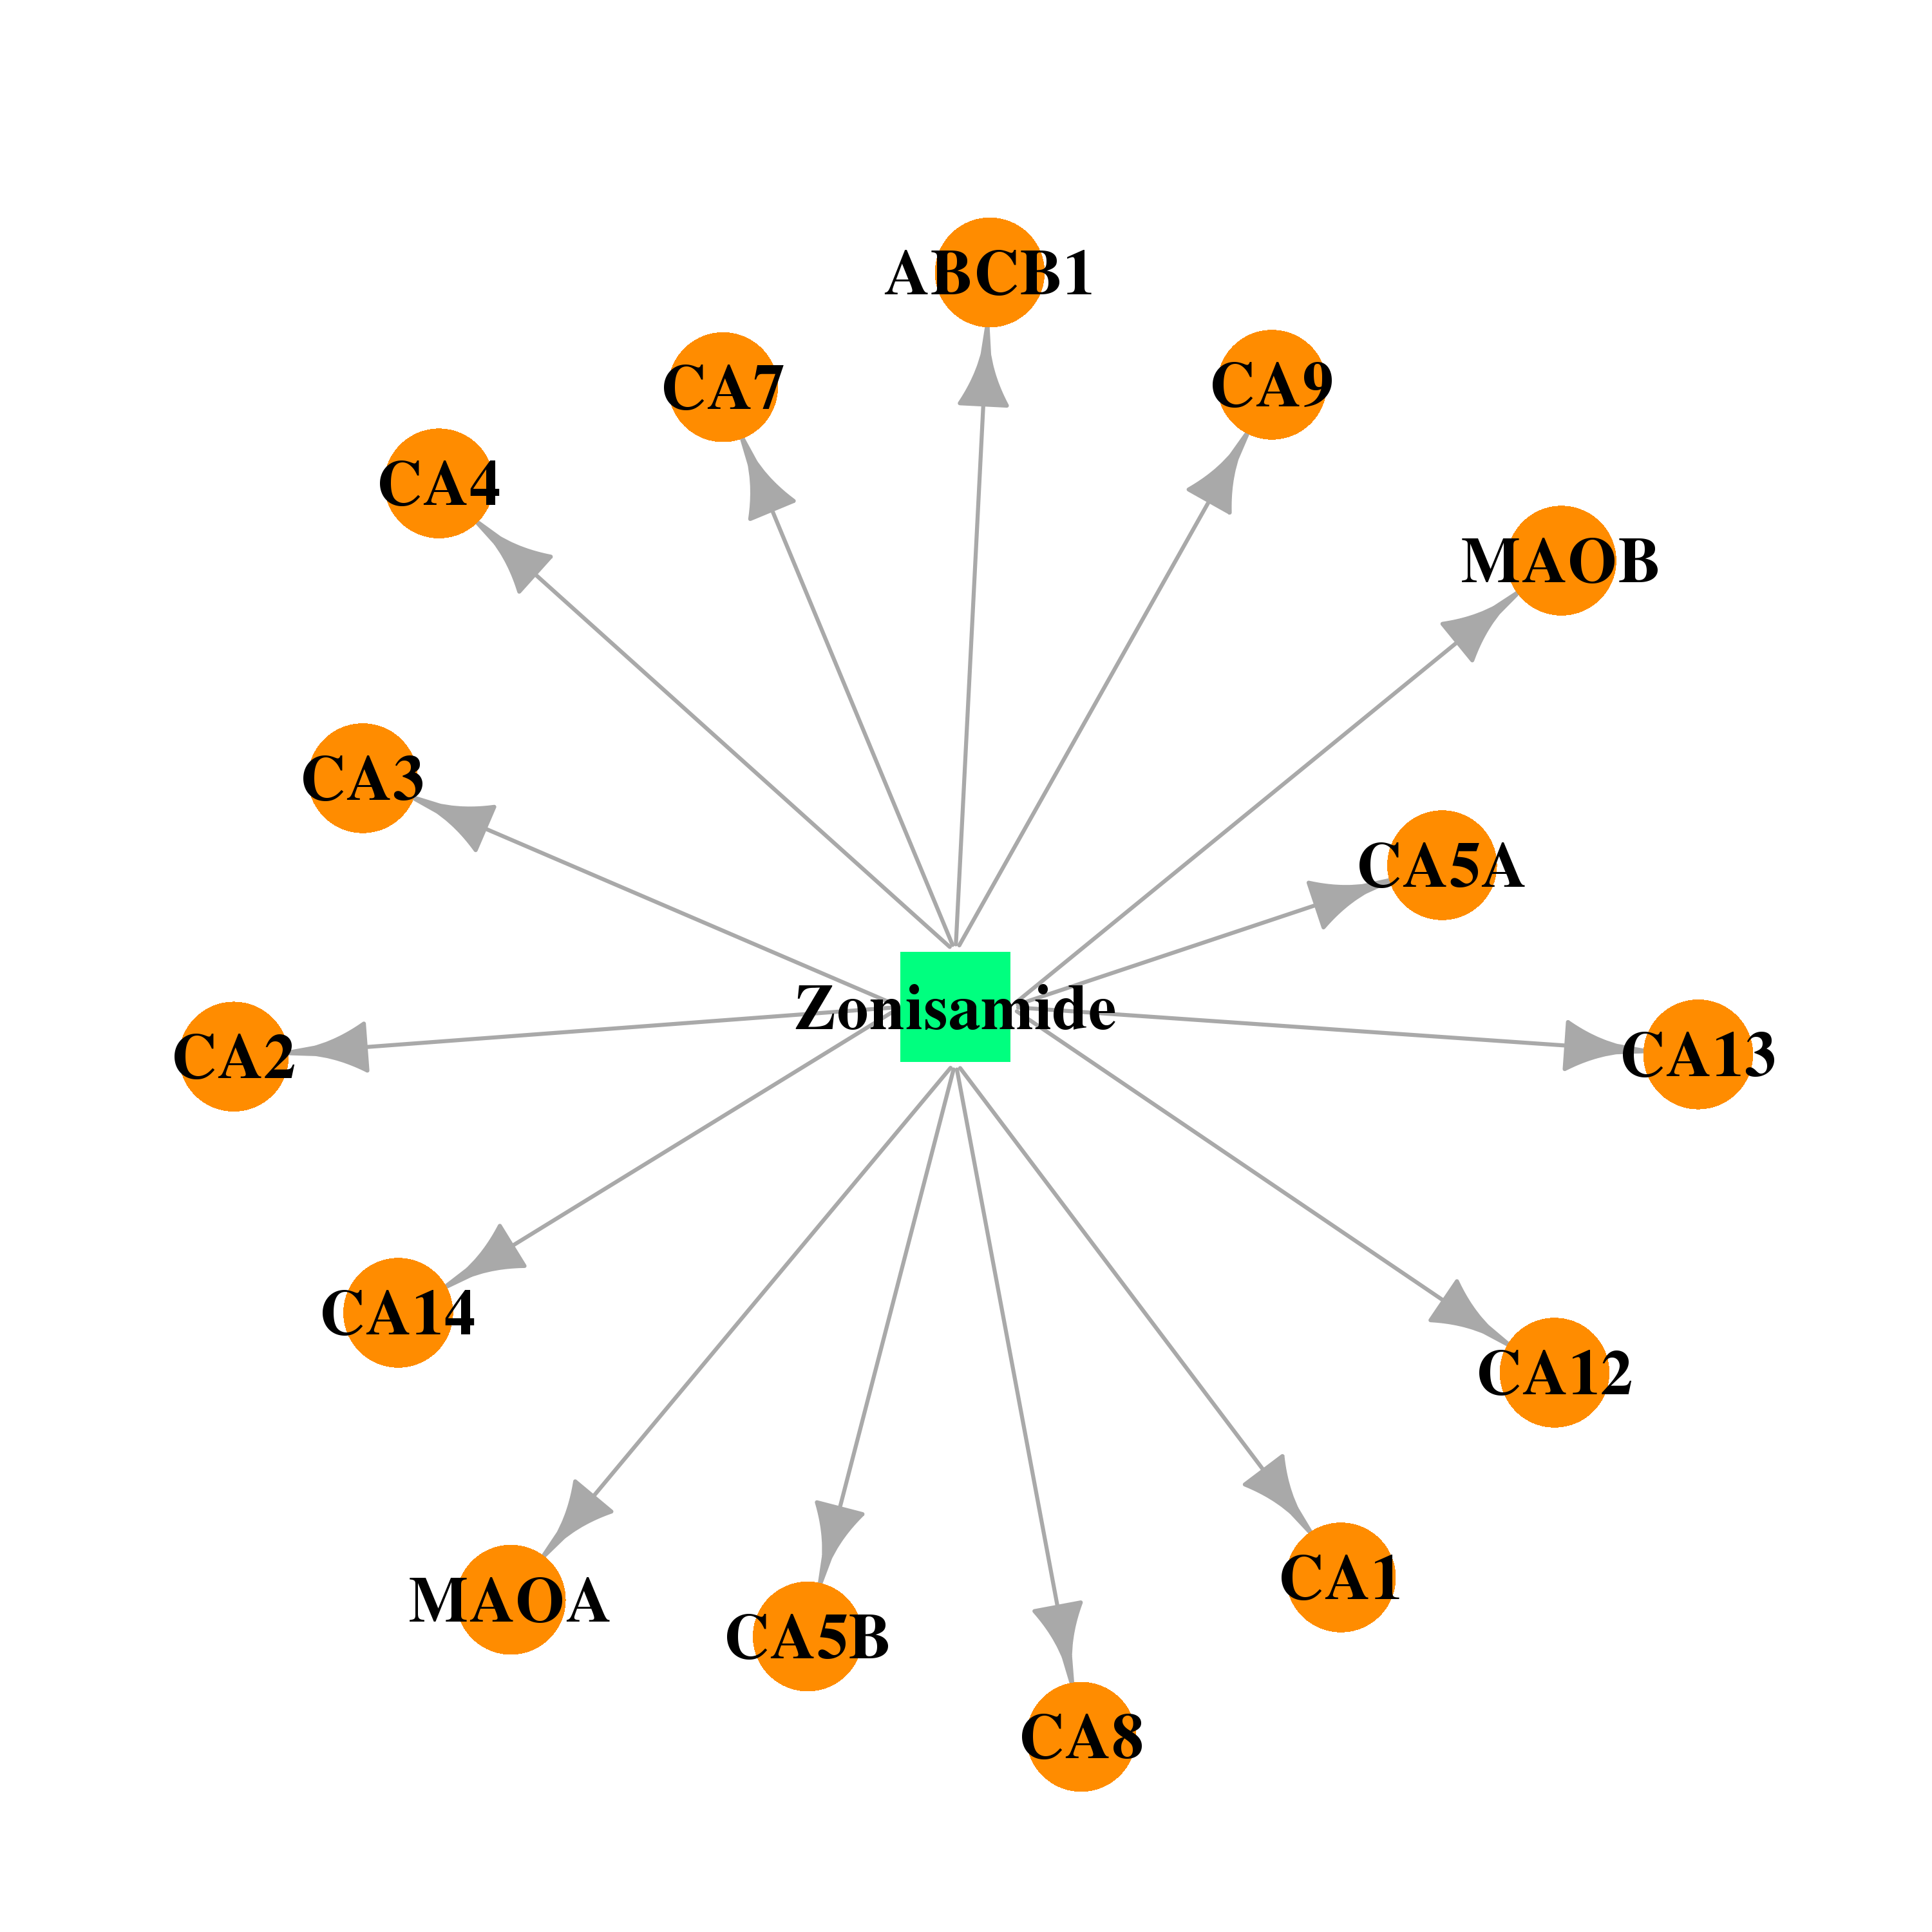 |  |
| DB00999 | carbonic anhydrase XII | approved | Hydrochlorothiazide | 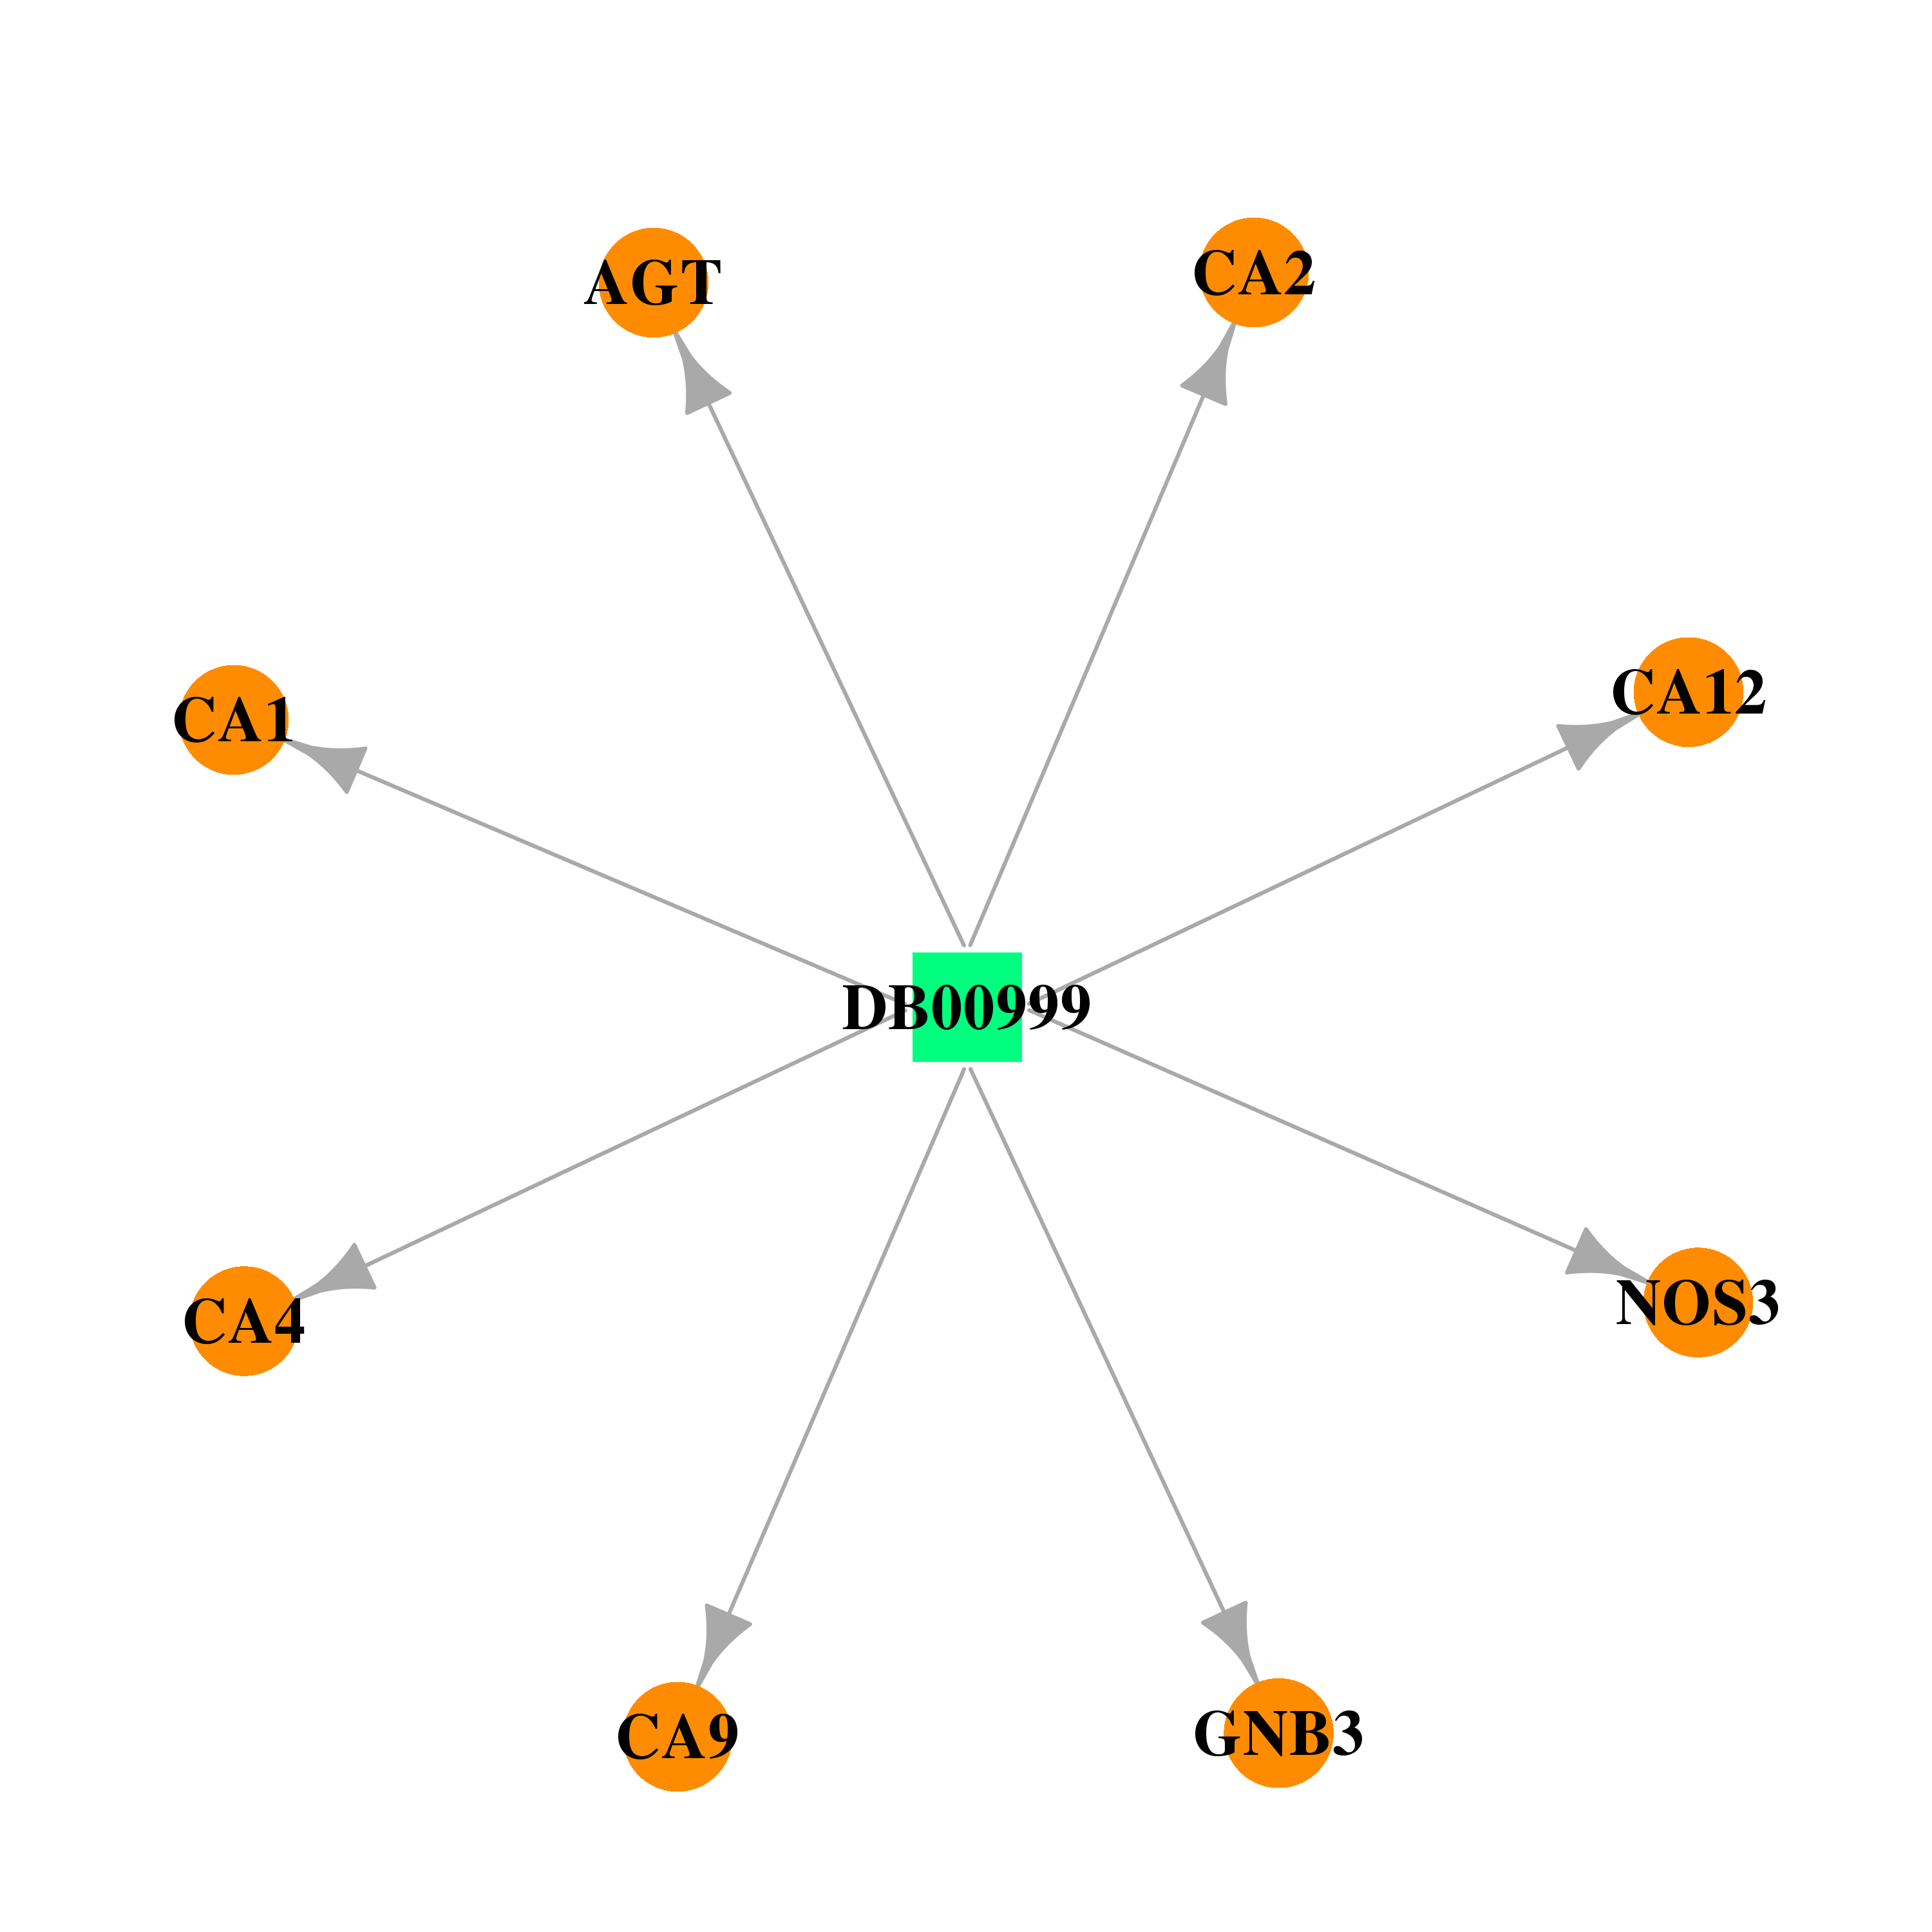 |  |
| Top |
| Cross referenced IDs for CA12 |
| * We obtained these cross-references from Uniprot database. It covers 150 different DBs, 18 categories. http://www.uniprot.org/help/cross_references_section |
: Open all cross reference information
|
Copyright © 2016-Present - The Univsersity of Texas Health Science Center at Houston @ |