|
||||||||||||||||||||
| |
| Phenotypic Information (metabolism pathway, cancer, disease, phenome) |
| |
| |
| Gene-Gene Network Information: Co-Expression Network, Interacting Genes & KEGG |
| |
|


| Gene Summary for MOGS |
| Basic gene info. | Gene symbol | MOGS |
| Gene name | mannosyl-oligosaccharide glucosidase | |
| Synonyms | CDG2B|CWH41|DER7|GCS1 | |
| Cytomap | UCSC genome browser: 2p13.1 | |
| Genomic location | chr2 :74688183-74692537 | |
| Type of gene | protein-coding | |
| RefGenes | NM_001146158.1, NM_006302.2, | |
| Ensembl id | ENSG00000115275 | |
| Description | glucosidase Iprocessing A-glucosidase I | |
| Modification date | 20141219 | |
| dbXrefs | MIM : 601336 | |
| HGNC : HGNC | ||
| Ensembl : ENSG00000115275 | ||
| HPRD : 03214 | ||
| Vega : OTTHUMG00000152886 | ||
| Protein | UniProt: go to UniProt's Cross Reference DB Table | |
| Expression | CleanEX: HS_MOGS | |
| BioGPS: 7841 | ||
| Gene Expression Atlas: ENSG00000115275 | ||
| The Human Protein Atlas: ENSG00000115275 | ||
| Pathway | NCI Pathway Interaction Database: MOGS | |
| KEGG: MOGS | ||
| REACTOME: MOGS | ||
| ConsensusPathDB | ||
| Pathway Commons: MOGS | ||
| Metabolism | MetaCyc: MOGS | |
| HUMANCyc: MOGS | ||
| Regulation | Ensembl's Regulation: ENSG00000115275 | |
| miRBase: chr2 :74,688,183-74,692,537 | ||
| TargetScan: NM_001146158 | ||
| cisRED: ENSG00000115275 | ||
| Context | iHOP: MOGS | |
| cancer metabolism search in PubMed: MOGS | ||
| UCL Cancer Institute: MOGS | ||
| Assigned class in ccmGDB | C | |
| Top |
| Phenotypic Information for MOGS(metabolism pathway, cancer, disease, phenome) |
| Cancer | CGAP: MOGS |
| Familial Cancer Database: MOGS | |
| * This gene is included in those cancer gene databases. |
|
|
|
|
|
| . | ||||||||||||||
Oncogene 1 | Significant driver gene in | |||||||||||||||||||
| cf) number; DB name 1 Oncogene; http://nar.oxfordjournals.org/content/35/suppl_1/D721.long, 2 Tumor Suppressor gene; https://bioinfo.uth.edu/TSGene/, 3 Cancer Gene Census; http://www.nature.com/nrc/journal/v4/n3/abs/nrc1299.html, 4 CancerGenes; http://nar.oxfordjournals.org/content/35/suppl_1/D721.long, 5 Network of Cancer Gene; http://ncg.kcl.ac.uk/index.php, 1Therapeutic Vulnerabilities in Cancer; http://cbio.mskcc.org/cancergenomics/statius/ |
| REACTOME_METABOLISM_OF_PROTEINS | |
| OMIM | |
| Orphanet | |
| Disease | KEGG Disease: MOGS |
| MedGen: MOGS (Human Medical Genetics with Condition) | |
| ClinVar: MOGS | |
| Phenotype | MGI: MOGS (International Mouse Phenotyping Consortium) |
| PhenomicDB: MOGS | |
| Mutations for MOGS |
| * Under tables are showing count per each tissue to give us broad intuition about tissue specific mutation patterns.You can go to the detailed page for each mutation database's web site. |
| There's no structural variation information in COSMIC data for this gene. |
| * From mRNA Sanger sequences, Chitars2.0 arranged chimeric transcripts. This table shows MOGS related fusion information. |
| ID | Head Gene | Tail Gene | Accession | Gene_a | qStart_a | qEnd_a | Chromosome_a | tStart_a | tEnd_a | Gene_a | qStart_a | qEnd_a | Chromosome_a | tStart_a | tEnd_a |
| BG979303 | MOGS | 10 | 112 | 2 | 74689490 | 74689596 | MOGS | 112 | 245 | 2 | 74688425 | 74688558 | |
| BF899407 | MOGS | 1 | 210 | 2 | 74688491 | 74689159 | HBB | 208 | 505 | 11 | 5246906 | 5248183 | |
| BF899427 | MOGS | 7 | 210 | 2 | 74688491 | 74688694 | HBB | 208 | 508 | 11 | 5246903 | 5248183 | |
| BF803127 | MOGS | 15 | 135 | 2 | 74689405 | 74689528 | MALAT1 | 128 | 433 | 11 | 65271740 | 65272046 | |
| DA571383 | INO80B | 1 | 203 | 2 | 74686976 | 74687172 | MOGS | 191 | 718 | 2 | 74691438 | 74691965 | |
| Top |
| There's no copy number variation information in COSMIC data for this gene. |
| Top |
|
 |
| Top |
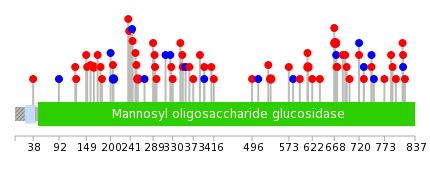
| Stat. for Non-Synonymous SNVs (# total SNVs=50) | (# total SNVs=9) |
 |  |
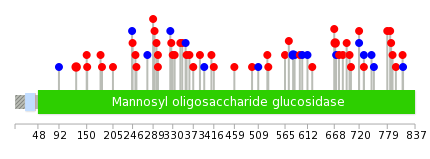
(# total SNVs=1) | (# total SNVs=1) |
 |  |
| Top |
| * When you move the cursor on each content, you can see more deailed mutation information on the Tooltip. Those are primary_site,primary_histology,mutation(aa),pubmedID. |
| GRCh37 position | Mutation(aa) | Unique sampleID count |
| chr2:74688908-74688908 | p.Q670E | 3 |
| chr2:74688678-74688678 | p.D746D | 2 |
| chr2:74691708-74691708 | p.A165D | 2 |
| chr2:74689312-74689312 | p.R535Q | 2 |
| chr2:74690475-74690475 | p.F206F | 2 |
| chr2:74689078-74689078 | p.R613Q | 2 |
| chr2:74690323-74690323 | p.Y257C | 2 |
| chr2:74688556-74688556 | p.L787P | 1 |
| chr2:74689430-74689430 | p.A496T | 1 |
| chr2:74690493-74690493 | p.L200L | 1 |
| Top |
|
 |
| Point Mutation/ Tissue ID | 1 | 2 | 3 | 4 | 5 | 6 | 7 | 8 | 9 | 10 | 11 | 12 | 13 | 14 | 15 | 16 | 17 | 18 | 19 | 20 |
| # sample | 5 | 2 | 1 | 11 | 5 | 7 | 3 | 1 | 3 | 12 | 9 | |||||||||
| # mutation | 5 | 2 | 1 | 11 | 5 | 7 | 4 | 1 | 3 | 14 | 9 | |||||||||
| nonsynonymous SNV | 4 | 2 | 1 | 8 | 5 | 5 | 3 | 1 | 10 | 6 | ||||||||||
| synonymous SNV | 1 | 3 | 2 | 1 | 1 | 2 | 4 | 3 |
| cf) Tissue ID; Tissue type (1; BLCA[Bladder Urothelial Carcinoma], 2; BRCA[Breast invasive carcinoma], 3; CESC[Cervical squamous cell carcinoma and endocervical adenocarcinoma], 4; COAD[Colon adenocarcinoma], 5; GBM[Glioblastoma multiforme], 6; Glioma Low Grade, 7; HNSC[Head and Neck squamous cell carcinoma], 8; KICH[Kidney Chromophobe], 9; KIRC[Kidney renal clear cell carcinoma], 10; KIRP[Kidney renal papillary cell carcinoma], 11; LAML[Acute Myeloid Leukemia], 12; LUAD[Lung adenocarcinoma], 13; LUSC[Lung squamous cell carcinoma], 14; OV[Ovarian serous cystadenocarcinoma ], 15; PAAD[Pancreatic adenocarcinoma], 16; PRAD[Prostate adenocarcinoma], 17; SKCM[Skin Cutaneous Melanoma], 18:STAD[Stomach adenocarcinoma], 19:THCA[Thyroid carcinoma], 20:UCEC[Uterine Corpus Endometrial Carcinoma]) |
| Top |
| * We represented just top 10 SNVs. When you move the cursor on each content, you can see more deailed mutation information on the Tooltip. Those are primary_site, primary_histology, mutation(aa), pubmedID. |
| Genomic Position | Mutation(aa) | Unique sampleID count |
| chr2:74688908 | p.L582L,MOGS | 2 |
| chr2:74691819 | p.P128L,MOGS | 2 |
| chr2:74689172 | p.G299S,MOGS | 2 |
| chr2:74690021 | p.Q670E,MOGS | 2 |
| chr2:74688581 | p.R596W,MOGS | 1 |
| chr2:74689799 | p.Q359H,MOGS | 1 |
| chr2:74688883 | p.L245L,MOGS | 1 |
| chr2:74690030 | p.D746D,MOGS | 1 |
| chr2:74689222 | p.Y585Y,MOGS | 1 |
| chr2:74691751 | p.L357L,MOGS | 1 |
| * Copy number data were extracted from TCGA using R package TCGA-Assembler. The URLs of all public data files on TCGA DCC data server were gathered on Jan-05-2015. Function ProcessCNAData in TCGA-Assembler package was used to obtain gene-level copy number value which is calculated as the average copy number of the genomic region of a gene. |
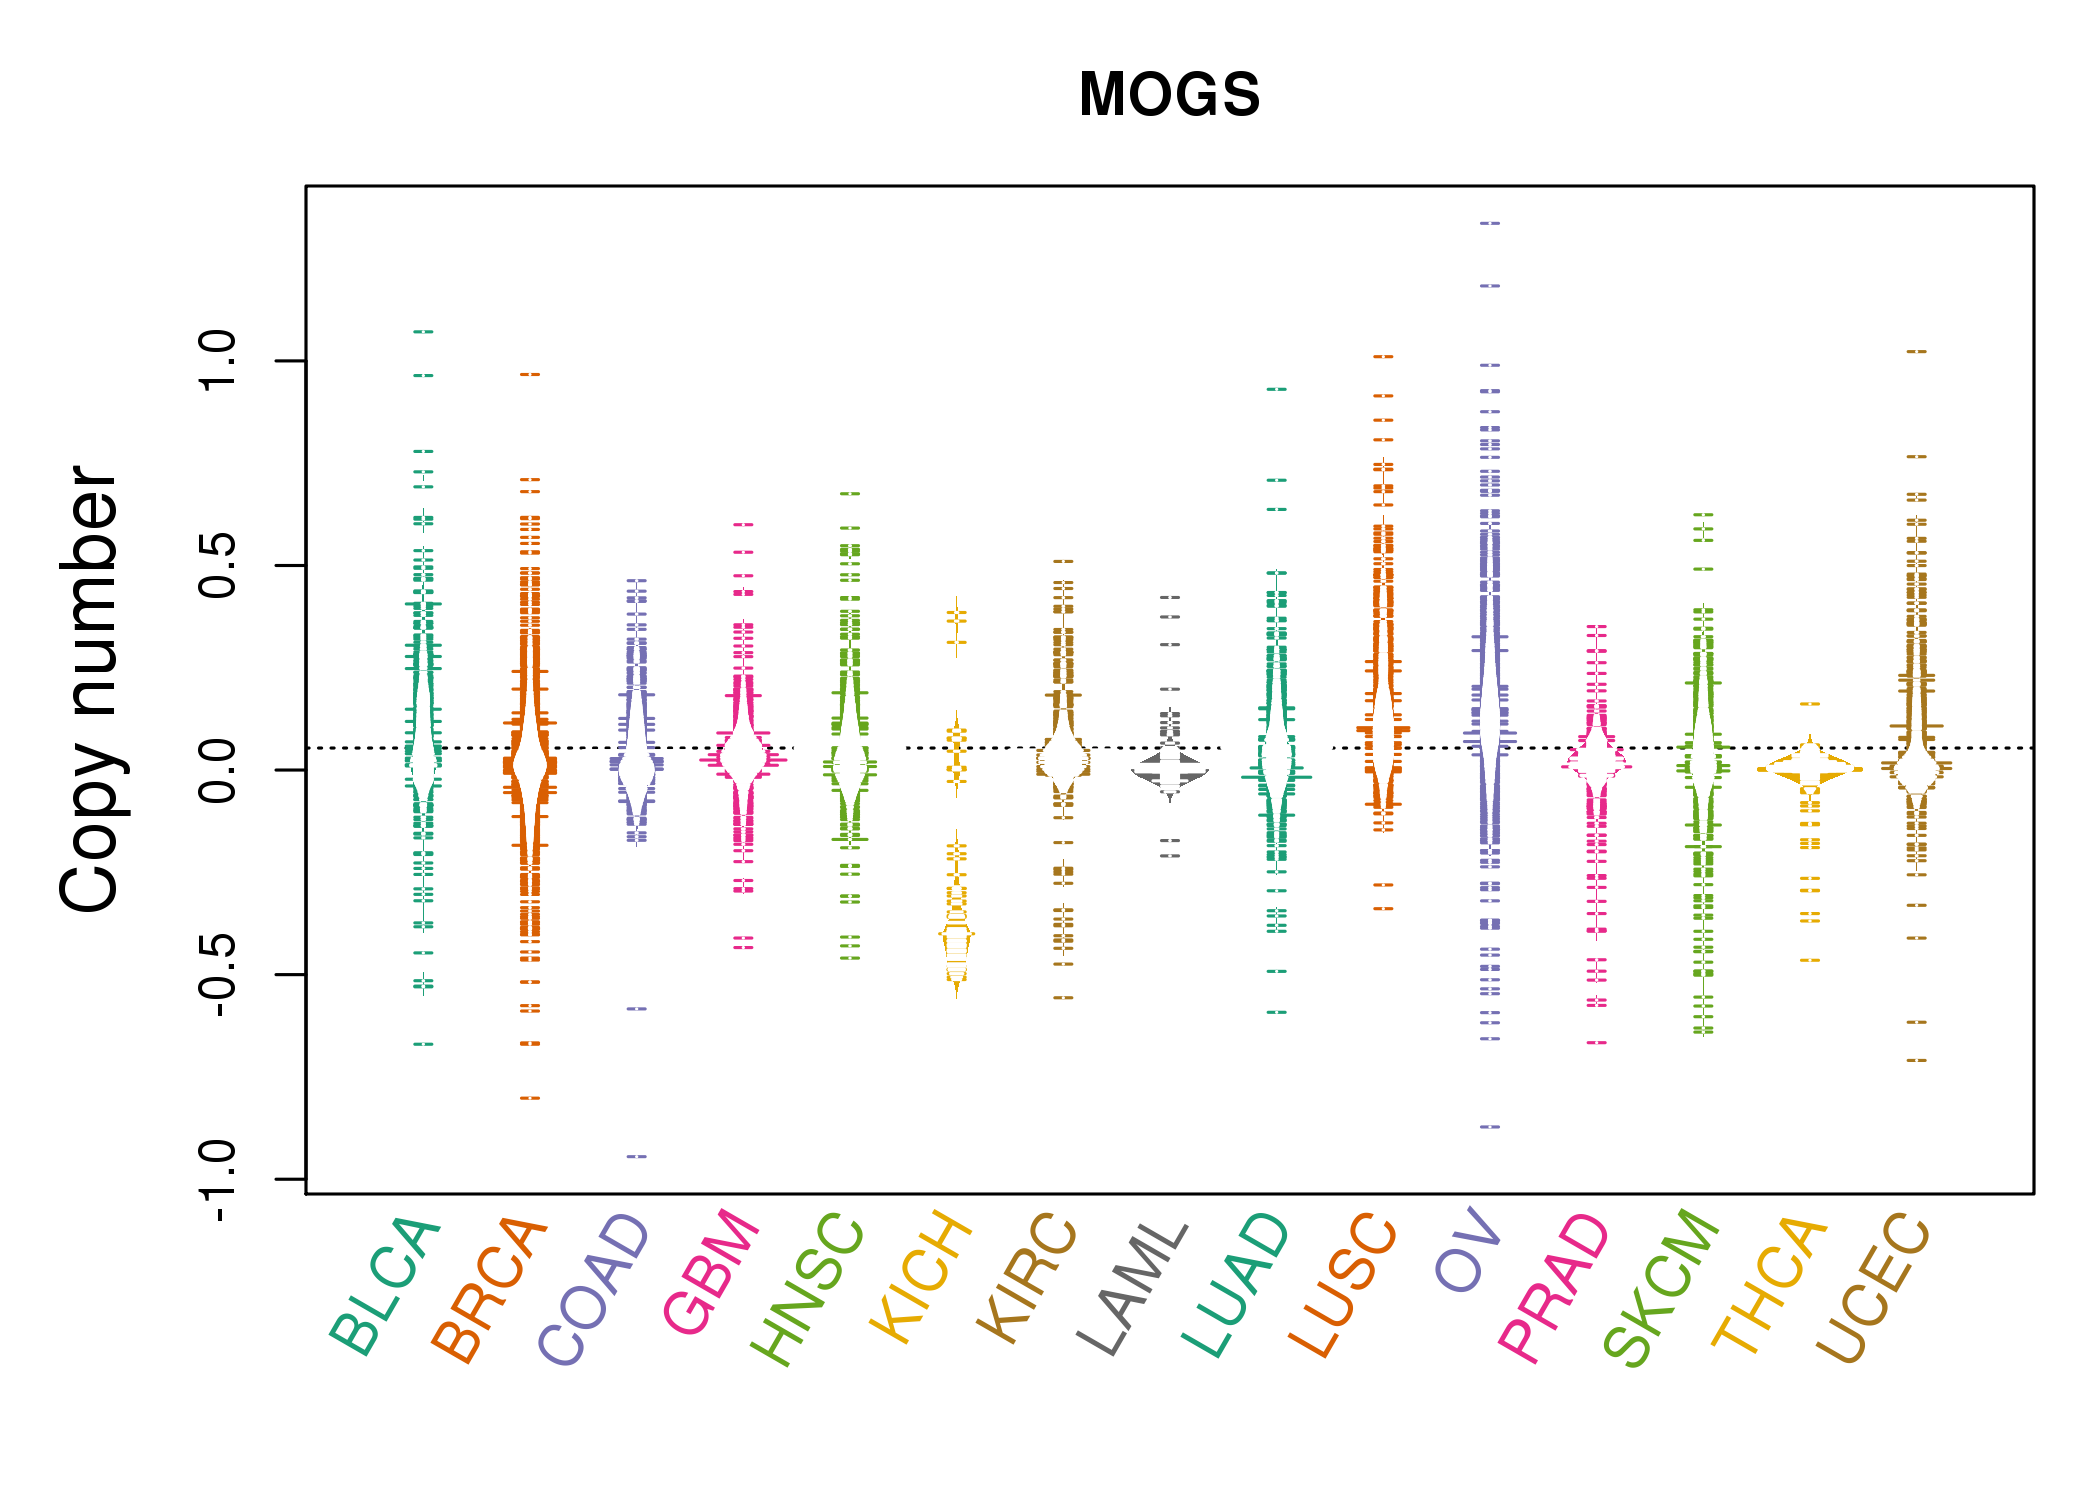 |
| cf) Tissue ID[Tissue type]: BLCA[Bladder Urothelial Carcinoma], BRCA[Breast invasive carcinoma], CESC[Cervical squamous cell carcinoma and endocervical adenocarcinoma], COAD[Colon adenocarcinoma], GBM[Glioblastoma multiforme], Glioma Low Grade, HNSC[Head and Neck squamous cell carcinoma], KICH[Kidney Chromophobe], KIRC[Kidney renal clear cell carcinoma], KIRP[Kidney renal papillary cell carcinoma], LAML[Acute Myeloid Leukemia], LUAD[Lung adenocarcinoma], LUSC[Lung squamous cell carcinoma], OV[Ovarian serous cystadenocarcinoma ], PAAD[Pancreatic adenocarcinoma], PRAD[Prostate adenocarcinoma], SKCM[Skin Cutaneous Melanoma], STAD[Stomach adenocarcinoma], THCA[Thyroid carcinoma], UCEC[Uterine Corpus Endometrial Carcinoma] |
| Top |
| Gene Expression for MOGS |
| * CCLE gene expression data were extracted from CCLE_Expression_Entrez_2012-10-18.res: Gene-centric RMA-normalized mRNA expression data. |
 |
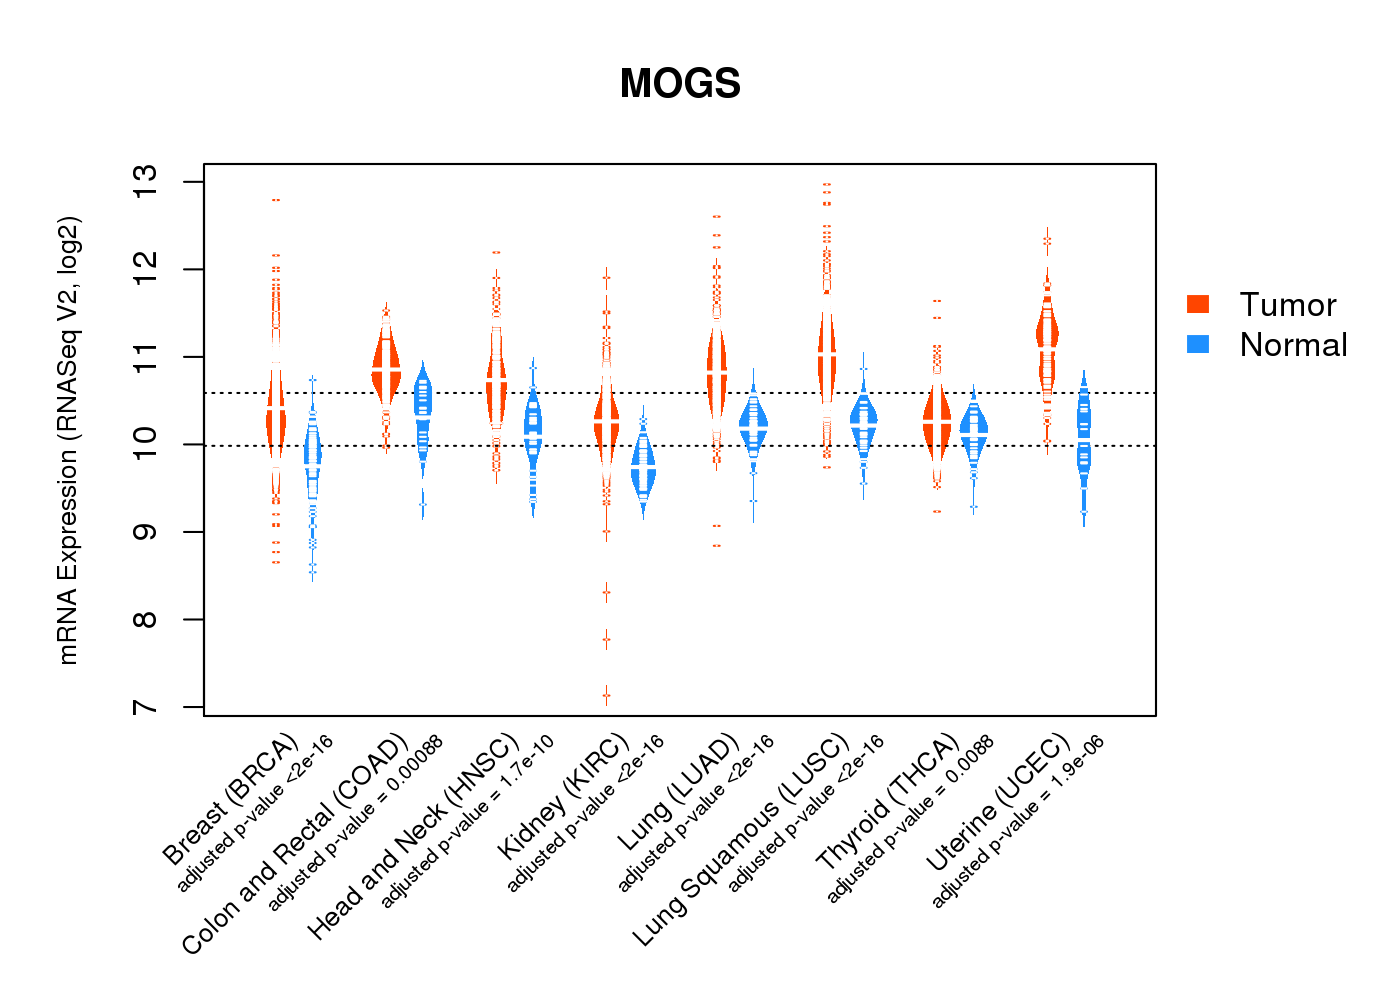
| * Normalized gene expression data of RNASeqV2 was extracted from TCGA using R package TCGA-Assembler. The URLs of all public data files on TCGA DCC data server were gathered at Jan-05-2015. Only eight cancer types have enough normal control samples for differential expression analysis. (t test, adjusted p<0.05 (using Benjamini-Hochberg FDR)) |
 |
| Top |
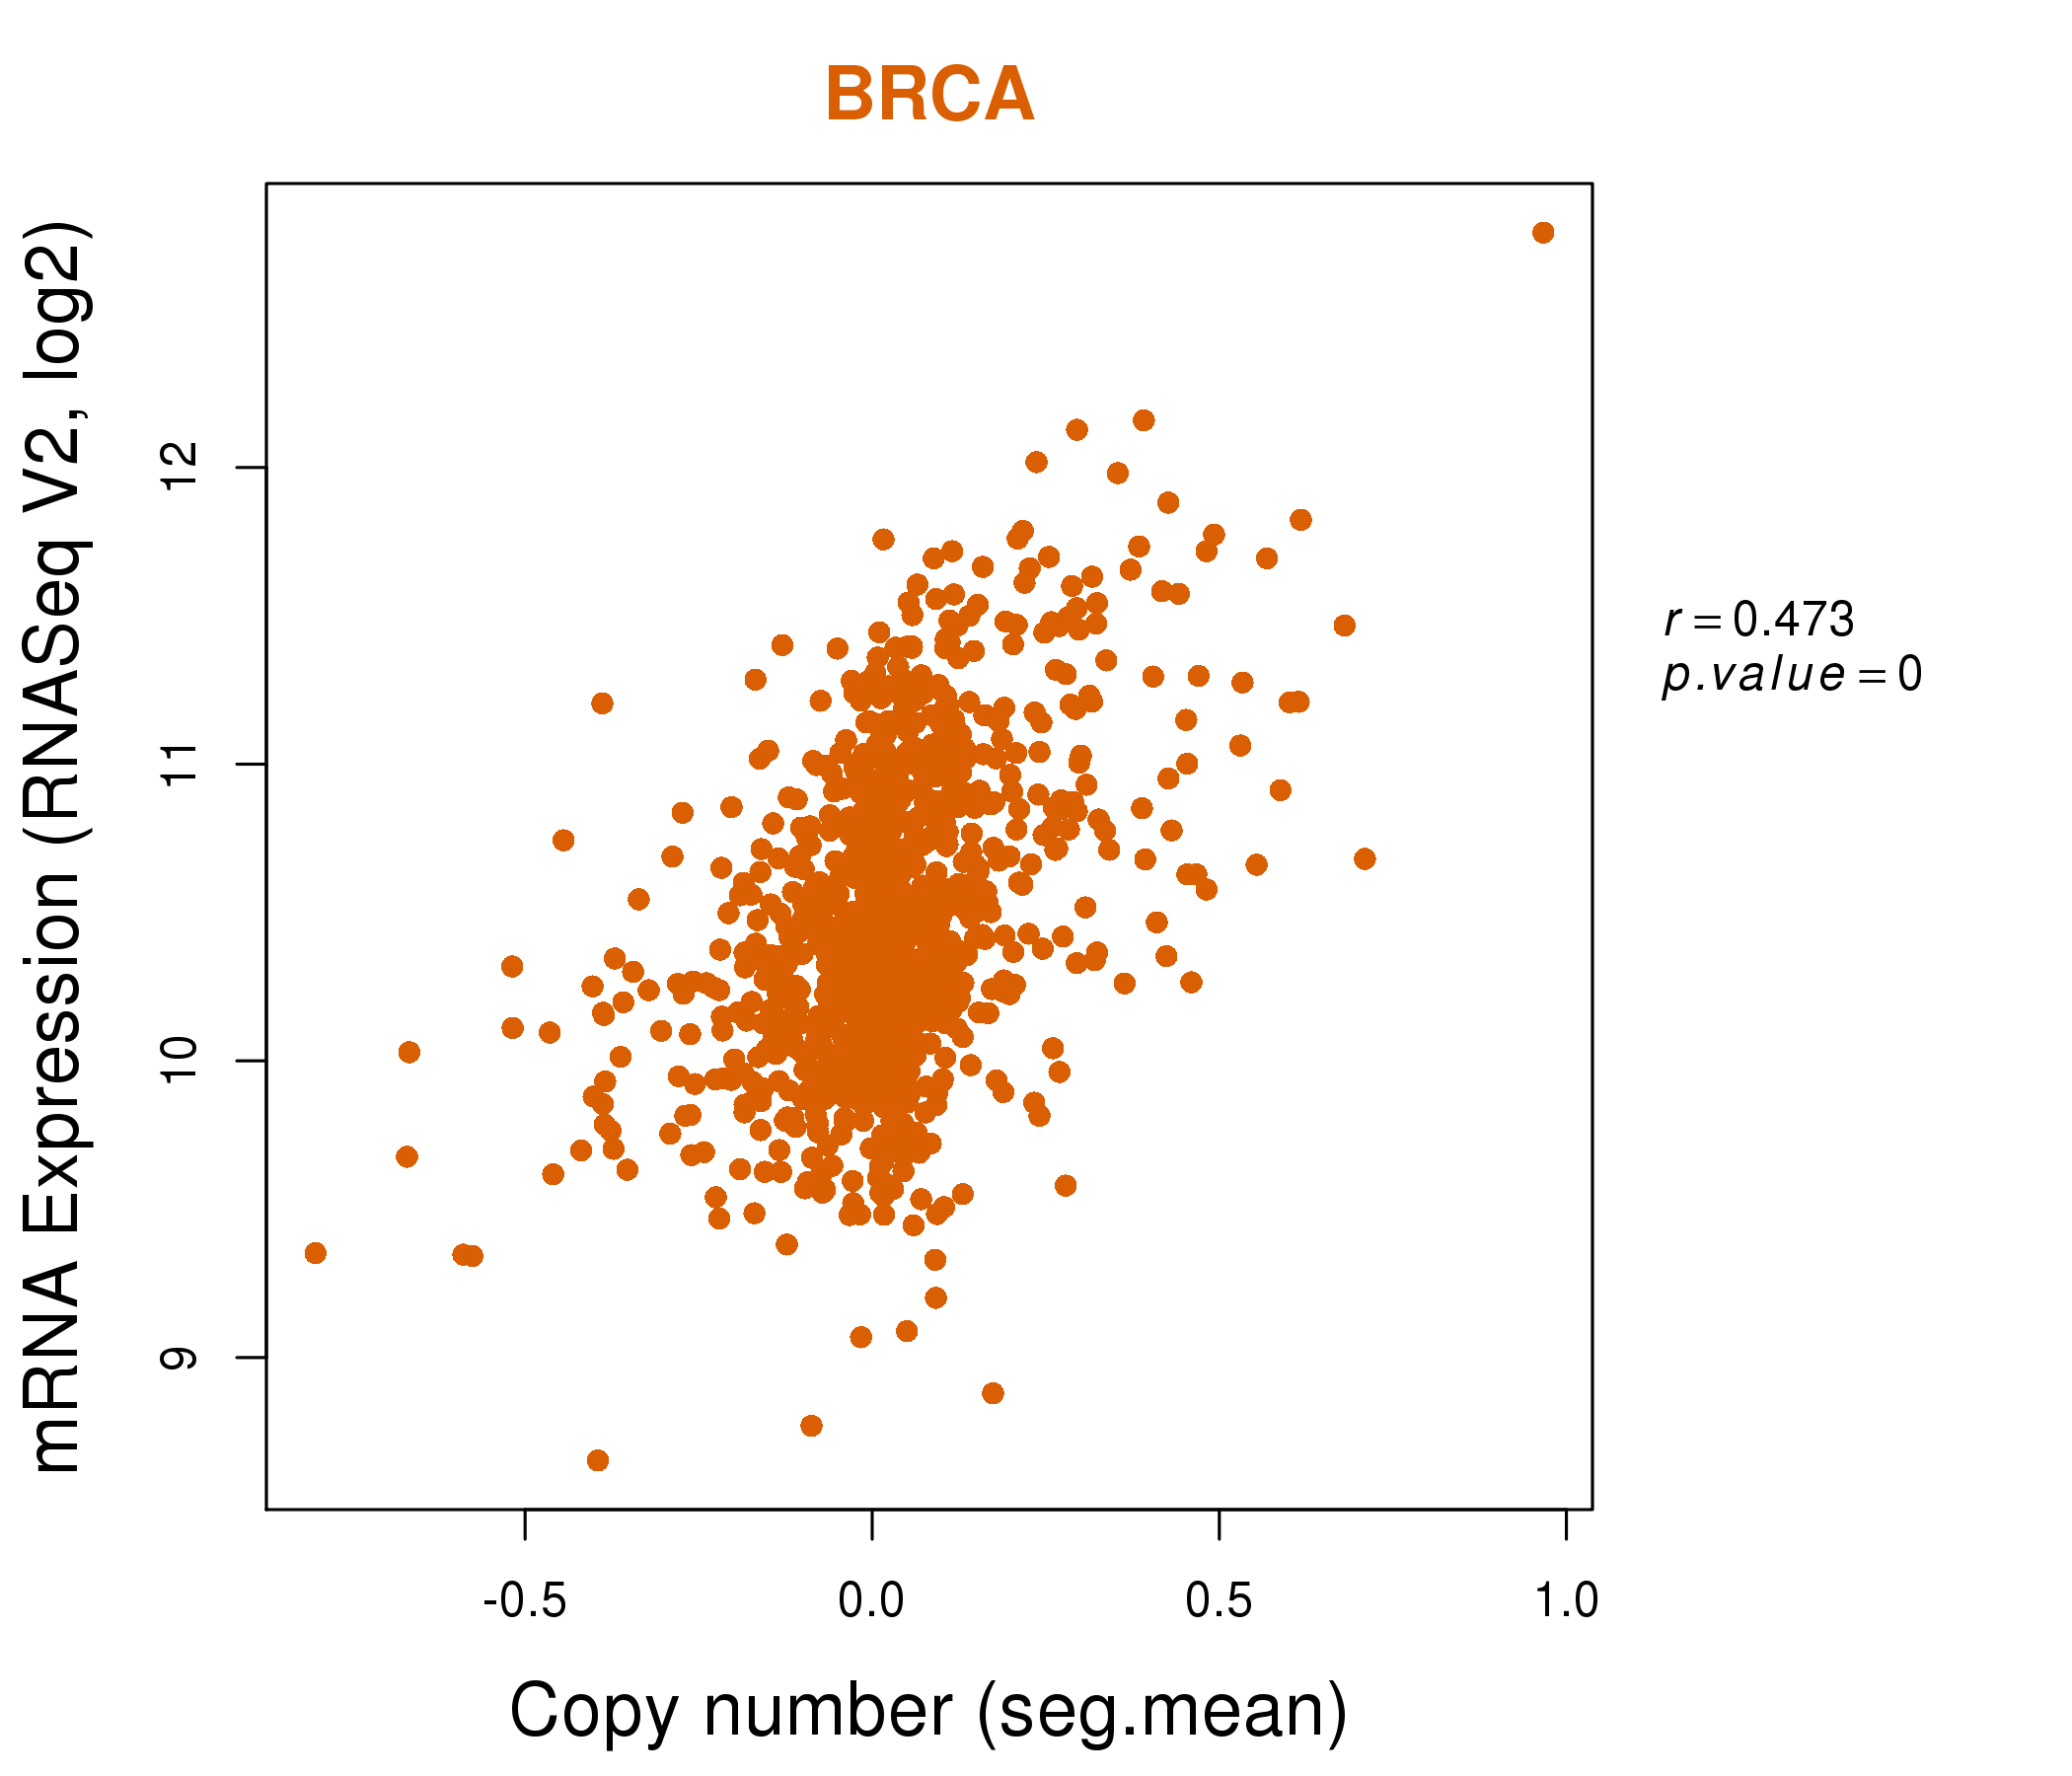
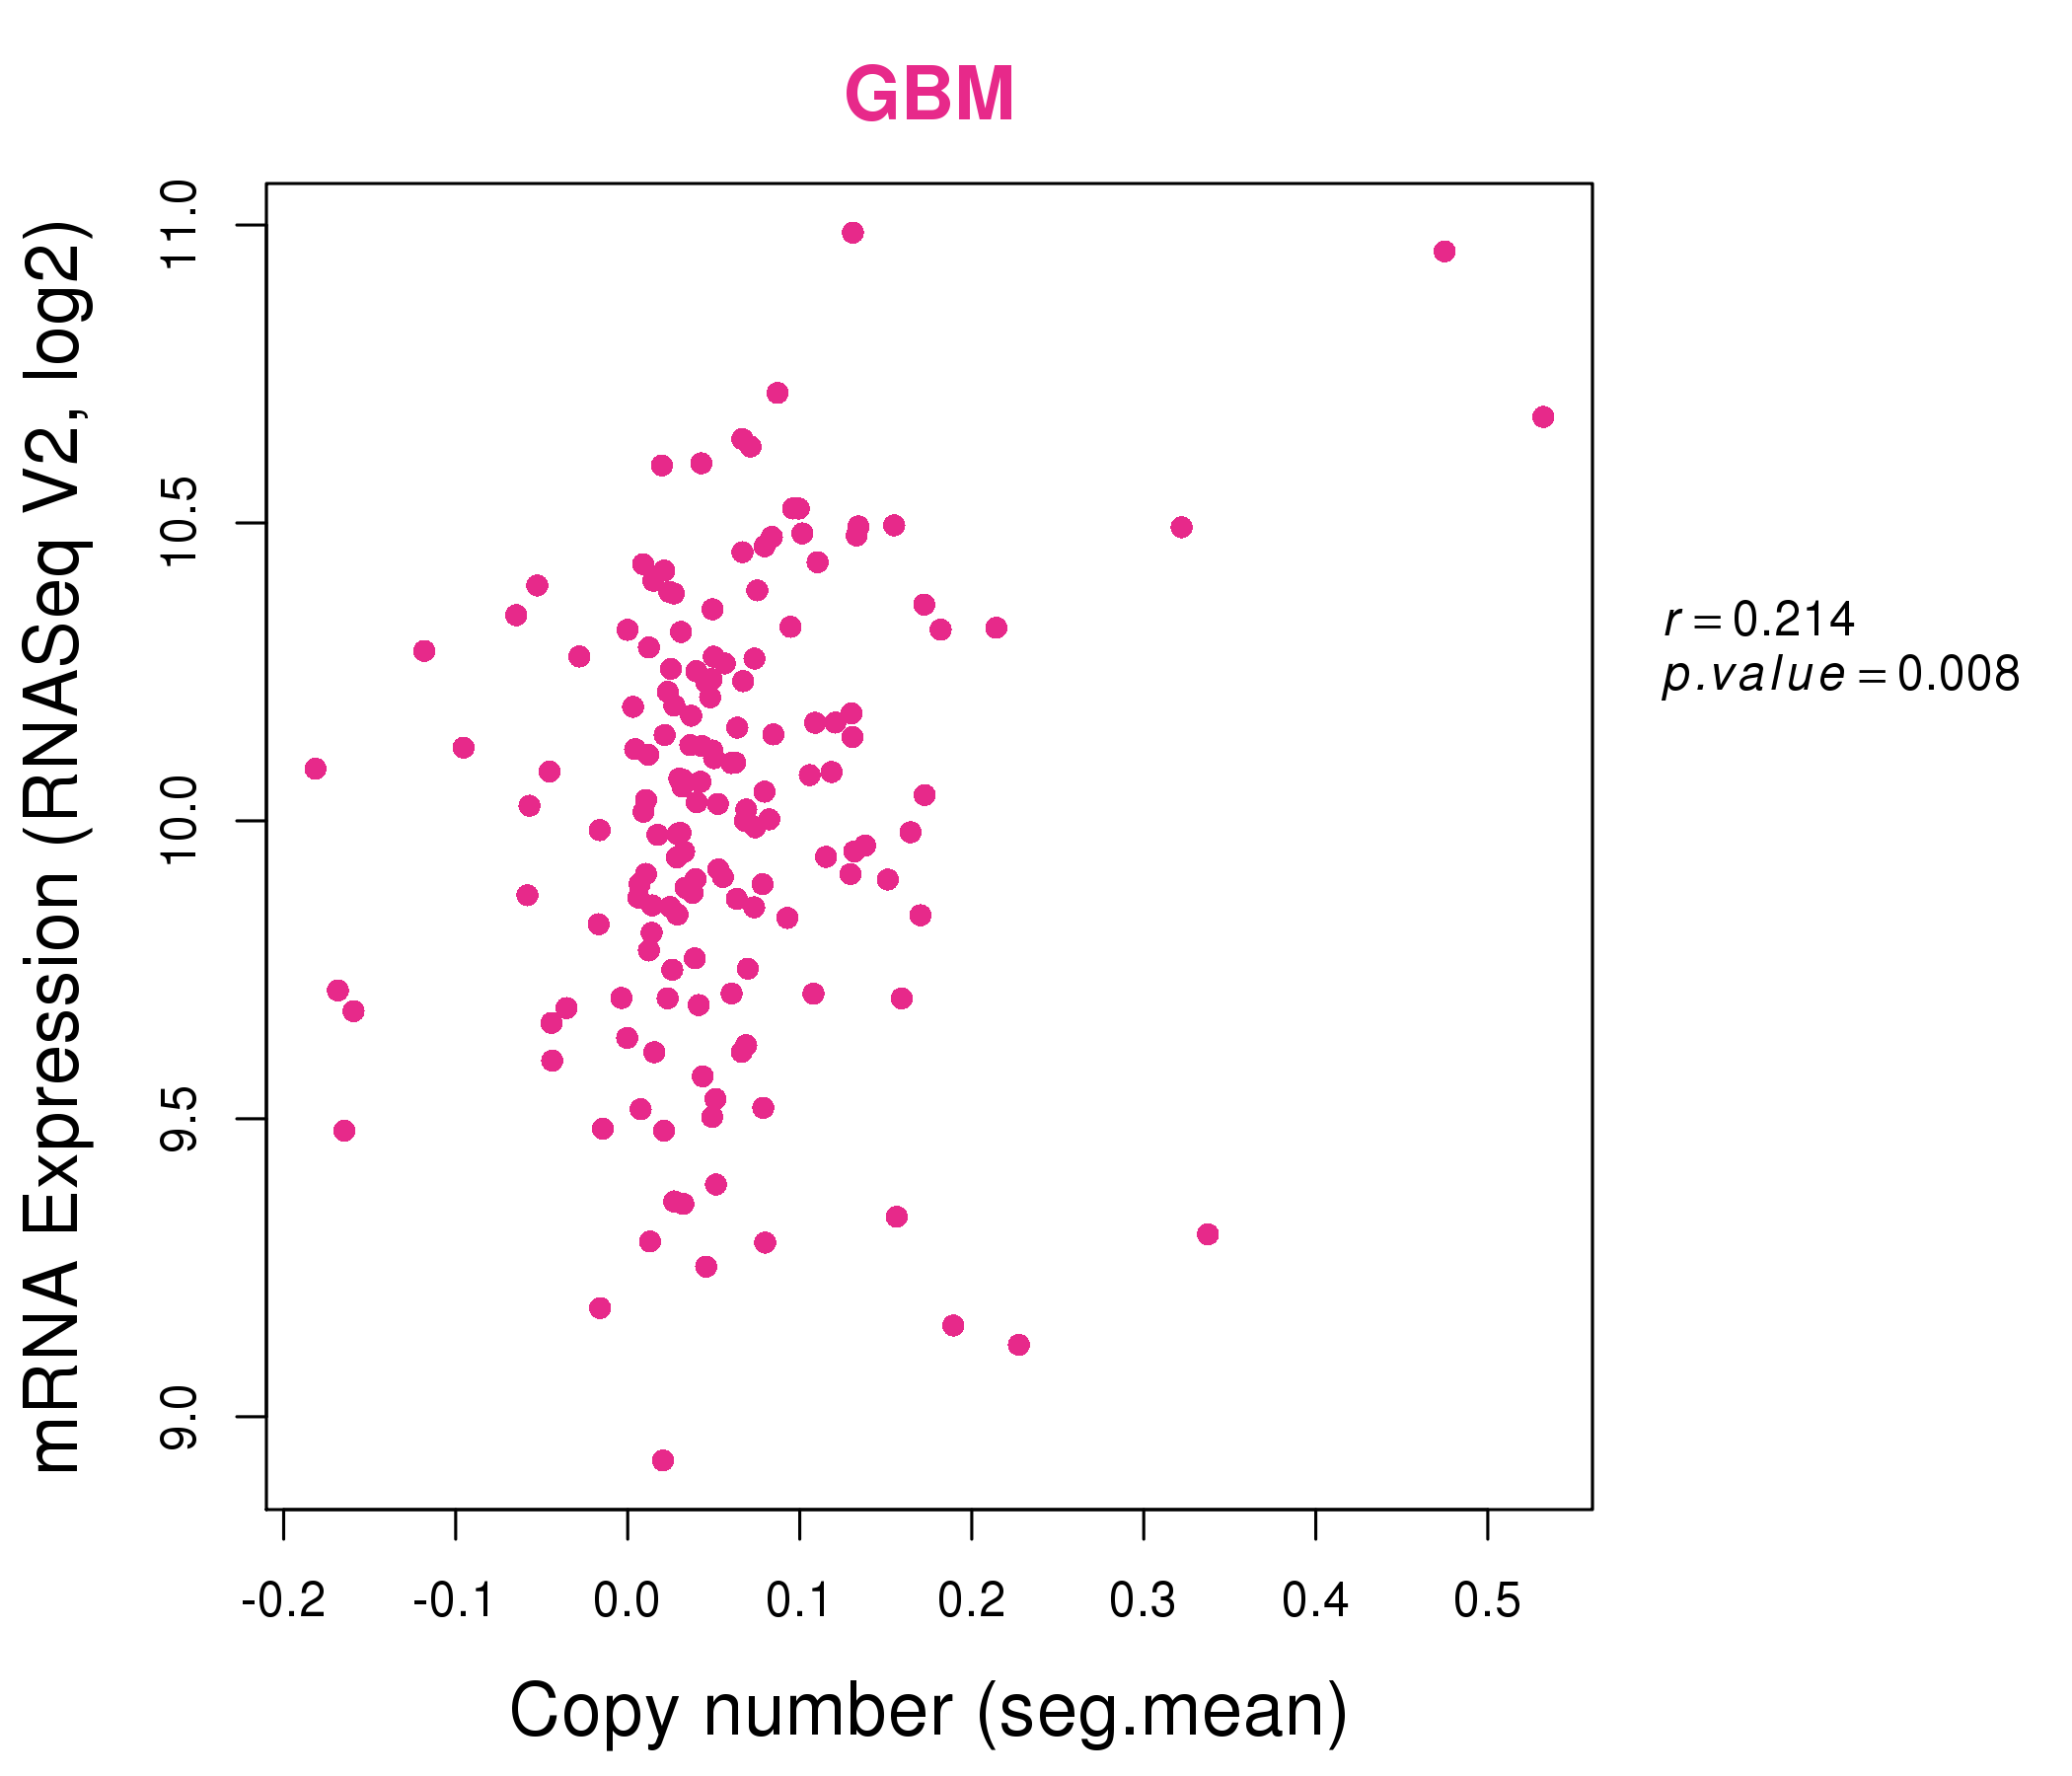
| * This plots show the correlation between CNV and gene expression. |
: Open all plots for all cancer types
 |
|
 |
|
| Top |
| Gene-Gene Network Information |
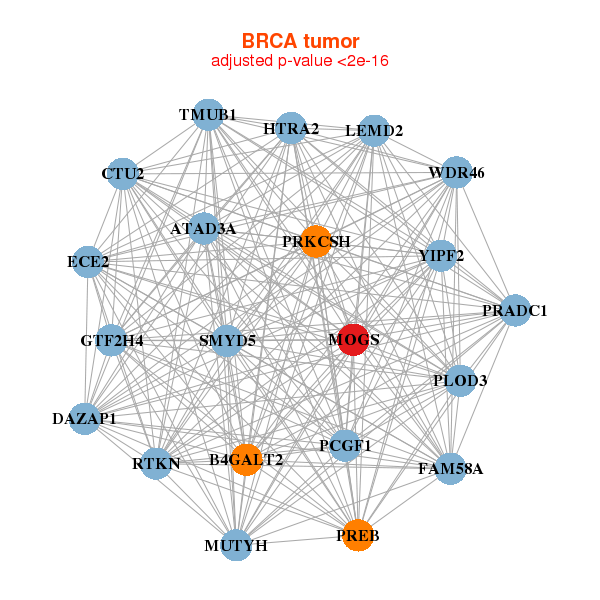
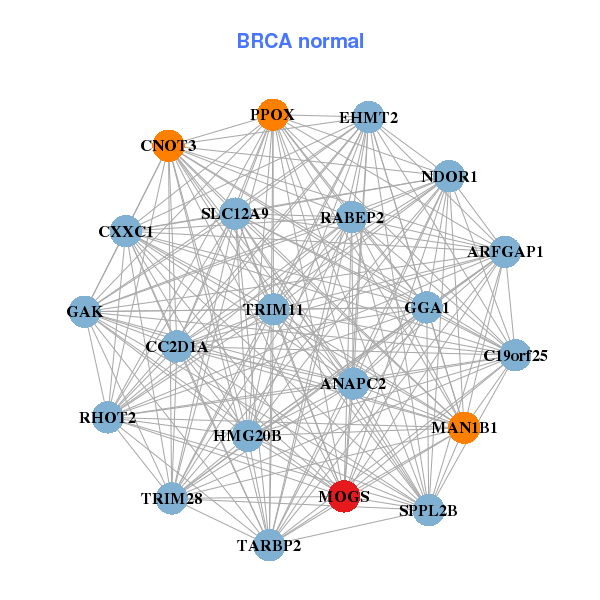
| * Co-Expression network figures were drawn using R package igraph. Only the top 20 genes with the highest correlations were shown. Red circle: input gene, orange circle: cell metabolism gene, sky circle: other gene |
: Open all plots for all cancer types
 |
|
| ATAD3A,B4GALT2,PRADC1,CTU2,DAZAP1,ECE2,FAM58A, GTF2H4,HTRA2,LEMD2,MOGS,MUTYH,PCGF1,PLOD3, PREB,PRKCSH,RTKN,SMYD5,TMUB1,WDR46,YIPF2 | ANAPC2,ARFGAP1,C19orf25,CC2D1A,CNOT3,CXXC1,EHMT2, GAK,GGA1,HMG20B,MAN1B1,MOGS,NDOR1,PPOX, RABEP2,RHOT2,SLC12A9,SPPL2B,TARBP2,TRIM11,TRIM28 |
 |
|
| AHSA2,ANKS3,ATG4B,CEP131,C2orf68,RABL6,CAPN10, CDK10,E4F1,EIF2B4,ING5,KANSL3,MOGS,RECQL5, SMPD4,SNAPC4,SNRNP70,STK25,SUPT7L,TMCO6,ZNF142 | ABCF3,ADRBK1,AP1G2,ARHGEF10L,ATP13A1,ATP6AP1,GPR56, GTF3C2,HDAC6,IGSF8,KIAA1804,LPAR5,MEN1,MOGS, POLG,RFX1,SEMA4G,SH3RF2,SYK,TYK2,ZBED4 |
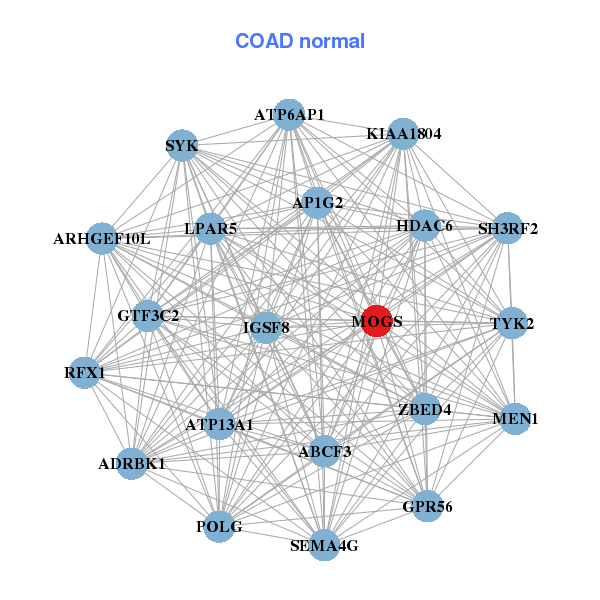
| * Co-Expression network figures were drawn using R package igraph. Only the top 20 genes with the highest correlations were shown. Red circle: input gene, orange circle: cell metabolism gene, sky circle: other gene |
: Open all plots for all cancer types
| Top |
: Open all interacting genes' information including KEGG pathway for all interacting genes from DAVID
| Top |
| Pharmacological Information for MOGS |
| There's no related Drug. |
| Top |
| Cross referenced IDs for MOGS |
| * We obtained these cross-references from Uniprot database. It covers 150 different DBs, 18 categories. http://www.uniprot.org/help/cross_references_section |
: Open all cross reference information
|
Copyright © 2016-Present - The Univsersity of Texas Health Science Center at Houston @ |