|
|||||||||||||||||||||||||||||||||||||||||||||||||||||||||||||||||||||||||||||||||||||||||||||||||||||||||||||||||||||||||||||||||||||||||||||||||||||||||||||||||||||||||||||||||||||||||||||||||||||||||||||||||||||||||||||||||||||||||||||||||||||||||||||||||||||||||||||||||||||||||||||||||||||||||||||||||||||||||||||||||||||||||||||||||||||||||||||||||||||
| |
| Phenotypic Information (metabolism pathway, cancer, disease, phenome) |
| |
| |
| Gene-Gene Network Information: Co-Expression Network, Interacting Genes & KEGG |
| |
|


| Gene Summary for CAD |
| Basic gene info. | Gene symbol | CAD |
| Gene name | carbamoyl-phosphate synthetase 2, aspartate transcarbamylase, and dihydroorotase | |
| Synonyms | - | |
| Cytomap | UCSC genome browser: 2p22-p21 | |
| Genomic location | chr2 :27440257-27466654 | |
| Type of gene | protein-coding | |
| RefGenes | NM_004341.3, | |
| Ensembl id | ENSG00000084774 | |
| Description | CAD proteinCAD trifunctional proteinmultifunctional protein CAD | |
| Modification date | 20141207 | |
| dbXrefs | MIM : 114010 | |
| HGNC : HGNC | ||
| Ensembl : ENSG00000084774 | ||
| HPRD : 06437 | ||
| Vega : OTTHUMG00000097070 | ||
| Protein | UniProt: P27708 go to UniProt's Cross Reference DB Table | |
| Expression | CleanEX: HS_CAD | |
| BioGPS: 790 | ||
| Gene Expression Atlas: ENSG00000084774 | ||
| The Human Protein Atlas: ENSG00000084774 | ||
| Pathway | NCI Pathway Interaction Database: CAD | |
| KEGG: CAD | ||
| REACTOME: CAD | ||
| ConsensusPathDB | ||
| Pathway Commons: CAD | ||
| Metabolism | MetaCyc: CAD | |
| HUMANCyc: CAD | ||
| Regulation | Ensembl's Regulation: ENSG00000084774 | |
| miRBase: chr2 :27,440,257-27,466,654 | ||
| TargetScan: NM_004341 | ||
| cisRED: ENSG00000084774 | ||
| Context | iHOP: CAD | |
| cancer metabolism search in PubMed: CAD | ||
| UCL Cancer Institute: CAD | ||
| Assigned class in ccmGDB | A - This gene has a literature evidence and it belongs to cancer gene. | |
| References showing role of CAD in cancer cell metabolism | 1. Sharma A, Janocha AJ, Hill BT, Smith MR, Erzurum SC, et al. (2014) Targeting mTORC1-mediated metabolic addiction overcomes fludarabine resistance in malignant B cells. Mol Cancer Res 12: 1205-1215. doi: 10.1158/1541-7786.MCR-14-0124. pmid: 4163513. go to article 2. Morin A, Fritsch L, Mathieu JR, Gilbert C, Guarmit B, et al. (2012) Identification of CAD as an androgen receptor interactant and an early marker of prostate tumor recurrence. FASEB J 26: 460-467. doi: 10.1096/fj.11-191296. go to article 3. Makinoshima H, Takita M, Matsumoto S, Yagishita A, Owada S, et al. (2014) Epidermal growth factor receptor (EGFR) signaling regulates global metabolic pathways in EGFR-mutated lung adenocarcinoma. J Biol Chem 289: 20813-20823. doi: 10.1074/jbc.M114.575464. pmid: 4110289. go to article 4. Graves LM, Guy HI, Kozlowski P, Huang M, Lazarowski E, et al. (2000) Regulation of carbamoyl phosphate synthetase by MAP kinase. Nature 403: 328-332. doi: 10.1038/35002111. go to article | |
| Top |
| Phenotypic Information for CAD(metabolism pathway, cancer, disease, phenome) |
| Cancer | CGAP: CAD |
| Familial Cancer Database: CAD | |
| * This gene is included in those cancer gene databases. |
|
|
|
|
|
| . | |||||||||||||||||||||||||||||||||||||||||||||||||||||||||||||||||||||||||||||||||||||||||||||||||||||||||||||||||||||||||||||||||||||||||||||||||||||||||||||||||||||||||||||||||||||||||||||||||||||||||||||||||||||||||||||||||||||||||||||||||||||||||||||||||||||||||||||||||||||||||||||||||||||||||||||||||||||||||||||||||||||||||||||||||||||||||||||||
Oncogene 1 | Significant driver gene in | ||||||||||||||||||||||||||||||||||||||||||||||||||||||||||||||||||||||||||||||||||||||||||||||||||||||||||||||||||||||||||||||||||||||||||||||||||||||||||||||||||||||||||||||||||||||||||||||||||||||||||||||||||||||||||||||||||||||||||||||||||||||||||||||||||||||||||||||||||||||||||||||||||||||||||||||||||||||||||||||||||||||||||||||||||||||||||||||||||||
| cf) number; DB name 1 Oncogene; http://nar.oxfordjournals.org/content/35/suppl_1/D721.long, 2 Tumor Suppressor gene; https://bioinfo.uth.edu/TSGene/, 3 Cancer Gene Census; http://www.nature.com/nrc/journal/v4/n3/abs/nrc1299.html, 4 CancerGenes; http://nar.oxfordjournals.org/content/35/suppl_1/D721.long, 5 Network of Cancer Gene; http://ncg.kcl.ac.uk/index.php, 1Therapeutic Vulnerabilities in Cancer; http://cbio.mskcc.org/cancergenomics/statius/ |
| KEGG_PYRIMIDINE_METABOLISM KEGG_ALANINE_ASPARTATE_AND_GLUTAMATE_METABOLISM REACTOME_METABOLISM_OF_NUCLEOTIDES REACTOME_PYRIMIDINE_METABOLISM | |
| OMIM | 114010; gene. |
| Orphanet | |
| Disease | KEGG Disease: CAD |
| MedGen: CAD (Human Medical Genetics with Condition) | |
| ClinVar: CAD | |
| Phenotype | MGI: CAD (International Mouse Phenotyping Consortium) |
| PhenomicDB: CAD | |
| Mutations for CAD |
| * Under tables are showing count per each tissue to give us broad intuition about tissue specific mutation patterns.You can go to the detailed page for each mutation database's web site. |
| - Statistics for Tissue and Mutation type | Top |
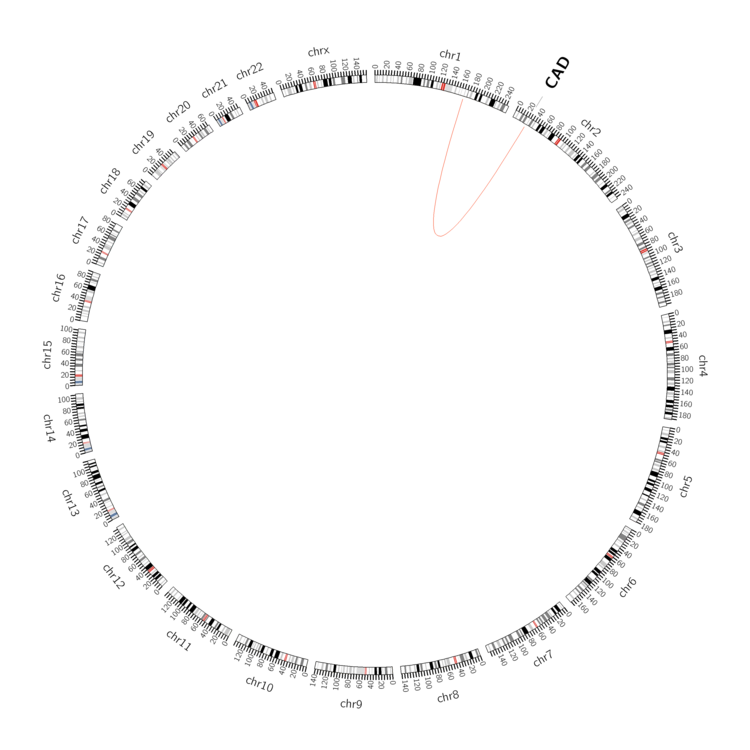 |
| - For Inter-chromosomal Variations |
| There's no inter-chromosomal structural variation. |
| - For Intra-chromosomal Variations |
| There's no intra-chromosomal structural variation. |
| Sample | Symbol_a | Chr_a | Start_a | End_a | Symbol_b | Chr_b | Start_b | End_b |
| cf) Tissue number; Tissue name (1;Breast, 2;Central_nervous_system, 3;Haematopoietic_and_lymphoid_tissue, 4;Large_intestine, 5;Liver, 6;Lung, 7;Ovary, 8;Pancreas, 9;Prostate, 10;Skin, 11;Soft_tissue, 12;Upper_aerodigestive_tract) |
| * From mRNA Sanger sequences, Chitars2.0 arranged chimeric transcripts. This table shows CAD related fusion information. |
| ID | Head Gene | Tail Gene | Accession | Gene_a | qStart_a | qEnd_a | Chromosome_a | tStart_a | tEnd_a | Gene_a | qStart_a | qEnd_a | Chromosome_a | tStart_a | tEnd_a |
| CN265854 | CAD | 1 | 56 | 2 | 27463778 | 27463935 | CKAP5 | 49 | 133 | 11 | 46765092 | 46765176 | |
| BF765434 | FOXK2 | 1 | 210 | 17 | 80559507 | 80559716 | CAD | 202 | 327 | 2 | 27459622 | 27460295 | |
| Top |
| Mutation type/ Tissue ID | brca | cns | cerv | endome | haematopo | kidn | Lintest | liver | lung | ns | ovary | pancre | prost | skin | stoma | thyro | urina | |||
| Total # sample | 1 | |||||||||||||||||||
| GAIN (# sample) | 1 | |||||||||||||||||||
| LOSS (# sample) |
| cf) Tissue ID; Tissue type (1; Breast, 2; Central_nervous_system, 3; Cervix, 4; Endometrium, 5; Haematopoietic_and_lymphoid_tissue, 6; Kidney, 7; Large_intestine, 8; Liver, 9; Lung, 10; NS, 11; Ovary, 12; Pancreas, 13; Prostate, 14; Skin, 15; Stomach, 16; Thyroid, 17; Urinary_tract) |
| Top |
|
 |
| Top |
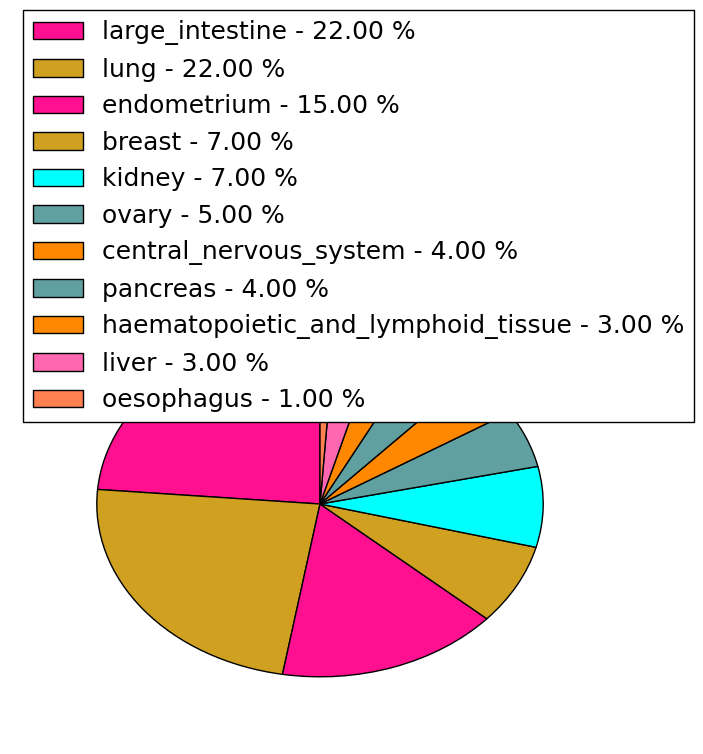
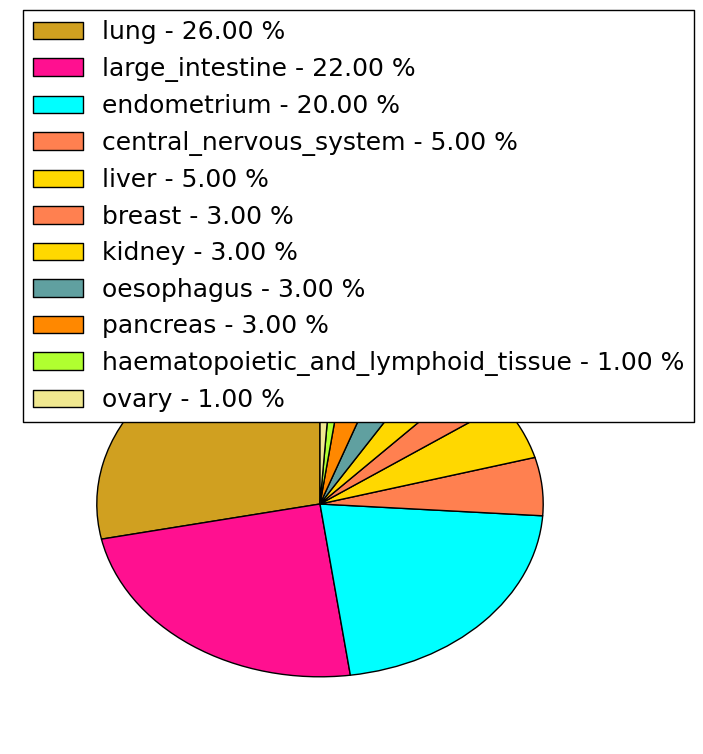
| Stat. for Non-Synonymous SNVs (# total SNVs=166) | (# total SNVs=53) |
 |  |
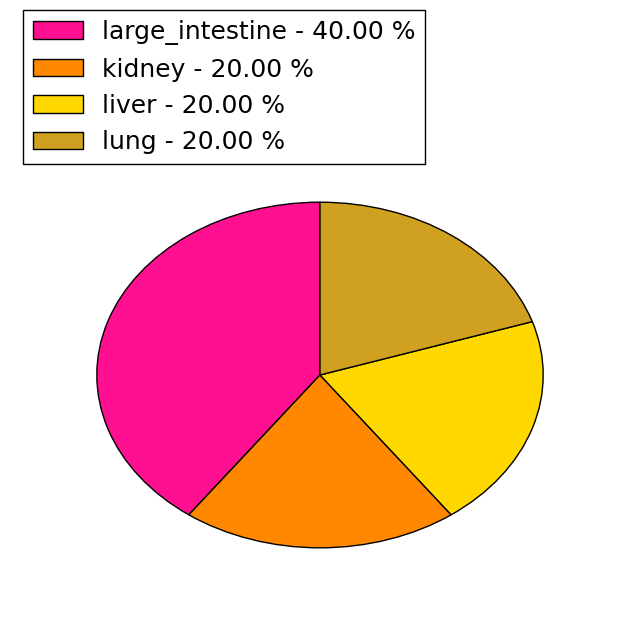
(# total SNVs=5) | (# total SNVs=1) |
 |  |
| Top |
| * When you move the cursor on each content, you can see more deailed mutation information on the Tooltip. Those are primary_site,primary_histology,mutation(aa),pubmedID. |
| GRCh37 position | Mutation(aa) | Unique sampleID count |
| chr2:27460721-27460721 | p.R1567W | 4 |
| chr2:27445851-27445851 | p.C252F | 3 |
| chr2:27456204-27456204 | p.E1006* | 3 |
| chr2:27465263-27465263 | p.R2064C | 3 |
| chr2:27465748-27465748 | p.F2129F | 3 |
| chr2:27449415-27449415 | p.A685V | 2 |
| chr2:27463975-27463975 | p.P1896P | 2 |
| chr2:27462316-27462316 | p.E1791K | 2 |
| chr2:27445421-27445421 | p.R177L | 2 |
| chr2:27447254-27447254 | p.P384S | 2 |
| Top |
|
 |
| Point Mutation/ Tissue ID | 1 | 2 | 3 | 4 | 5 | 6 | 7 | 8 | 9 | 10 | 11 | 12 | 13 | 14 | 15 | 16 | 17 | 18 | 19 | 20 |
| # sample | 6 | 9 | 2 | 26 | 5 | 4 | 4 | 2 | 1 | 21 | 15 | 7 | 1 | 22 | 20 | 22 | ||||
| # mutation | 7 | 9 | 2 | 26 | 5 | 4 | 4 | 2 | 1 | 26 | 14 | 7 | 1 | 28 | 21 | 33 | ||||
| nonsynonymous SNV | 6 | 8 | 2 | 16 | 3 | 2 | 3 | 2 | 19 | 12 | 6 | 1 | 13 | 14 | 22 | |||||
| synonymous SNV | 1 | 1 | 10 | 2 | 2 | 1 | 1 | 7 | 2 | 1 | 15 | 7 | 11 |
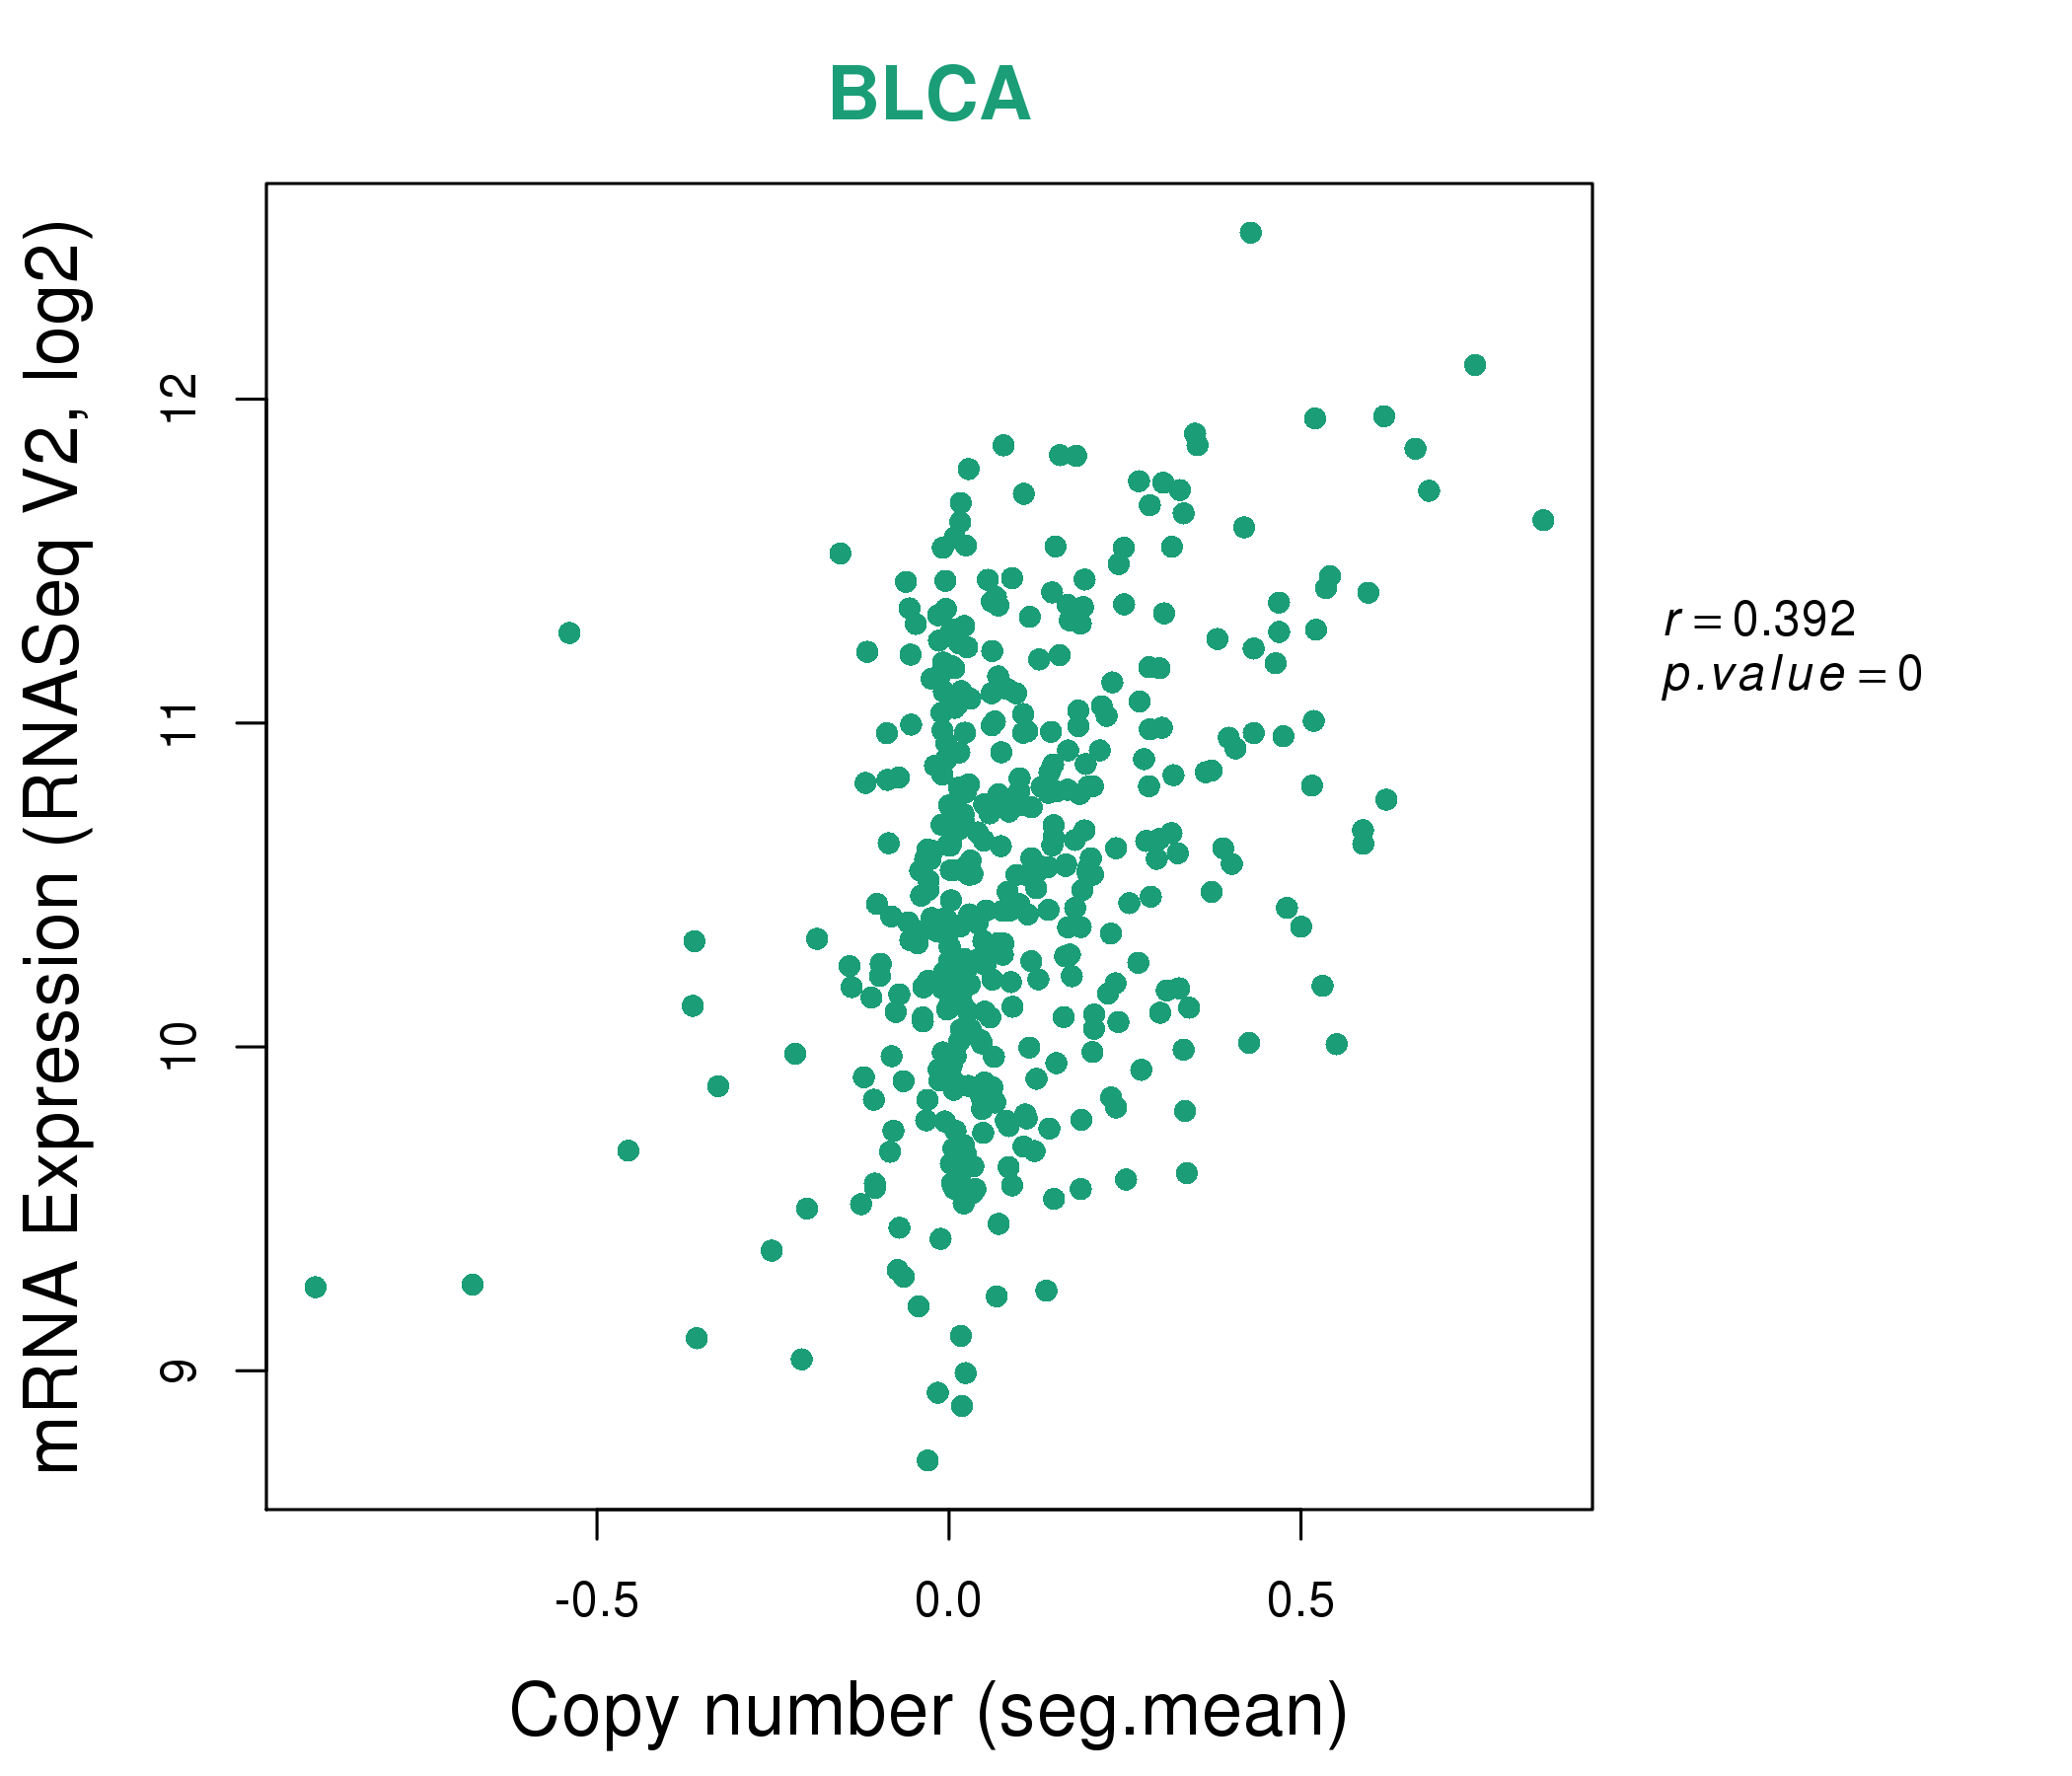
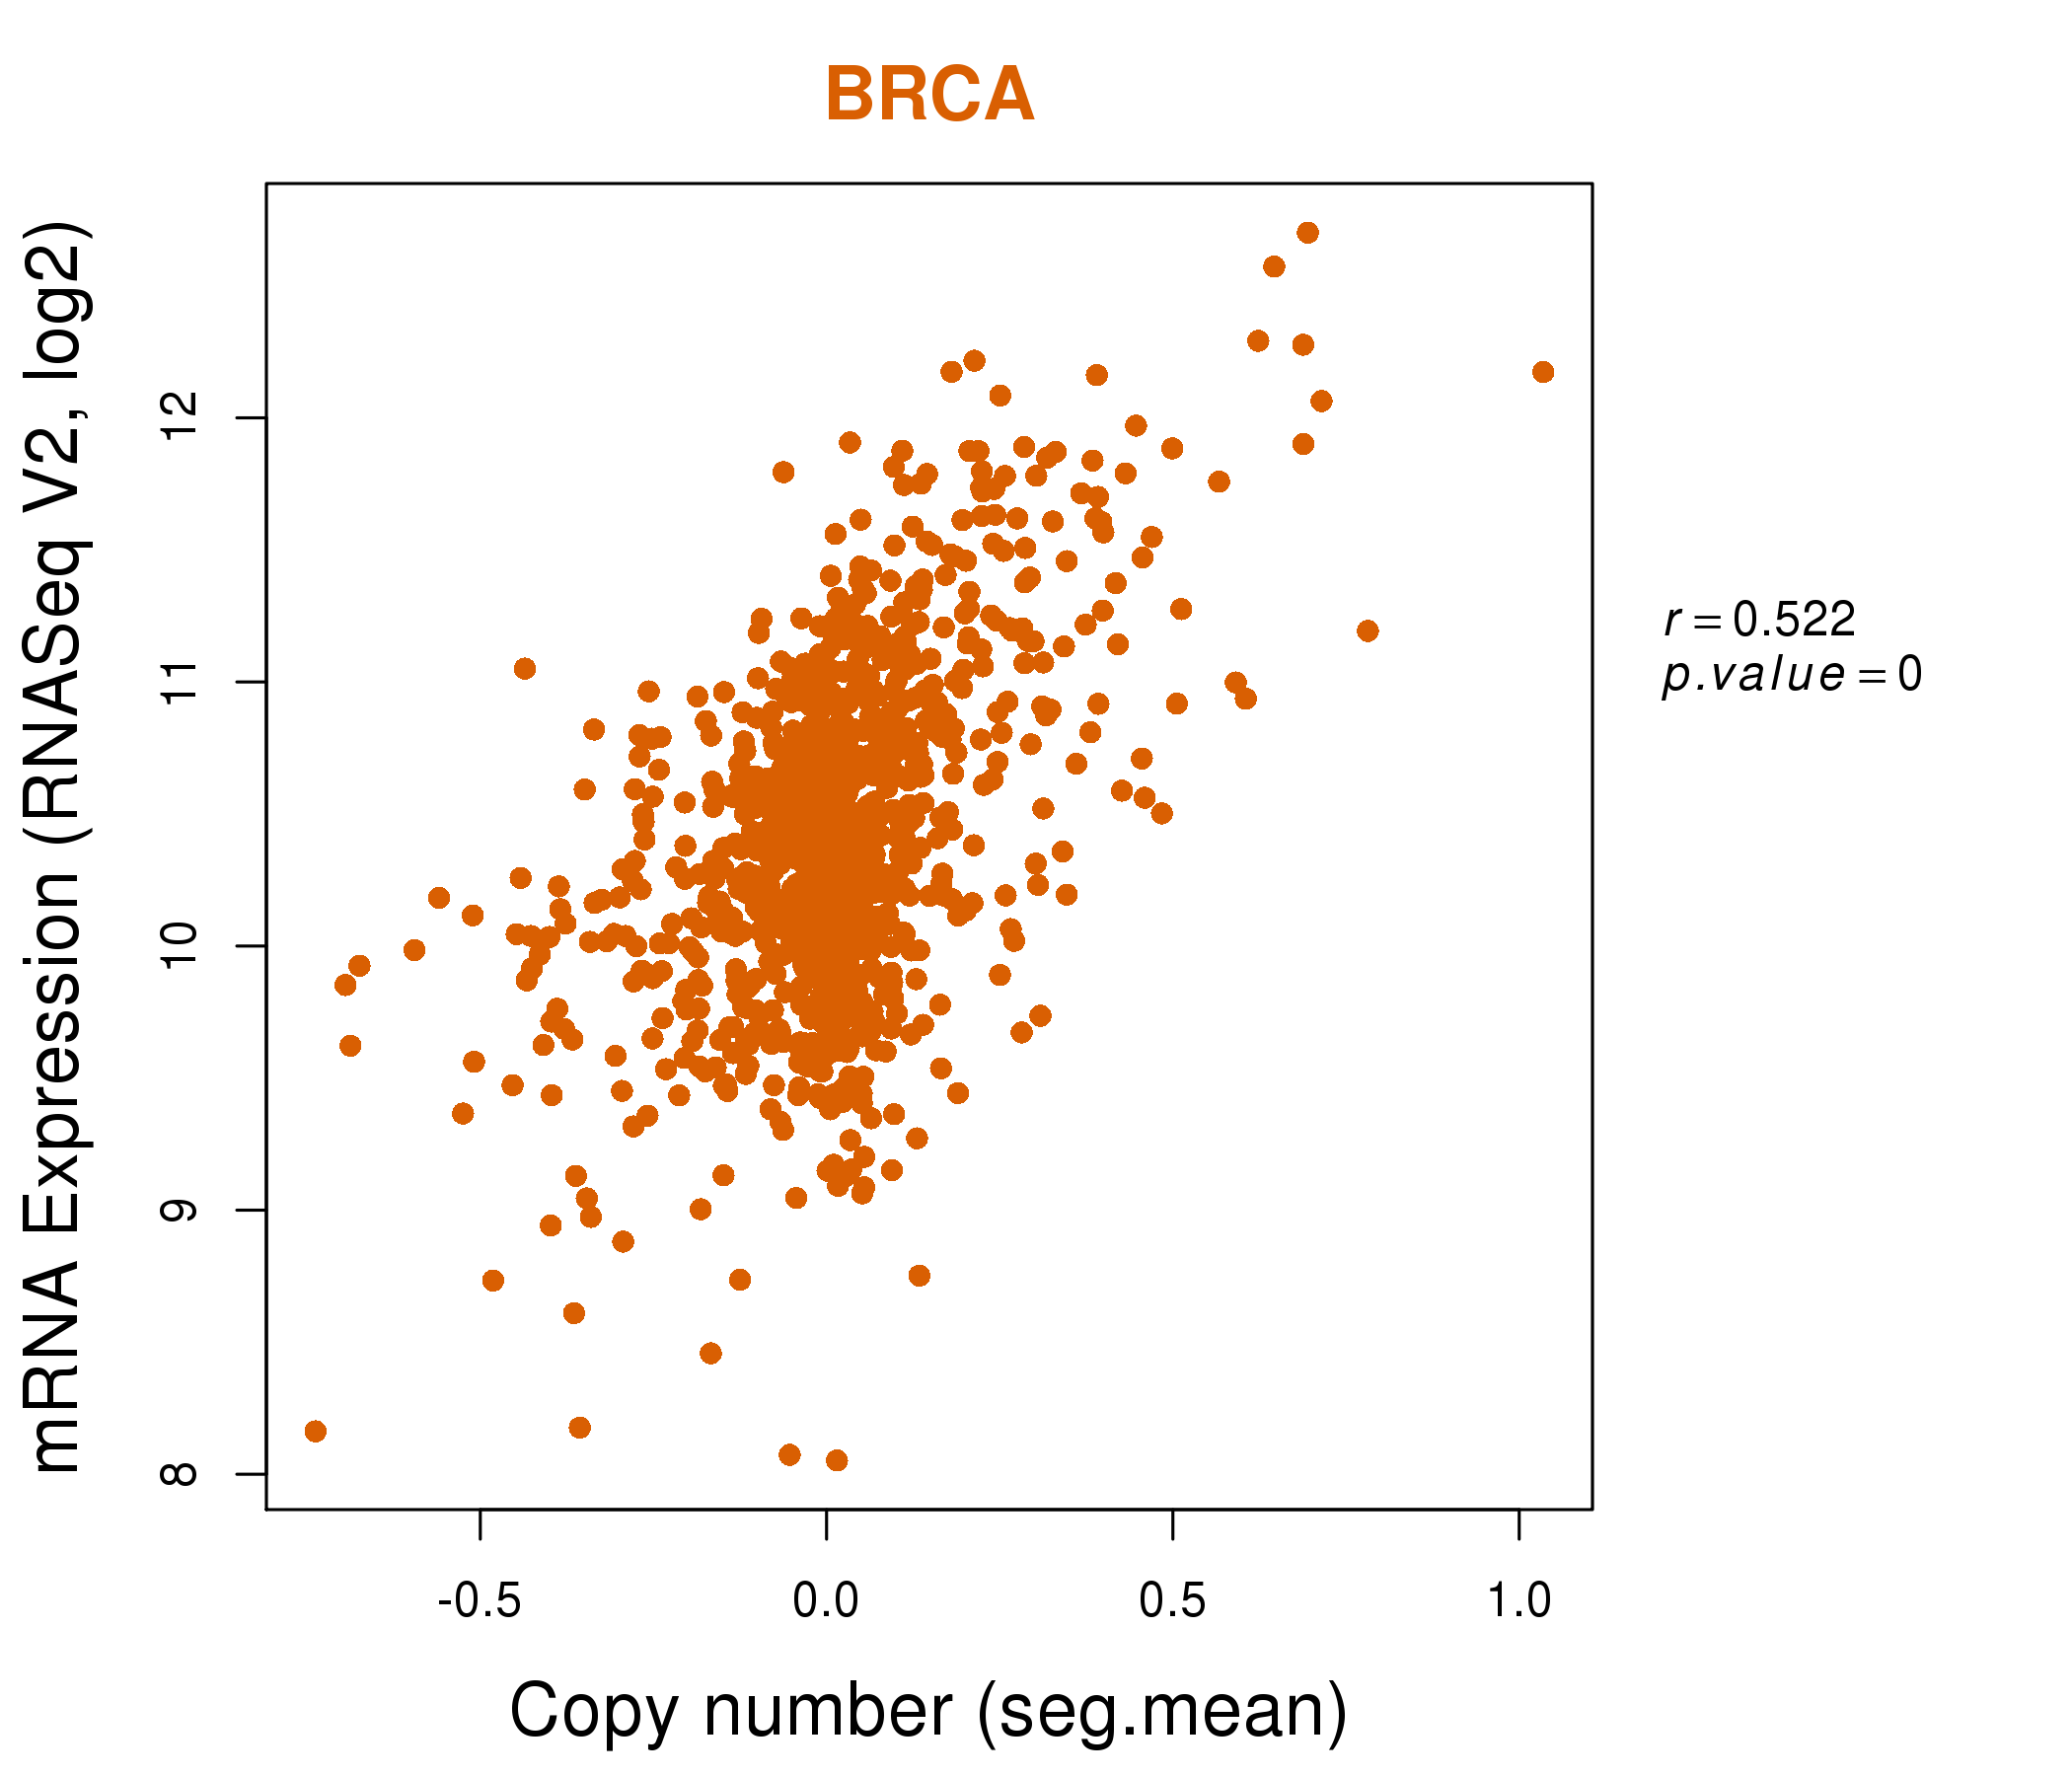
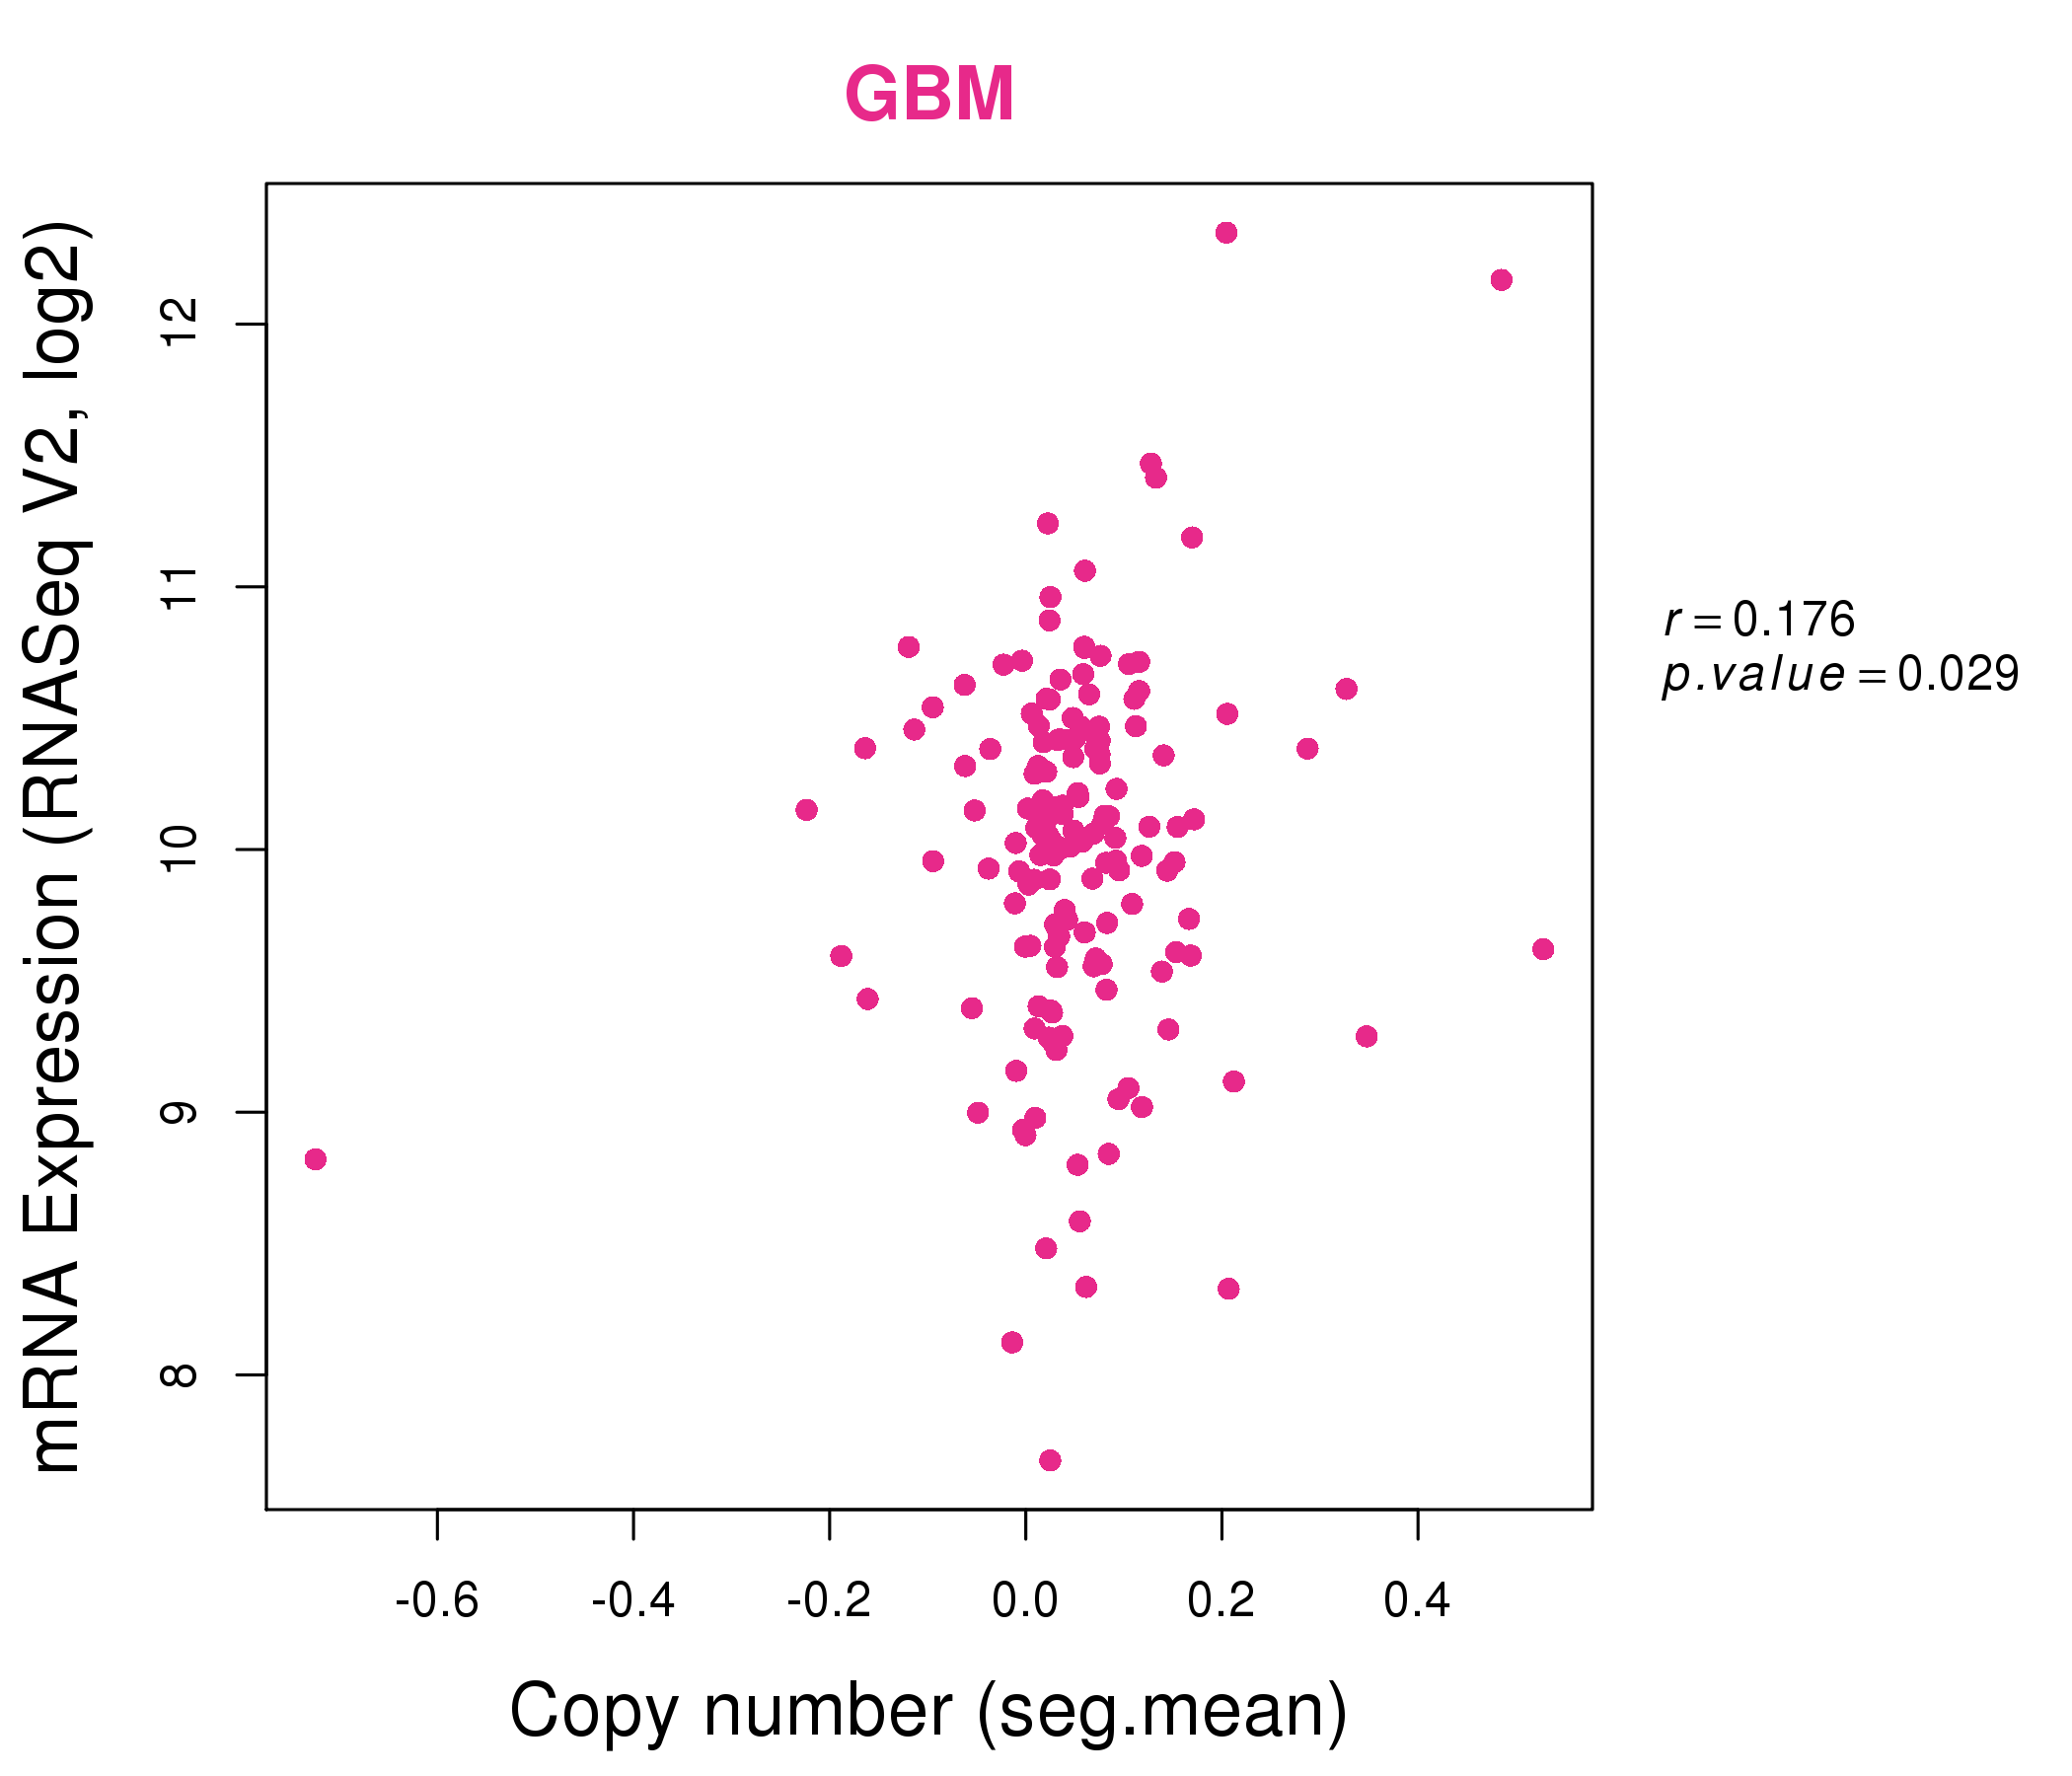
| cf) Tissue ID; Tissue type (1; BLCA[Bladder Urothelial Carcinoma], 2; BRCA[Breast invasive carcinoma], 3; CESC[Cervical squamous cell carcinoma and endocervical adenocarcinoma], 4; COAD[Colon adenocarcinoma], 5; GBM[Glioblastoma multiforme], 6; Glioma Low Grade, 7; HNSC[Head and Neck squamous cell carcinoma], 8; KICH[Kidney Chromophobe], 9; KIRC[Kidney renal clear cell carcinoma], 10; KIRP[Kidney renal papillary cell carcinoma], 11; LAML[Acute Myeloid Leukemia], 12; LUAD[Lung adenocarcinoma], 13; LUSC[Lung squamous cell carcinoma], 14; OV[Ovarian serous cystadenocarcinoma ], 15; PAAD[Pancreatic adenocarcinoma], 16; PRAD[Prostate adenocarcinoma], 17; SKCM[Skin Cutaneous Melanoma], 18:STAD[Stomach adenocarcinoma], 19:THCA[Thyroid carcinoma], 20:UCEC[Uterine Corpus Endometrial Carcinoma]) |
| Top |
| * We represented just top 10 SNVs. When you move the cursor on each content, you can see more deailed mutation information on the Tooltip. Those are primary_site, primary_histology, mutation(aa), pubmedID. |
| Genomic Position | Mutation(aa) | Unique sampleID count |
| chr2:27460681 | p.A1553A | 3 |
| chr2:27446828 | p.F2118F | 2 |
| chr2:27456970 | p.F2129F | 2 |
| chr2:27457482 | p.T1239A | 2 |
| chr2:27448706 | p.E347K | 2 |
| chr2:27465619 | p.G492W | 2 |
| chr2:27465748 | p.L938F | 2 |
| chr2:27447254 | p.A1165V | 2 |
| chr2:27447965 | p.R2064C | 2 |
| chr2:27465263 | p.P384S | 2 |
| * Copy number data were extracted from TCGA using R package TCGA-Assembler. The URLs of all public data files on TCGA DCC data server were gathered on Jan-05-2015. Function ProcessCNAData in TCGA-Assembler package was used to obtain gene-level copy number value which is calculated as the average copy number of the genomic region of a gene. |
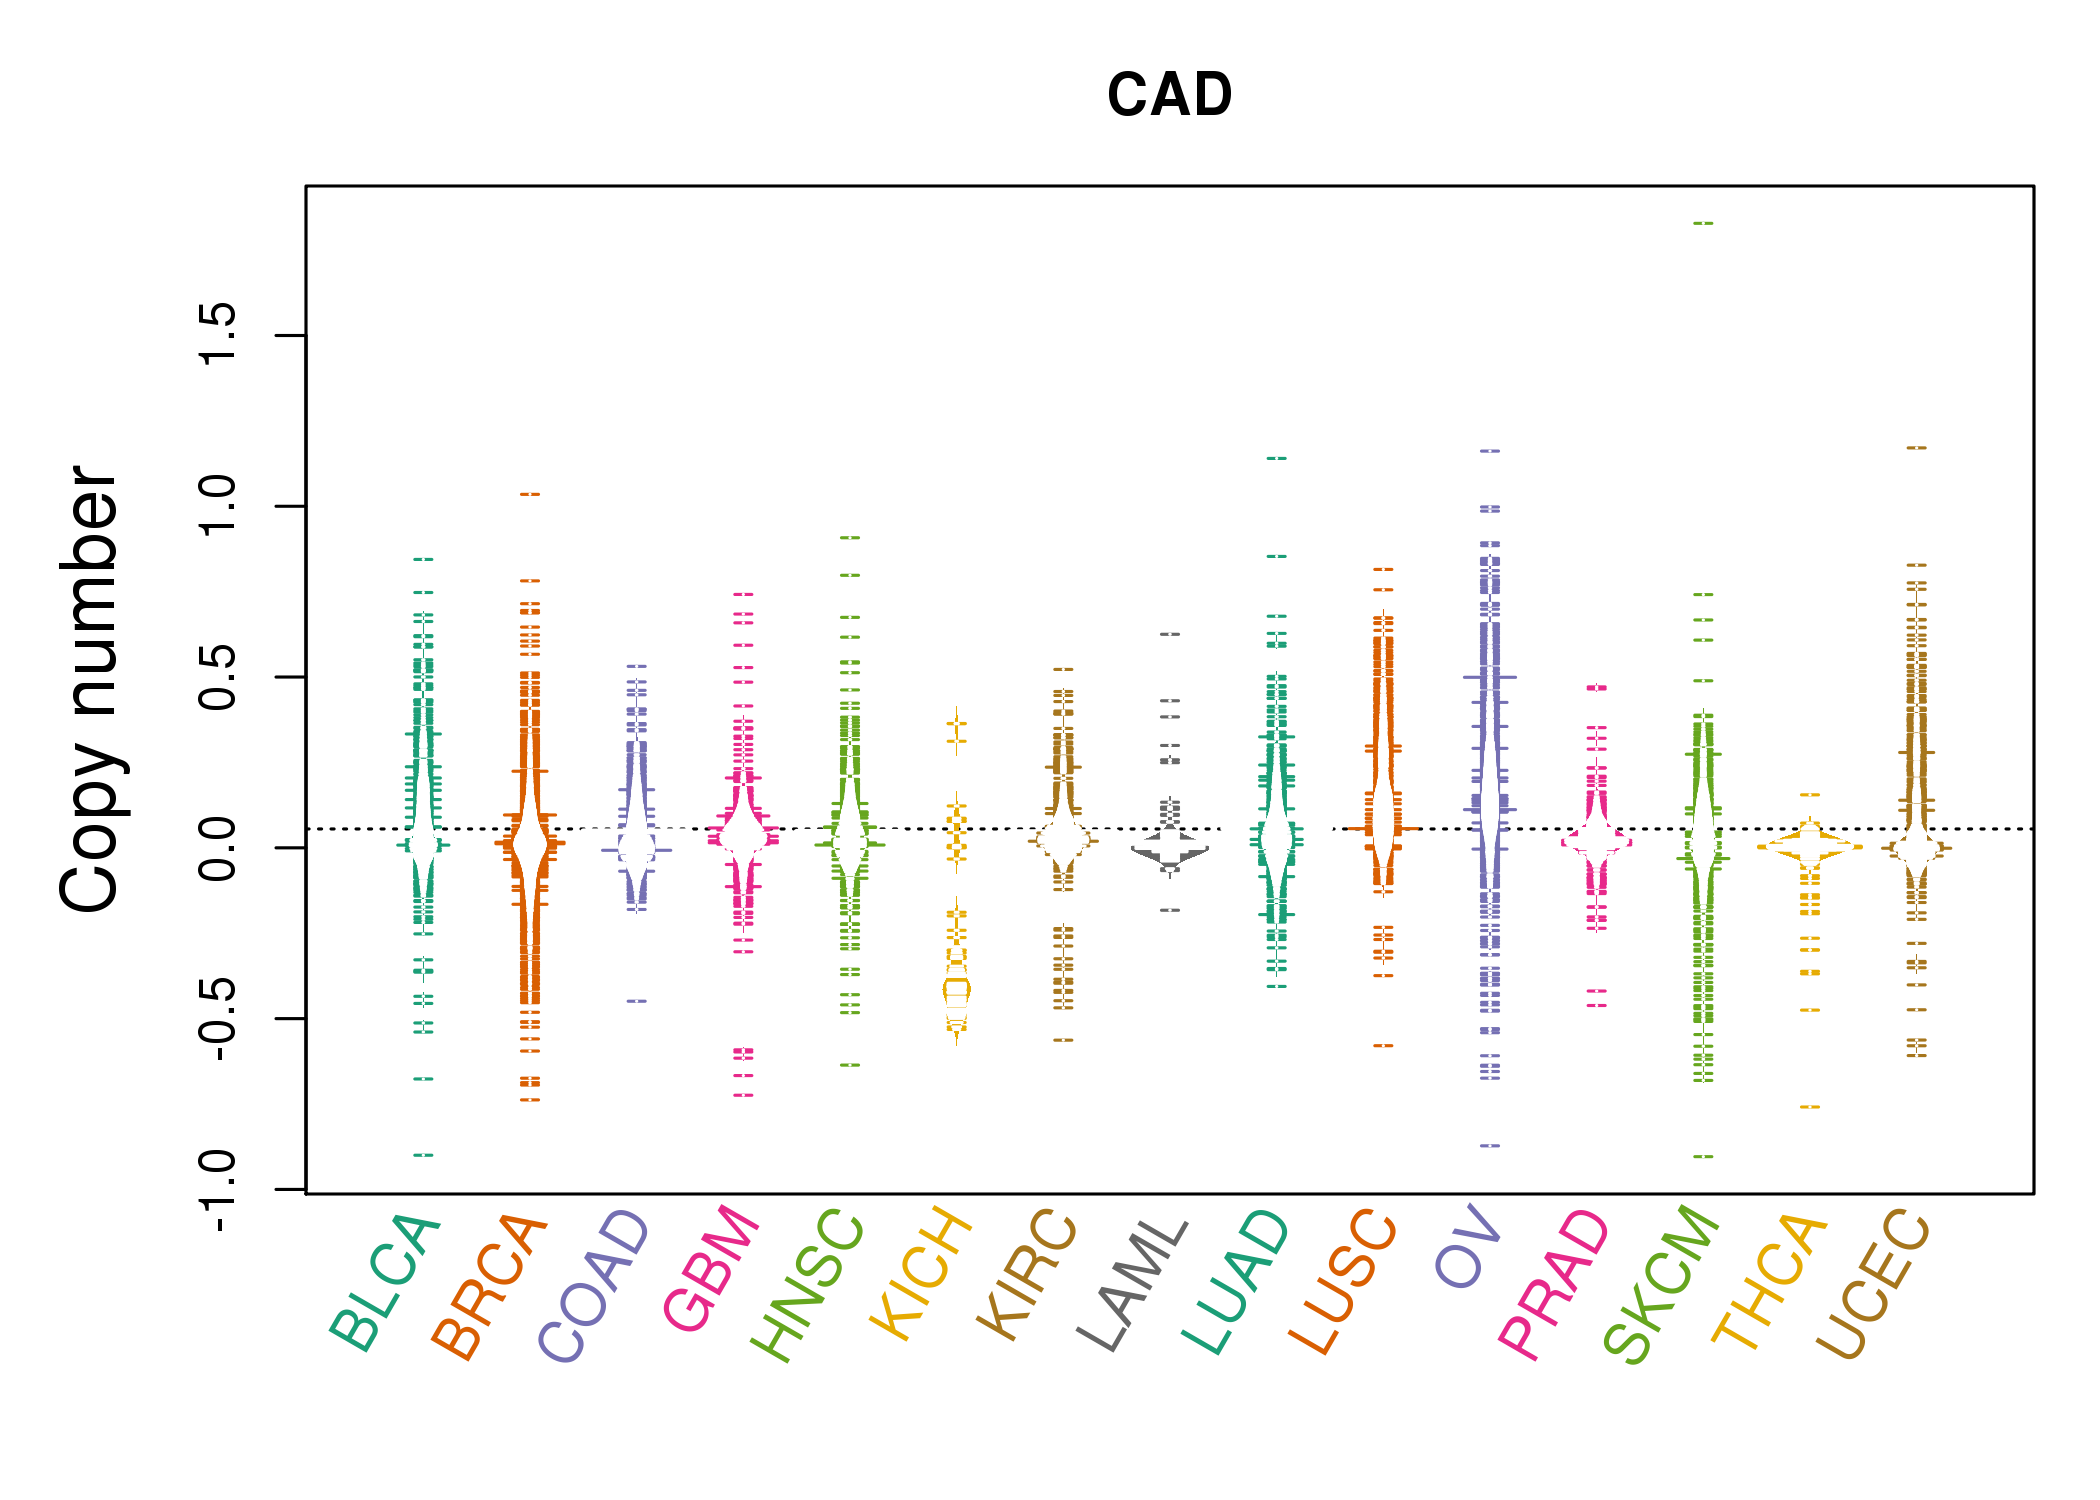 |
| cf) Tissue ID[Tissue type]: BLCA[Bladder Urothelial Carcinoma], BRCA[Breast invasive carcinoma], CESC[Cervical squamous cell carcinoma and endocervical adenocarcinoma], COAD[Colon adenocarcinoma], GBM[Glioblastoma multiforme], Glioma Low Grade, HNSC[Head and Neck squamous cell carcinoma], KICH[Kidney Chromophobe], KIRC[Kidney renal clear cell carcinoma], KIRP[Kidney renal papillary cell carcinoma], LAML[Acute Myeloid Leukemia], LUAD[Lung adenocarcinoma], LUSC[Lung squamous cell carcinoma], OV[Ovarian serous cystadenocarcinoma ], PAAD[Pancreatic adenocarcinoma], PRAD[Prostate adenocarcinoma], SKCM[Skin Cutaneous Melanoma], STAD[Stomach adenocarcinoma], THCA[Thyroid carcinoma], UCEC[Uterine Corpus Endometrial Carcinoma] |
| Top |
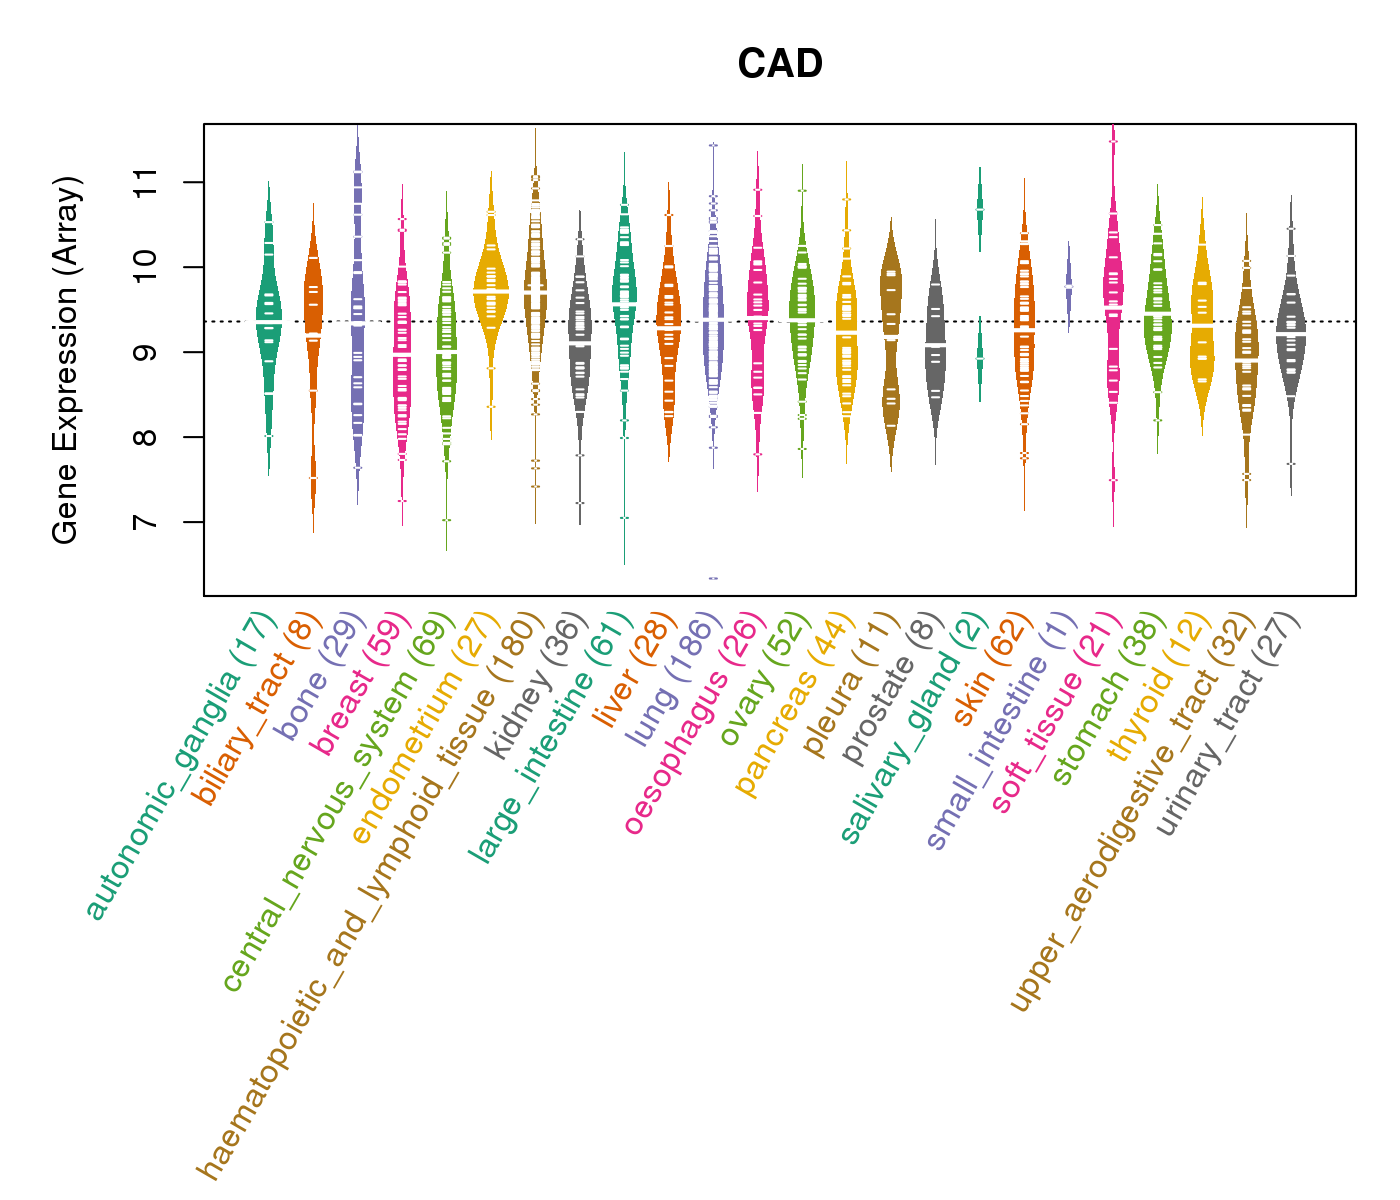
| Gene Expression for CAD |
| * CCLE gene expression data were extracted from CCLE_Expression_Entrez_2012-10-18.res: Gene-centric RMA-normalized mRNA expression data. |
 |
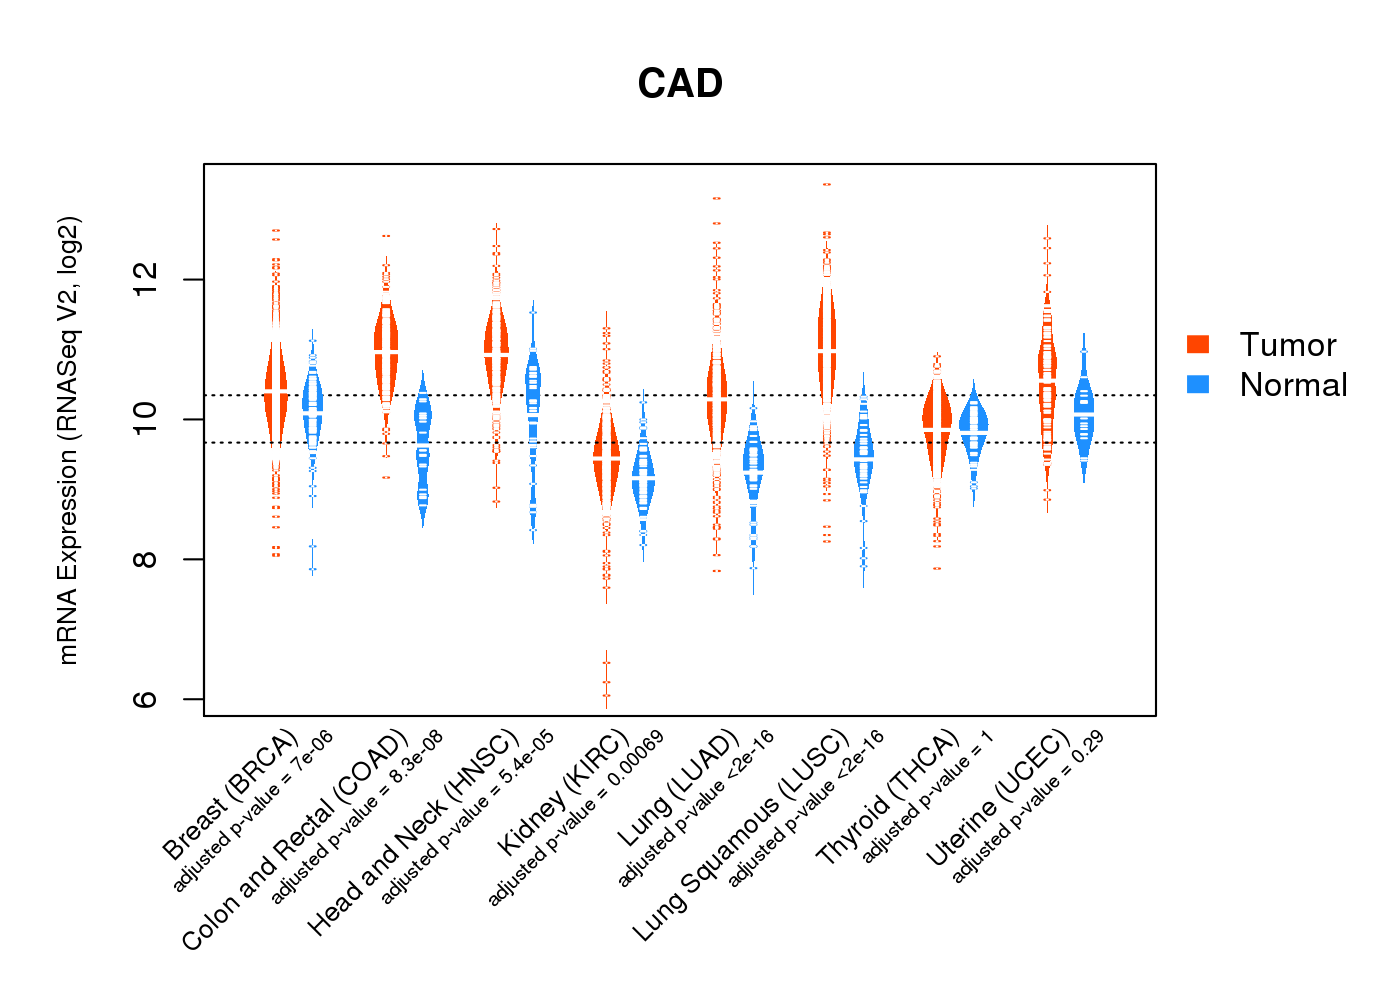
| * Normalized gene expression data of RNASeqV2 was extracted from TCGA using R package TCGA-Assembler. The URLs of all public data files on TCGA DCC data server were gathered at Jan-05-2015. Only eight cancer types have enough normal control samples for differential expression analysis. (t test, adjusted p<0.05 (using Benjamini-Hochberg FDR)) |
 |
| Top |
| * This plots show the correlation between CNV and gene expression. |
: Open all plots for all cancer types
 |
|
 |
|
| Top |
| Gene-Gene Network Information |
| * Co-Expression network figures were drawn using R package igraph. Only the top 20 genes with the highest correlations were shown. Red circle: input gene, orange circle: cell metabolism gene, sky circle: other gene |
: Open all plots for all cancer types
 |
| ||||
| AGBL5,CAD,CENPA,CENPO,GART,GPN1,GTF3C2, ILF3,INCENP,MPP6,MSH2,MSH6,ORC1,PLK1, POLR1A,RNASEH1,RRP1B,SKP2,UBXN2A,WDR43,YEATS2 | PRRC2A,CABIN1,CAD,CD3EAP,DNMT1,ICOSLG,ILF3, KDM5C,MYBBP1A,NAT10,NCAPD2,PDCD11,PFAS,PLXNB2, PTK7,RAI1,RCC2,TCF3,ZBTB12,ZNF512B,ZNF74 | ||||
 |
| ||||
| ANAPC1,PRRC2A,CAD,DHX57,GTF3C2,ILF3,ING5, KIAA1958,MDN1,NCL,PDCD11,POLR1A,POLR1B,RIF1, SMPD4,SNRNP200,TGFBRAP1,TTLL4,WDR33,XPO5,ZNF142 | PRRC2A,BMS1,C2CD3,CAD,CKAP5,GCN1L1,ILF3, LARP1,MDC1,MYBBP1A,NUP188,PDCD11,PFAS,POLR1A, PRKDC,RBM19,RPAP1,TCHP,URB1,XPO5,ZC3H18 |

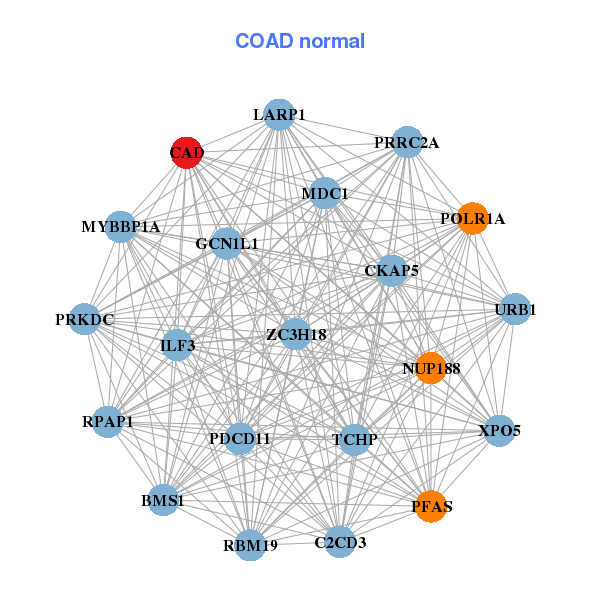
| * Co-Expression network figures were drawn using R package igraph. Only the top 20 genes with the highest correlations were shown. Red circle: input gene, orange circle: cell metabolism gene, sky circle: other gene |
: Open all plots for all cancer types
| Top |
: Open all interacting genes' information including KEGG pathway for all interacting genes from DAVID
| Top |
| Pharmacological Information for CAD |
| DB Category | DB Name | DB's ID and Url link |
| Chemistry | BindingDB | P27708; -. |
| Chemistry | ChEMBL | CHEMBL3093; -. |
| Organism-specific databases | PharmGKB | PA26023; -. |
| Organism-specific databases | CTD | 790; -. |
| * Gene Centered Interaction Network. |
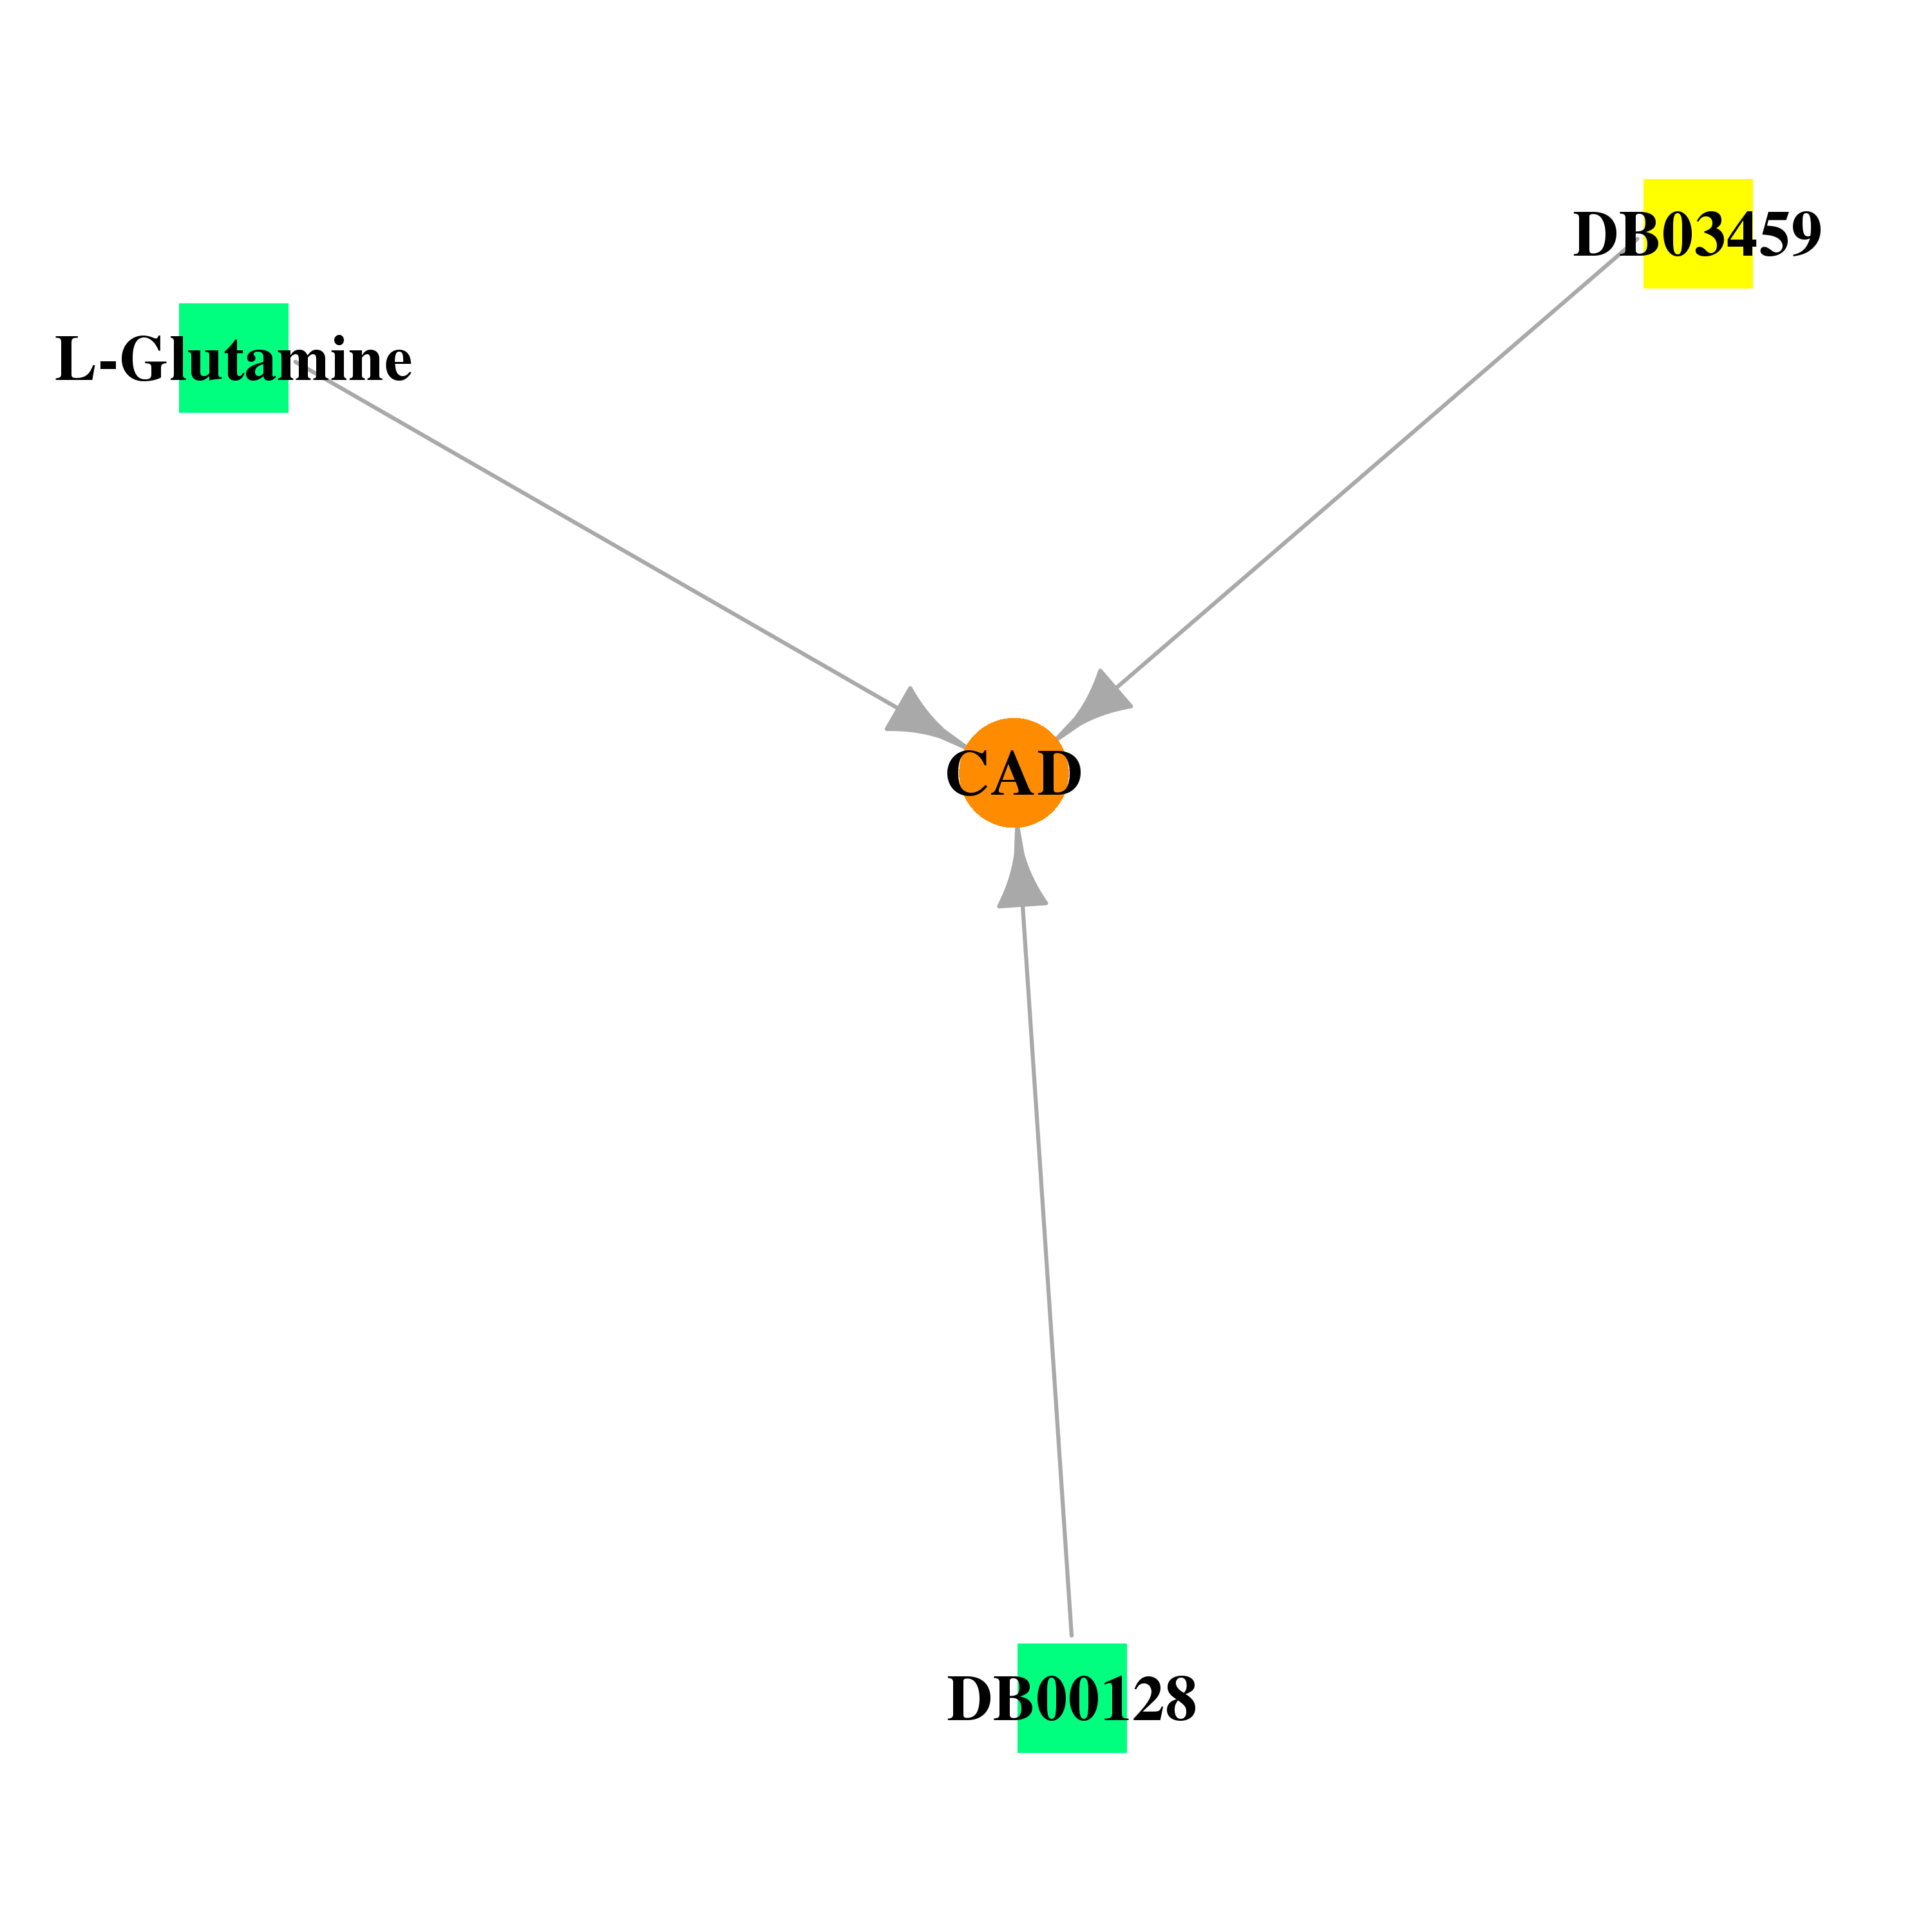 |
| * Drug Centered Interaction Network. |
| DrugBank ID | Target Name | Drug Groups | Generic Name | Drug Centered Network | Drug Structure |
| DB00128 | carbamoyl-phosphate synthetase 2, aspartate transcarbamylase, and dihydroorotase | approved; nutraceutical | L-Aspartic Acid | 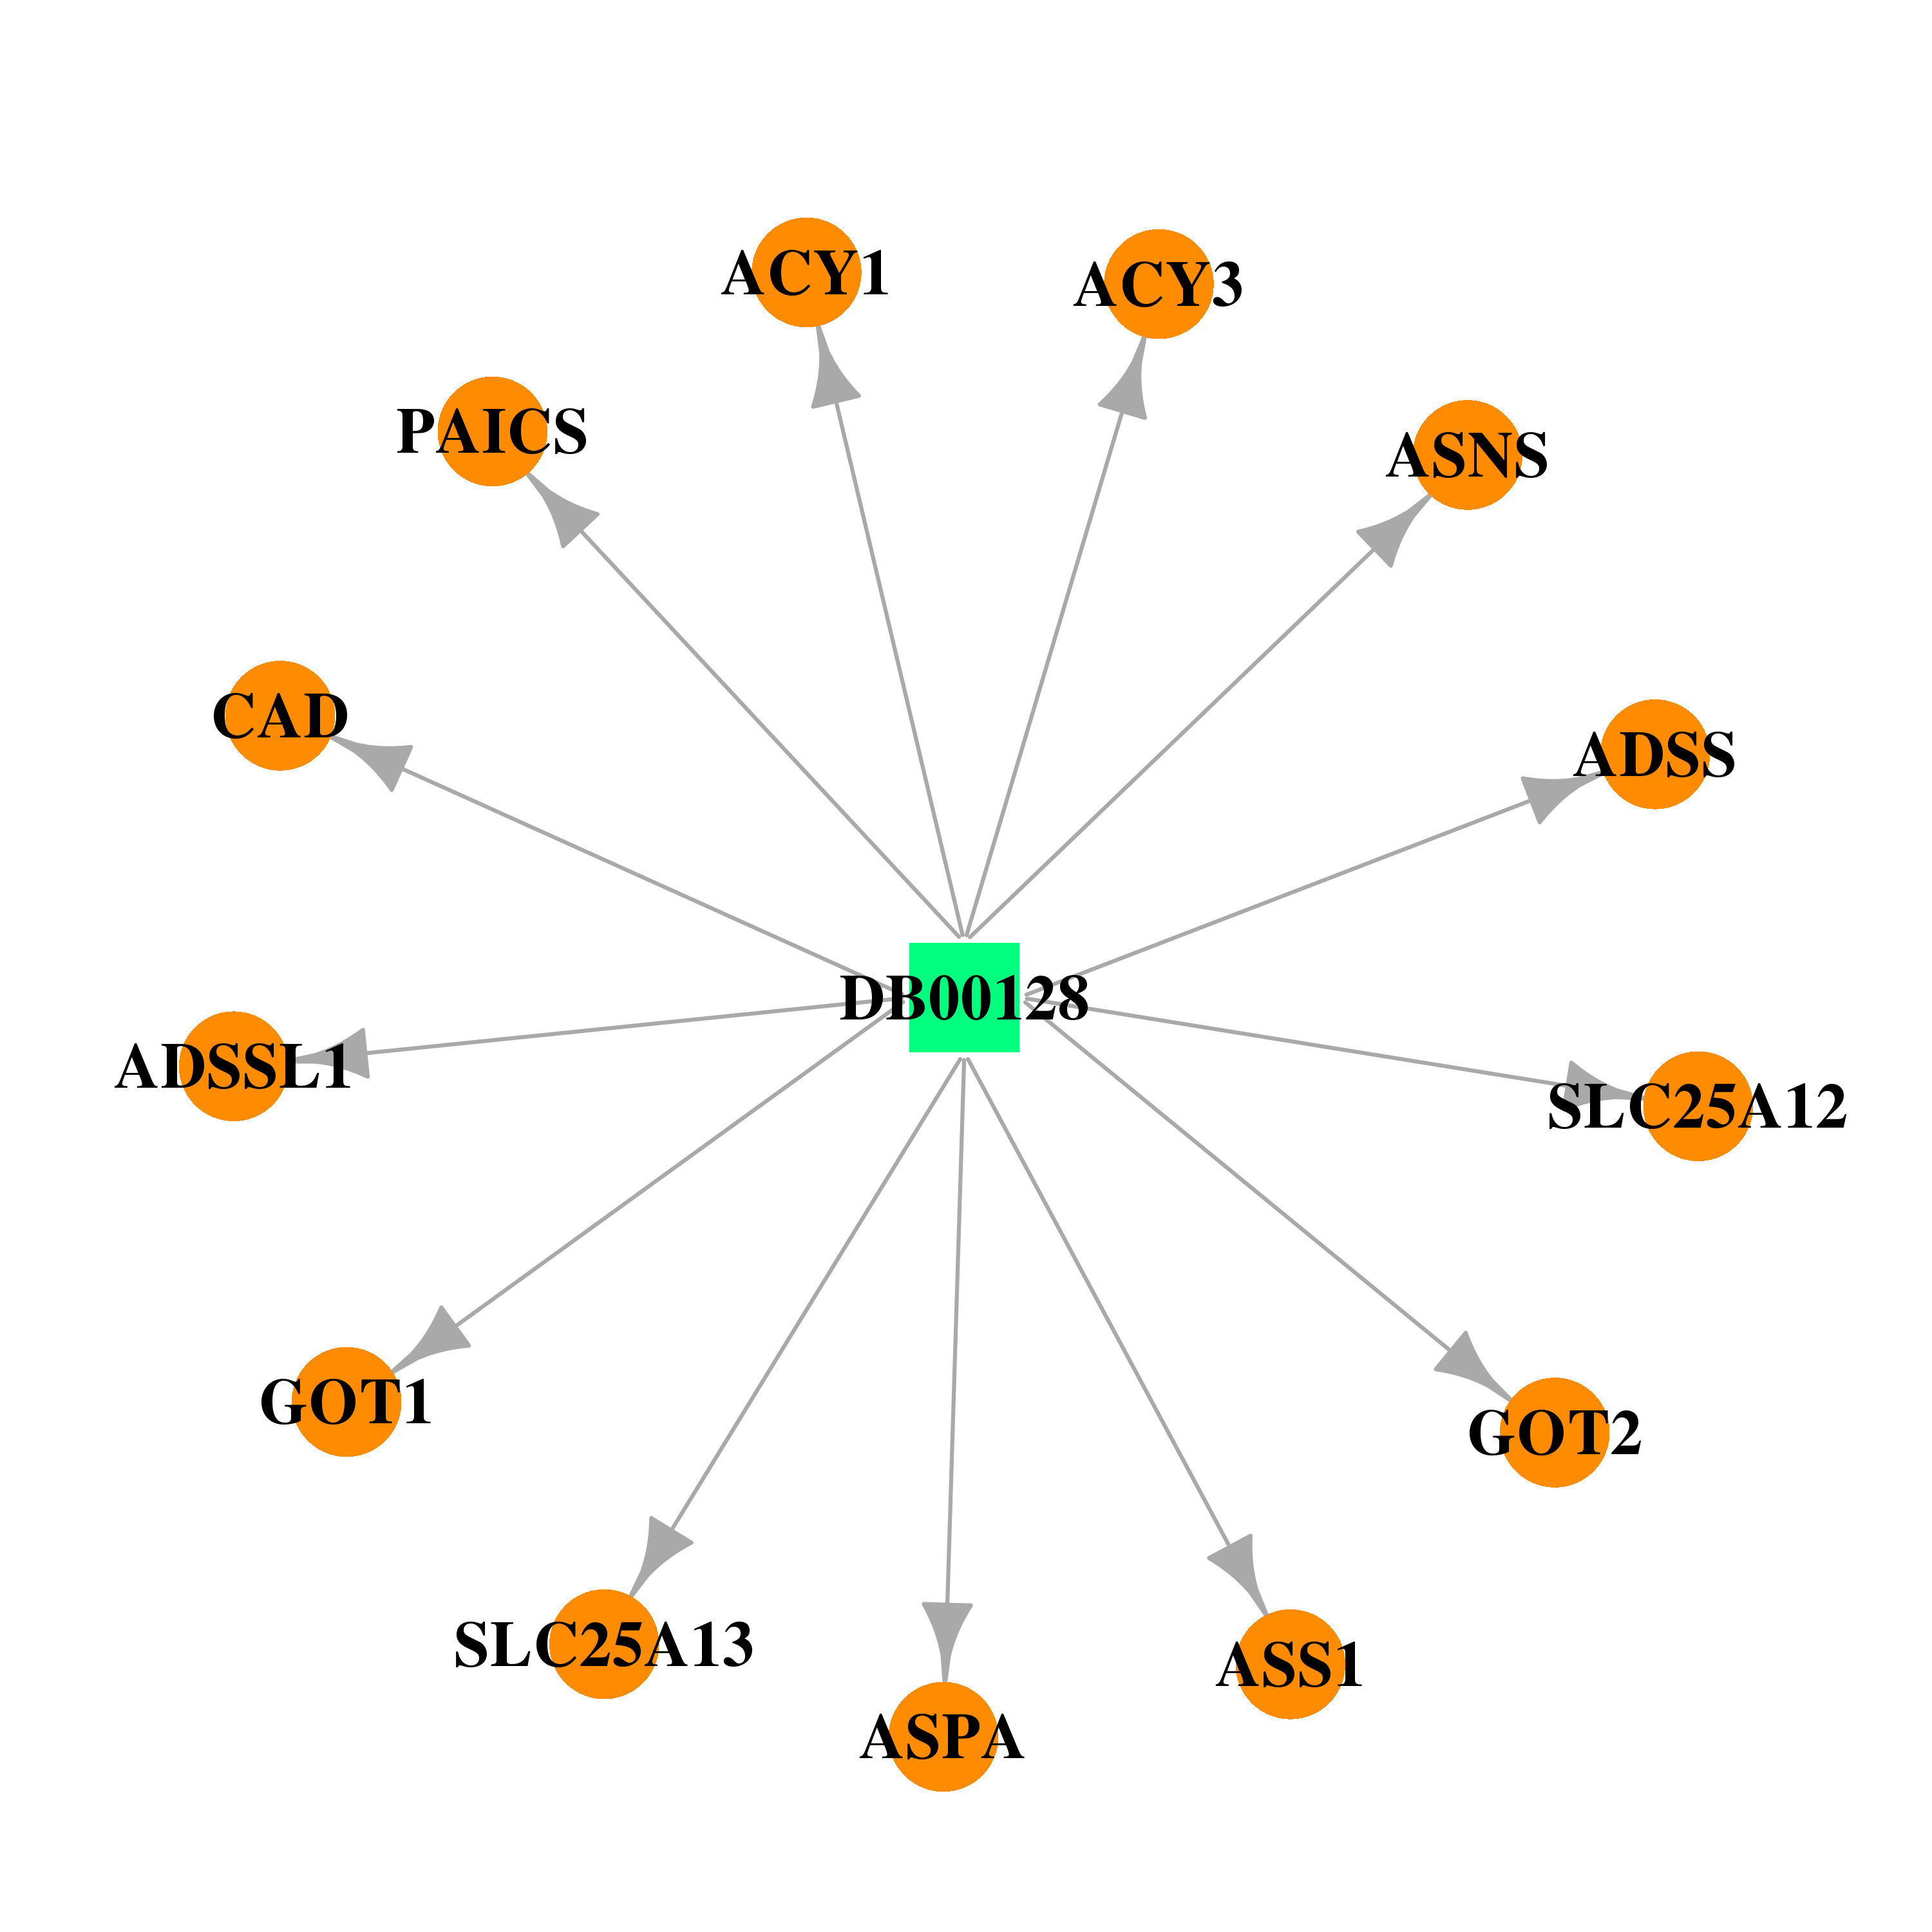 | 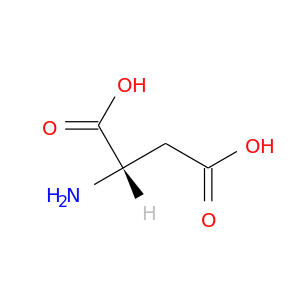 |
| DB03459 | carbamoyl-phosphate synthetase 2, aspartate transcarbamylase, and dihydroorotase | experimental | N-(Phosphonacetyl)-L-Aspartic Acid |  | 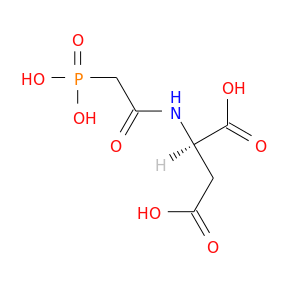 |
| DB00130 | carbamoyl-phosphate synthetase 2, aspartate transcarbamylase, and dihydroorotase | approved; nutraceutical; investigational | L-Glutamine |  |  |
| Top |
| Cross referenced IDs for CAD |
| * We obtained these cross-references from Uniprot database. It covers 150 different DBs, 18 categories. http://www.uniprot.org/help/cross_references_section |
: Open all cross reference information
|
Copyright © 2016-Present - The Univsersity of Texas Health Science Center at Houston @ |