|
||||||||||||||||||||
| |
| Phenotypic Information (metabolism pathway, cancer, disease, phenome) |
| |
| |
| Gene-Gene Network Information: Co-Expression Network, Interacting Genes & KEGG |
| |
|


| Gene Summary for ALDH5A1 |
| Basic gene info. | Gene symbol | ALDH5A1 |
| Gene name | aldehyde dehydrogenase 5 family, member A1 | |
| Synonyms | SSADH|SSDH | |
| Cytomap | UCSC genome browser: 6p22 | |
| Genomic location | chr6 :24495196-24537435 | |
| Type of gene | protein-coding | |
| RefGenes | NM_001080.3, NM_170740.1, | |
| Ensembl id | ENSG00000112294 | |
| Description | NAD(+)-dependent succinic semialdehyde dehydrogenasealdehyde dehydrogenase 5 family member A1mitochondrial succinate semialdehyde dehydrogenasesuccinate-semialdehyde dehydrogenase, mitochondrial | |
| Modification date | 20141219 | |
| dbXrefs | MIM : 610045 | |
| HGNC : HGNC | ||
| Ensembl : ENSG00000112294 | ||
| HPRD : 08361 | ||
| Vega : OTTHUMG00000014356 | ||
| Protein | UniProt: go to UniProt's Cross Reference DB Table | |
| Expression | CleanEX: HS_ALDH5A1 | |
| BioGPS: 7915 | ||
| Gene Expression Atlas: ENSG00000112294 | ||
| The Human Protein Atlas: ENSG00000112294 | ||
| Pathway | NCI Pathway Interaction Database: ALDH5A1 | |
| KEGG: ALDH5A1 | ||
| REACTOME: ALDH5A1 | ||
| ConsensusPathDB | ||
| Pathway Commons: ALDH5A1 | ||
| Metabolism | MetaCyc: ALDH5A1 | |
| HUMANCyc: ALDH5A1 | ||
| Regulation | Ensembl's Regulation: ENSG00000112294 | |
| miRBase: chr6 :24,495,196-24,537,435 | ||
| TargetScan: NM_001080 | ||
| cisRED: ENSG00000112294 | ||
| Context | iHOP: ALDH5A1 | |
| cancer metabolism search in PubMed: ALDH5A1 | ||
| UCL Cancer Institute: ALDH5A1 | ||
| Assigned class in ccmGDB | C | |
| Top |
| Phenotypic Information for ALDH5A1(metabolism pathway, cancer, disease, phenome) |
| Cancer | CGAP: ALDH5A1 |
| Familial Cancer Database: ALDH5A1 | |
| * This gene is included in those cancer gene databases. |
|
|
|
|
|
| . | ||||||||||||||
Oncogene 1 | Significant driver gene in | |||||||||||||||||||
| cf) number; DB name 1 Oncogene; http://nar.oxfordjournals.org/content/35/suppl_1/D721.long, 2 Tumor Suppressor gene; https://bioinfo.uth.edu/TSGene/, 3 Cancer Gene Census; http://www.nature.com/nrc/journal/v4/n3/abs/nrc1299.html, 4 CancerGenes; http://nar.oxfordjournals.org/content/35/suppl_1/D721.long, 5 Network of Cancer Gene; http://ncg.kcl.ac.uk/index.php, 1Therapeutic Vulnerabilities in Cancer; http://cbio.mskcc.org/cancergenomics/statius/ |
| KEGG_ALANINE_ASPARTATE_AND_GLUTAMATE_METABOLISM KEGG_BUTANOATE_METABOLISM | |
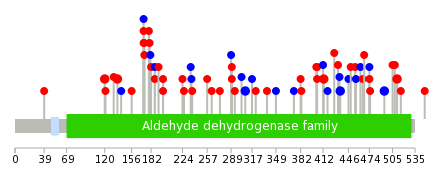
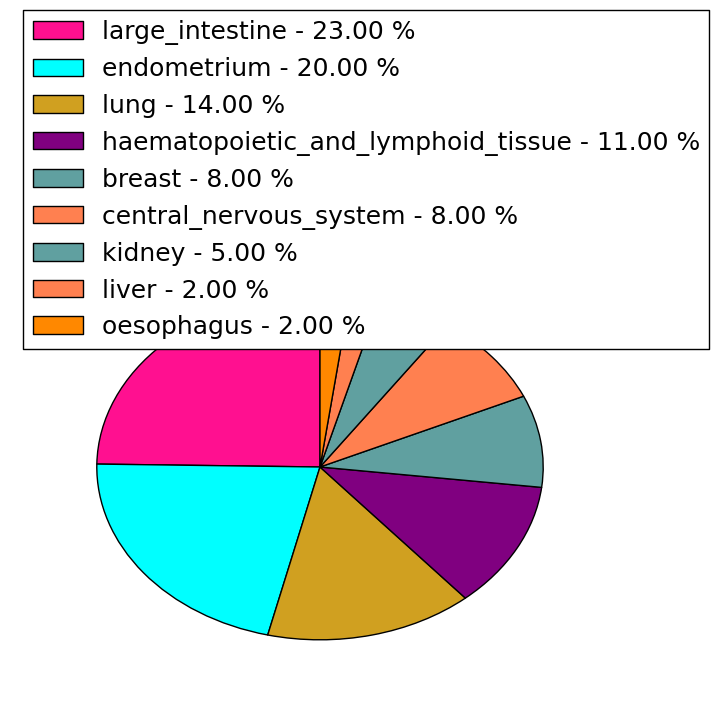
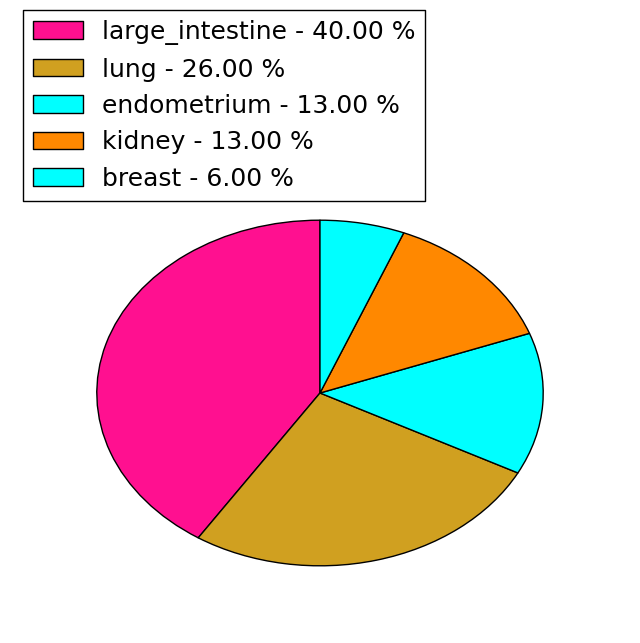
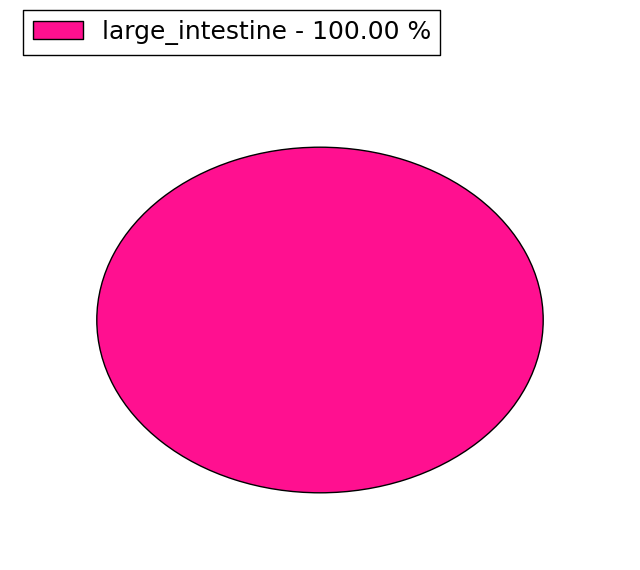
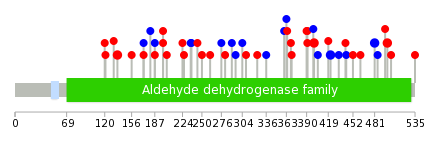
| Mutations for ALDH5A1 |
| * Under tables are showing count per each tissue to give us broad intuition about tissue specific mutation patterns.You can go to the detailed page for each mutation database's web site. |
| There's no structural variation information in COSMIC data for this gene. |
| * From mRNA Sanger sequences, Chitars2.0 arranged chimeric transcripts. This table shows ALDH5A1 related fusion information. |
| ID | Head Gene | Tail Gene | Accession | Gene_a | qStart_a | qEnd_a | Chromosome_a | tStart_a | tEnd_a | Gene_a | qStart_a | qEnd_a | Chromosome_a | tStart_a | tEnd_a |
| Top |
| There's no copy number variation information in COSMIC data for this gene. |
| Top |
|
 |
| Top |
| Stat. for Non-Synonymous SNVs (# total SNVs=34) | (# total SNVs=15) |
 |  |
(# total SNVs=1) | (# total SNVs=0) |
 |
| Top |
| * When you move the cursor on each content, you can see more deailed mutation information on the Tooltip. Those are primary_site,primary_histology,mutation(aa),pubmedID. |
| GRCh37 position | Mutation(aa) | Unique sampleID count |
| chr6:24520643-24520643 | p.H308H | 2 |
| chr6:24533825-24533825 | p.S511F | 2 |
| chr6:24502805-24502805 | p.D137Y | 2 |
| chr6:24528249-24528249 | p.V413I | 2 |
| chr6:24503518-24503518 | p.E156K | 2 |
| chr6:24503644-24503644 | p.A198P | 2 |
| chr6:24515497-24515497 | p.V290M | 2 |
| chr6:24528317-24528317 | p.P435P | 2 |
| chr6:24533775-24533775 | p.V494V | 2 |
| chr6:24502755-24502755 | p.R120K | 2 |
| Top |
|
 |
| Point Mutation/ Tissue ID | 1 | 2 | 3 | 4 | 5 | 6 | 7 | 8 | 9 | 10 | 11 | 12 | 13 | 14 | 15 | 16 | 17 | 18 | 19 | 20 |
| # sample | 2 | 2 | 1 | 11 | 1 | 2 | 2 | 1 | 3 | 3 | 12 | 7 | 1 | 7 | ||||||
| # mutation | 2 | 2 | 1 | 11 | 1 | 2 | 2 | 1 | 3 | 3 | 11 | 8 | 1 | 7 | ||||||
| nonsynonymous SNV | 1 | 1 | 7 | 1 | 1 | 2 | 1 | 8 | 6 | 1 | 5 | |||||||||
| synonymous SNV | 2 | 1 | 4 | 2 | 2 | 1 | 2 | 3 | 2 | 2 |
| cf) Tissue ID; Tissue type (1; BLCA[Bladder Urothelial Carcinoma], 2; BRCA[Breast invasive carcinoma], 3; CESC[Cervical squamous cell carcinoma and endocervical adenocarcinoma], 4; COAD[Colon adenocarcinoma], 5; GBM[Glioblastoma multiforme], 6; Glioma Low Grade, 7; HNSC[Head and Neck squamous cell carcinoma], 8; KICH[Kidney Chromophobe], 9; KIRC[Kidney renal clear cell carcinoma], 10; KIRP[Kidney renal papillary cell carcinoma], 11; LAML[Acute Myeloid Leukemia], 12; LUAD[Lung adenocarcinoma], 13; LUSC[Lung squamous cell carcinoma], 14; OV[Ovarian serous cystadenocarcinoma ], 15; PAAD[Pancreatic adenocarcinoma], 16; PRAD[Prostate adenocarcinoma], 17; SKCM[Skin Cutaneous Melanoma], 18:STAD[Stomach adenocarcinoma], 19:THCA[Thyroid carcinoma], 20:UCEC[Uterine Corpus Endometrial Carcinoma]) |
| Top |
| * We represented just top 10 SNVs. When you move the cursor on each content, you can see more deailed mutation information on the Tooltip. Those are primary_site, primary_histology, mutation(aa), pubmedID. |
| Genomic Position | Mutation(aa) | Unique sampleID count |
| chr6:24533775 | p.D137Y,ALDH5A1 | 2 |
| chr6:24502805 | p.V400I,ALDH5A1 | 2 |
| chr6:24528249 | p.P422P,ALDH5A1 | 2 |
| chr6:24533825 | p.A198P,ALDH5A1 | 2 |
| chr6:24528317 | p.V481V,ALDH5A1 | 2 |
| chr6:24503644 | p.S498F,ALDH5A1 | 2 |
| chr6:24505158 | p.S121R,ALDH5A1 | 1 |
| chr6:24532388 | p.P250S,ALDH5A1 | 1 |
| chr6:24520670 | p.K391R,ALDH5A1 | 1 |
| chr6:24502792 | p.P503L,ALDH5A1 | 1 |
| * Copy number data were extracted from TCGA using R package TCGA-Assembler. The URLs of all public data files on TCGA DCC data server were gathered on Jan-05-2015. Function ProcessCNAData in TCGA-Assembler package was used to obtain gene-level copy number value which is calculated as the average copy number of the genomic region of a gene. |
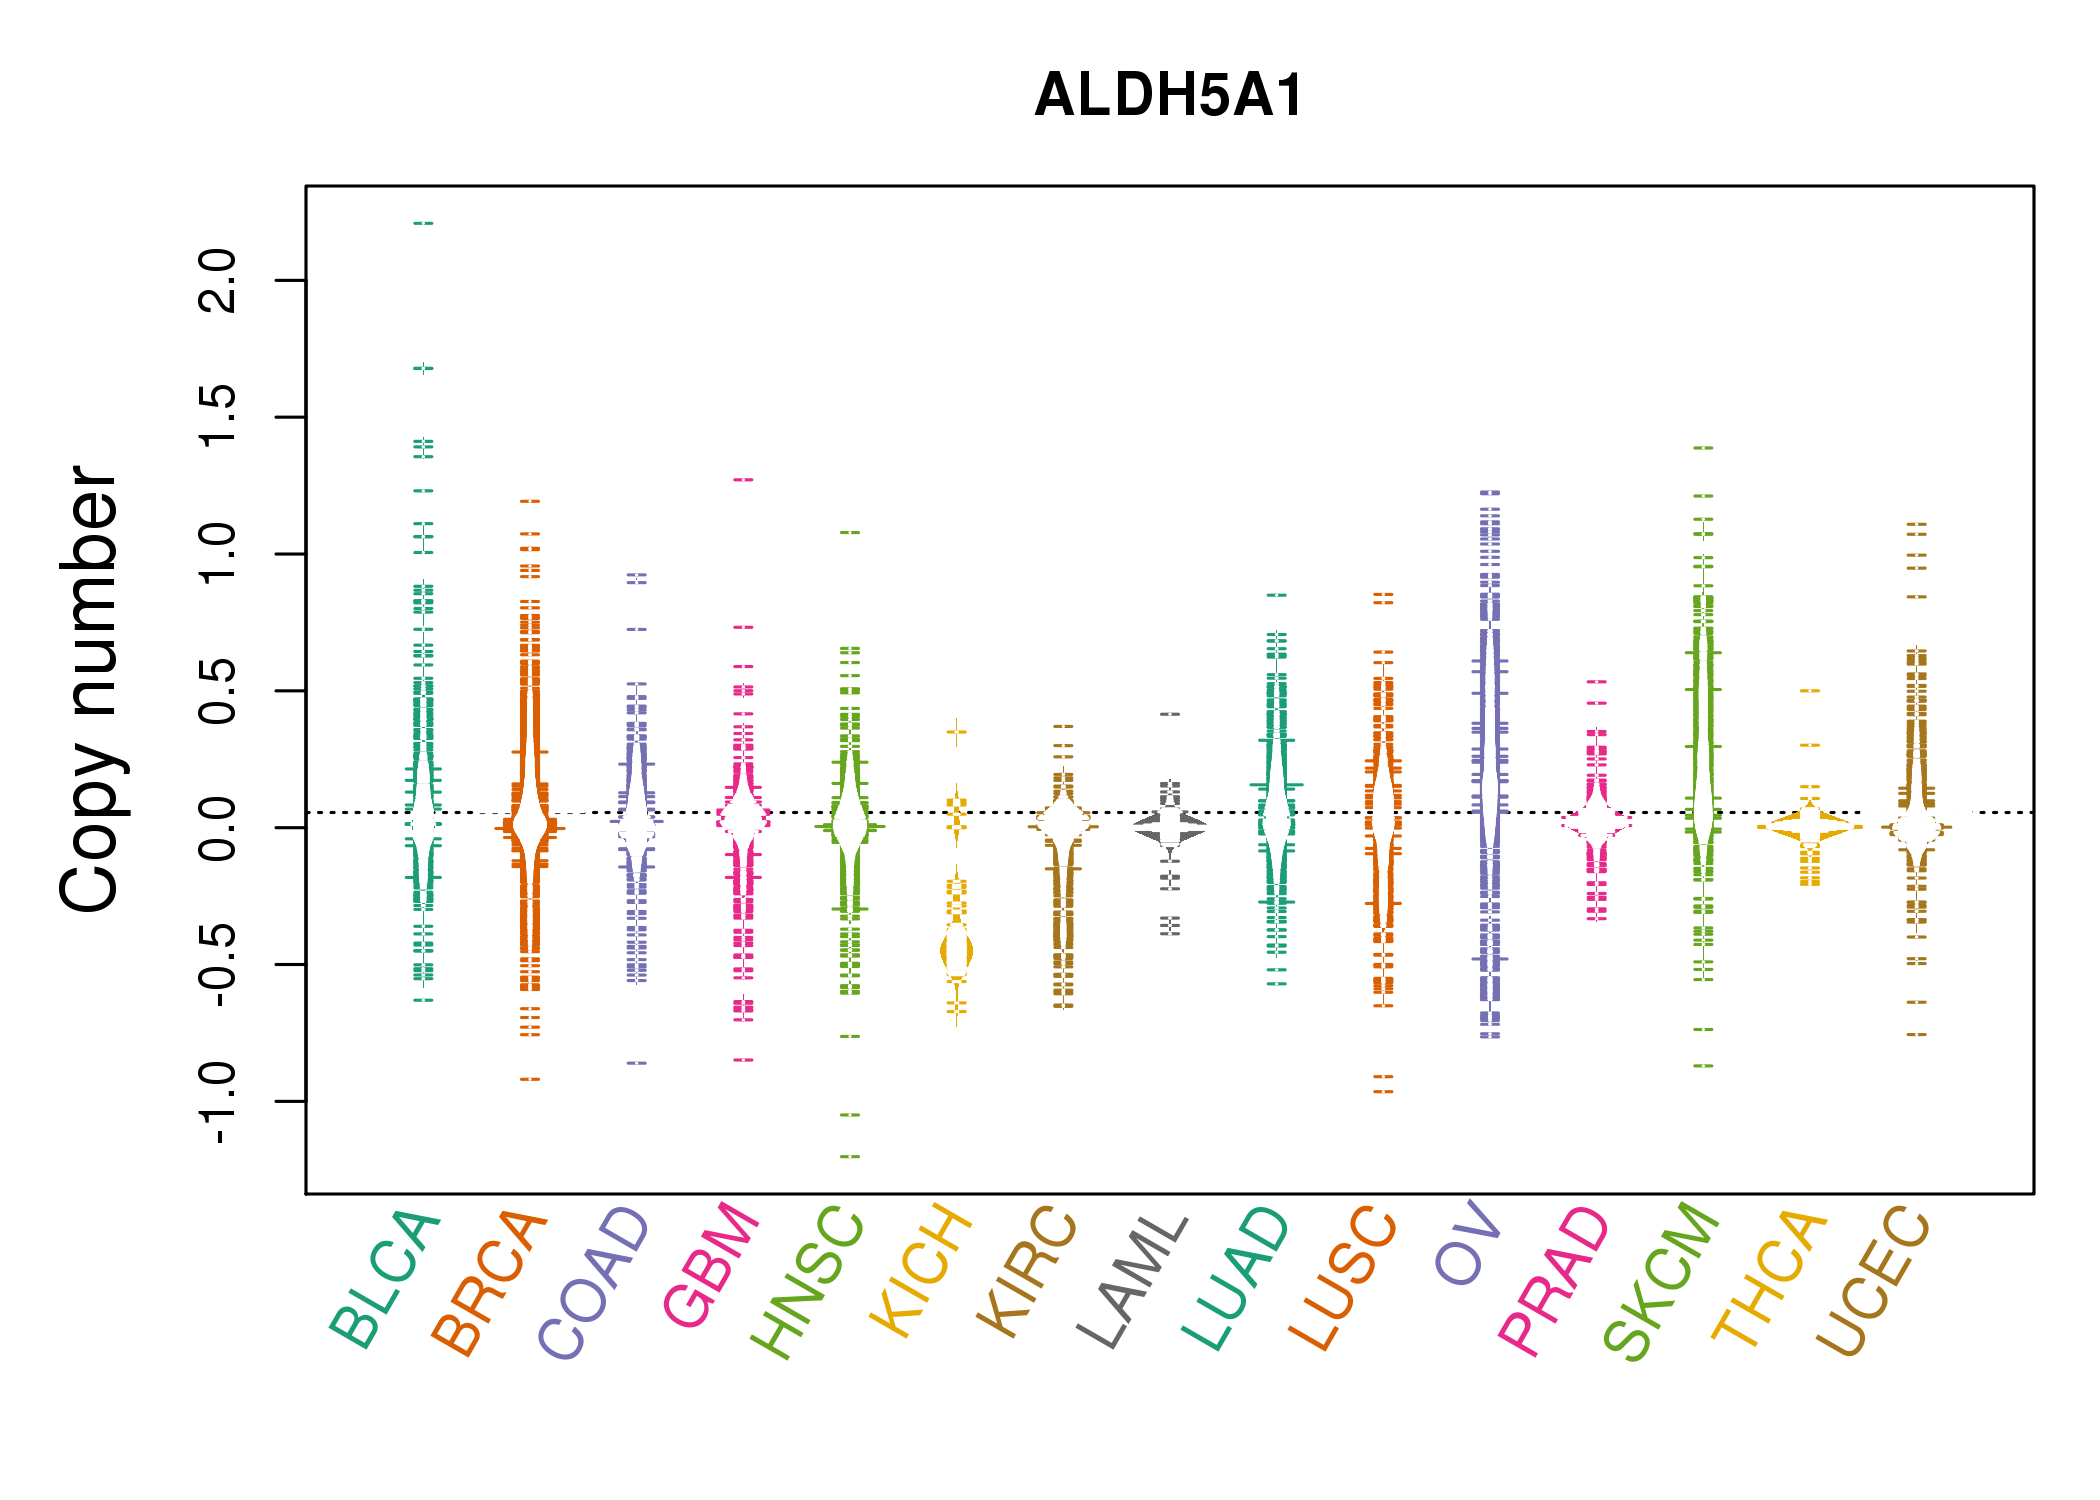 |
| cf) Tissue ID[Tissue type]: BLCA[Bladder Urothelial Carcinoma], BRCA[Breast invasive carcinoma], CESC[Cervical squamous cell carcinoma and endocervical adenocarcinoma], COAD[Colon adenocarcinoma], GBM[Glioblastoma multiforme], Glioma Low Grade, HNSC[Head and Neck squamous cell carcinoma], KICH[Kidney Chromophobe], KIRC[Kidney renal clear cell carcinoma], KIRP[Kidney renal papillary cell carcinoma], LAML[Acute Myeloid Leukemia], LUAD[Lung adenocarcinoma], LUSC[Lung squamous cell carcinoma], OV[Ovarian serous cystadenocarcinoma ], PAAD[Pancreatic adenocarcinoma], PRAD[Prostate adenocarcinoma], SKCM[Skin Cutaneous Melanoma], STAD[Stomach adenocarcinoma], THCA[Thyroid carcinoma], UCEC[Uterine Corpus Endometrial Carcinoma] |
| Top |
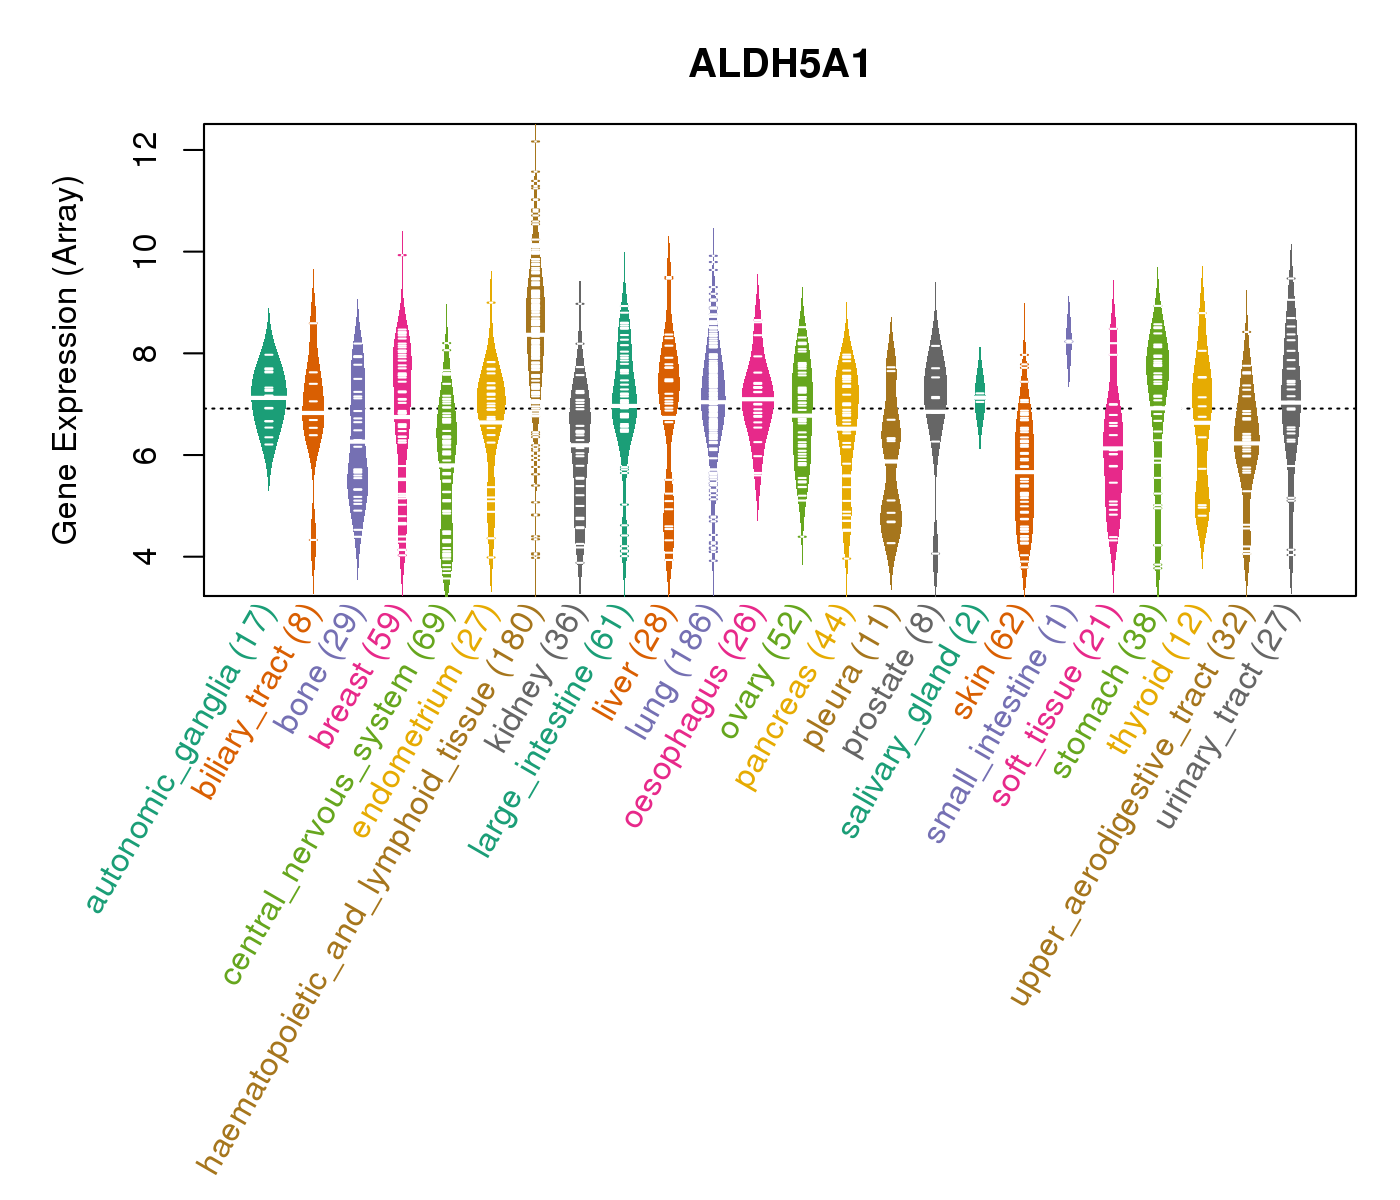
| Gene Expression for ALDH5A1 |
| * CCLE gene expression data were extracted from CCLE_Expression_Entrez_2012-10-18.res: Gene-centric RMA-normalized mRNA expression data. |
 |
| * Normalized gene expression data of RNASeqV2 was extracted from TCGA using R package TCGA-Assembler. The URLs of all public data files on TCGA DCC data server were gathered at Jan-05-2015. Only eight cancer types have enough normal control samples for differential expression analysis. (t test, adjusted p<0.05 (using Benjamini-Hochberg FDR)) |
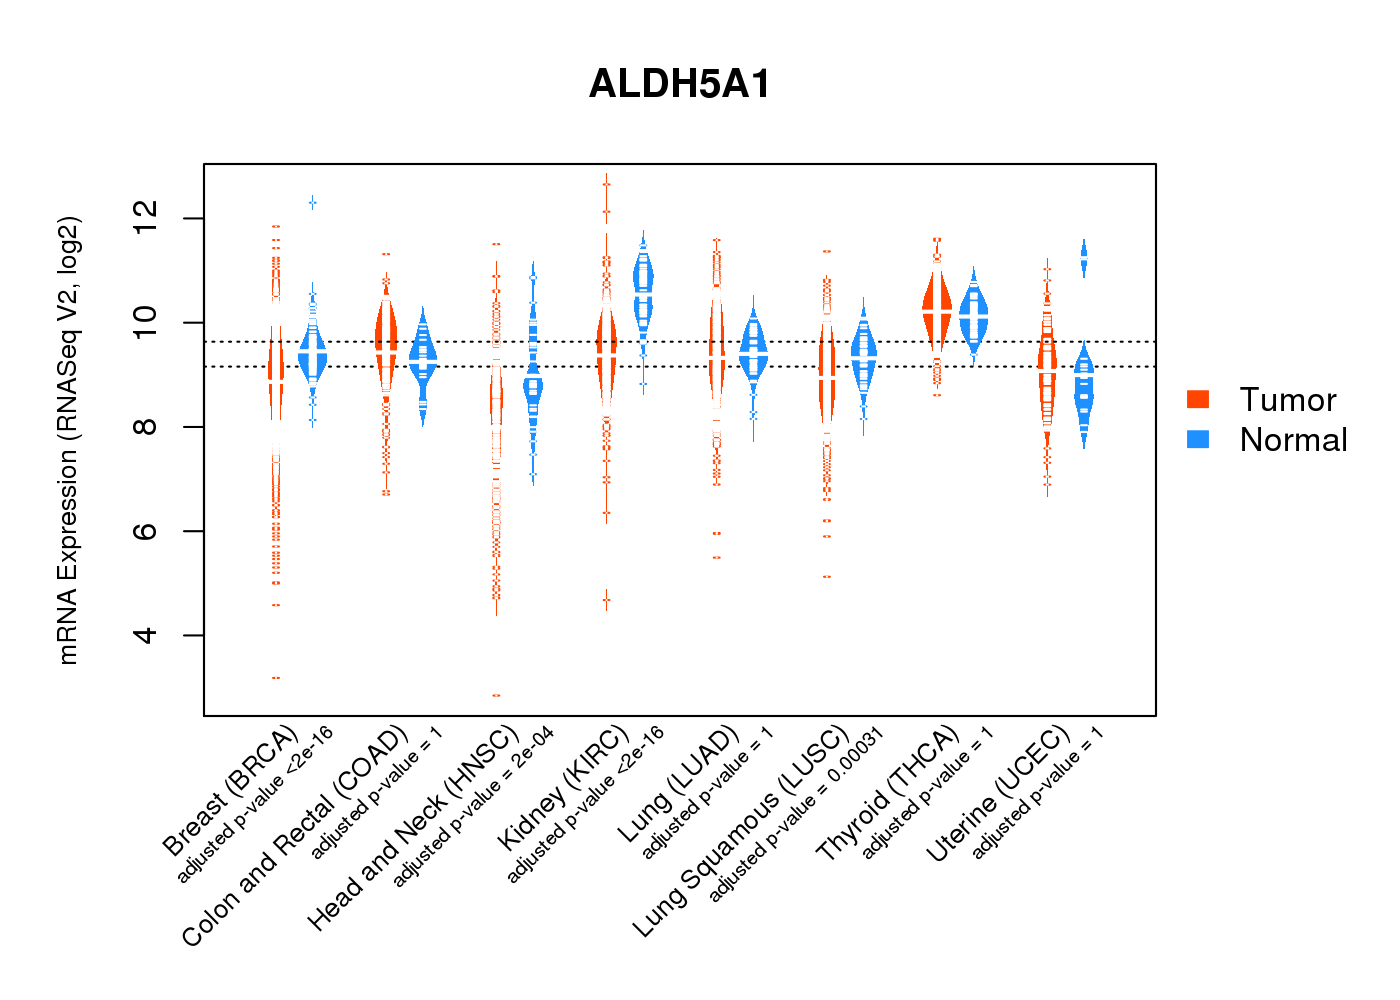 |
| Top |
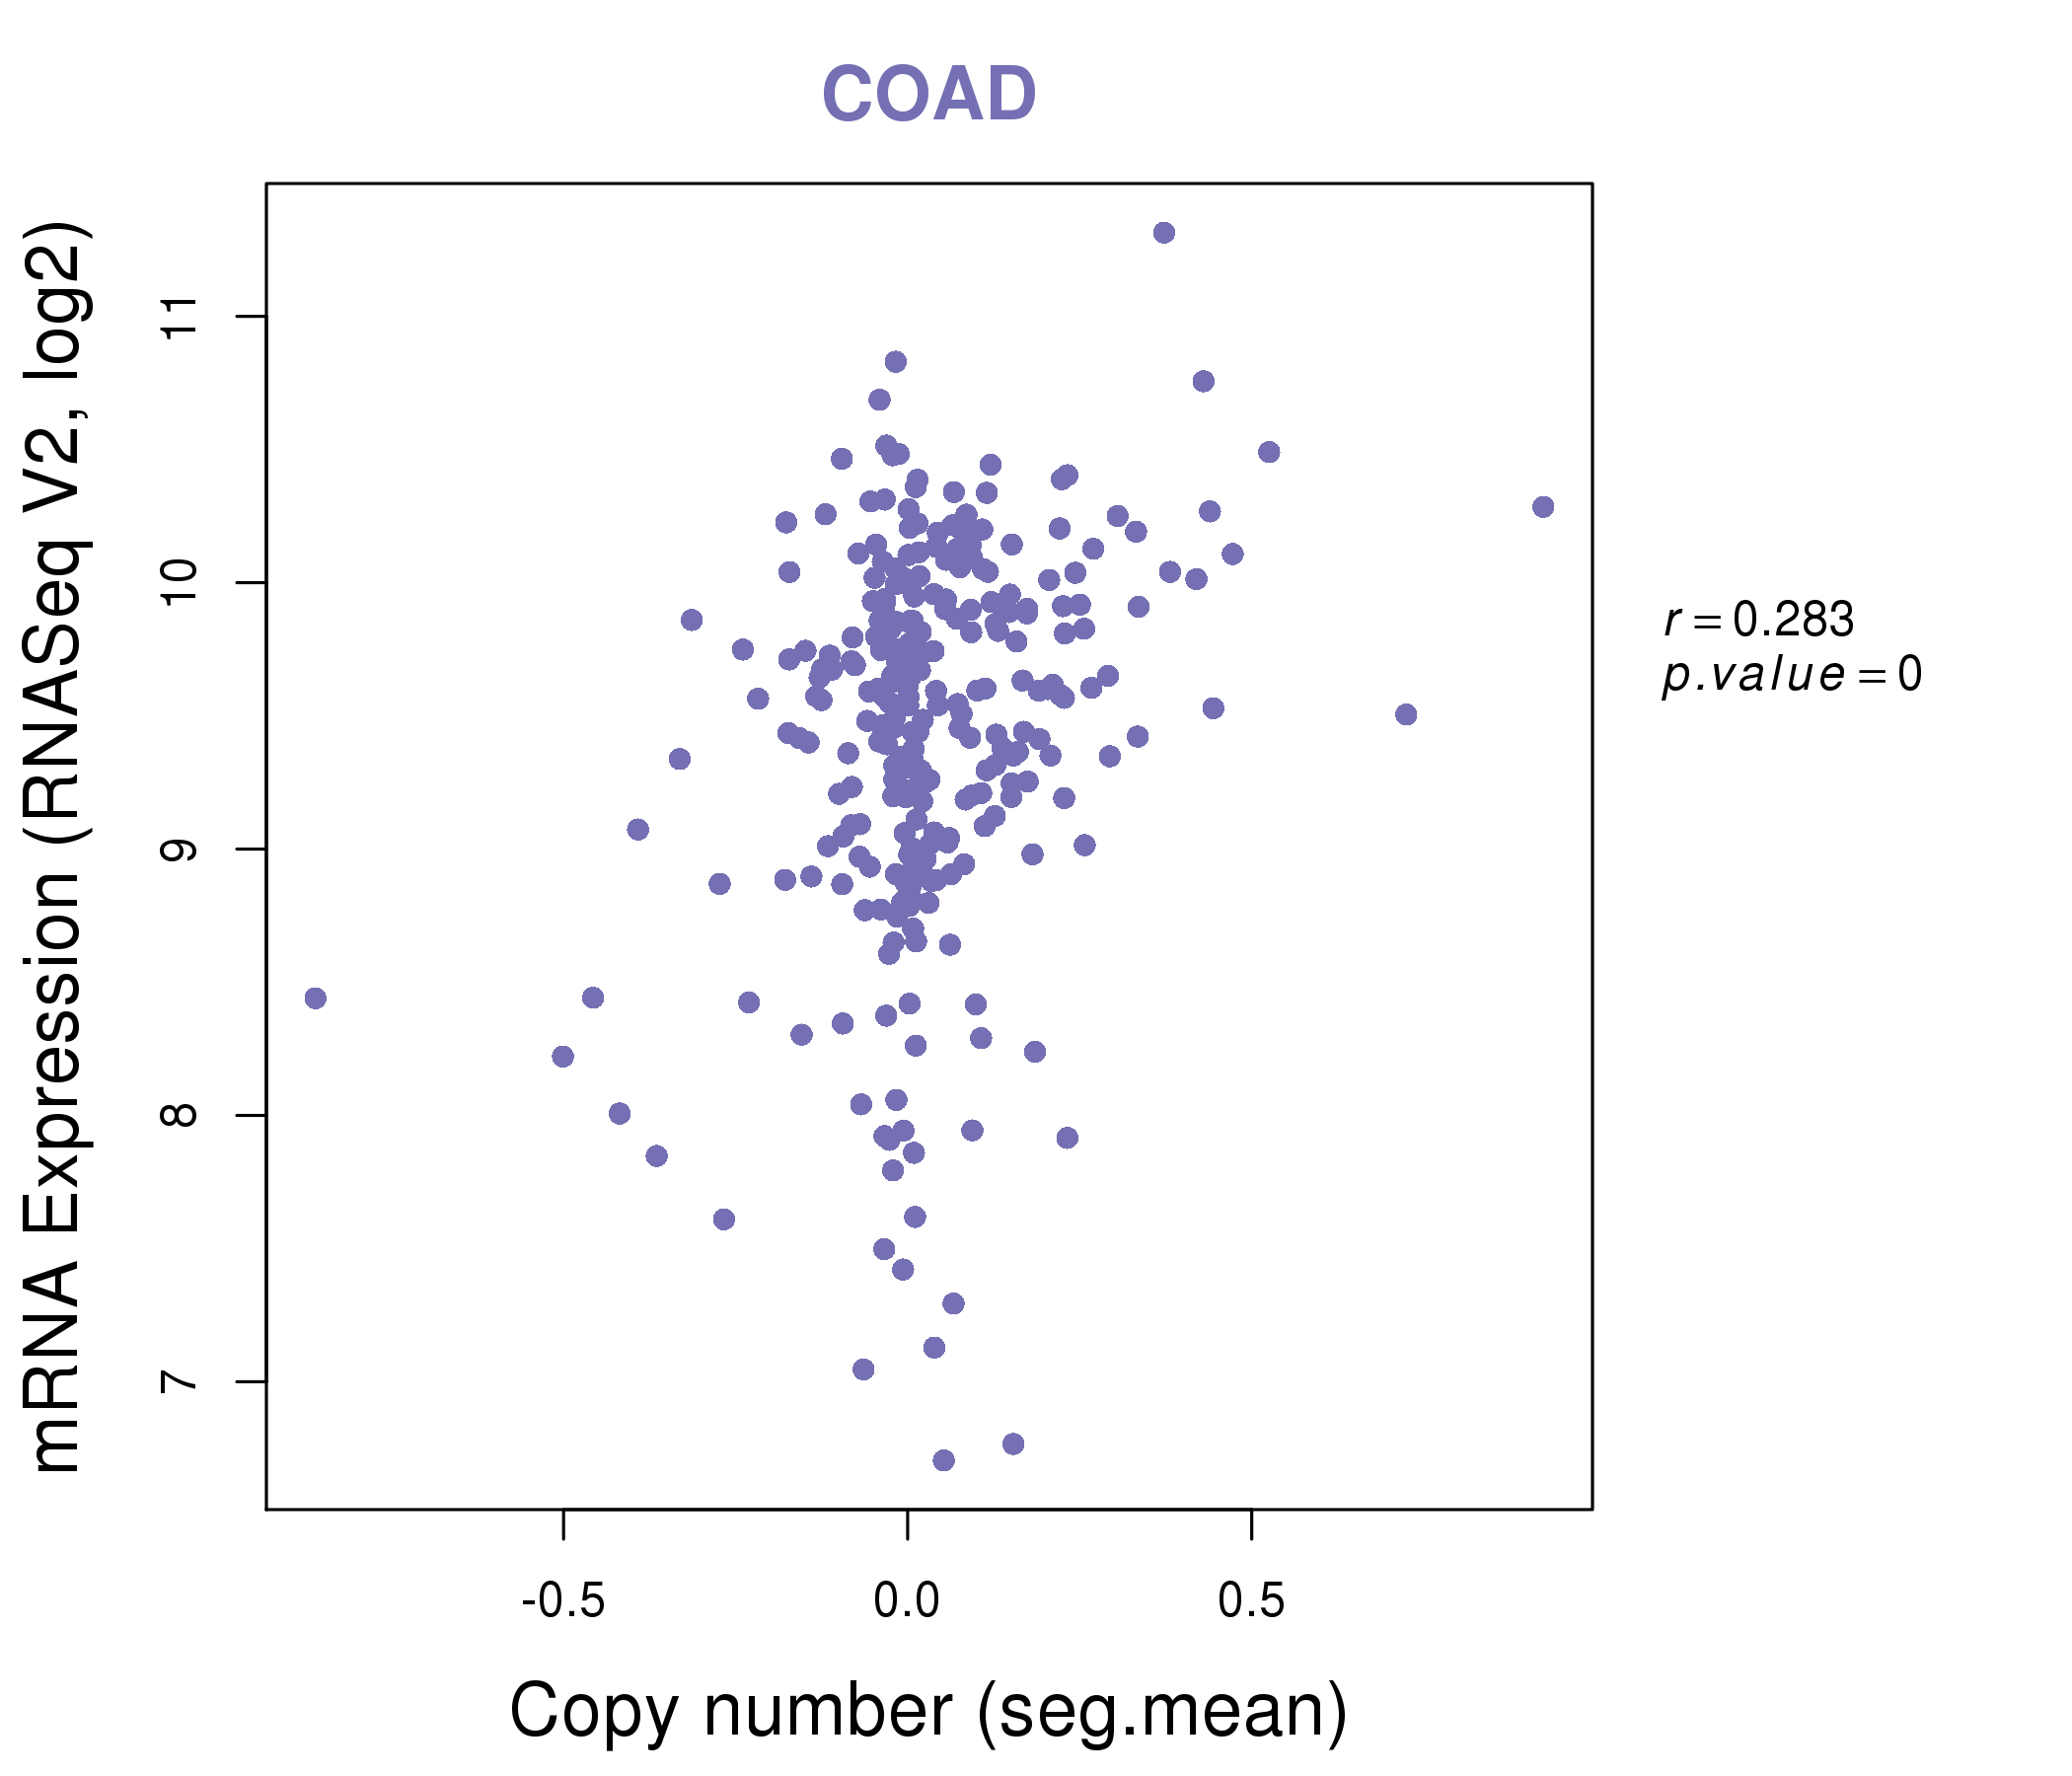
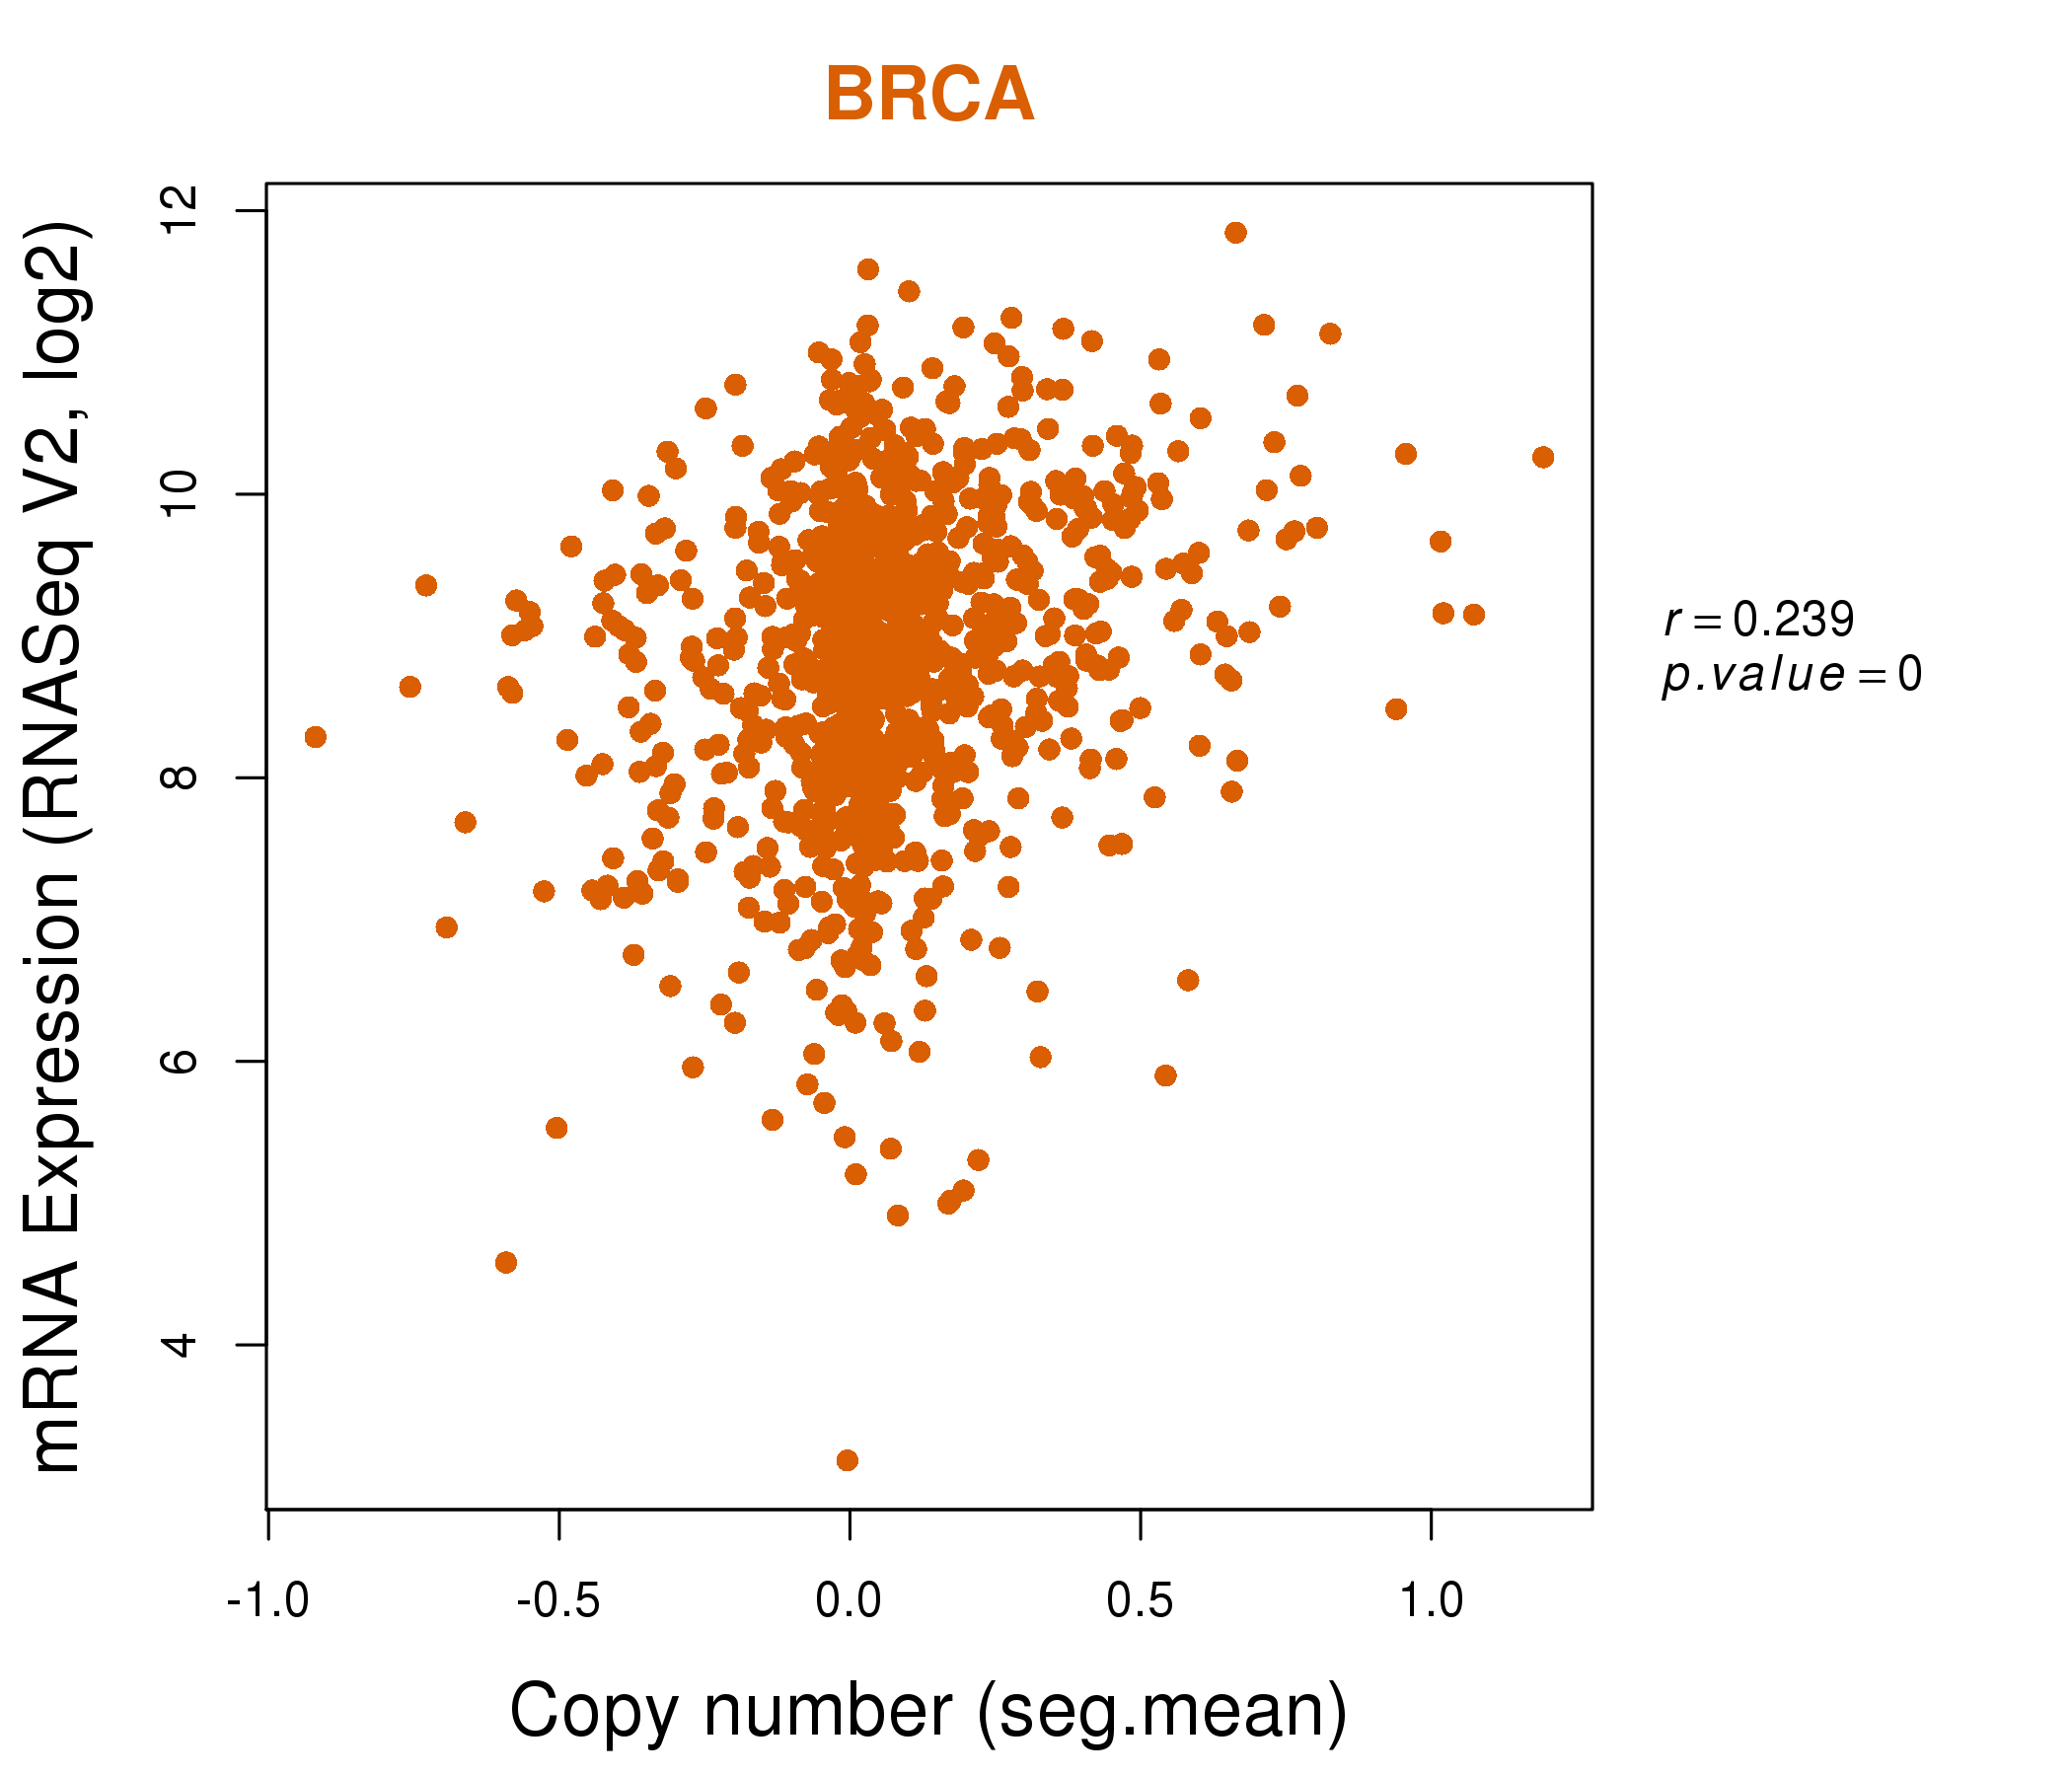
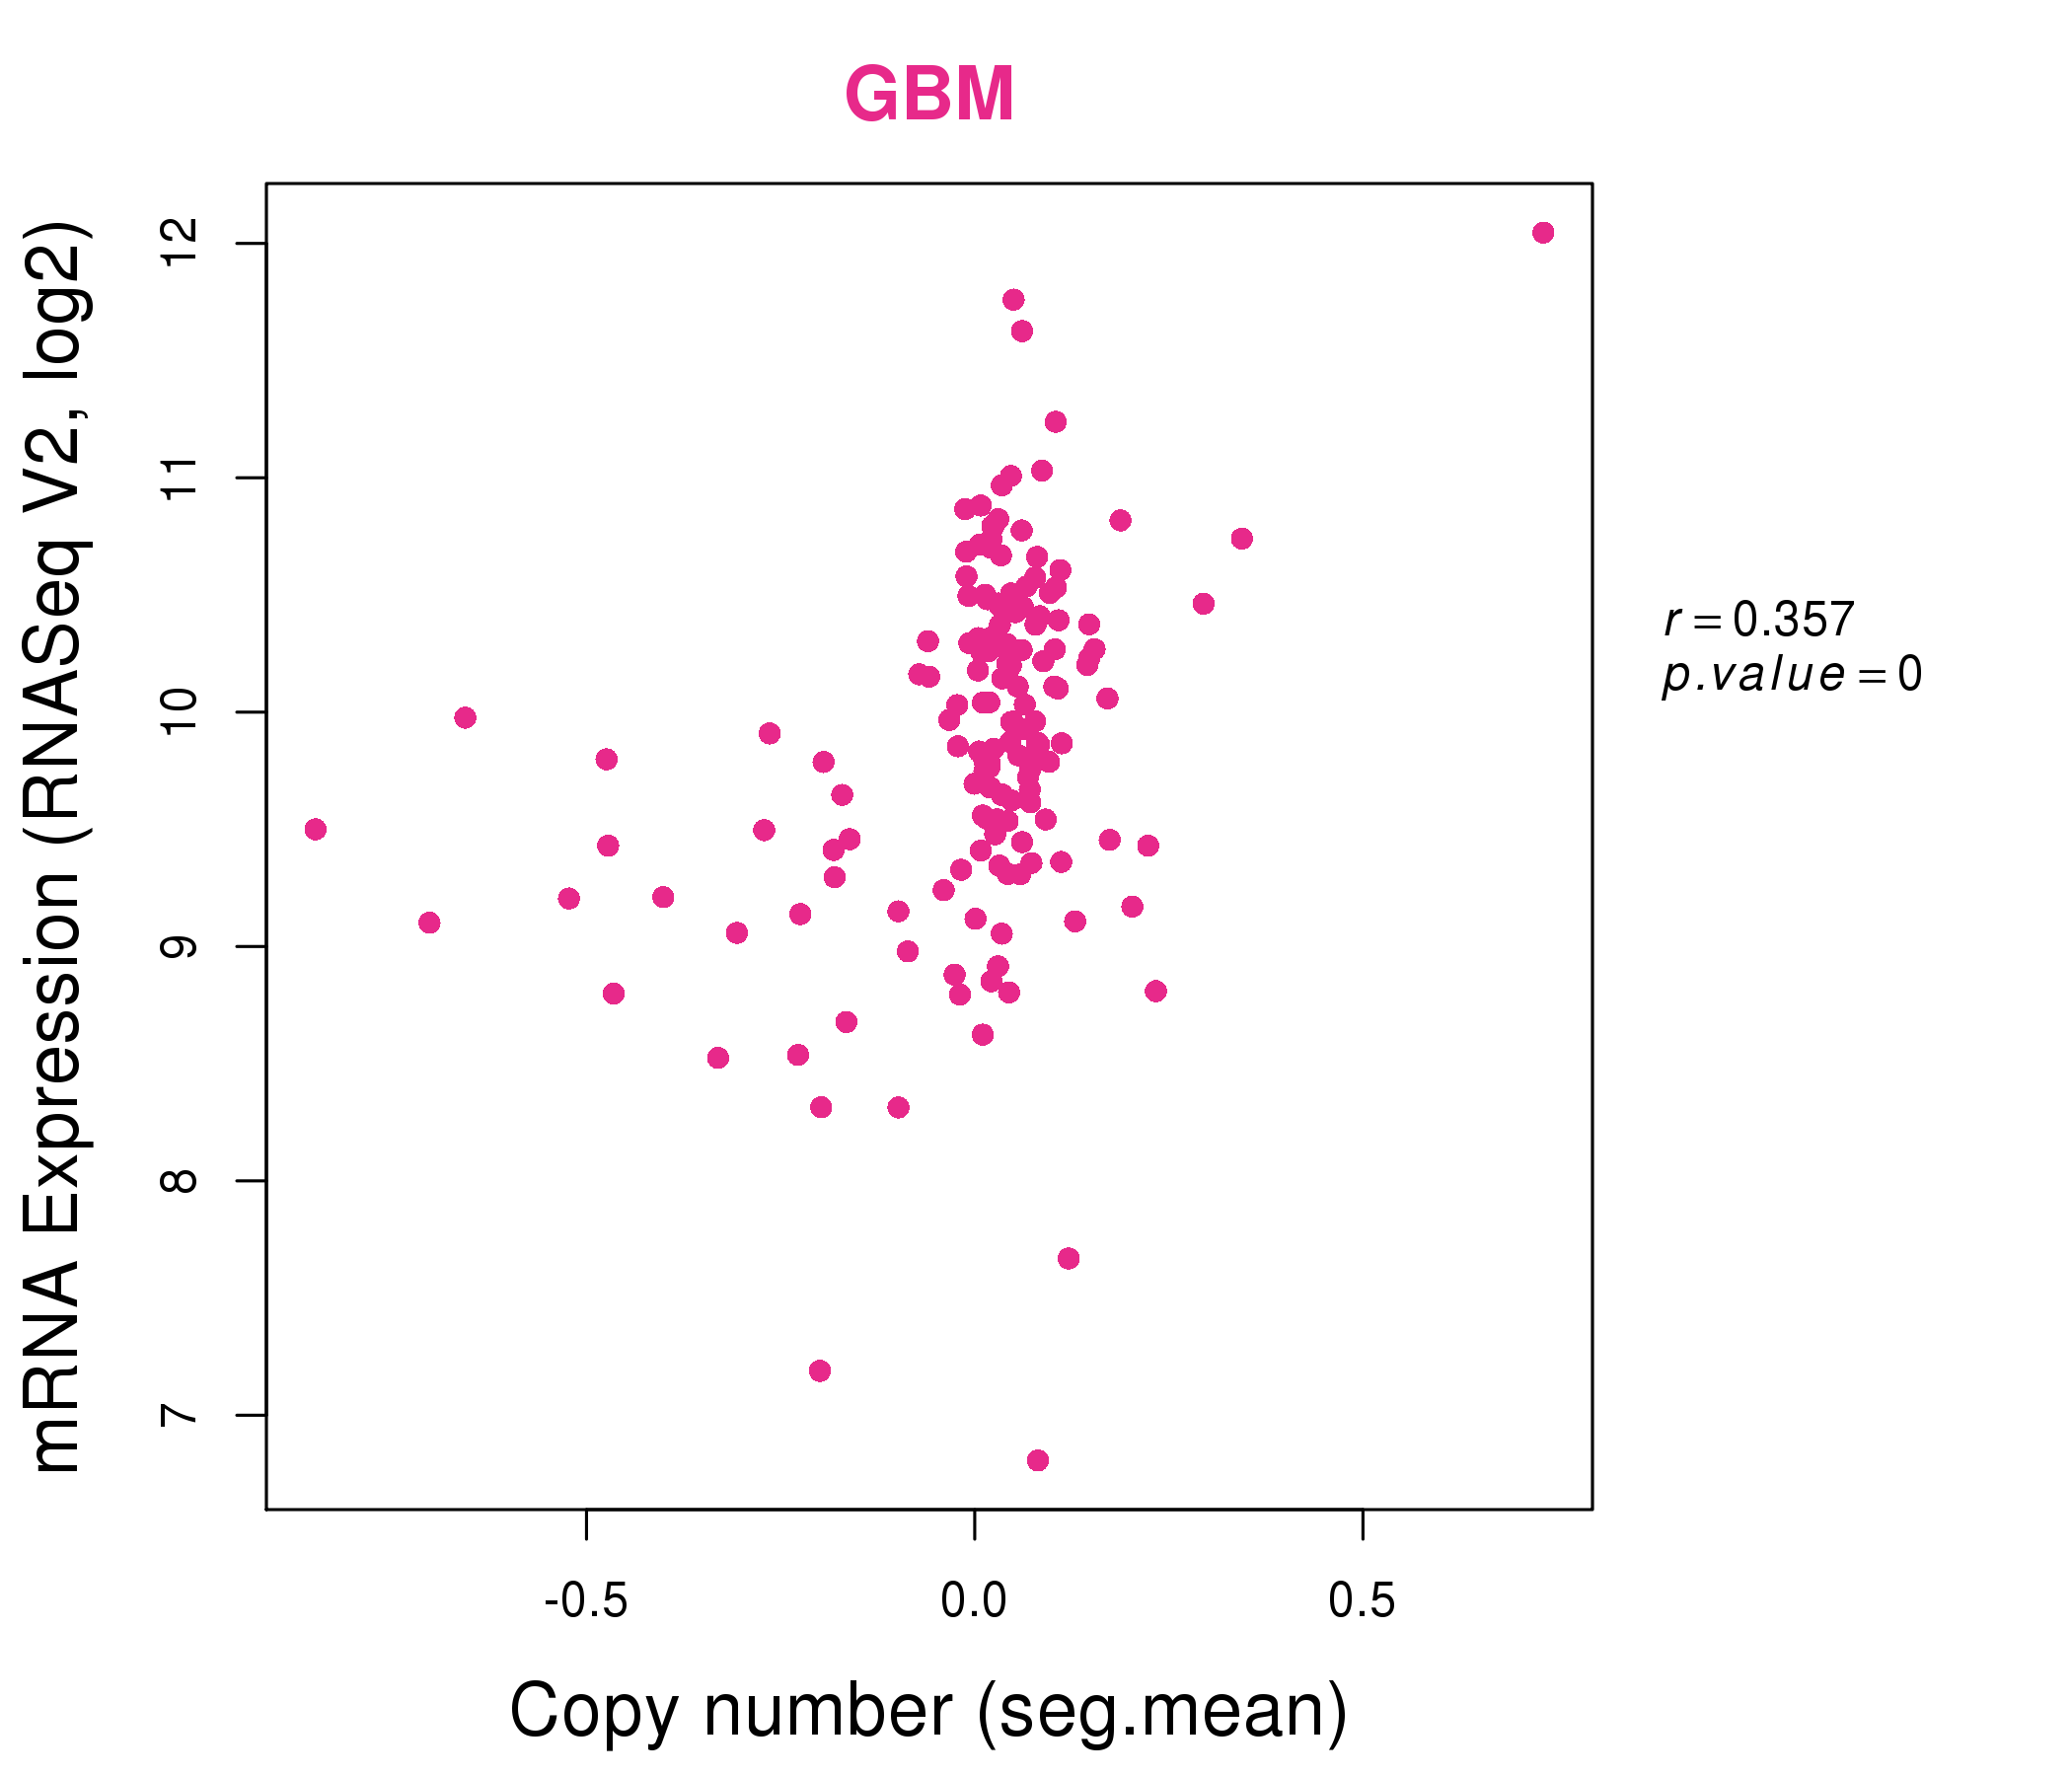
| * This plots show the correlation between CNV and gene expression. |
: Open all plots for all cancer types
 |
|
 |
|
| Top |
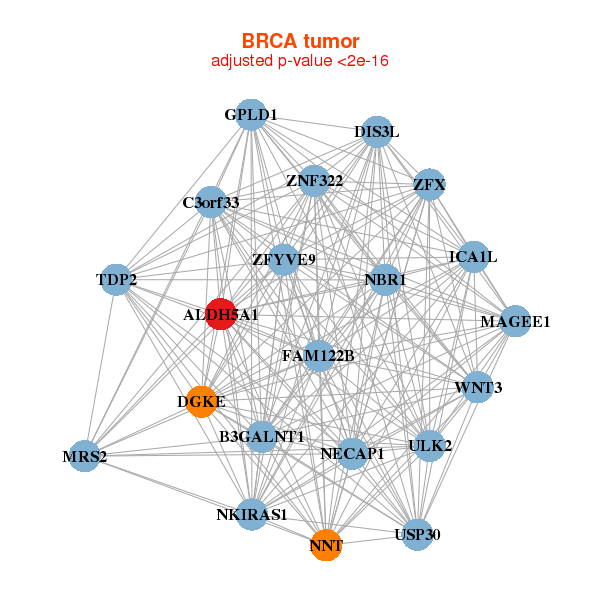
| Gene-Gene Network Information |
| * Co-Expression network figures were drawn using R package igraph. Only the top 20 genes with the highest correlations were shown. Red circle: input gene, orange circle: cell metabolism gene, sky circle: other gene |
: Open all plots for all cancer types
 |
| ||||
| ALDH5A1,B3GALNT1,C3orf33,DGKE,DIS3L,FAM122B,GPLD1, ICA1L,MAGEE1,MRS2,NBR1,NECAP1,NKIRAS1,NNT, TDP2,ULK2,USP30,WNT3,ZFX,ZFYVE9,ZNF322 | ALDH5A1,CAP2,CFL2,CLCN4,EPM2A,FYCO1,GBAS, HBS1L,KIAA1161,KLHL31,NDUFS1,NNT,NRD1,PDHX, RHOBTB1,SCN4A,TMEM143,UBR3,ZAK,ZNF106,ZYG11B | ||||
 |
| ||||
| ALDH5A1,BCL7A,RIIAD1,ADCK3,CIZ1,ERBB3,GPLD1, MBTD1,NBR1,PAIP2B,PDK2,R3HDM2,RGS9BP,SCAI, SUPT3H,TMEM192,UBIAD1,ZBTB44,ZBTB9,ZNF322,ZSWIM5 | ALDH5A1,TMEM260,CASK,CCDC47,DDAH1,EPB41,ERLIN2, FAM117B,FAM171A1,KIAA1804,CERS6,LRP11,MYO10,NLRP14, PDS5A,PHLPP1,PLEKHA5,RNF43,SLC12A2,TBC1D4,VGLL4 |


| * Co-Expression network figures were drawn using R package igraph. Only the top 20 genes with the highest correlations were shown. Red circle: input gene, orange circle: cell metabolism gene, sky circle: other gene |
: Open all plots for all cancer types
| Top |
: Open all interacting genes' information including KEGG pathway for all interacting genes from DAVID
| Top |
| Pharmacological Information for ALDH5A1 |
| DB Category | DB Name | DB's ID and Url link |
| * Gene Centered Interaction Network. |
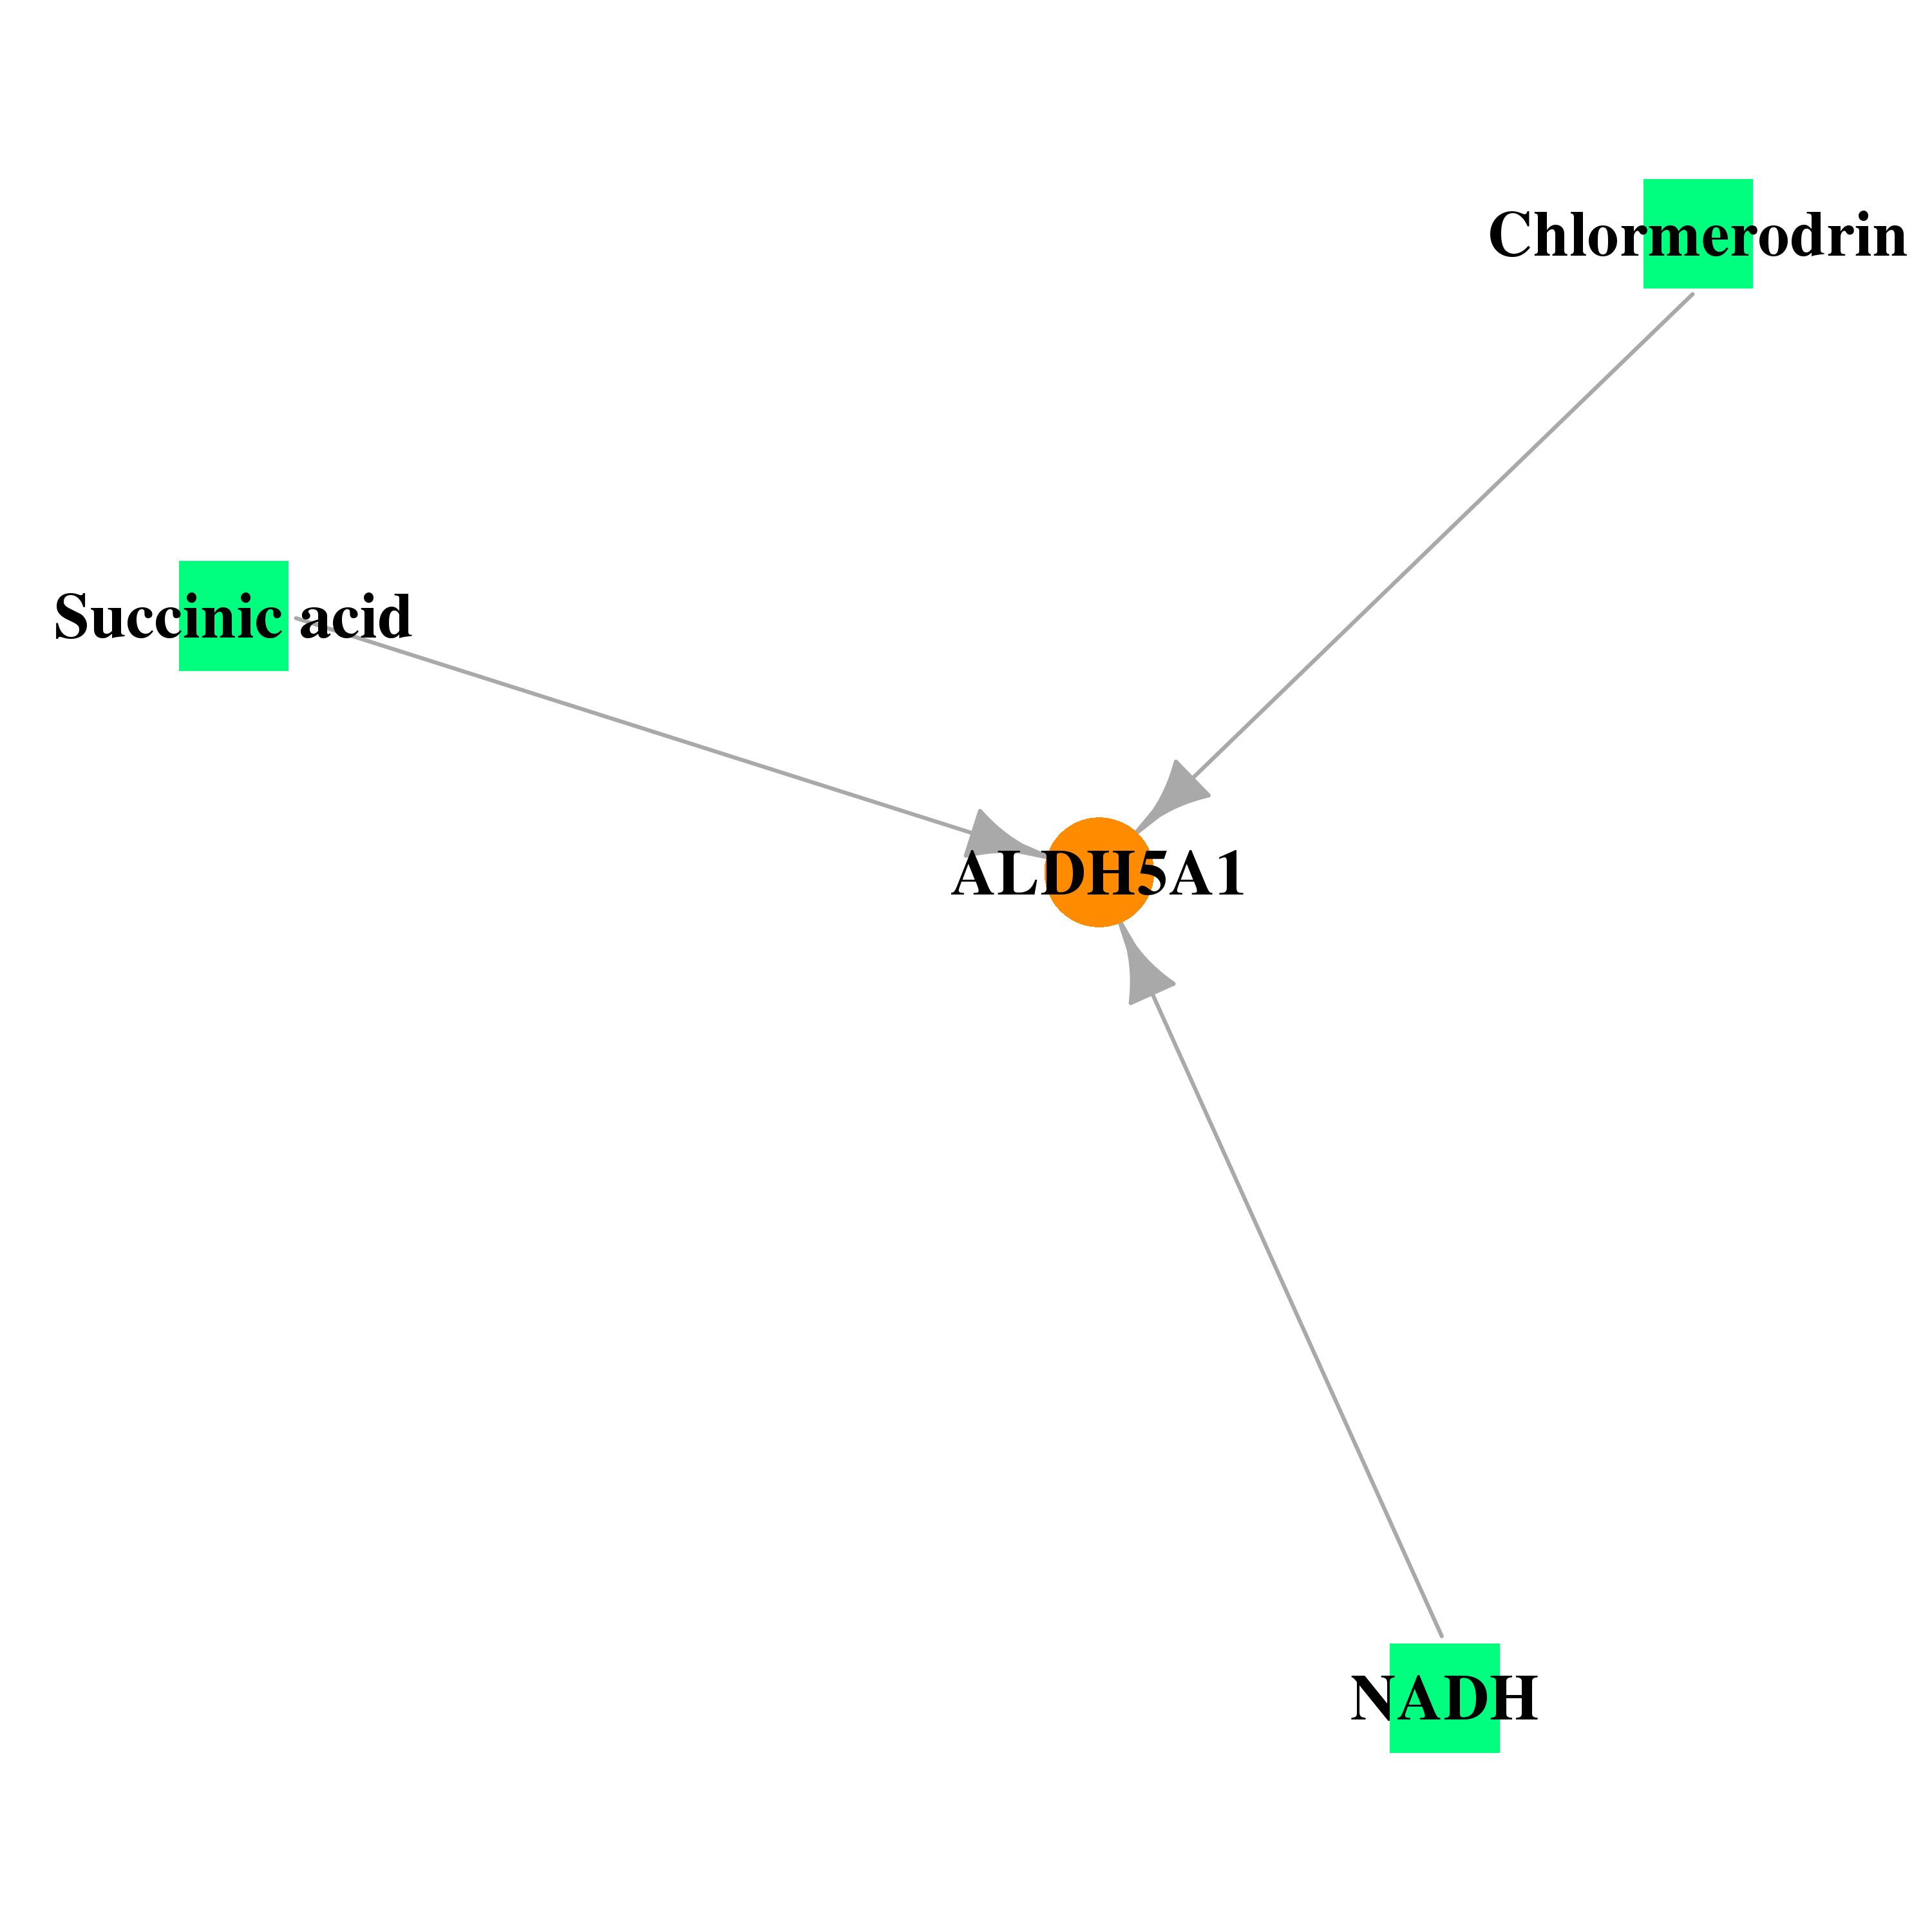 |
| * Drug Centered Interaction Network. |
| DrugBank ID | Target Name | Drug Groups | Generic Name | Drug Centered Network | Drug Structure |
| DB00139 | aldehyde dehydrogenase 5 family, member A1 | approved; nutraceutical | Succinic acid | 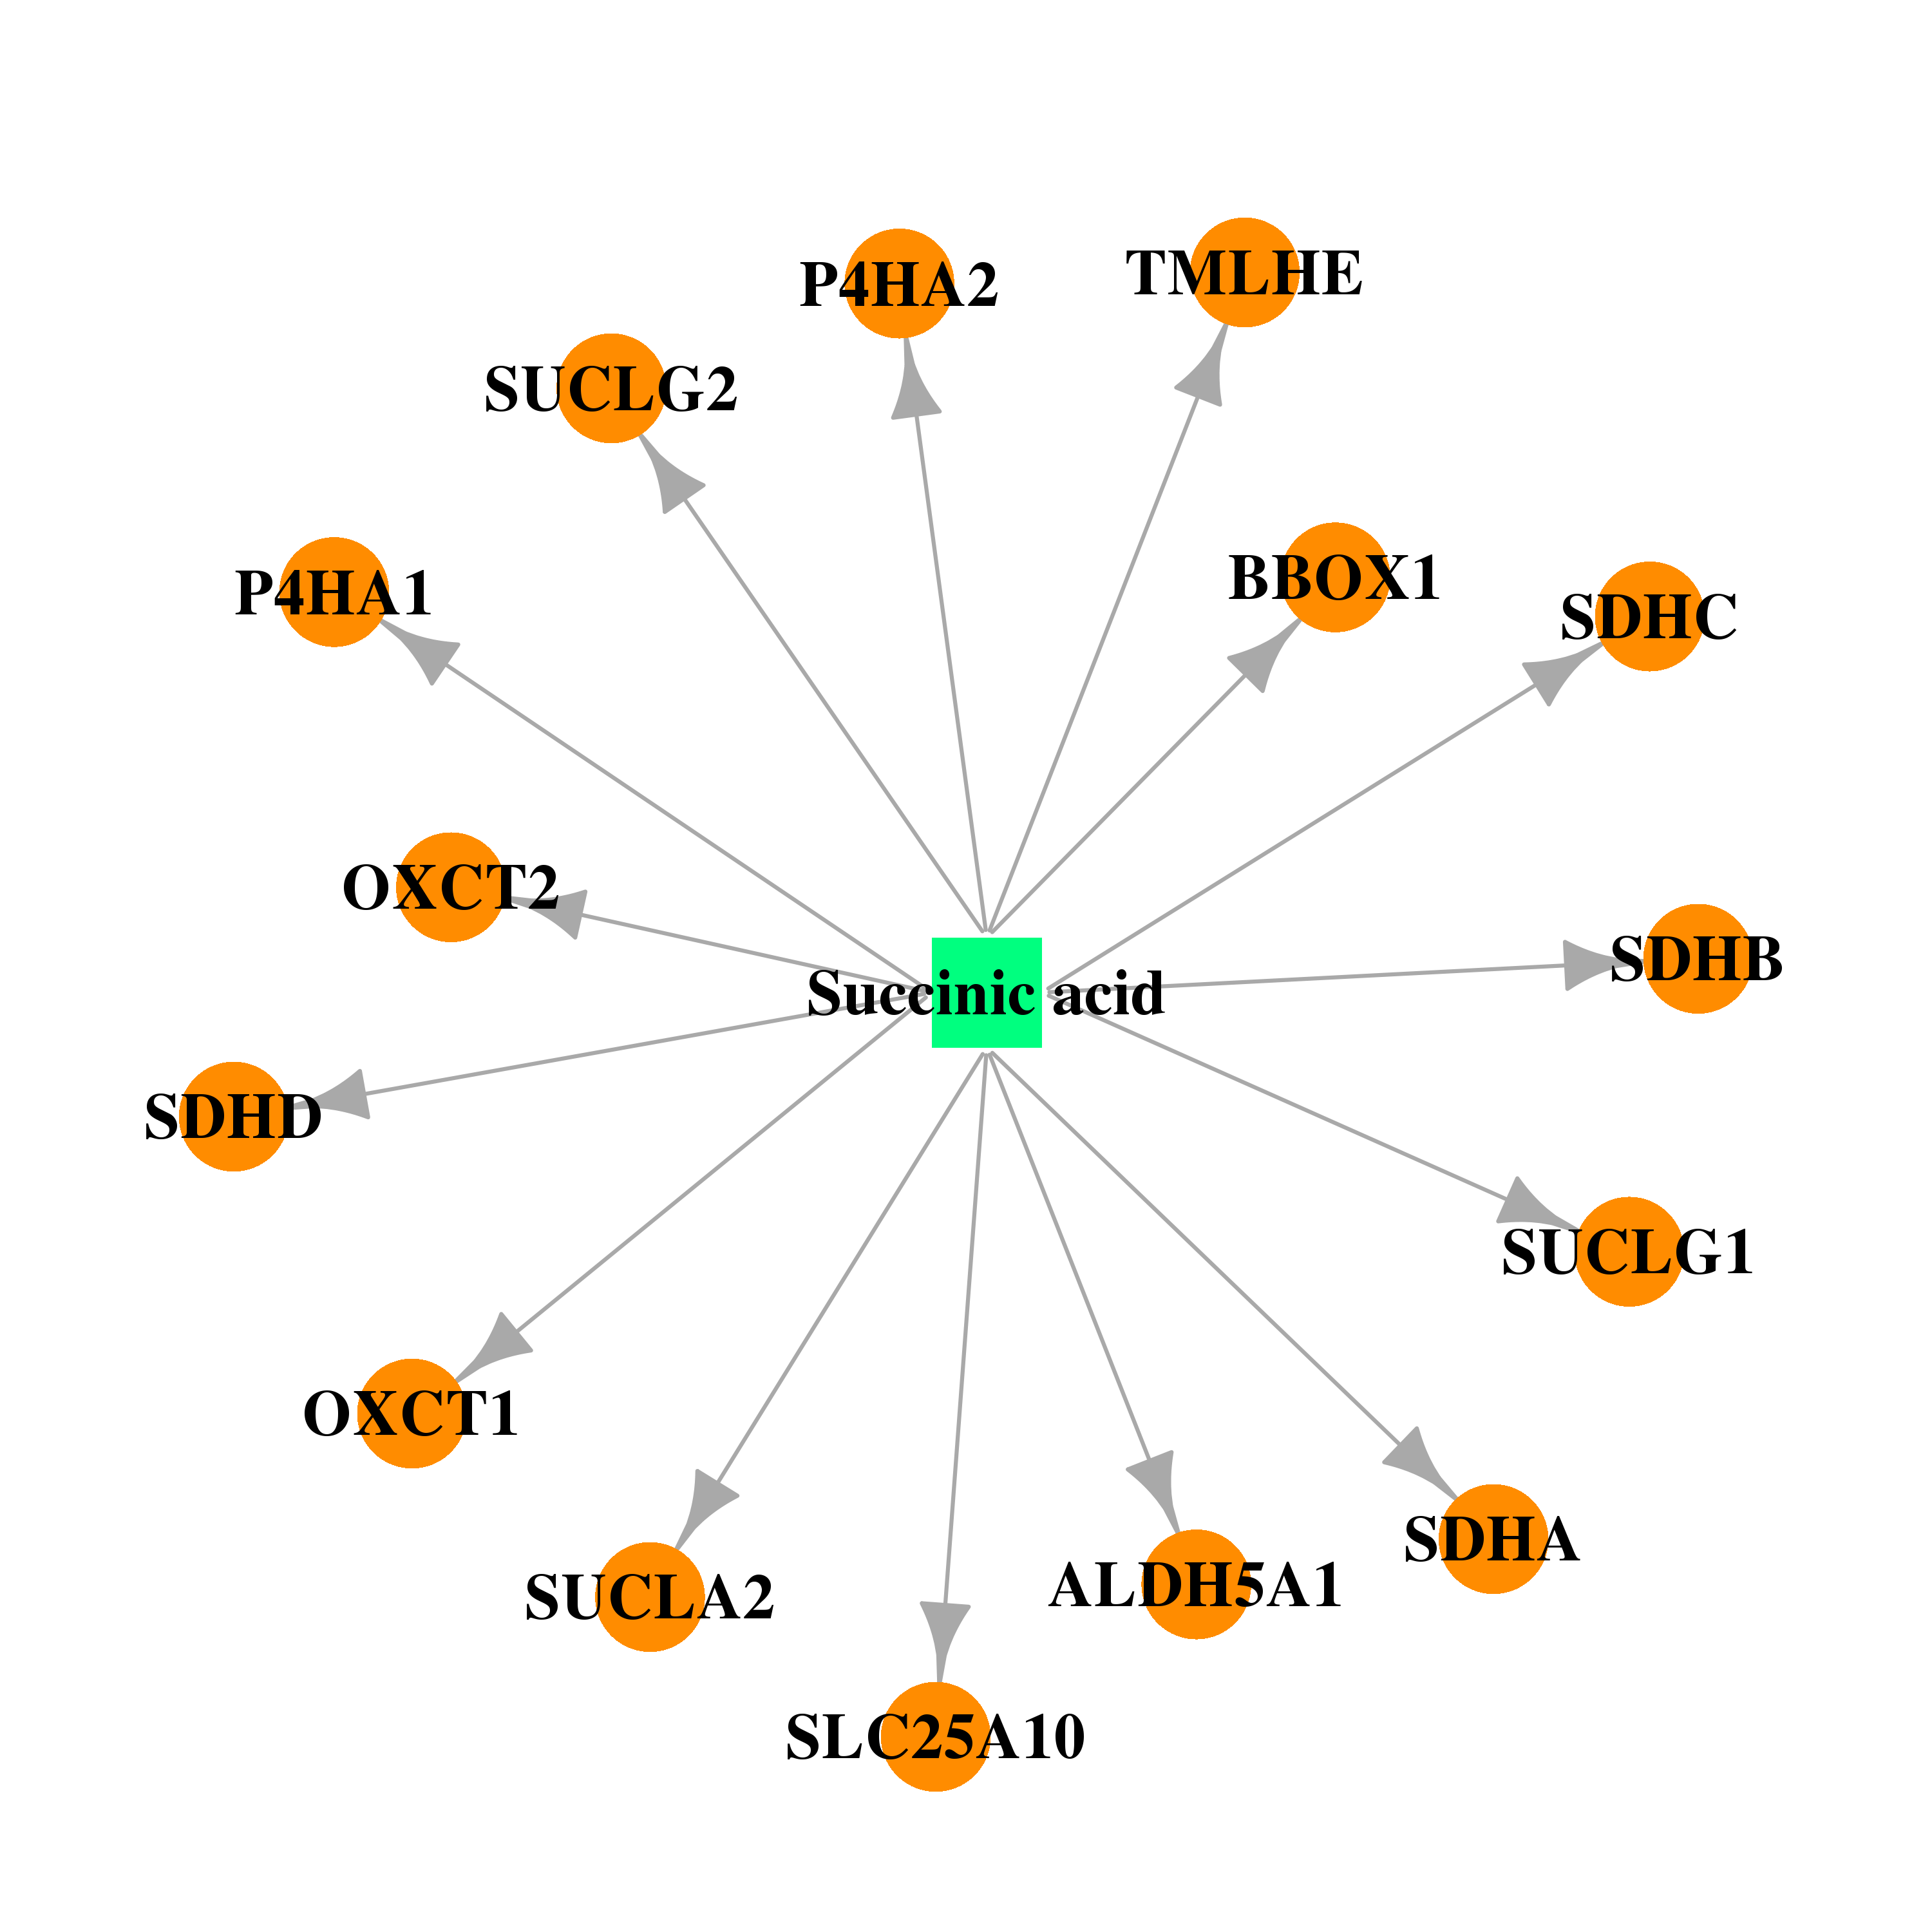 | 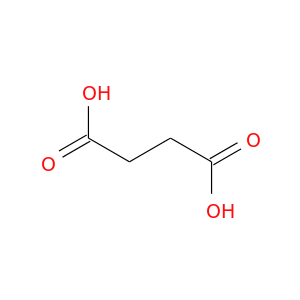 |
| DB00157 | aldehyde dehydrogenase 5 family, member A1 | approved; nutraceutical | NADH |  |  |
| DB00534 | aldehyde dehydrogenase 5 family, member A1 | approved | Chlormerodrin | 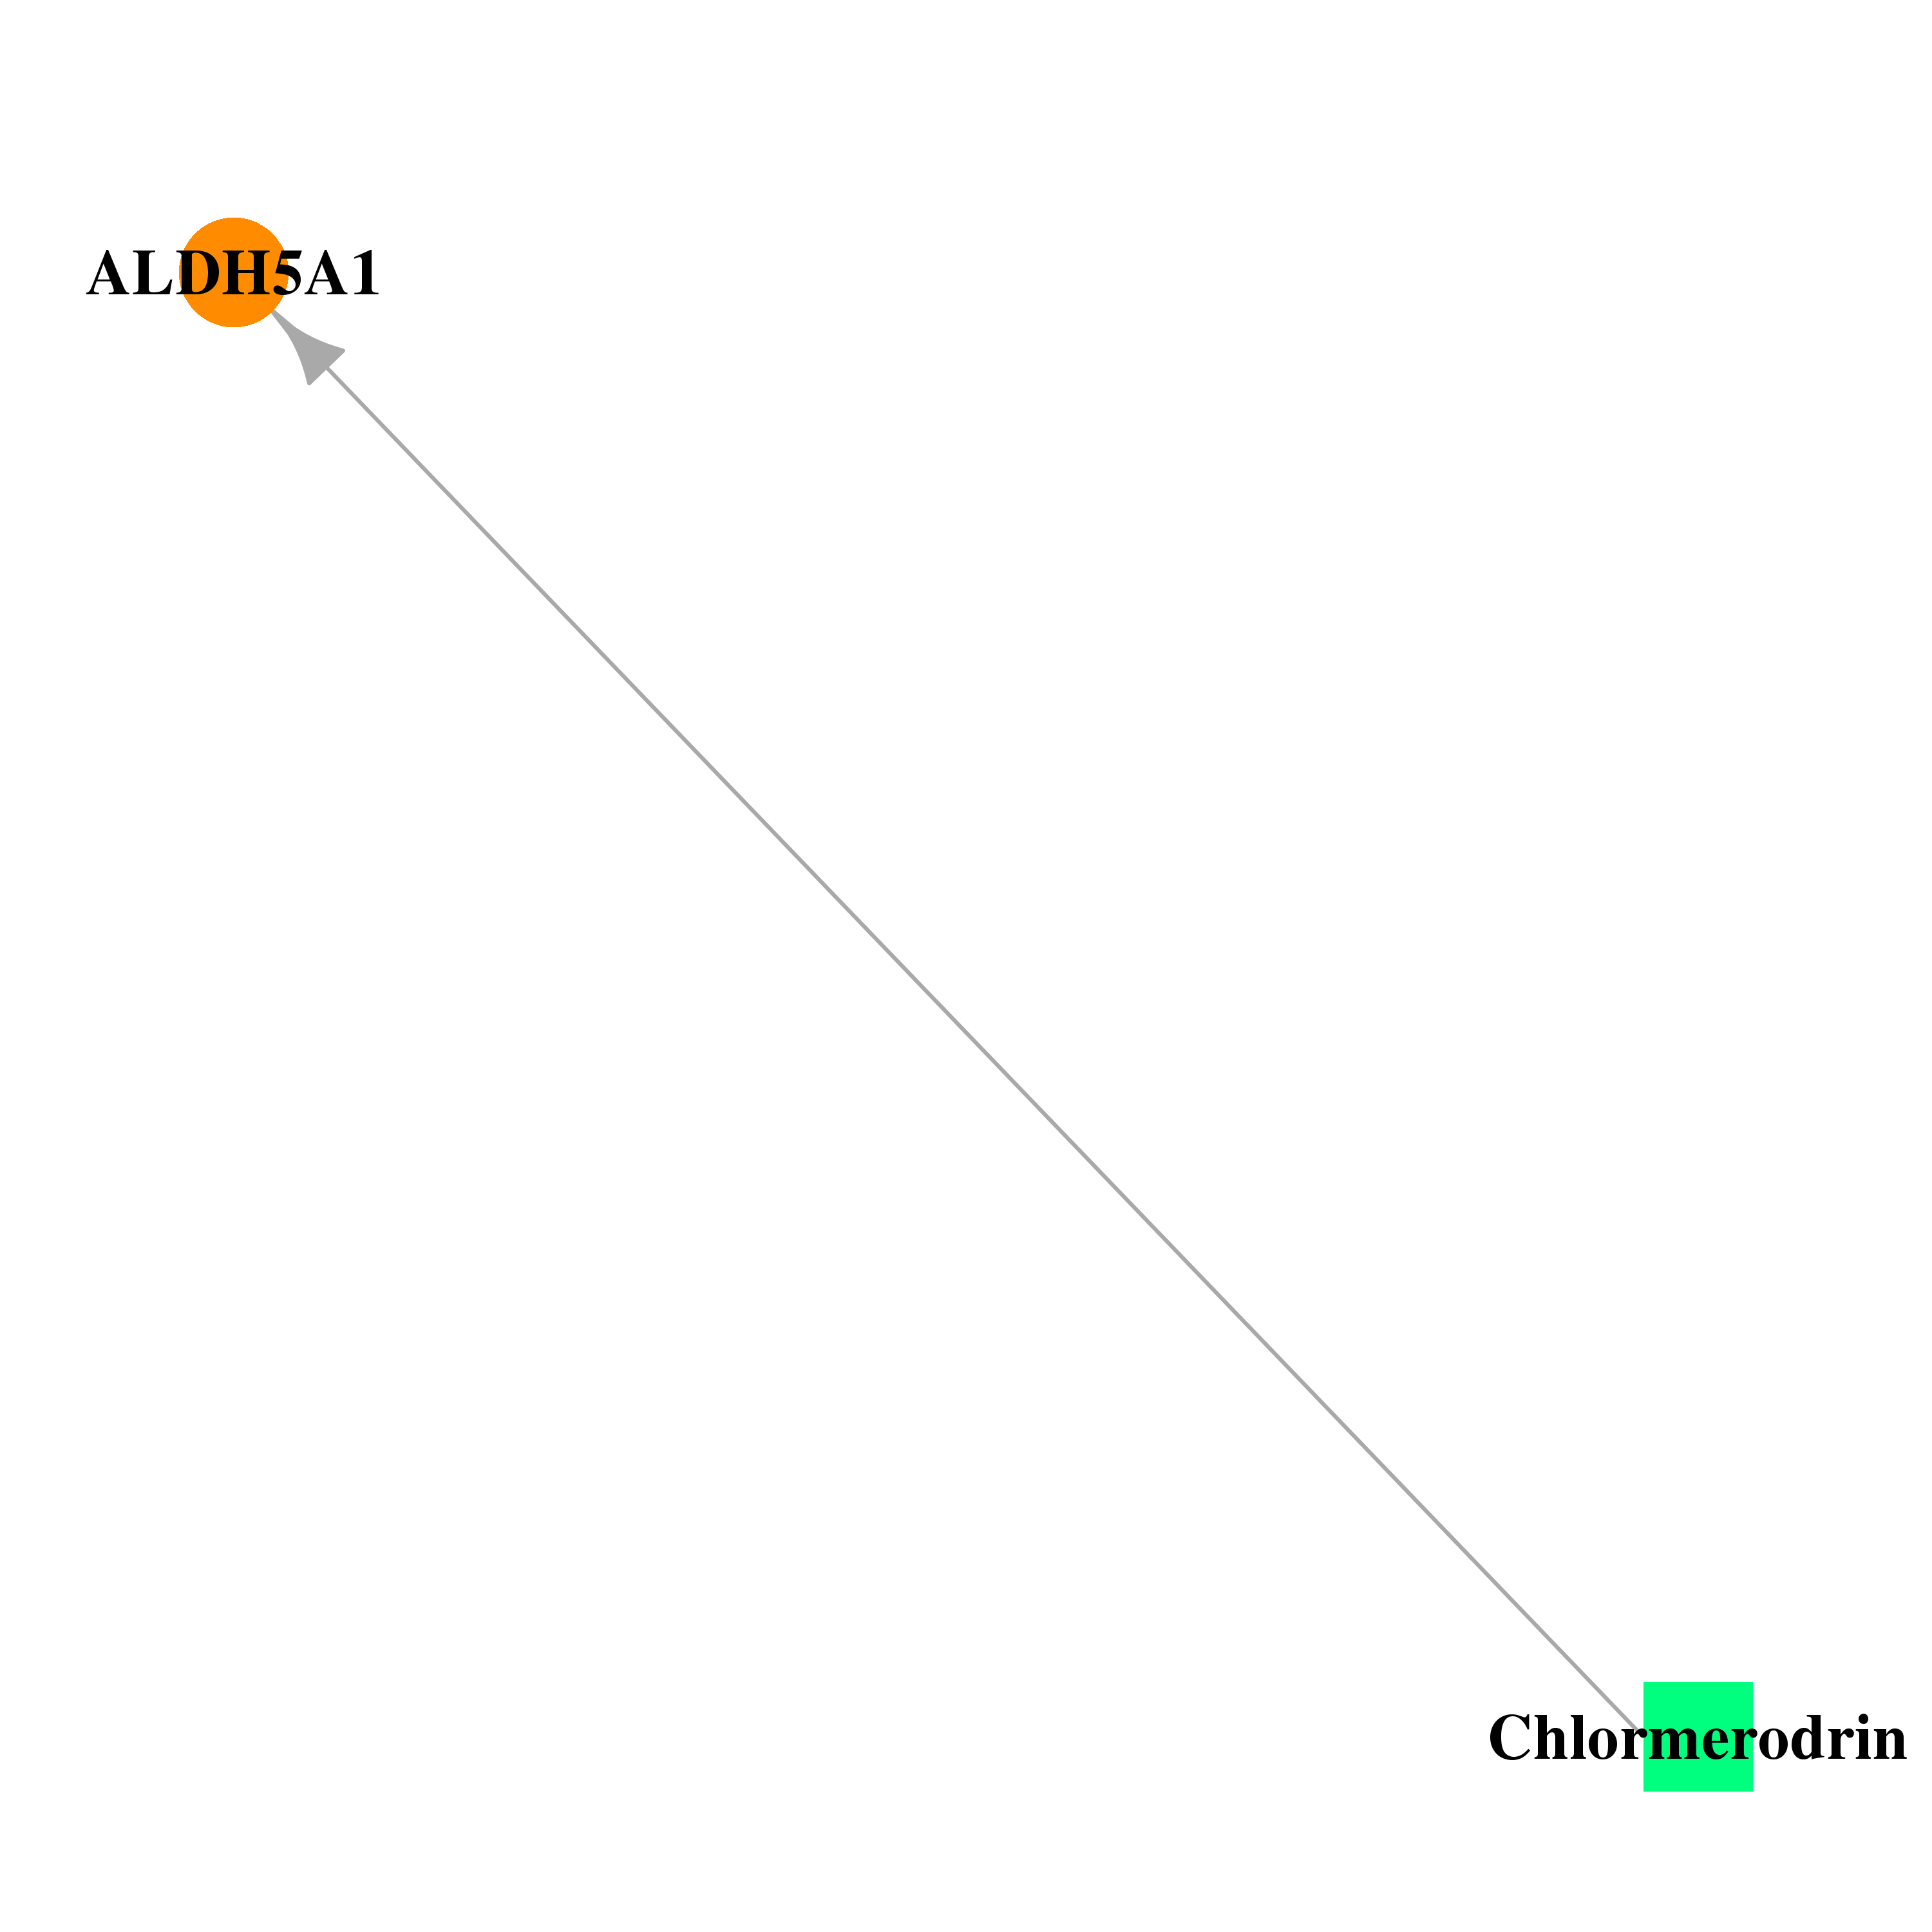 | 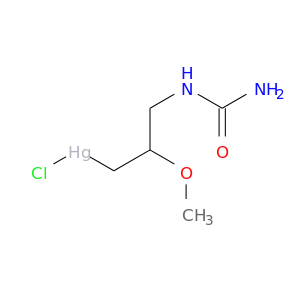 |
| Top |
| Cross referenced IDs for ALDH5A1 |
| * We obtained these cross-references from Uniprot database. It covers 150 different DBs, 18 categories. http://www.uniprot.org/help/cross_references_section |
: Open all cross reference information
|
Copyright © 2016-Present - The Univsersity of Texas Health Science Center at Houston @ |