|
||||||||||||||||||||||||||||||||||||||||||||||||||||||||||||||||||||||||||||||||||||||||||||||||||||||||||||||||||||||||||||||||||||||||||||||||||||||||||||||||||||||||||||||||||||||||||||||||||||||||||||||||||||||||||||||||||||||||||||||||||||||||||||||||||||||||||||||||||||||||||||||||||||||||||||||||||||||||||
| |
| Phenotypic Information (metabolism pathway, cancer, disease, phenome) |
| |
| |
| Gene-Gene Network Information: Co-Expression Network, Interacting Genes & KEGG |
| |
|


| Gene Summary for THTPA |
| Top |
| Phenotypic Information for THTPA(metabolism pathway, cancer, disease, phenome) |
| Cancer | CGAP: THTPA |
| Familial Cancer Database: THTPA | |
| * This gene is included in those cancer gene databases. |
|
|
|
|
|
| . | ||||||||||||||||||||||||||||||||||||||||||||||||||||||||||||||||||||||||||||||||||||||||||||||||||||||||||||||||||||||||||||||||||||||||||||||||||||||||||||||||||||||||||||||||||||||||||||||||||||||||||||||||||||||||||||||||||||||||||||||||||||||||||||||||||||||||||||||||||||||||||||||||||||||||||||||||||||
Oncogene 1 | Significant driver gene in | |||||||||||||||||||||||||||||||||||||||||||||||||||||||||||||||||||||||||||||||||||||||||||||||||||||||||||||||||||||||||||||||||||||||||||||||||||||||||||||||||||||||||||||||||||||||||||||||||||||||||||||||||||||||||||||||||||||||||||||||||||||||||||||||||||||||||||||||||||||||||||||||||||||||||||||||||||||||||
| cf) number; DB name 1 Oncogene; http://nar.oxfordjournals.org/content/35/suppl_1/D721.long, 2 Tumor Suppressor gene; https://bioinfo.uth.edu/TSGene/, 3 Cancer Gene Census; http://www.nature.com/nrc/journal/v4/n3/abs/nrc1299.html, 4 CancerGenes; http://nar.oxfordjournals.org/content/35/suppl_1/D721.long, 5 Network of Cancer Gene; http://ncg.kcl.ac.uk/index.php, 1Therapeutic Vulnerabilities in Cancer; http://cbio.mskcc.org/cancergenomics/statius/ |
| REACTOME_METABOLISM_OF_VITAMINS_AND_COFACTORS | |
| OMIM | |
| Orphanet | |
| Disease | KEGG Disease: THTPA |
| MedGen: THTPA (Human Medical Genetics with Condition) | |
| ClinVar: THTPA | |
| Phenotype | MGI: THTPA (International Mouse Phenotyping Consortium) |
| PhenomicDB: THTPA | |
| Mutations for THTPA |
| * Under tables are showing count per each tissue to give us broad intuition about tissue specific mutation patterns.You can go to the detailed page for each mutation database's web site. |
| There's no structural variation information in COSMIC data for this gene. |
| * From mRNA Sanger sequences, Chitars2.0 arranged chimeric transcripts. This table shows THTPA related fusion information. |
| ID | Head Gene | Tail Gene | Accession | Gene_a | qStart_a | qEnd_a | Chromosome_a | tStart_a | tEnd_a | Gene_a | qStart_a | qEnd_a | Chromosome_a | tStart_a | tEnd_a |
| BF960308 | DSCAML1 | 35 | 173 | 11 | 117362891 | 117363029 | THTPA | 164 | 301 | 14 | 24028052 | 24028189 | |
| BI036406 | MAN1C1 | 14 | 123 | 1 | 26034333 | 26034445 | THTPA | 119 | 323 | 14 | 24026315 | 24026519 | |
| BQ365373 | THTPA | 12 | 210 | 14 | 24025449 | 24027998 | AP1G2 | 205 | 337 | 14 | 24033993 | 24034125 | |
| Top |
| Mutation type/ Tissue ID | brca | cns | cerv | endome | haematopo | kidn | Lintest | liver | lung | ns | ovary | pancre | prost | skin | stoma | thyro | urina | |||
| Total # sample | 1 | |||||||||||||||||||
| GAIN (# sample) | 1 | |||||||||||||||||||
| LOSS (# sample) |
| cf) Tissue ID; Tissue type (1; Breast, 2; Central_nervous_system, 3; Cervix, 4; Endometrium, 5; Haematopoietic_and_lymphoid_tissue, 6; Kidney, 7; Large_intestine, 8; Liver, 9; Lung, 10; NS, 11; Ovary, 12; Pancreas, 13; Prostate, 14; Skin, 15; Stomach, 16; Thyroid, 17; Urinary_tract) |
| Top |
|
 |
| Top |
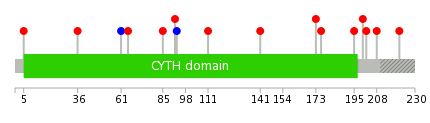
| Stat. for Non-Synonymous SNVs (# total SNVs=8) | (# total SNVs=2) |
 |  |
(# total SNVs=0) | (# total SNVs=0) |
| Top |
| * When you move the cursor on each content, you can see more deailed mutation information on the Tooltip. Those are primary_site,primary_histology,mutation(aa),pubmedID. |
| GRCh37 position | Mutation(aa) | Unique sampleID count |
| chr14:24026483-24026483 | p.E173Q | 1 |
| chr14:24026493-24026493 | p.H176R | 1 |
| chr14:24025980-24025980 | p.L5S | 1 |
| chr14:24027939-24027939 | p.I195F | 1 |
| chr14:24026073-24026073 | p.R36Q | 1 |
| chr14:24027955-24027955 | p.R200H | 1 |
| chr14:24026149-24026149 | p.G61G | 1 |
| chr14:24027961-24027961 | p.R202Q | 1 |
| chr14:24026160-24026160 | p.K65R | 1 |
| chr14:24027979-24027979 | p.R208H | 1 |
| Top |
|
 |
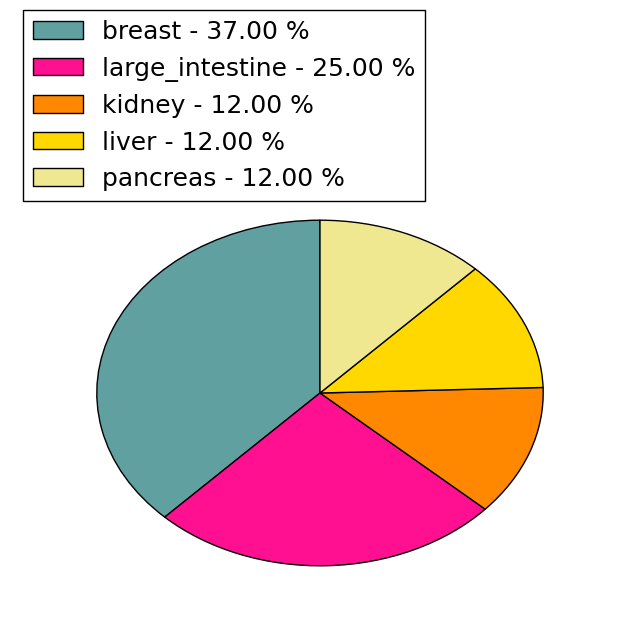
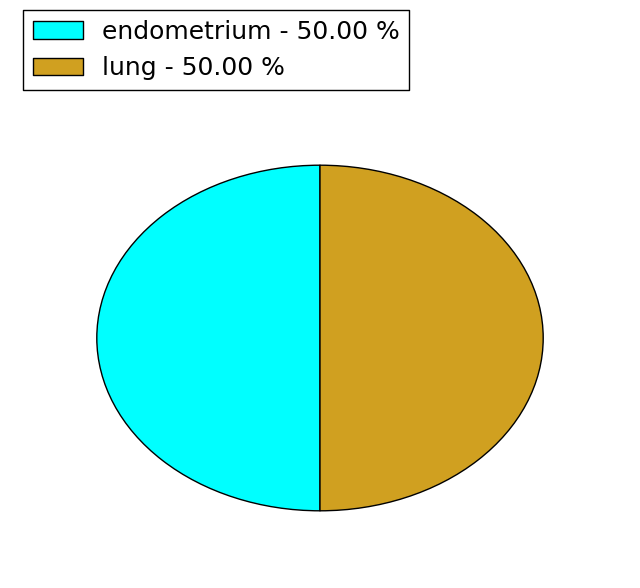
| Point Mutation/ Tissue ID | 1 | 2 | 3 | 4 | 5 | 6 | 7 | 8 | 9 | 10 | 11 | 12 | 13 | 14 | 15 | 16 | 17 | 18 | 19 | 20 |
| # sample | 1 | 1 | 1 | 1 | 2 | 1 | 1 | |||||||||||||
| # mutation | 1 | 1 | 1 | 1 | 2 | 1 | 1 | |||||||||||||
| nonsynonymous SNV | 1 | 1 | 1 | 1 | 2 | 1 | ||||||||||||||
| synonymous SNV | 1 |
| cf) Tissue ID; Tissue type (1; BLCA[Bladder Urothelial Carcinoma], 2; BRCA[Breast invasive carcinoma], 3; CESC[Cervical squamous cell carcinoma and endocervical adenocarcinoma], 4; COAD[Colon adenocarcinoma], 5; GBM[Glioblastoma multiforme], 6; Glioma Low Grade, 7; HNSC[Head and Neck squamous cell carcinoma], 8; KICH[Kidney Chromophobe], 9; KIRC[Kidney renal clear cell carcinoma], 10; KIRP[Kidney renal papillary cell carcinoma], 11; LAML[Acute Myeloid Leukemia], 12; LUAD[Lung adenocarcinoma], 13; LUSC[Lung squamous cell carcinoma], 14; OV[Ovarian serous cystadenocarcinoma ], 15; PAAD[Pancreatic adenocarcinoma], 16; PRAD[Prostate adenocarcinoma], 17; SKCM[Skin Cutaneous Melanoma], 18:STAD[Stomach adenocarcinoma], 19:THCA[Thyroid carcinoma], 20:UCEC[Uterine Corpus Endometrial Carcinoma]) |
| Top |
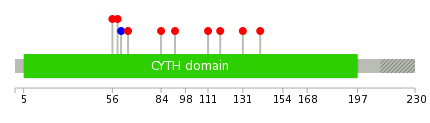
| * We represented just top 10 SNVs. When you move the cursor on each content, you can see more deailed mutation information on the Tooltip. Those are primary_site, primary_histology, mutation(aa), pubmedID. |
| Genomic Position | Mutation(aa) | Unique sampleID count |
| chr14:24028017 | p.R56Q,THTPA | 1 |
| chr14:24026133 | p.D59Y,THTPA | 1 |
| chr14:24026141 | p.G61G,THTPA | 1 |
| chr14:24026149 | p.K65R,THTPA | 1 |
| chr14:24026160 | p.A84T,THTPA | 1 |
| chr14:24026216 | p.L92P,THTPA | 1 |
| chr14:24026241 | p.G111D,THTPA | 1 |
| chr14:24026298 | p.Q141E,THTPA | 1 |
| chr14:24026387 | p.R118H,THTPA | 1 |
| chr14:24027979 | p.E131K,THTPA | 1 |
| * Copy number data were extracted from TCGA using R package TCGA-Assembler. The URLs of all public data files on TCGA DCC data server were gathered on Jan-05-2015. Function ProcessCNAData in TCGA-Assembler package was used to obtain gene-level copy number value which is calculated as the average copy number of the genomic region of a gene. |
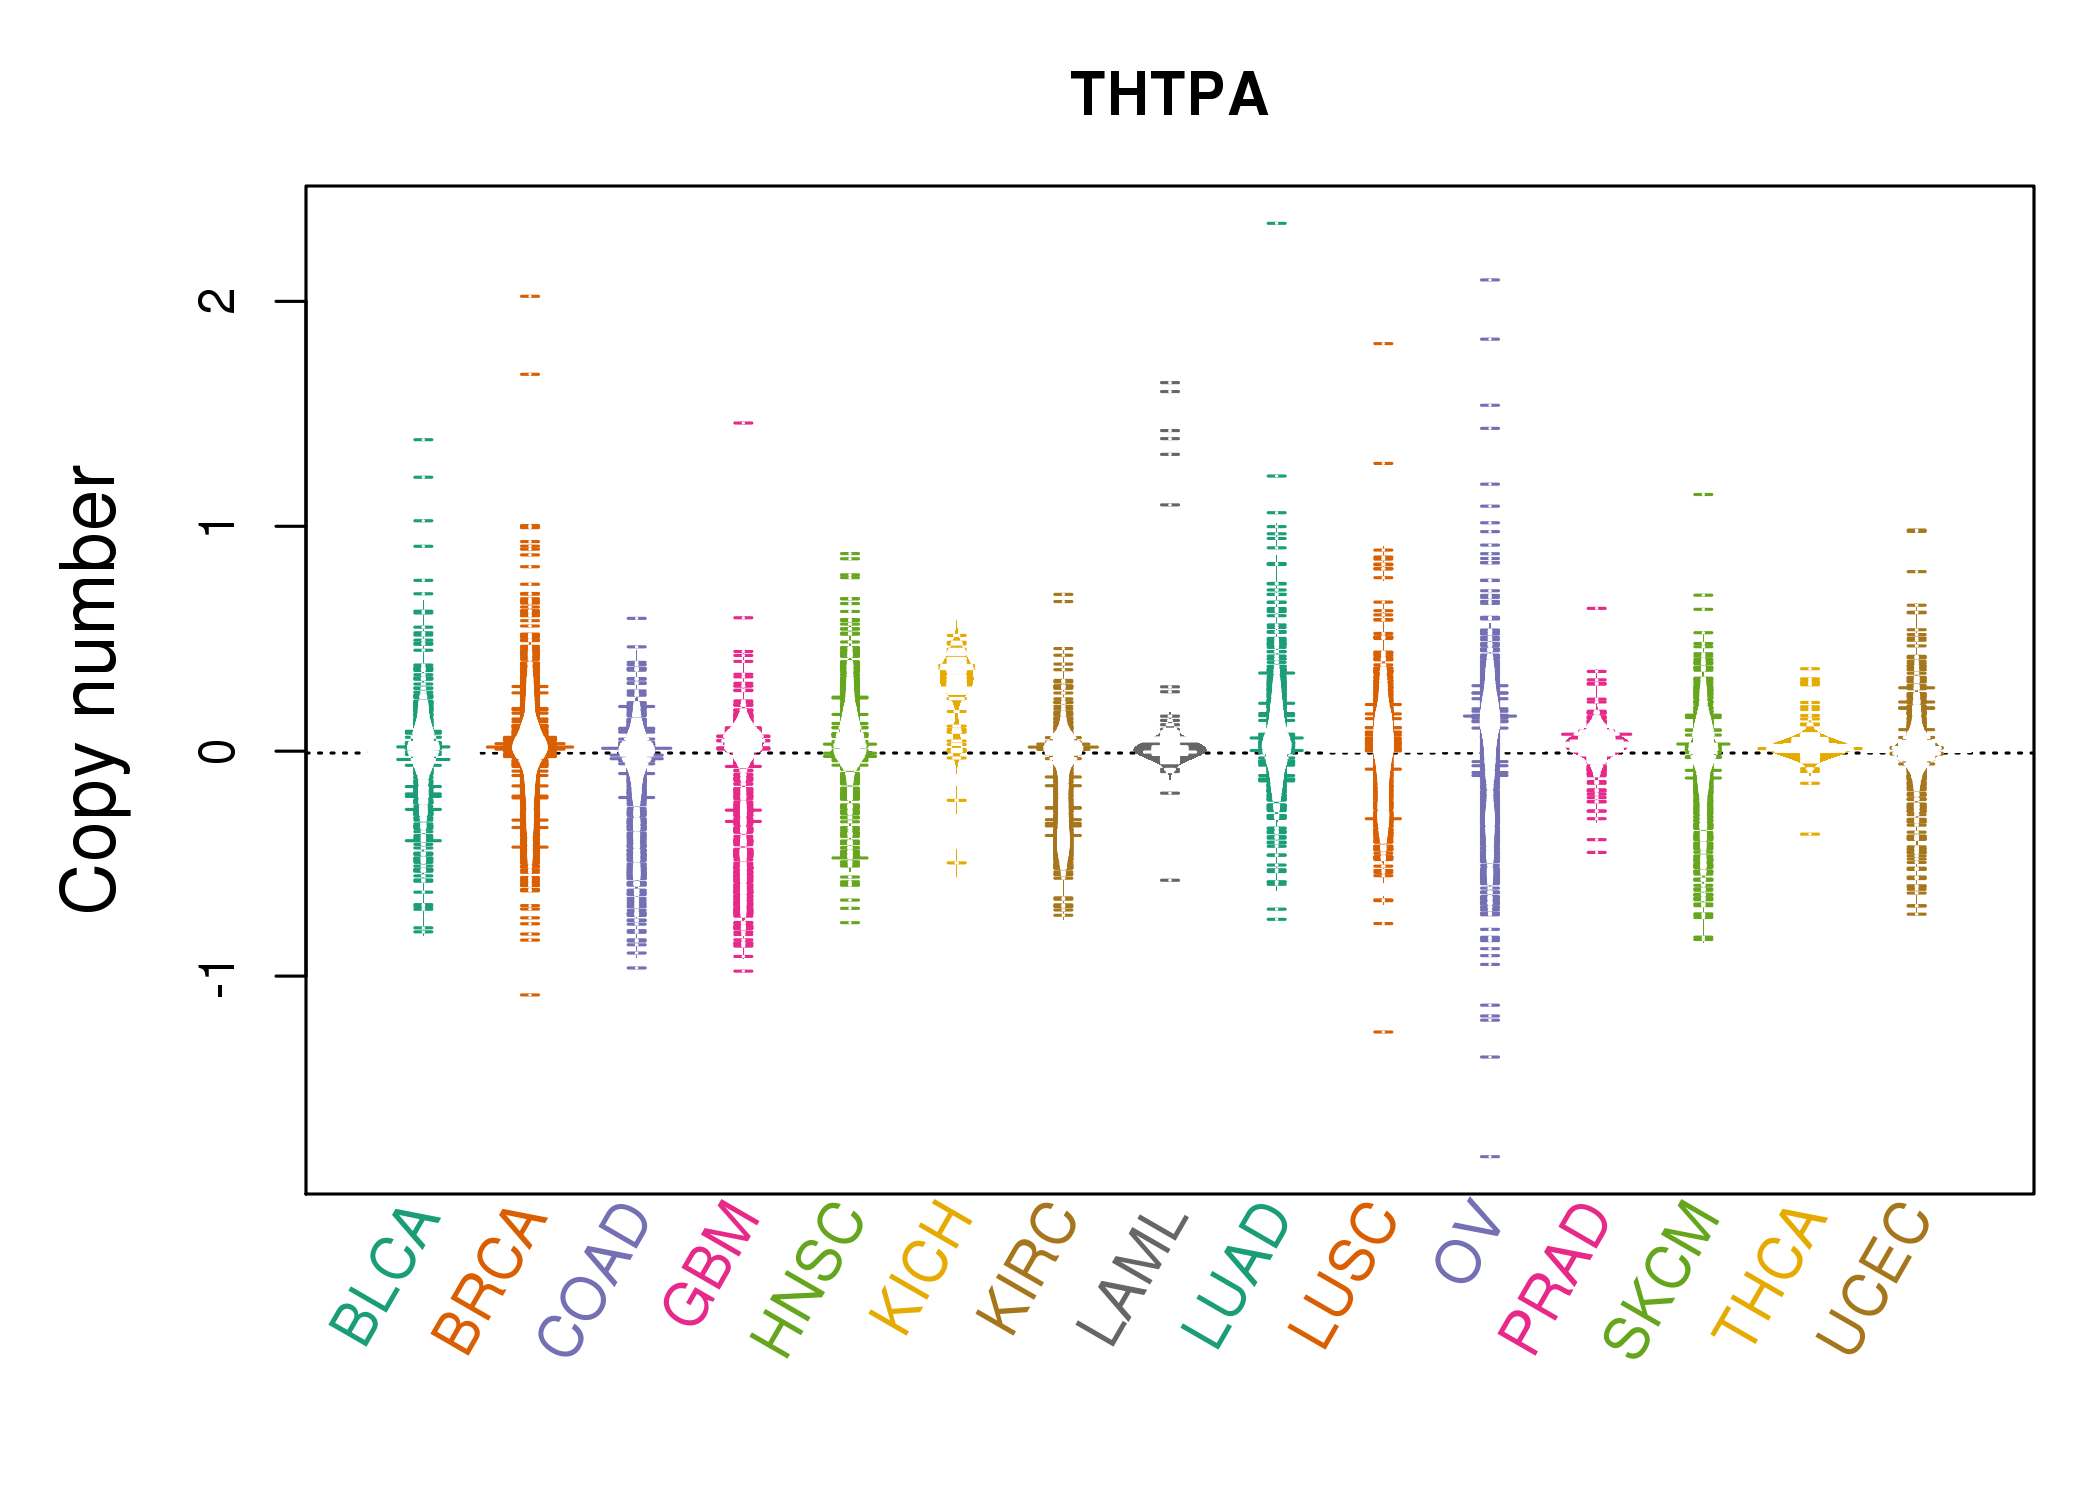 |
| cf) Tissue ID[Tissue type]: BLCA[Bladder Urothelial Carcinoma], BRCA[Breast invasive carcinoma], CESC[Cervical squamous cell carcinoma and endocervical adenocarcinoma], COAD[Colon adenocarcinoma], GBM[Glioblastoma multiforme], Glioma Low Grade, HNSC[Head and Neck squamous cell carcinoma], KICH[Kidney Chromophobe], KIRC[Kidney renal clear cell carcinoma], KIRP[Kidney renal papillary cell carcinoma], LAML[Acute Myeloid Leukemia], LUAD[Lung adenocarcinoma], LUSC[Lung squamous cell carcinoma], OV[Ovarian serous cystadenocarcinoma ], PAAD[Pancreatic adenocarcinoma], PRAD[Prostate adenocarcinoma], SKCM[Skin Cutaneous Melanoma], STAD[Stomach adenocarcinoma], THCA[Thyroid carcinoma], UCEC[Uterine Corpus Endometrial Carcinoma] |
| Top |
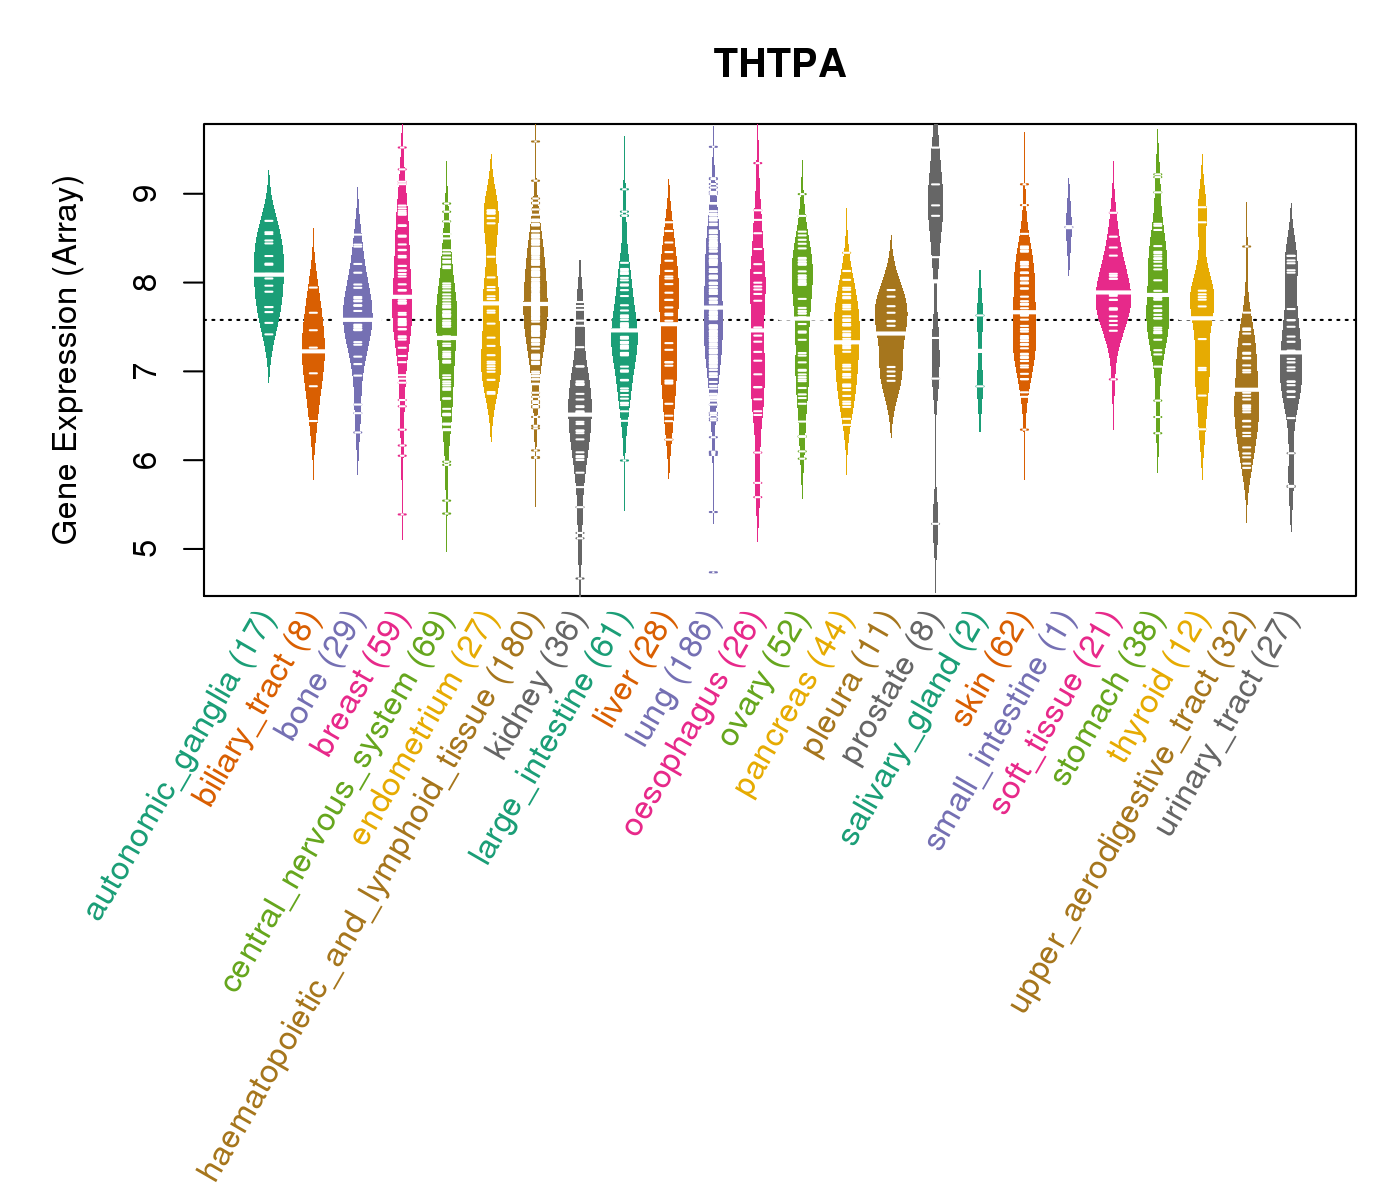
| Gene Expression for THTPA |
| * CCLE gene expression data were extracted from CCLE_Expression_Entrez_2012-10-18.res: Gene-centric RMA-normalized mRNA expression data. |
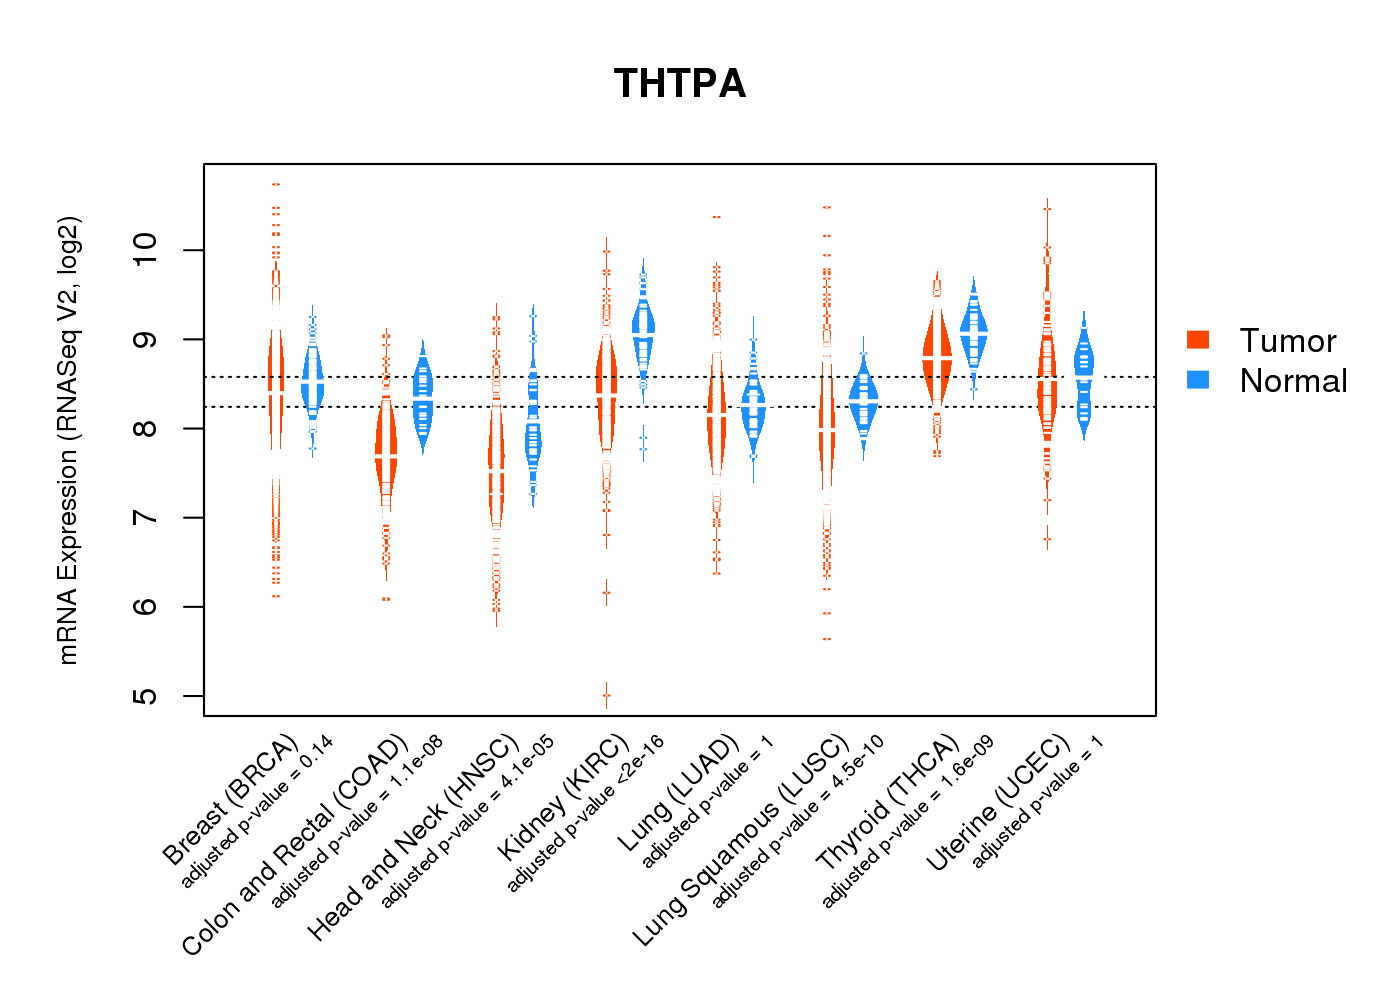
 |
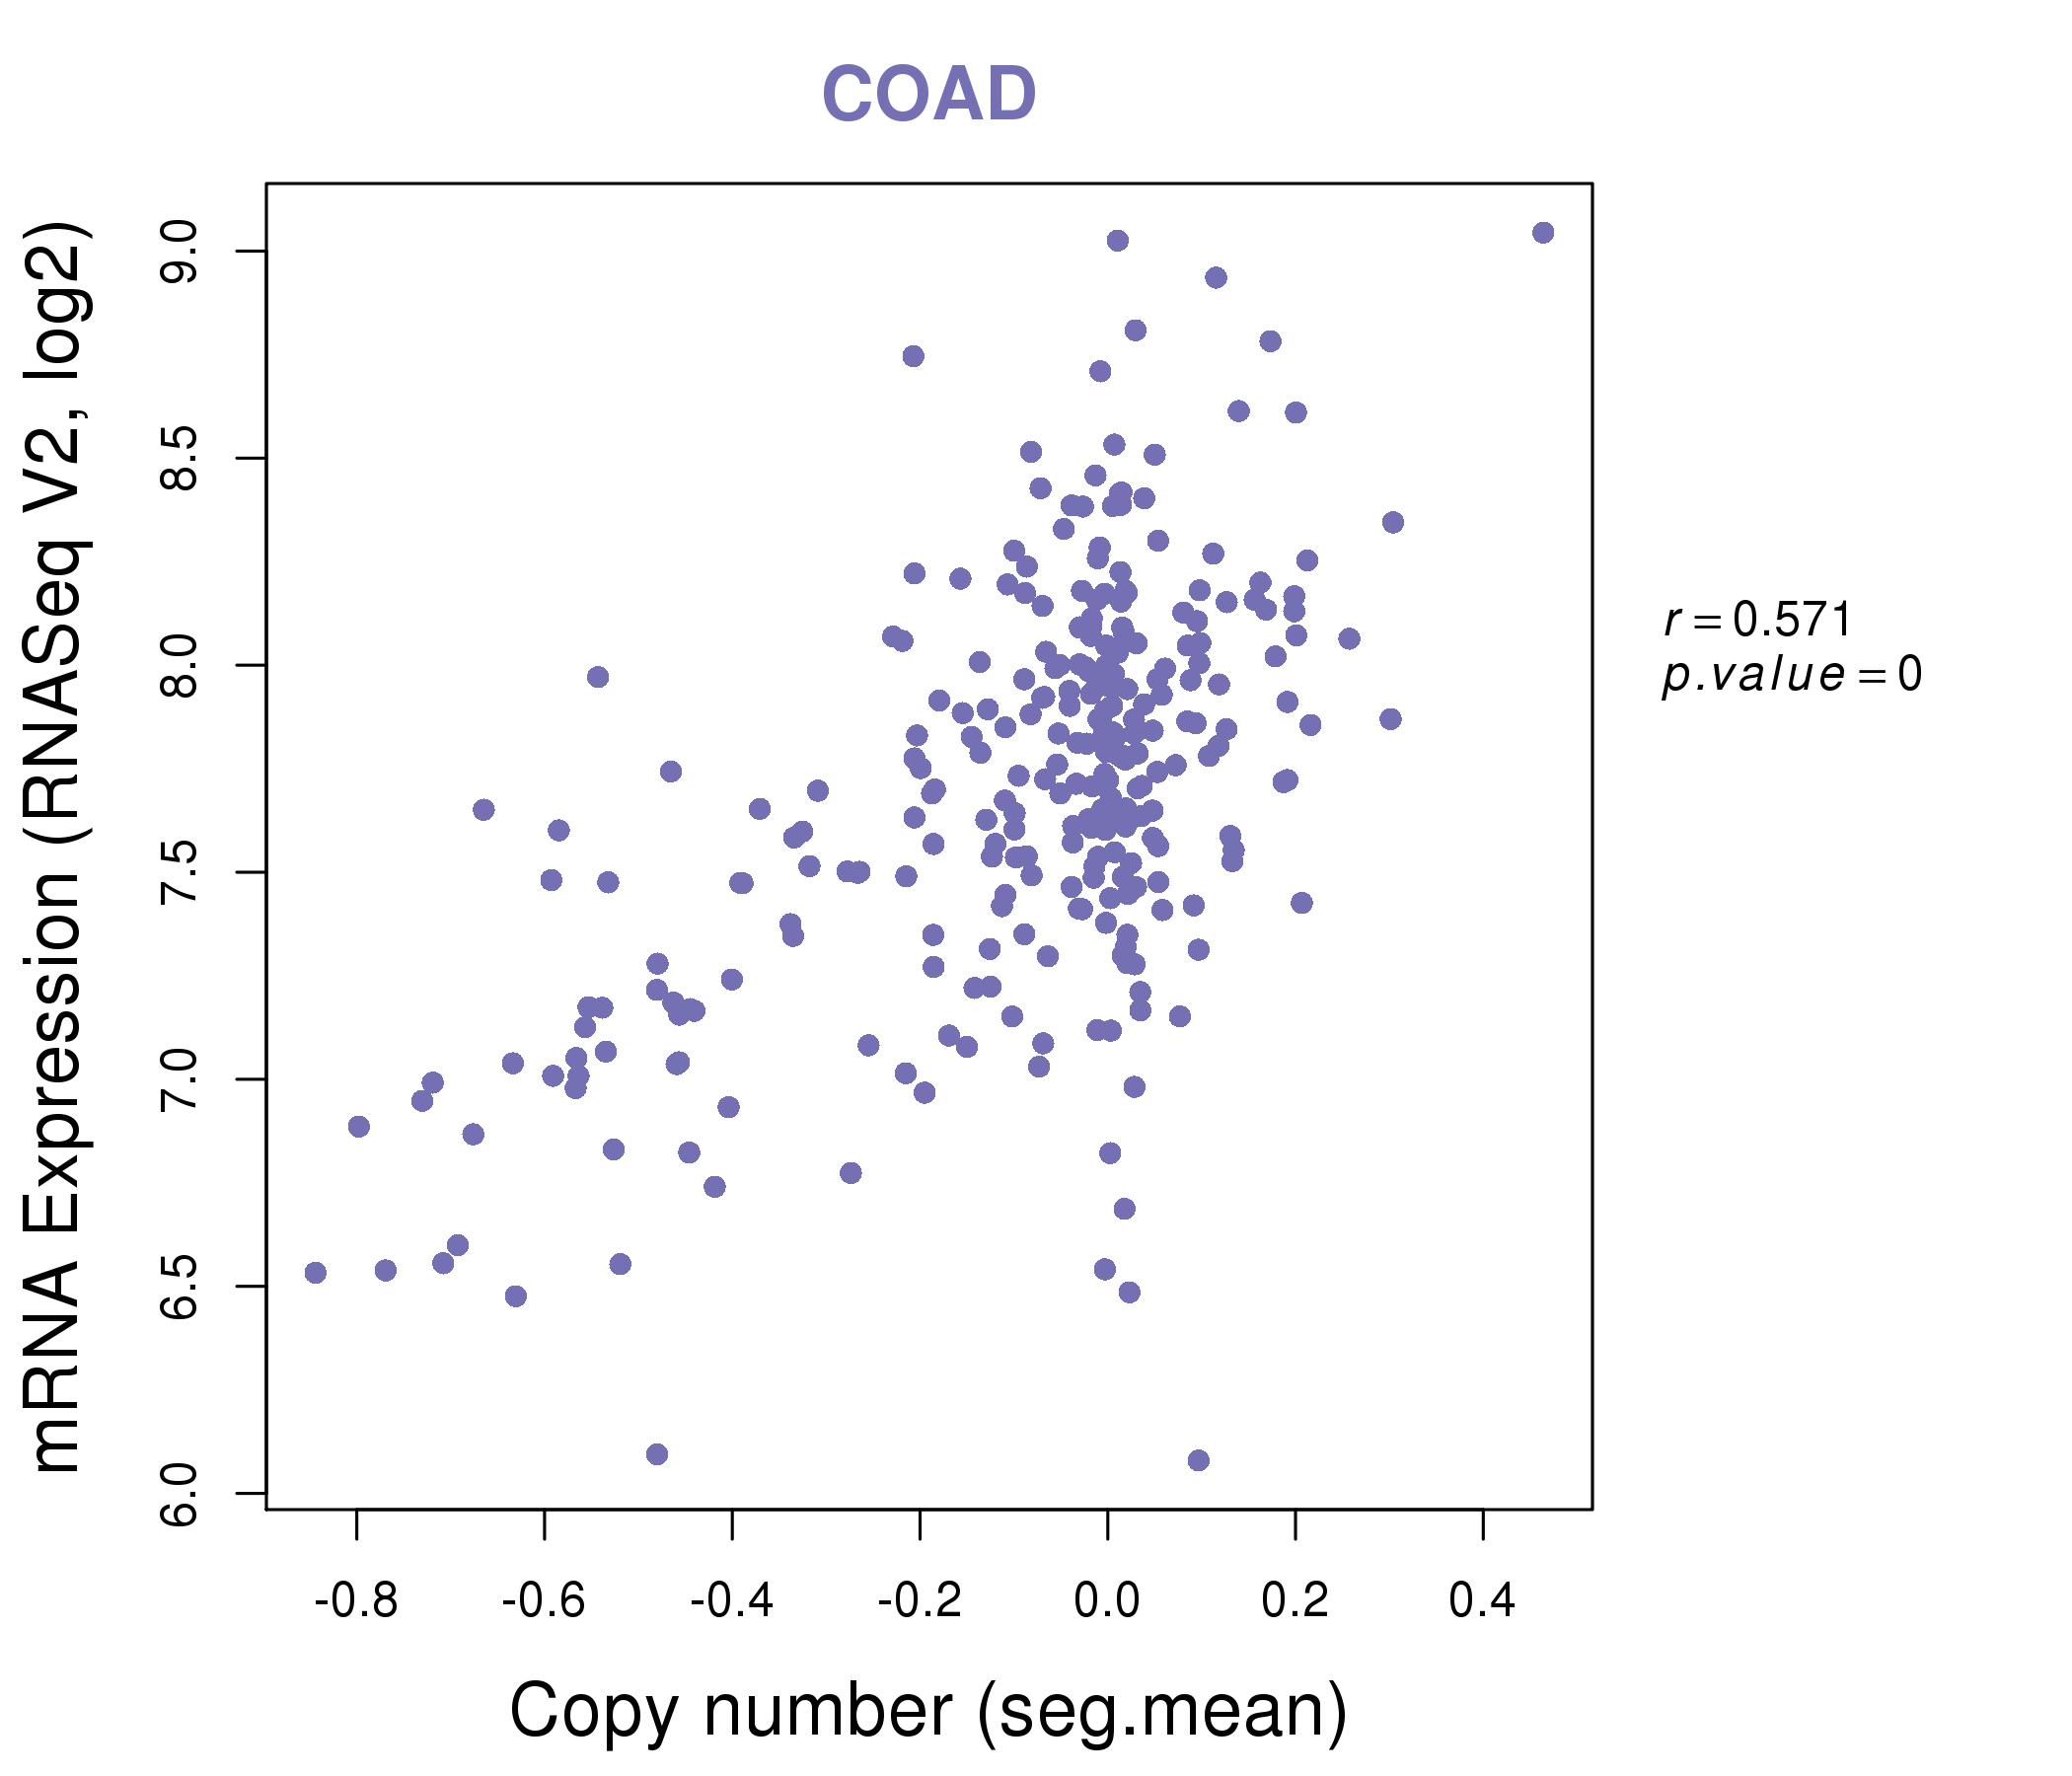
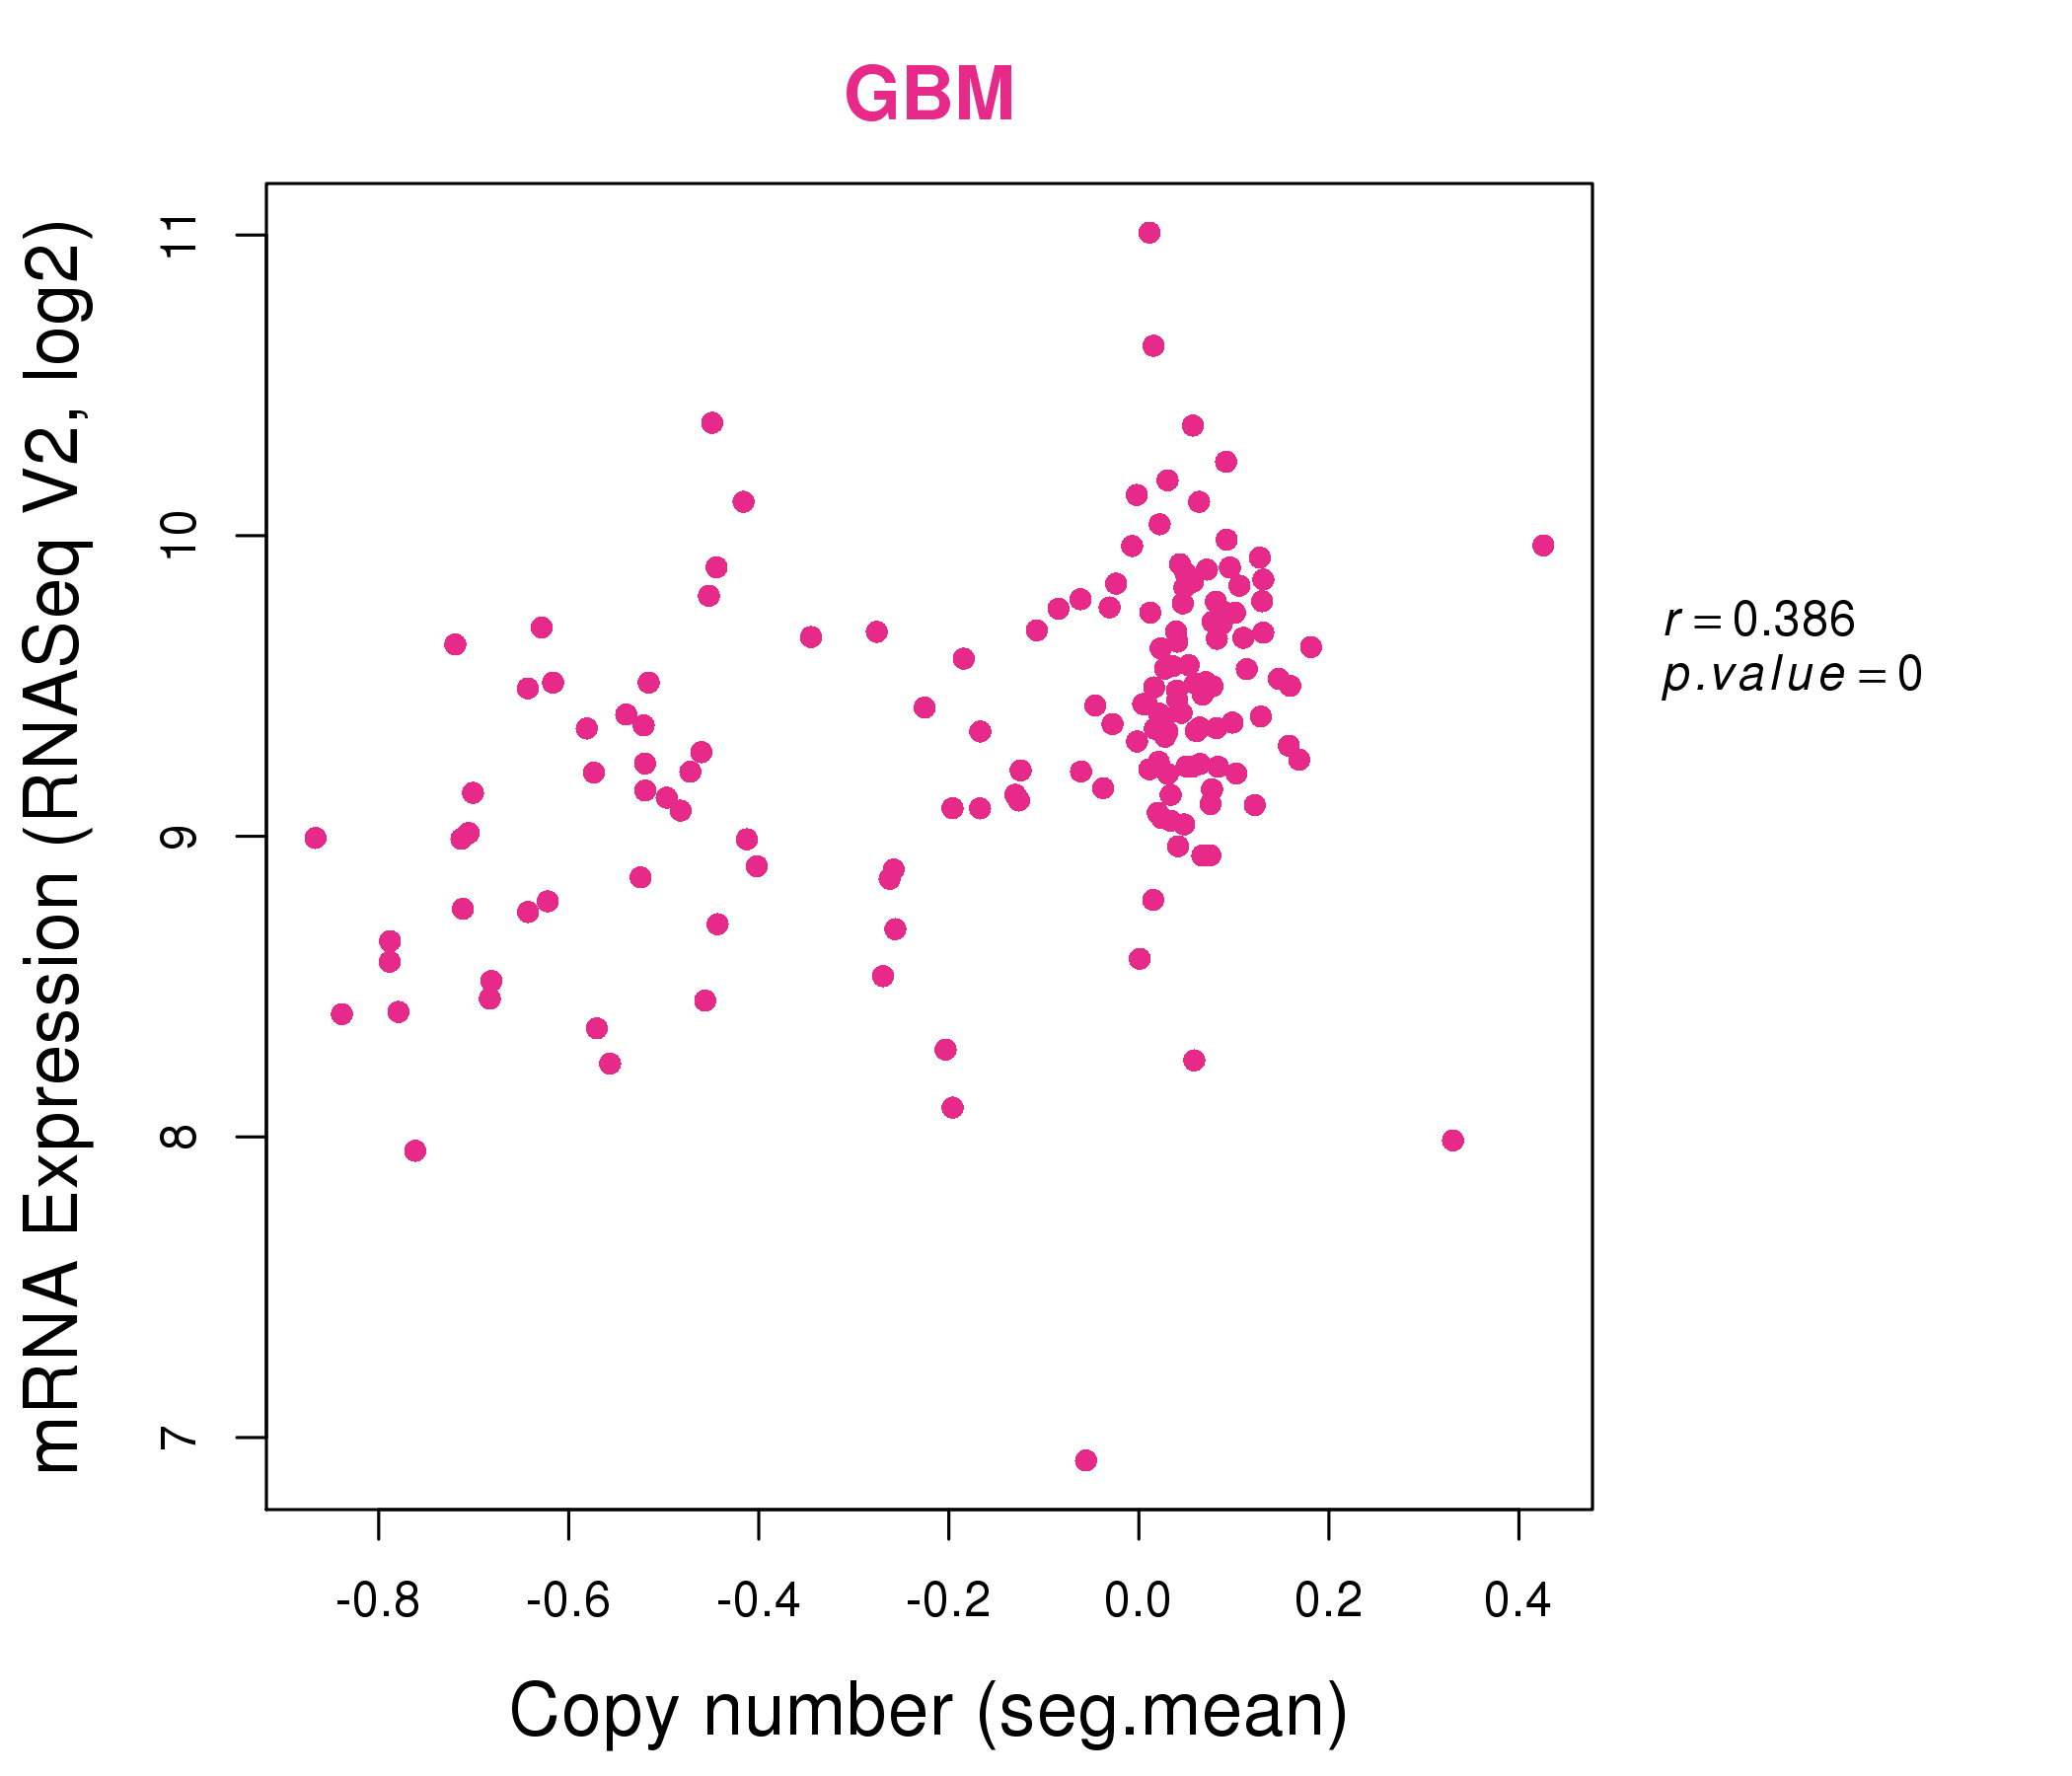
| * Normalized gene expression data of RNASeqV2 was extracted from TCGA using R package TCGA-Assembler. The URLs of all public data files on TCGA DCC data server were gathered at Jan-05-2015. Only eight cancer types have enough normal control samples for differential expression analysis. (t test, adjusted p<0.05 (using Benjamini-Hochberg FDR)) |
 |
| Top |
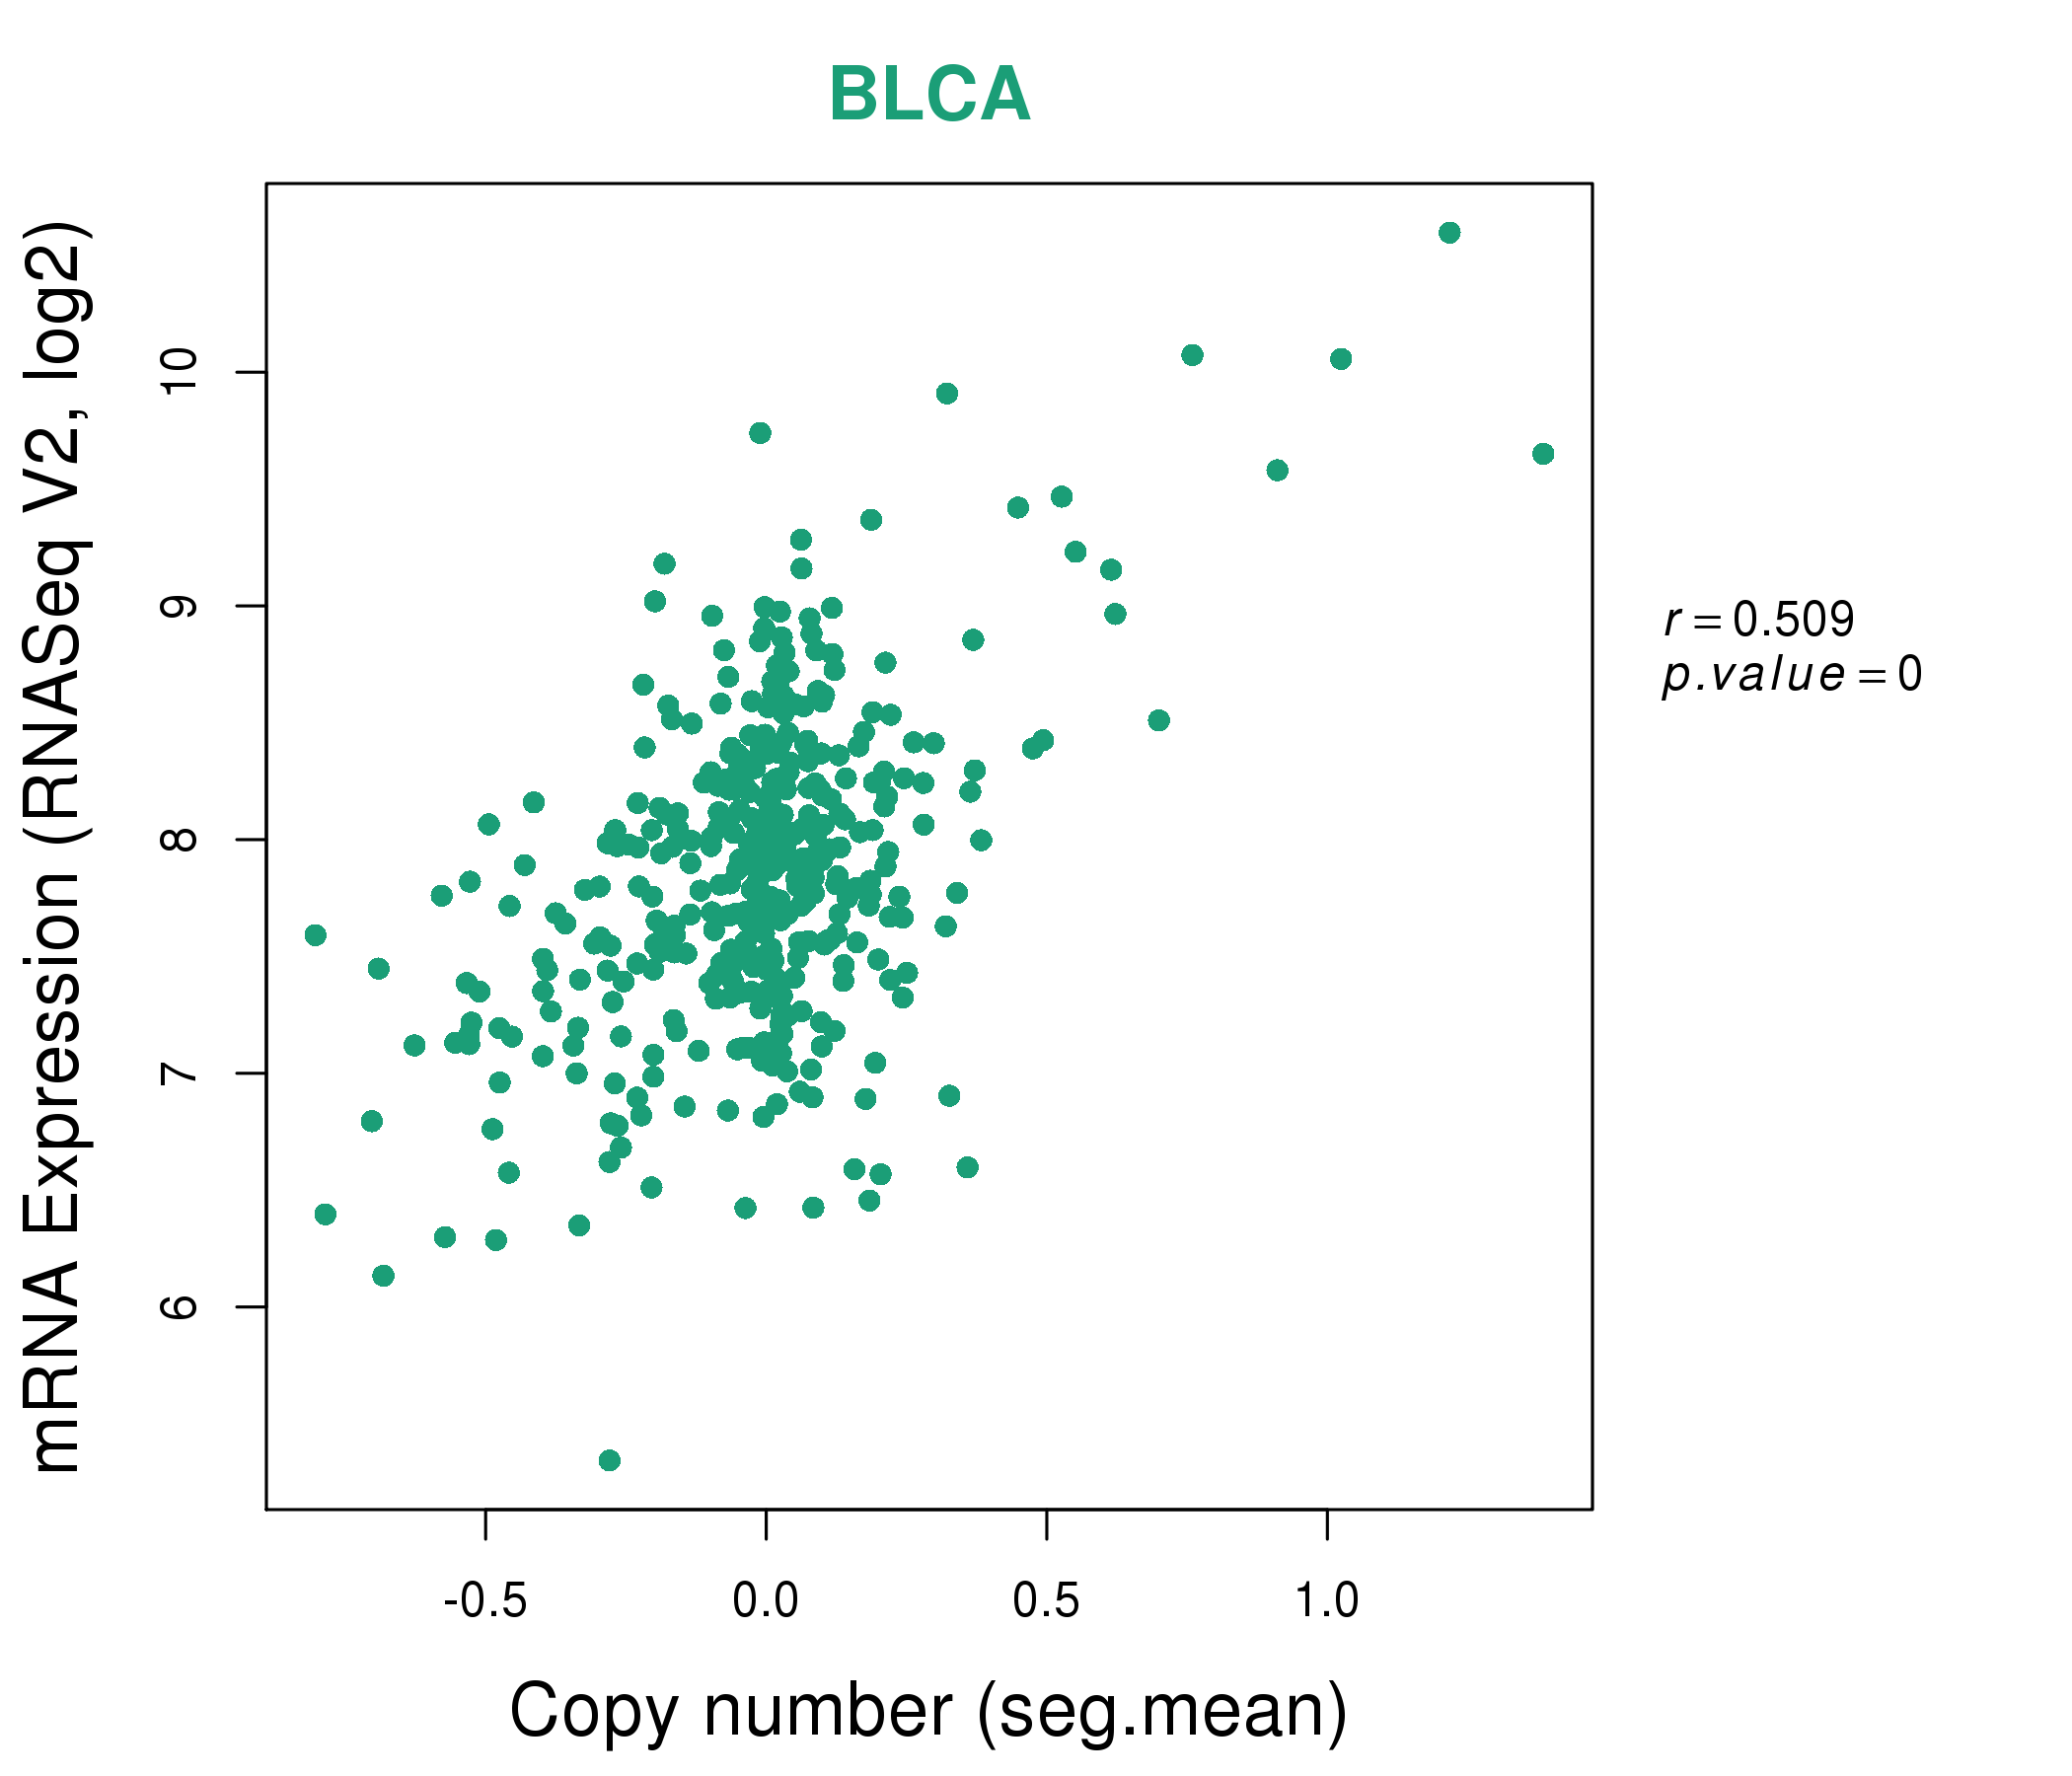
| * This plots show the correlation between CNV and gene expression. |
: Open all plots for all cancer types
 |
|
 |
|

| Top |
| Gene-Gene Network Information |
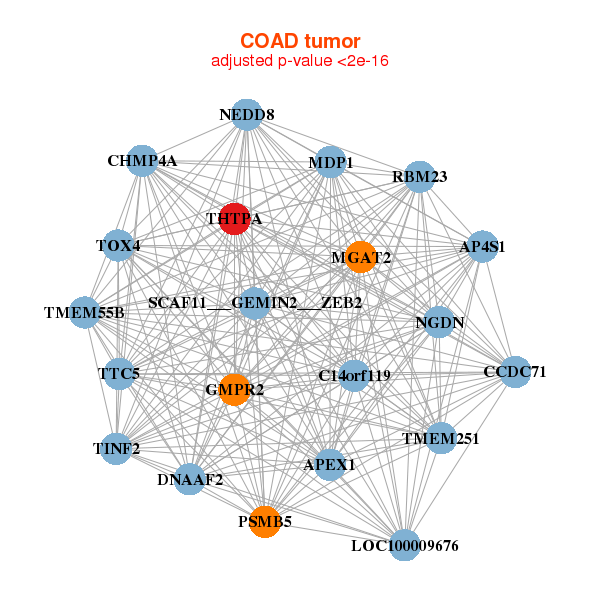
| * Co-Expression network figures were drawn using R package igraph. Only the top 20 genes with the highest correlations were shown. Red circle: input gene, orange circle: cell metabolism gene, sky circle: other gene |
: Open all plots for all cancer types
 |
|
| AP1G2,C14orf93,DCAF11,FBP1,GHDC,GMPR2,HAUS4, HOMEZ,HSD17B8,LRP10,MDP1,ZNF205-AS1,NEDD8,RAB17, RBM23,RNF31,SDR39U1,THTPA,TINF2,TM9SF1,WDR25 | AARS,ACAD9,ASCC2,BCAP31,CRELD1,GRHPR,HINT2, HOOK2,IFI27L1,ITFG3,KLHL22,LOC729991,MRPL24,NME4, POLR2L,PRR5,PSMD8,SNX17,THTPA,TST,UROD |
 |
|
| AP4S1,APEX1,DNAAF2,TMEM251,C14orf119,CCDC71,CHMP4A, GMPR2,LOC100009676,MDP1,MGAT2,NEDD8,NGDN,PSMB5, RBM23,SCAF11___GEMIN2___ZEB2,THTPA,TINF2,TMEM55B,TOX4,TTC5 | AIP,AMZ2,ARL2,BBS4,BCL7C,BOLA1,FAM216A, C1orf54,C6orf1,CAMLG,CUEDC2,MPV17,MRPL40,MYL6B, SNAPIN,SNRPN,THTPA,TMSB15B,TRMT112,UROD,ZNF32 |

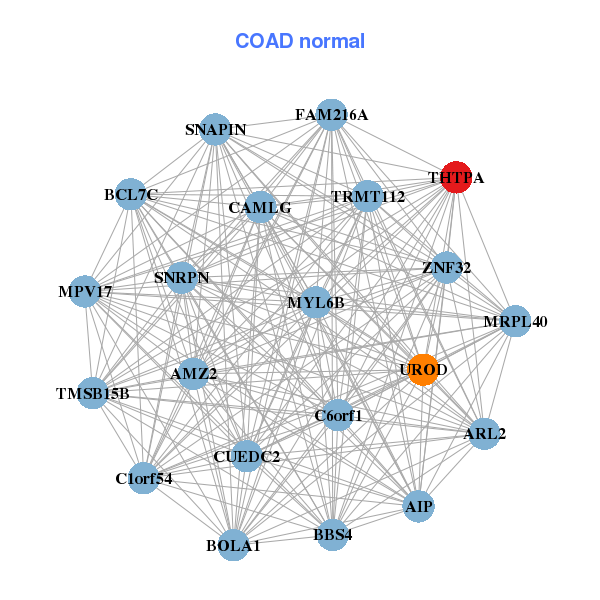
| * Co-Expression network figures were drawn using R package igraph. Only the top 20 genes with the highest correlations were shown. Red circle: input gene, orange circle: cell metabolism gene, sky circle: other gene |
: Open all plots for all cancer types
| Top |
: Open all interacting genes' information including KEGG pathway for all interacting genes from DAVID
| Top |
| Pharmacological Information for THTPA |
| There's no related Drug. |
| Top |
| Cross referenced IDs for THTPA |
| * We obtained these cross-references from Uniprot database. It covers 150 different DBs, 18 categories. http://www.uniprot.org/help/cross_references_section |
: Open all cross reference information
|
Copyright © 2016-Present - The Univsersity of Texas Health Science Center at Houston @ |