|
|||||||||||||||||||||||||||||||||||||||||||||||||||||||||||||||||||||||||||||||||||||||||||||||||||||||||||||||||||||||||||||||||||||||||||||||||||||||||||||||||||||||||||||||||||||||||||||||||||||||||||||||||||||||||||||||||||||||||||||||||||||||||||||||||||||||||||||||||||||||||||||||||||||||||||||||||||||||||||||||||||||||||||||
| |
| Phenotypic Information (metabolism pathway, cancer, disease, phenome) |
| |
| |
| Gene-Gene Network Information: Co-Expression Network, Interacting Genes & KEGG |
| |
|


| Gene Summary for PLA2G7 |
| Basic gene info. | Gene symbol | PLA2G7 |
| Gene name | phospholipase A2, group VII (platelet-activating factor acetylhydrolase, plasma) | |
| Synonyms | LDL-PLA2|LP-PLA2|PAFAD|PAFAH | |
| Cytomap | UCSC genome browser: 6p21.2-p12 | |
| Genomic location | chr6 :46672052-46703151 | |
| Type of gene | protein-coding | |
| RefGenes | NM_001168357.1, NM_005084.3, | |
| Ensembl id | ENSG00000146070 | |
| Description | 1-alkyl-2-acetylglycerophosphocholine esterase2-acetyl-1-alkylglycerophosphocholine esteraseLDL-PLA(2)LDL-associated phospholipase A2PAF 2-acylhydrolasePAF acetylhydrolasegVIIA-PLA2group-VIIA phospholipase A2lipoprotein-associated phospholipase A2 | |
| Modification date | 20141207 | |
| dbXrefs | MIM : 601690 | |
| HGNC : HGNC | ||
| Ensembl : ENSG00000146070 | ||
| HPRD : 03407 | ||
| Vega : OTTHUMG00000014789 | ||
| Protein | UniProt: go to UniProt's Cross Reference DB Table | |
| Expression | CleanEX: HS_PLA2G7 | |
| BioGPS: 7941 | ||
| Gene Expression Atlas: ENSG00000146070 | ||
| The Human Protein Atlas: ENSG00000146070 | ||
| Pathway | NCI Pathway Interaction Database: PLA2G7 | |
| KEGG: PLA2G7 | ||
| REACTOME: PLA2G7 | ||
| ConsensusPathDB | ||
| Pathway Commons: PLA2G7 | ||
| Metabolism | MetaCyc: PLA2G7 | |
| HUMANCyc: PLA2G7 | ||
| Regulation | Ensembl's Regulation: ENSG00000146070 | |
| miRBase: chr6 :46,672,052-46,703,151 | ||
| TargetScan: NM_001168357 | ||
| cisRED: ENSG00000146070 | ||
| Context | iHOP: PLA2G7 | |
| cancer metabolism search in PubMed: PLA2G7 | ||
| UCL Cancer Institute: PLA2G7 | ||
| Assigned class in ccmGDB | C | |
| Top |
| Phenotypic Information for PLA2G7(metabolism pathway, cancer, disease, phenome) |
| Cancer | CGAP: PLA2G7 |
| Familial Cancer Database: PLA2G7 | |
| * This gene is included in those cancer gene databases. |
|
|
|
|
|
| . | |||||||||||||||||||||||||||||||||||||||||||||||||||||||||||||||||||||||||||||||||||||||||||||||||||||||||||||||||||||||||||||||||||||||||||||||||||||||||||||||||||||||||||||||||||||||||||||||||||||||||||||||||||||||||||||||||||||||||||||||||||||||||||||||||||||||||||||||||||||||||||||||||||||||||||||||||||||||||||||||||||||||
Oncogene 1 | Significant driver gene in | ||||||||||||||||||||||||||||||||||||||||||||||||||||||||||||||||||||||||||||||||||||||||||||||||||||||||||||||||||||||||||||||||||||||||||||||||||||||||||||||||||||||||||||||||||||||||||||||||||||||||||||||||||||||||||||||||||||||||||||||||||||||||||||||||||||||||||||||||||||||||||||||||||||||||||||||||||||||||||||||||||||||||||||
| cf) number; DB name 1 Oncogene; http://nar.oxfordjournals.org/content/35/suppl_1/D721.long, 2 Tumor Suppressor gene; https://bioinfo.uth.edu/TSGene/, 3 Cancer Gene Census; http://www.nature.com/nrc/journal/v4/n3/abs/nrc1299.html, 4 CancerGenes; http://nar.oxfordjournals.org/content/35/suppl_1/D721.long, 5 Network of Cancer Gene; http://ncg.kcl.ac.uk/index.php, 1Therapeutic Vulnerabilities in Cancer; http://cbio.mskcc.org/cancergenomics/statius/ |
| Nat Rev Drug Discovery, 2013, 12: 829, doi: 10.1038/nrd4145 | |
| OMIM | |
| Orphanet | |
| Disease | KEGG Disease: PLA2G7 |
| MedGen: PLA2G7 (Human Medical Genetics with Condition) | |
| ClinVar: PLA2G7 | |
| Phenotype | MGI: PLA2G7 (International Mouse Phenotyping Consortium) |
| PhenomicDB: PLA2G7 | |
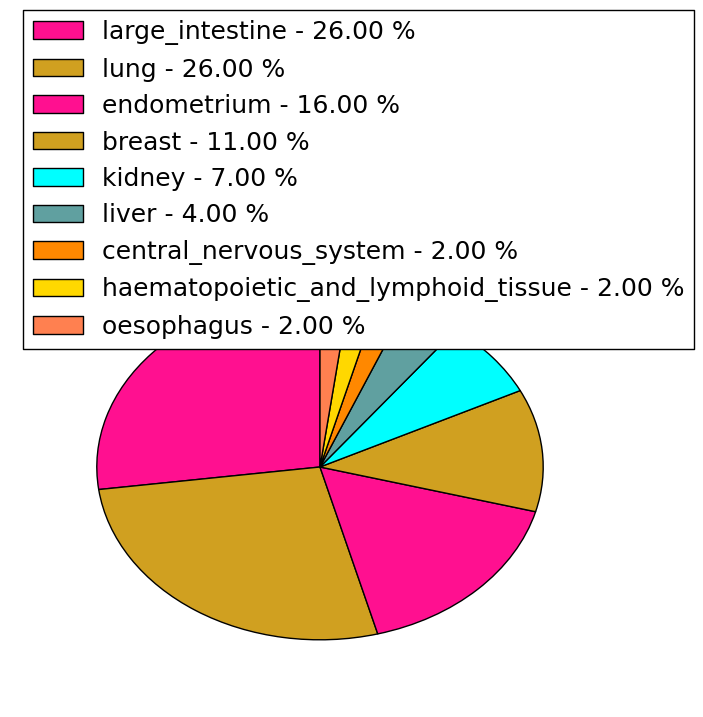
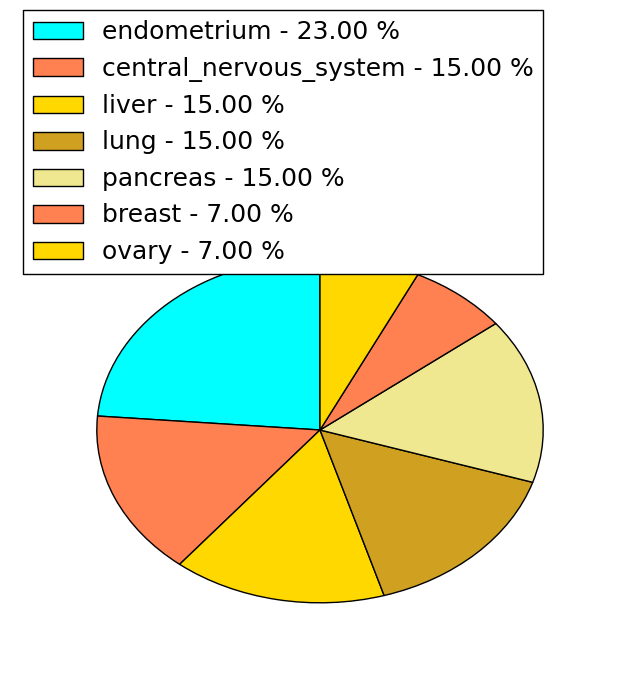
| Mutations for PLA2G7 |
| * Under tables are showing count per each tissue to give us broad intuition about tissue specific mutation patterns.You can go to the detailed page for each mutation database's web site. |
| There's no structural variation information in COSMIC data for this gene. |
| * From mRNA Sanger sequences, Chitars2.0 arranged chimeric transcripts. This table shows PLA2G7 related fusion information. |
| ID | Head Gene | Tail Gene | Accession | Gene_a | qStart_a | qEnd_a | Chromosome_a | tStart_a | tEnd_a | Gene_a | qStart_a | qEnd_a | Chromosome_a | tStart_a | tEnd_a |
| Top |
| Mutation type/ Tissue ID | brca | cns | cerv | endome | haematopo | kidn | Lintest | liver | lung | ns | ovary | pancre | prost | skin | stoma | thyro | urina | |||
| Total # sample | 1 | |||||||||||||||||||
| GAIN (# sample) | 1 | |||||||||||||||||||
| LOSS (# sample) | 1 |
| cf) Tissue ID; Tissue type (1; Breast, 2; Central_nervous_system, 3; Cervix, 4; Endometrium, 5; Haematopoietic_and_lymphoid_tissue, 6; Kidney, 7; Large_intestine, 8; Liver, 9; Lung, 10; NS, 11; Ovary, 12; Pancreas, 13; Prostate, 14; Skin, 15; Stomach, 16; Thyroid, 17; Urinary_tract) |
| Top |
|
 |
| Top |
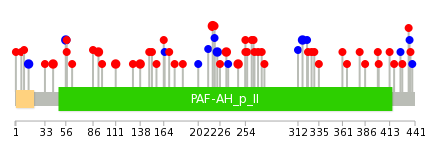
| Stat. for Non-Synonymous SNVs (# total SNVs=42) | (# total SNVs=13) |
 |  |
(# total SNVs=0) | (# total SNVs=0) |
| Top |
| * When you move the cursor on each content, you can see more deailed mutation information on the Tooltip. Those are primary_site,primary_histology,mutation(aa),pubmedID. |
| GRCh37 position | Mutation(aa) | Unique sampleID count |
| chr6:46679243-46679243 | p.R218Q | 3 |
| chr6:46684222-46684222 | p.R92H | 2 |
| chr6:46678392-46678392 | p.R223R | 2 |
| chr6:46675817-46675817 | p.I317I | 2 |
| chr6:46682255-46682255 | p.L138V | 2 |
| chr6:46684775-46684775 | p.I56I | 2 |
| chr6:46679259-46679259 | p.E213* | 2 |
| chr6:46678321-46678321 | p.K246N | 2 |
| chr6:46684819-46684819 | p.I42V | 2 |
| chr6:46684166-46684166 | p.L111I | 2 |
| Top |
|
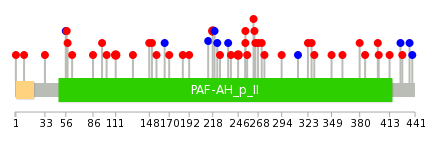 |
| Point Mutation/ Tissue ID | 1 | 2 | 3 | 4 | 5 | 6 | 7 | 8 | 9 | 10 | 11 | 12 | 13 | 14 | 15 | 16 | 17 | 18 | 19 | 20 |
| # sample | 3 | 2 | 7 | 1 | 2 | 2 | 10 | 2 | 9 | 5 | 8 | |||||||||
| # mutation | 3 | 3 | 8 | 1 | 2 | 2 | 11 | 2 | 9 | 5 | 9 | |||||||||
| nonsynonymous SNV | 3 | 2 | 8 | 2 | 2 | 10 | 1 | 7 | 4 | 6 | ||||||||||
| synonymous SNV | 1 | 1 | 1 | 1 | 2 | 1 | 3 |
| cf) Tissue ID; Tissue type (1; BLCA[Bladder Urothelial Carcinoma], 2; BRCA[Breast invasive carcinoma], 3; CESC[Cervical squamous cell carcinoma and endocervical adenocarcinoma], 4; COAD[Colon adenocarcinoma], 5; GBM[Glioblastoma multiforme], 6; Glioma Low Grade, 7; HNSC[Head and Neck squamous cell carcinoma], 8; KICH[Kidney Chromophobe], 9; KIRC[Kidney renal clear cell carcinoma], 10; KIRP[Kidney renal papillary cell carcinoma], 11; LAML[Acute Myeloid Leukemia], 12; LUAD[Lung adenocarcinoma], 13; LUSC[Lung squamous cell carcinoma], 14; OV[Ovarian serous cystadenocarcinoma ], 15; PAAD[Pancreatic adenocarcinoma], 16; PRAD[Prostate adenocarcinoma], 17; SKCM[Skin Cutaneous Melanoma], 18:STAD[Stomach adenocarcinoma], 19:THCA[Thyroid carcinoma], 20:UCEC[Uterine Corpus Endometrial Carcinoma]) |
| Top |
| * We represented just top 10 SNVs. When you move the cursor on each content, you can see more deailed mutation information on the Tooltip. Those are primary_site, primary_histology, mutation(aa), pubmedID. |
| Genomic Position | Mutation(aa) | Unique sampleID count |
| chr6:46678321 | p.K246N,PLA2G7 | 2 |
| chr6:46684166 | p.L111I,PLA2G7 | 2 |
| chr6:46679243 | p.R218Q,PLA2G7 | 2 |
| chr6:46675832 | p.E256K,PLA2G7 | 1 |
| chr6:46684770 | p.H151Y,PLA2G7 | 1 |
| chr6:46680050 | p.K400T,PLA2G7 | 1 |
| chr6:46672386 | p.D254G,PLA2G7 | 1 |
| chr6:46675888 | p.V148A,PLA2G7 | 1 |
| chr6:46684773 | p.K386T,PLA2G7 | 1 |
| chr6:46678347 | p.A380D,PLA2G7 | 1 |
| * Copy number data were extracted from TCGA using R package TCGA-Assembler. The URLs of all public data files on TCGA DCC data server were gathered on Jan-05-2015. Function ProcessCNAData in TCGA-Assembler package was used to obtain gene-level copy number value which is calculated as the average copy number of the genomic region of a gene. |
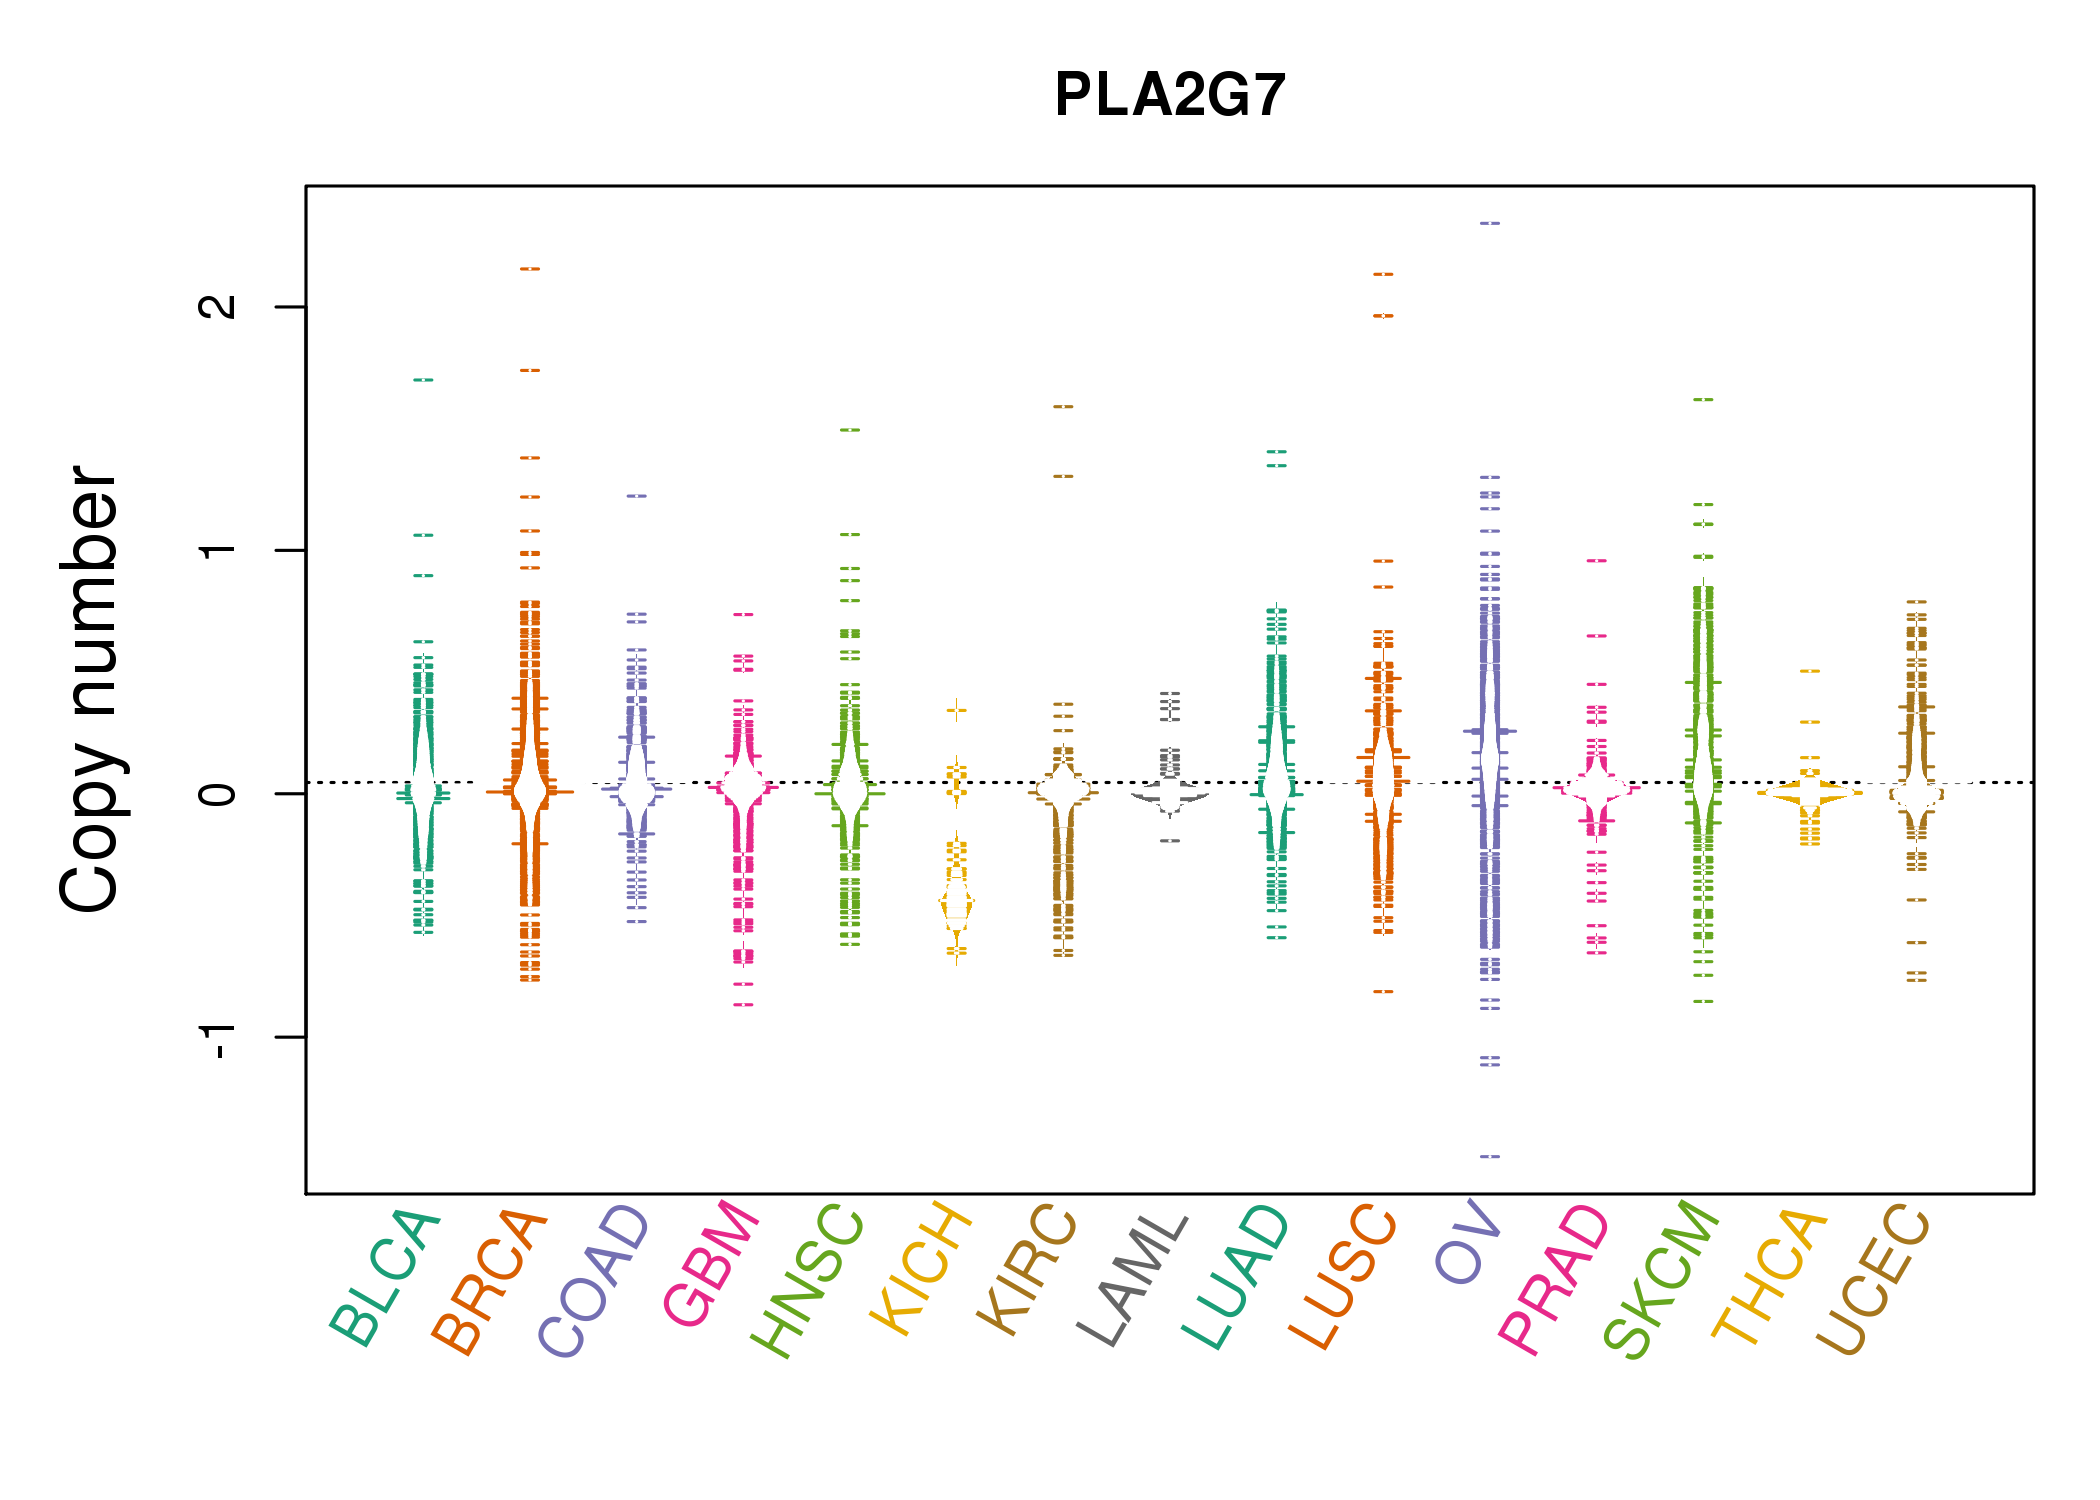 |
| cf) Tissue ID[Tissue type]: BLCA[Bladder Urothelial Carcinoma], BRCA[Breast invasive carcinoma], CESC[Cervical squamous cell carcinoma and endocervical adenocarcinoma], COAD[Colon adenocarcinoma], GBM[Glioblastoma multiforme], Glioma Low Grade, HNSC[Head and Neck squamous cell carcinoma], KICH[Kidney Chromophobe], KIRC[Kidney renal clear cell carcinoma], KIRP[Kidney renal papillary cell carcinoma], LAML[Acute Myeloid Leukemia], LUAD[Lung adenocarcinoma], LUSC[Lung squamous cell carcinoma], OV[Ovarian serous cystadenocarcinoma ], PAAD[Pancreatic adenocarcinoma], PRAD[Prostate adenocarcinoma], SKCM[Skin Cutaneous Melanoma], STAD[Stomach adenocarcinoma], THCA[Thyroid carcinoma], UCEC[Uterine Corpus Endometrial Carcinoma] |
| Top |
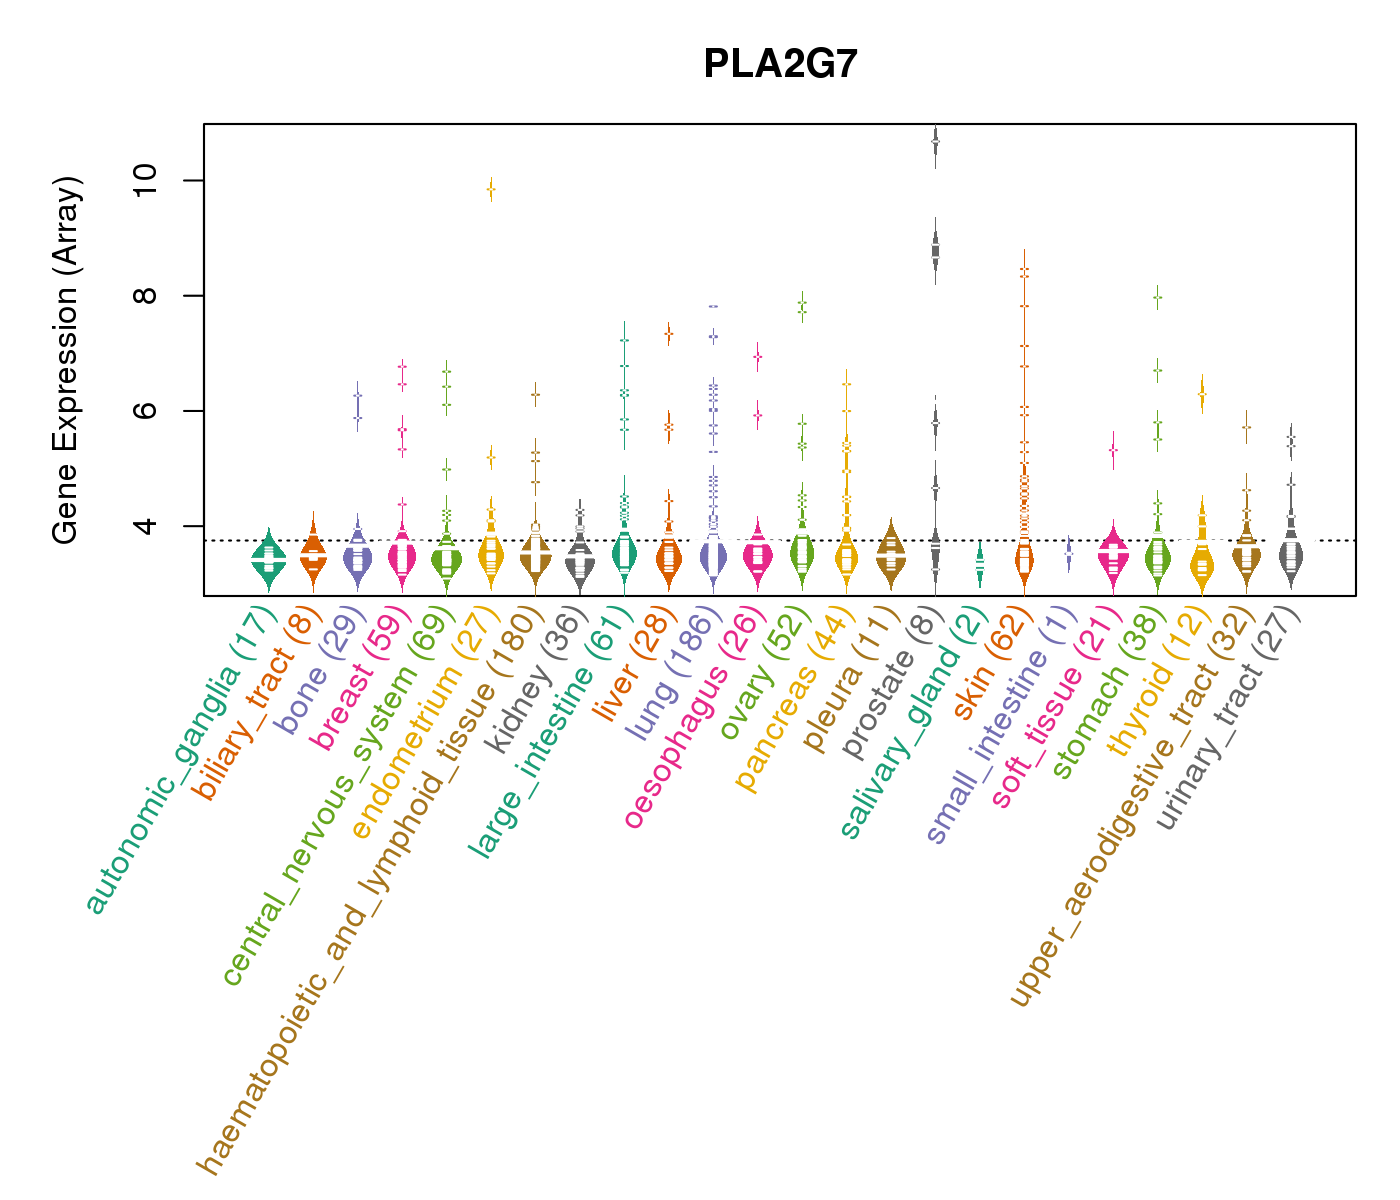
| Gene Expression for PLA2G7 |
| * CCLE gene expression data were extracted from CCLE_Expression_Entrez_2012-10-18.res: Gene-centric RMA-normalized mRNA expression data. |
 |
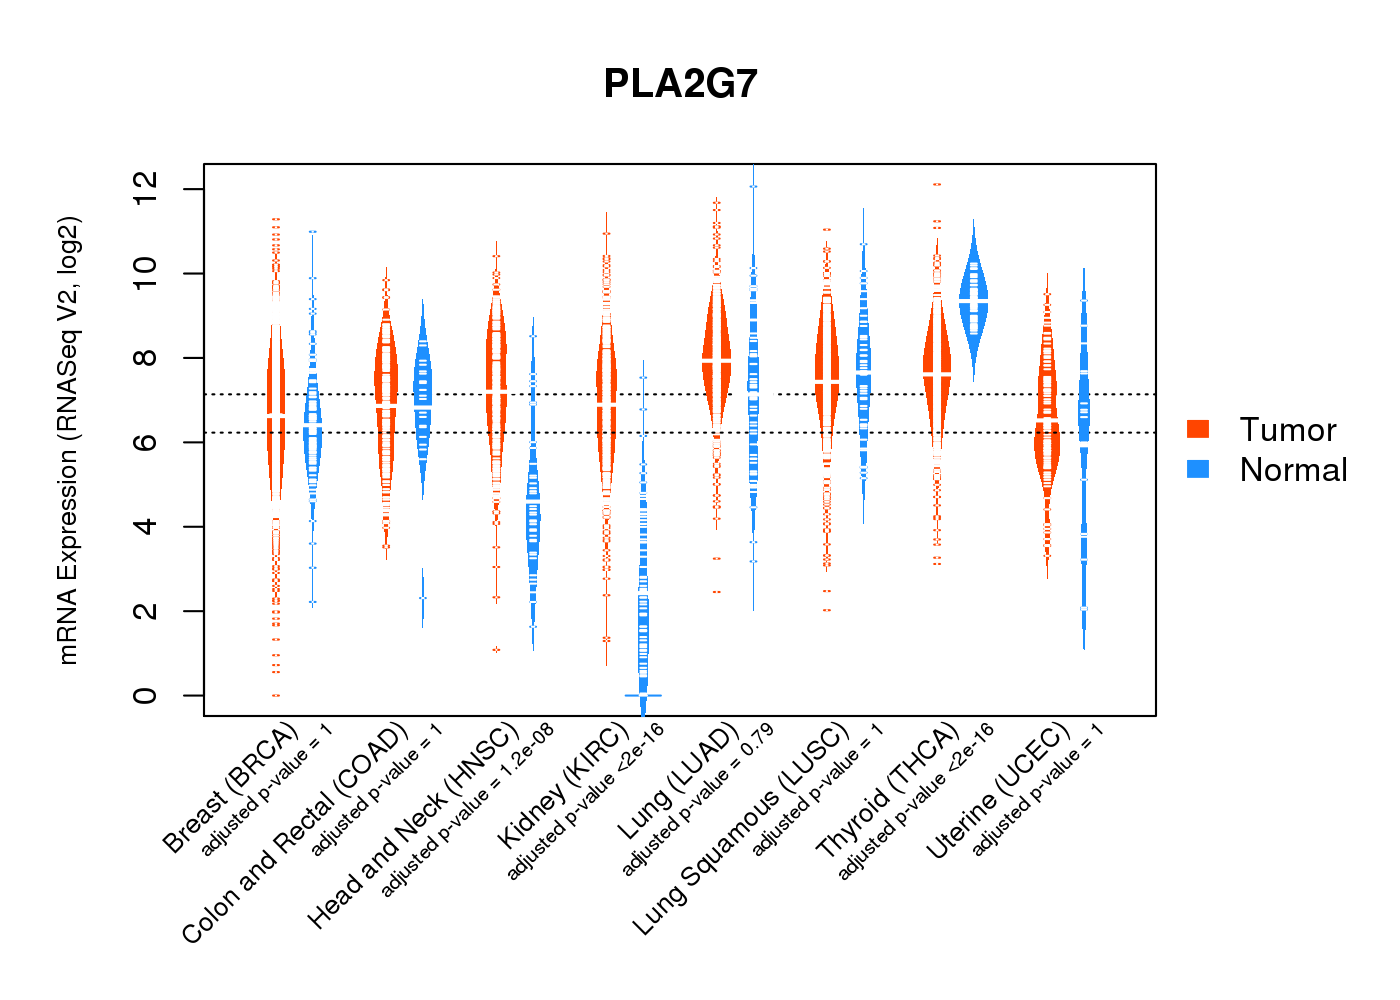
| * Normalized gene expression data of RNASeqV2 was extracted from TCGA using R package TCGA-Assembler. The URLs of all public data files on TCGA DCC data server were gathered at Jan-05-2015. Only eight cancer types have enough normal control samples for differential expression analysis. (t test, adjusted p<0.05 (using Benjamini-Hochberg FDR)) |
 |
| Top |
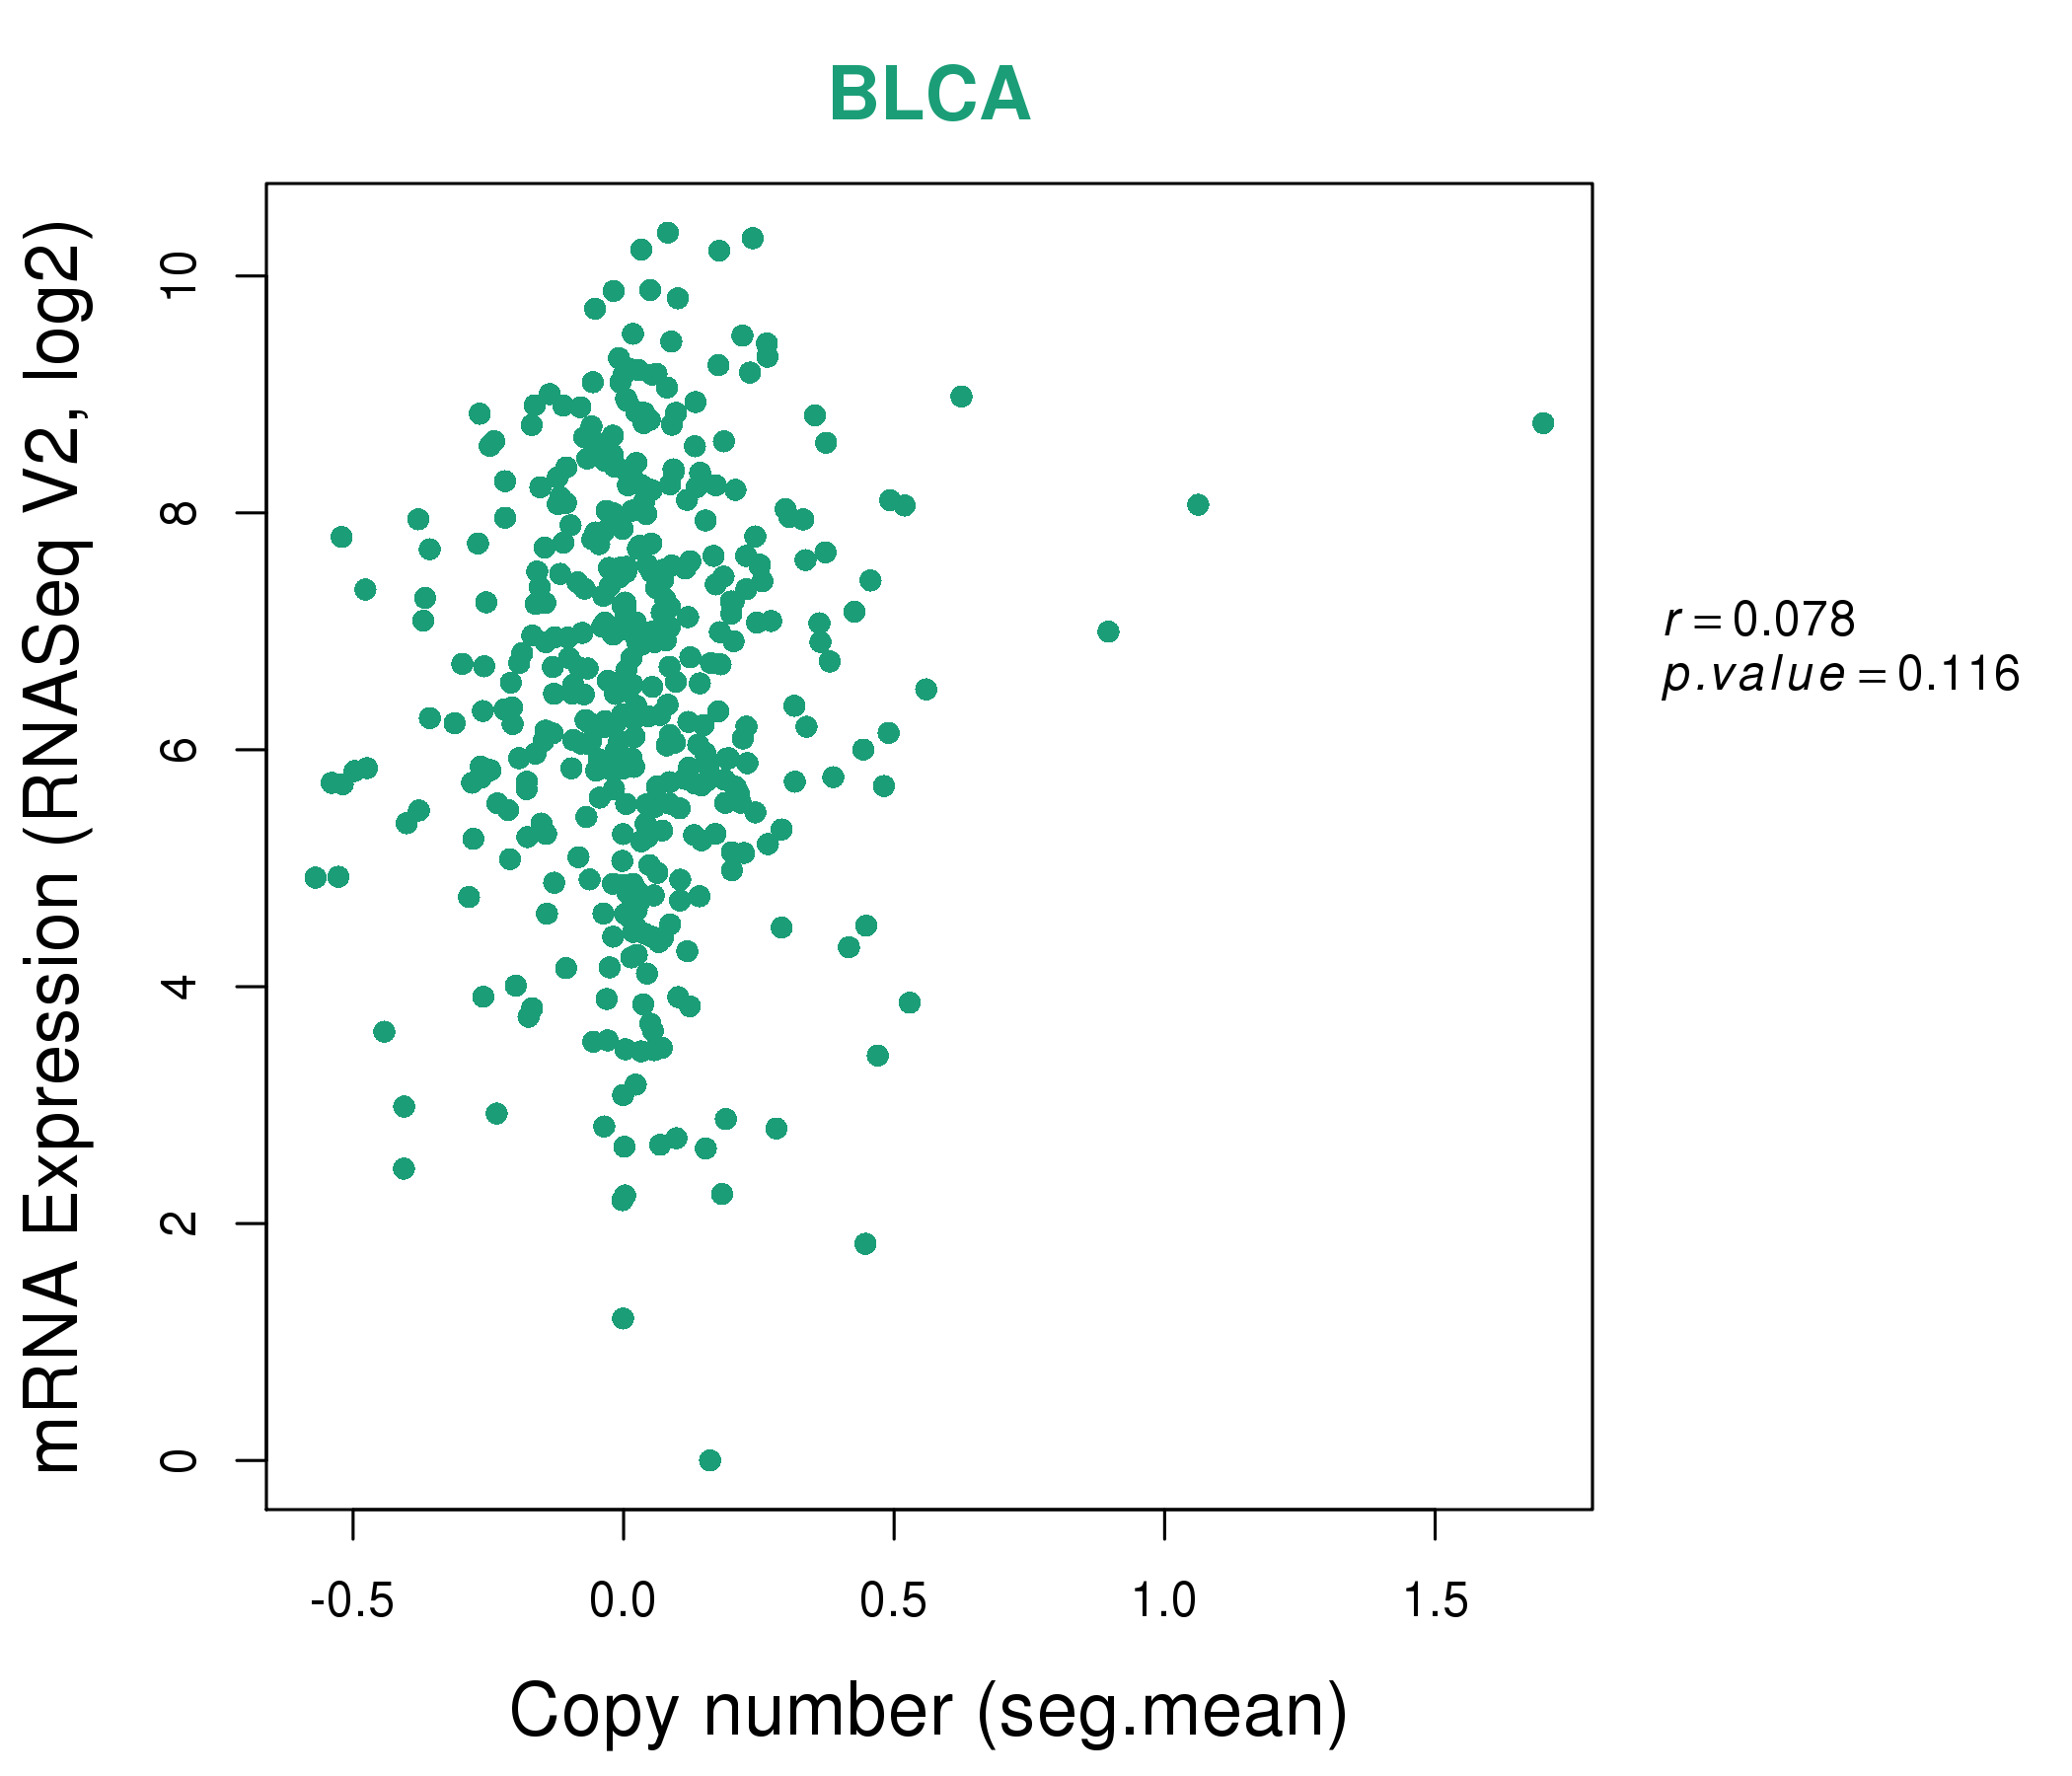
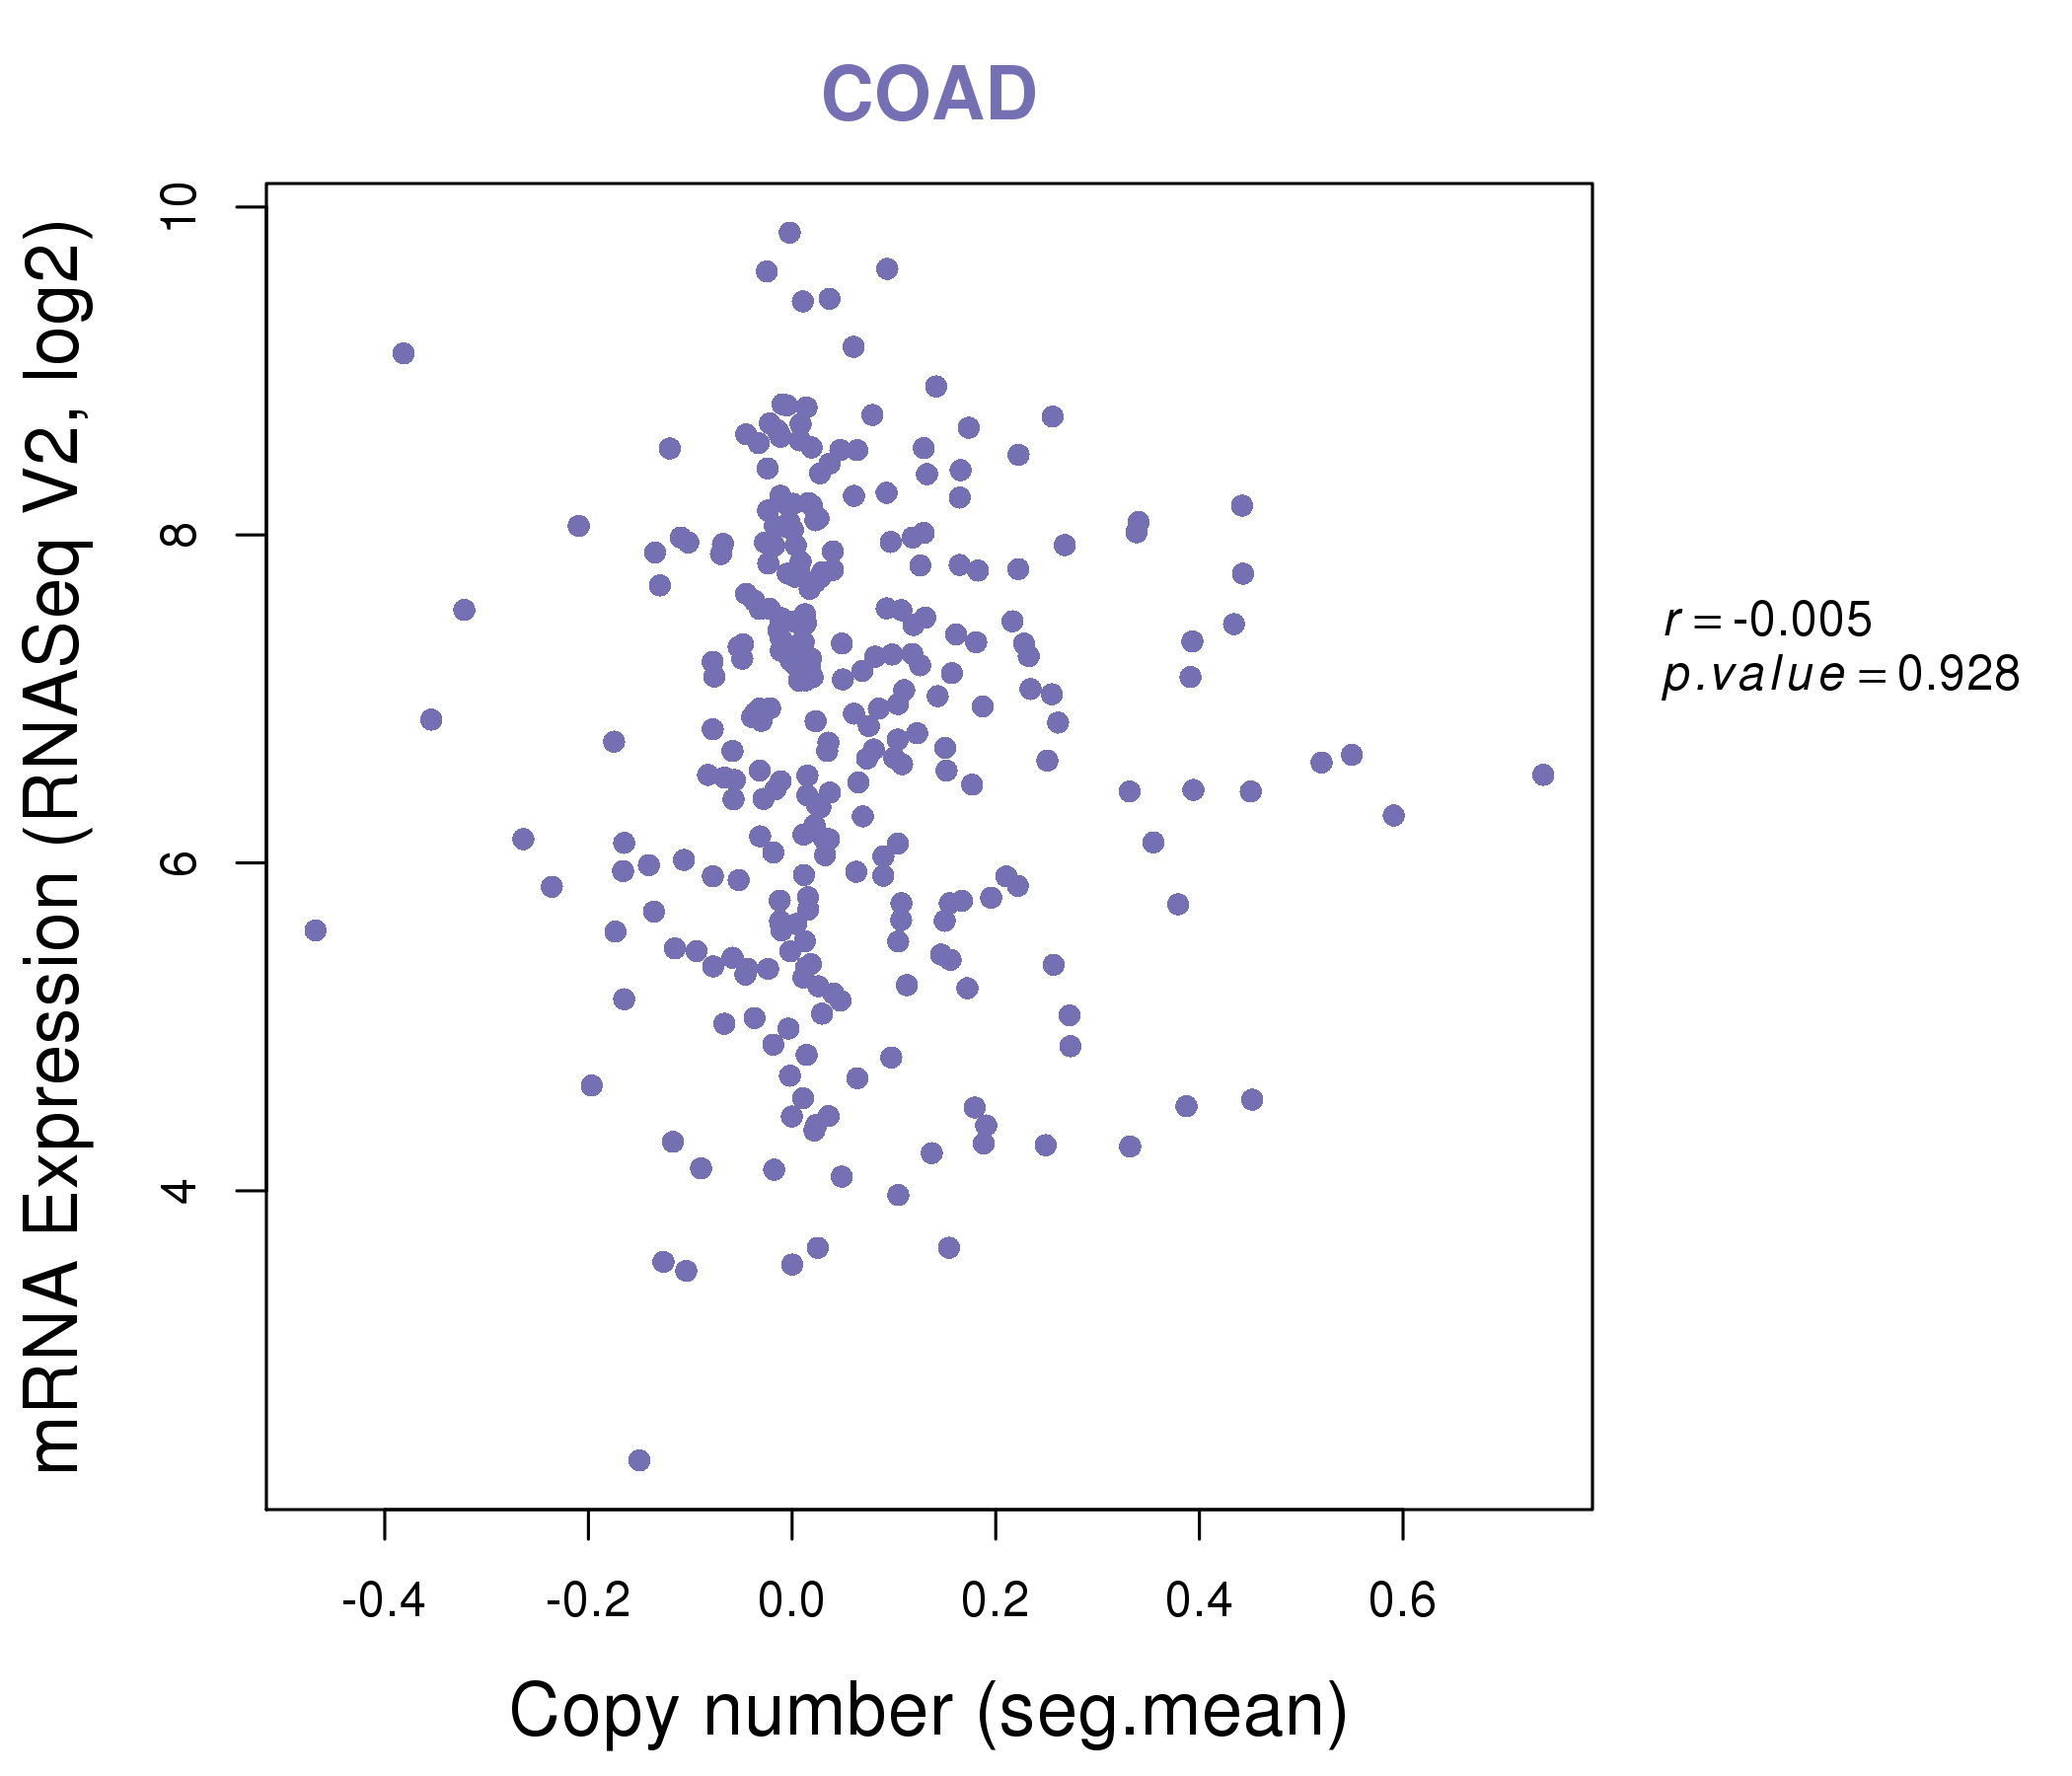
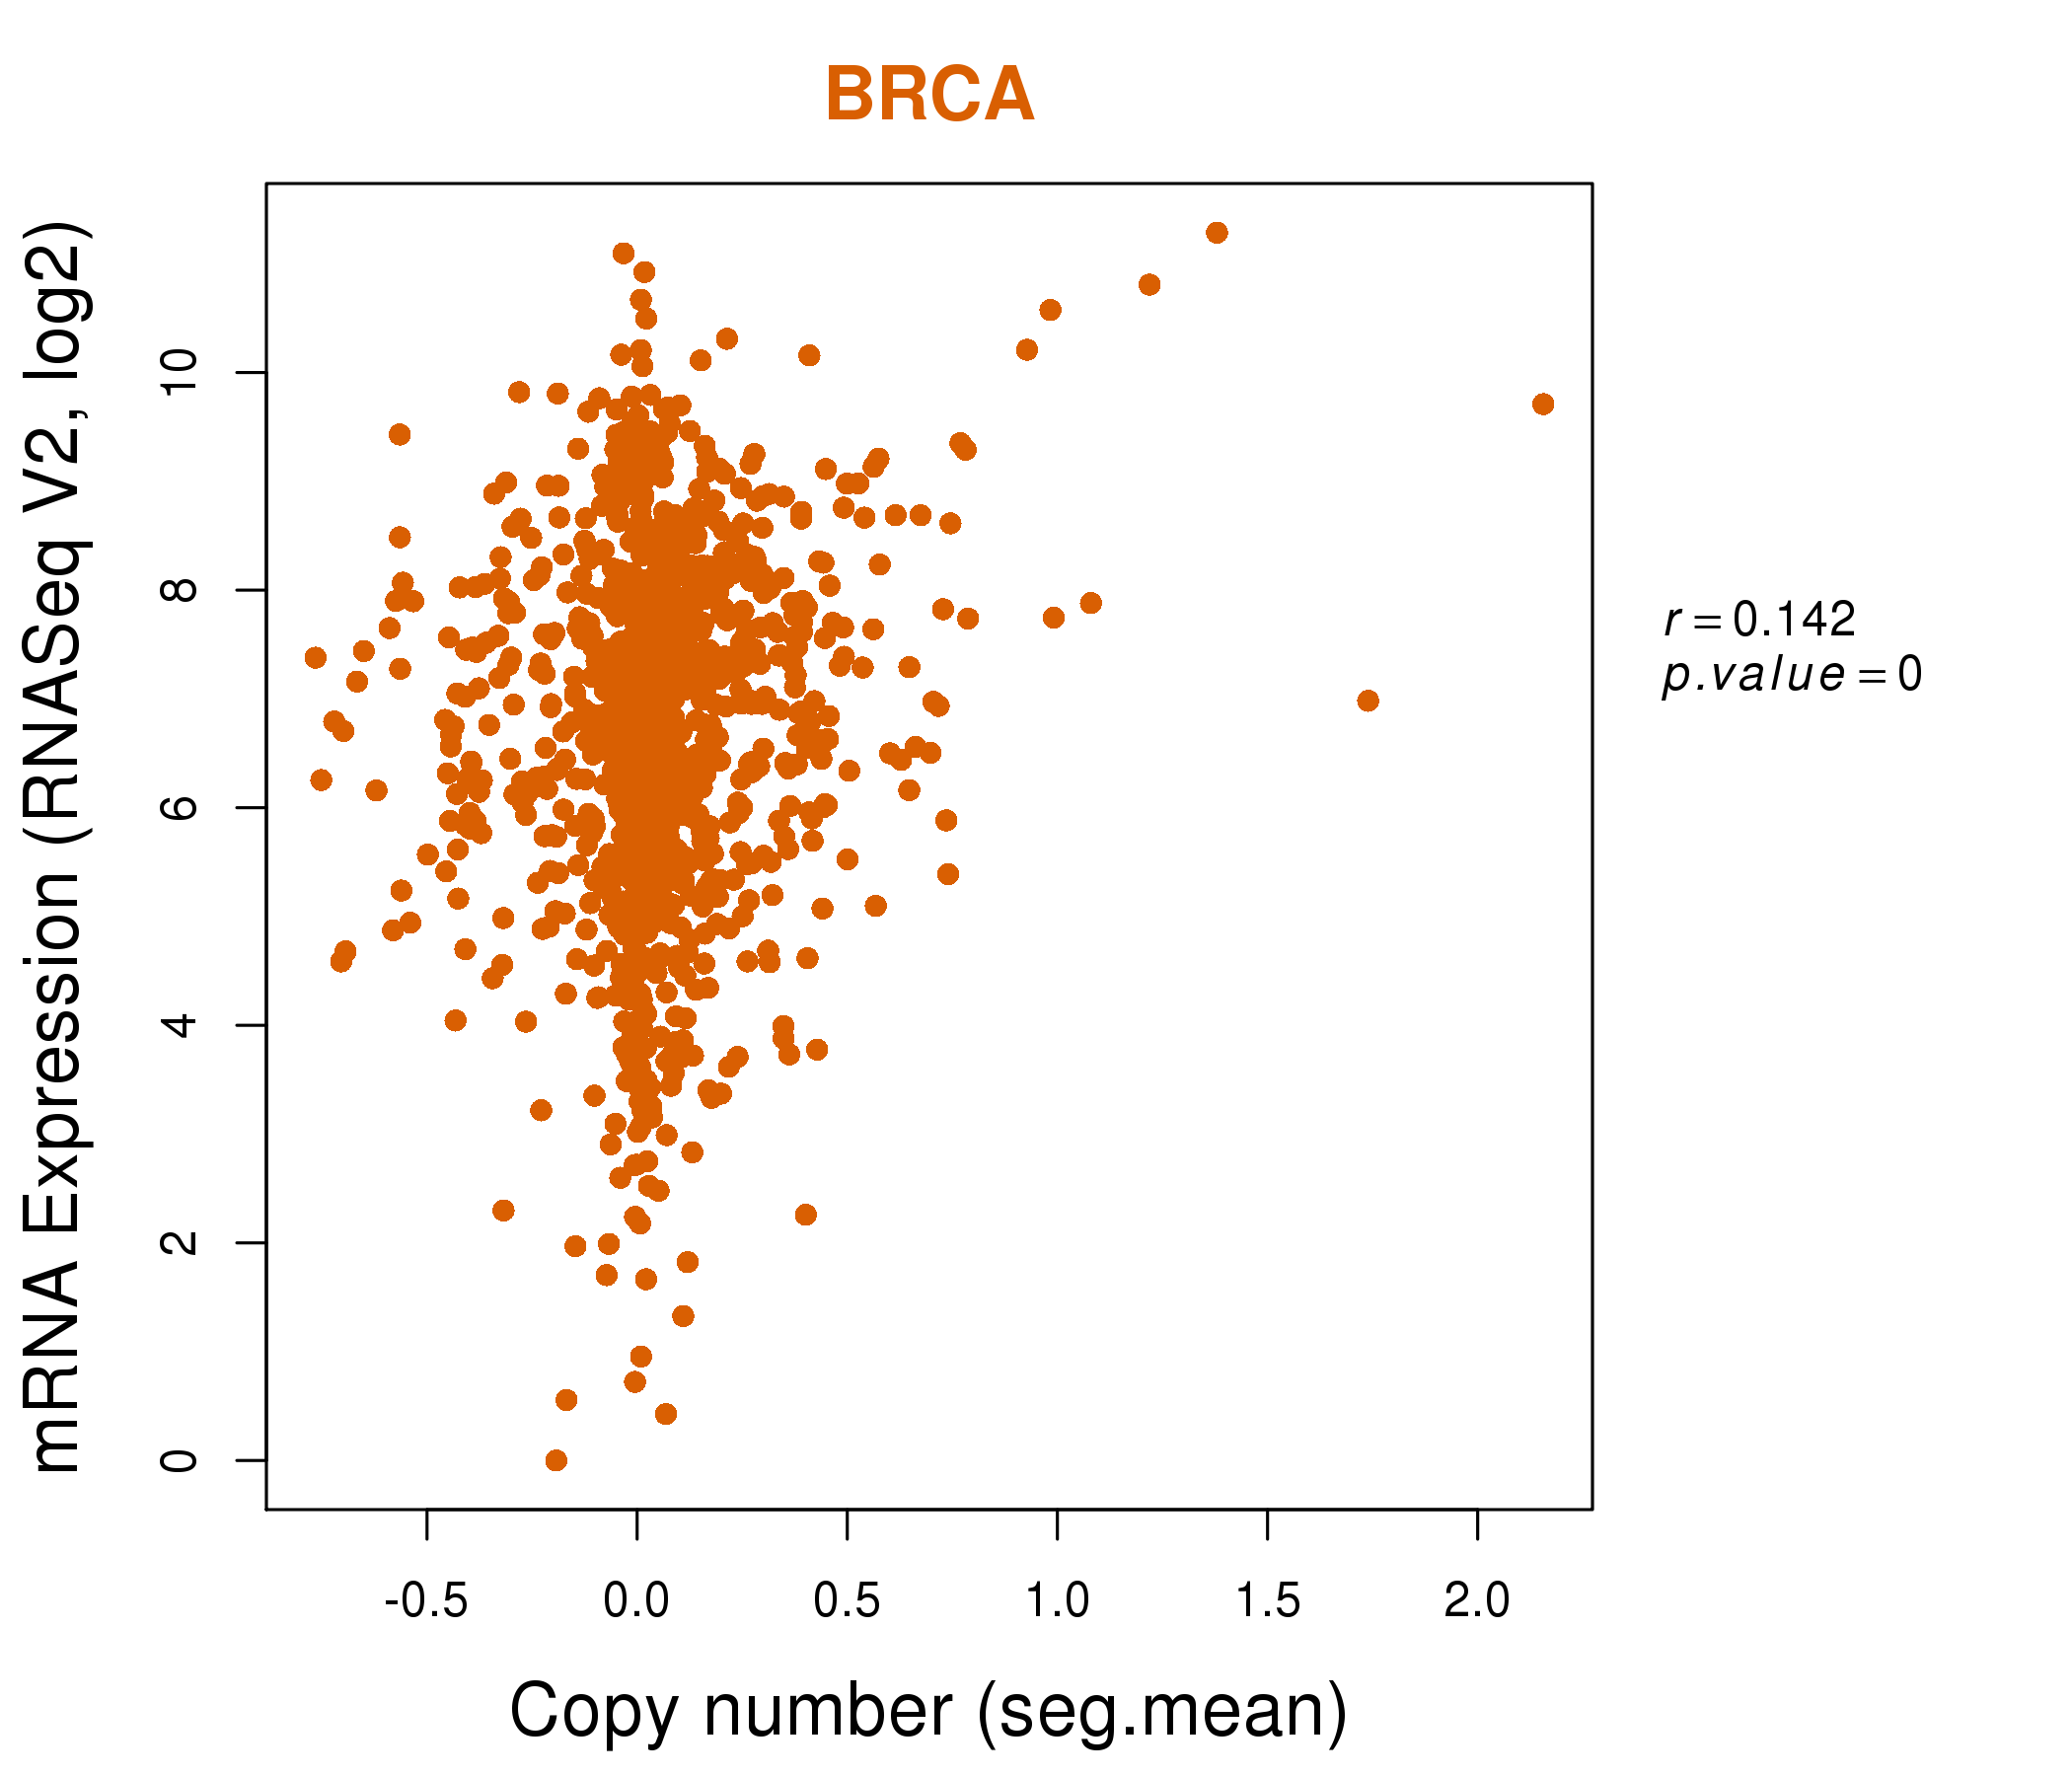
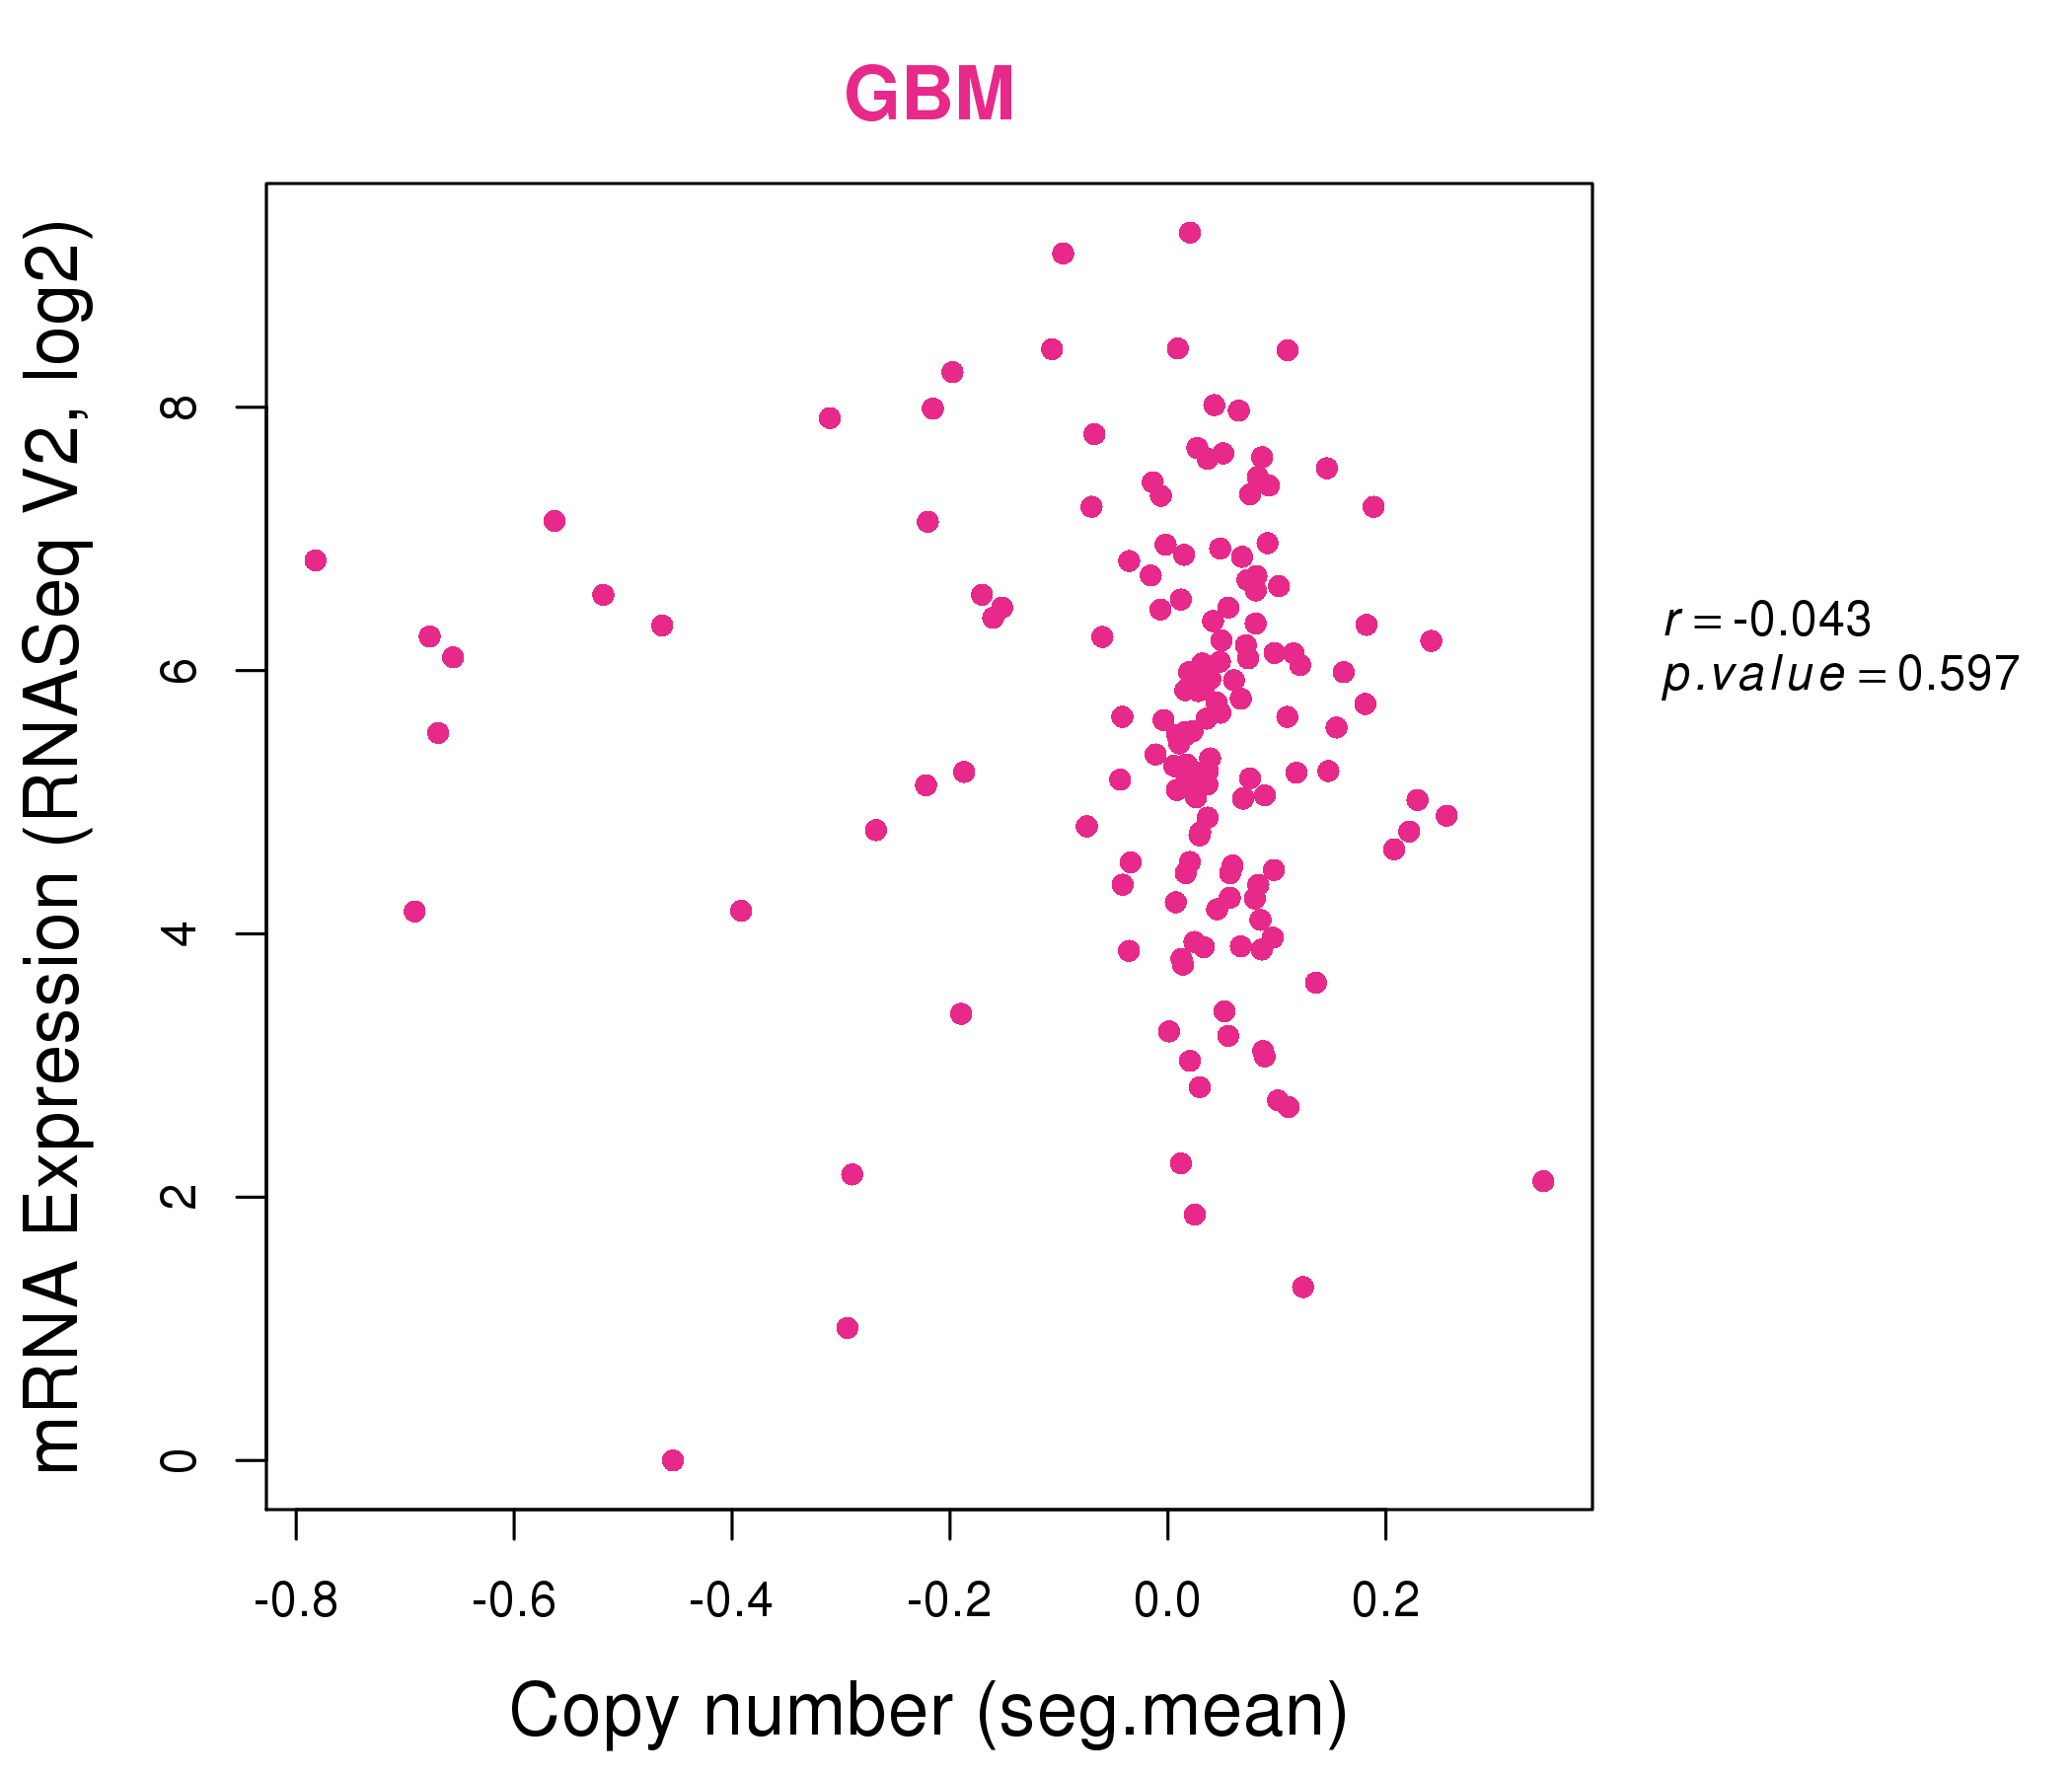
| * This plots show the correlation between CNV and gene expression. |
: Open all plots for all cancer types
 |
|
 |
|
| Top |
| Gene-Gene Network Information |
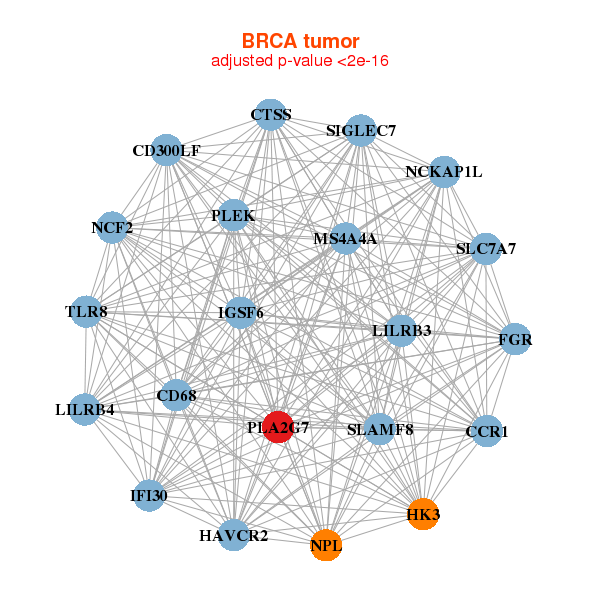
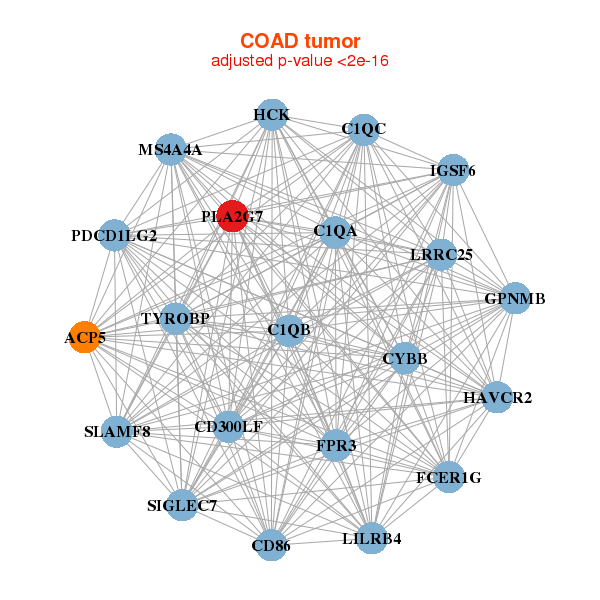
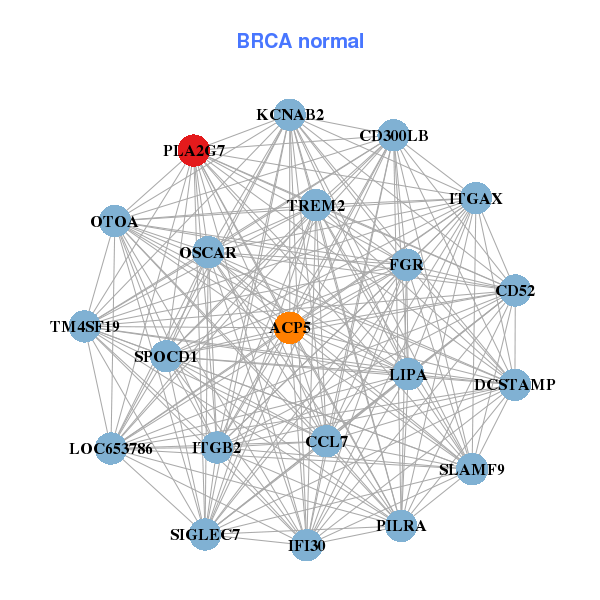
| * Co-Expression network figures were drawn using R package igraph. Only the top 20 genes with the highest correlations were shown. Red circle: input gene, orange circle: cell metabolism gene, sky circle: other gene |
: Open all plots for all cancer types
 |
| ||||
| CCR1,CD300LF,CD68,CTSS,FGR,HAVCR2,HK3, IFI30,IGSF6,LILRB3,LILRB4,MS4A4A,NCF2,NCKAP1L, NPL,PLA2G7,PLEK,SIGLEC7,SLAMF8,SLC7A7,TLR8 | ACP5,CCL7,CD300LB,CD52,FGR,IFI30,ITGAX, ITGB2,KCNAB2,LIPA,LOC653786,OSCAR,OTOA,PILRA, PLA2G7,SIGLEC7,SLAMF9,SPOCD1,TM4SF19,DCSTAMP,TREM2 | ||||
 |
| ||||
| ACP5,C1QA,C1QB,C1QC,CD300LF,CD86,CYBB, FCER1G,FPR3,GPNMB,HAVCR2,HCK,IGSF6,LILRB4, LRRC25,MS4A4A,PDCD1LG2,PLA2G7,SIGLEC7,SLAMF8,TYROBP | ACP5,AOAH,CARD9,CCR2,CD300A,CD300LF,CLEC4A, CSF2RA,CTSC,FPR3,HERPUD1,IGSF6,KCNK13,LILRB1, MMP9,MPEG1,PLA2G7,SIGLEC7,SIGLEC9,TRPM2,WNT10A |
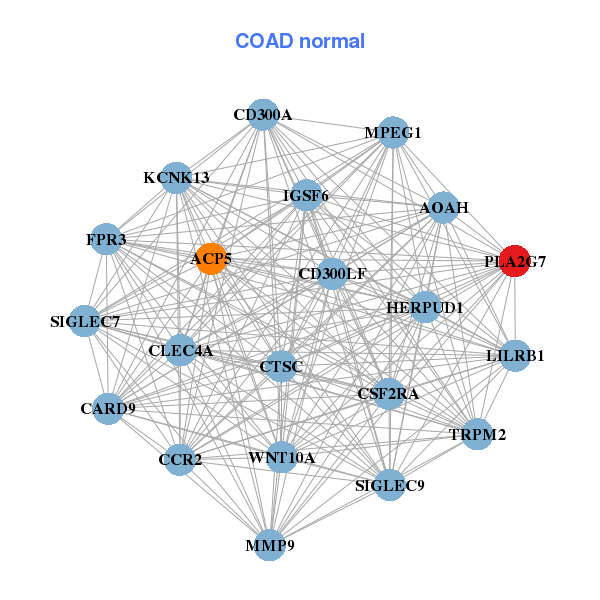
| * Co-Expression network figures were drawn using R package igraph. Only the top 20 genes with the highest correlations were shown. Red circle: input gene, orange circle: cell metabolism gene, sky circle: other gene |
: Open all plots for all cancer types
| Top |
: Open all interacting genes' information including KEGG pathway for all interacting genes from DAVID
| Top |
| Pharmacological Information for PLA2G7 |
| DB Category | DB Name | DB's ID and Url link |
| * Gene Centered Interaction Network. |
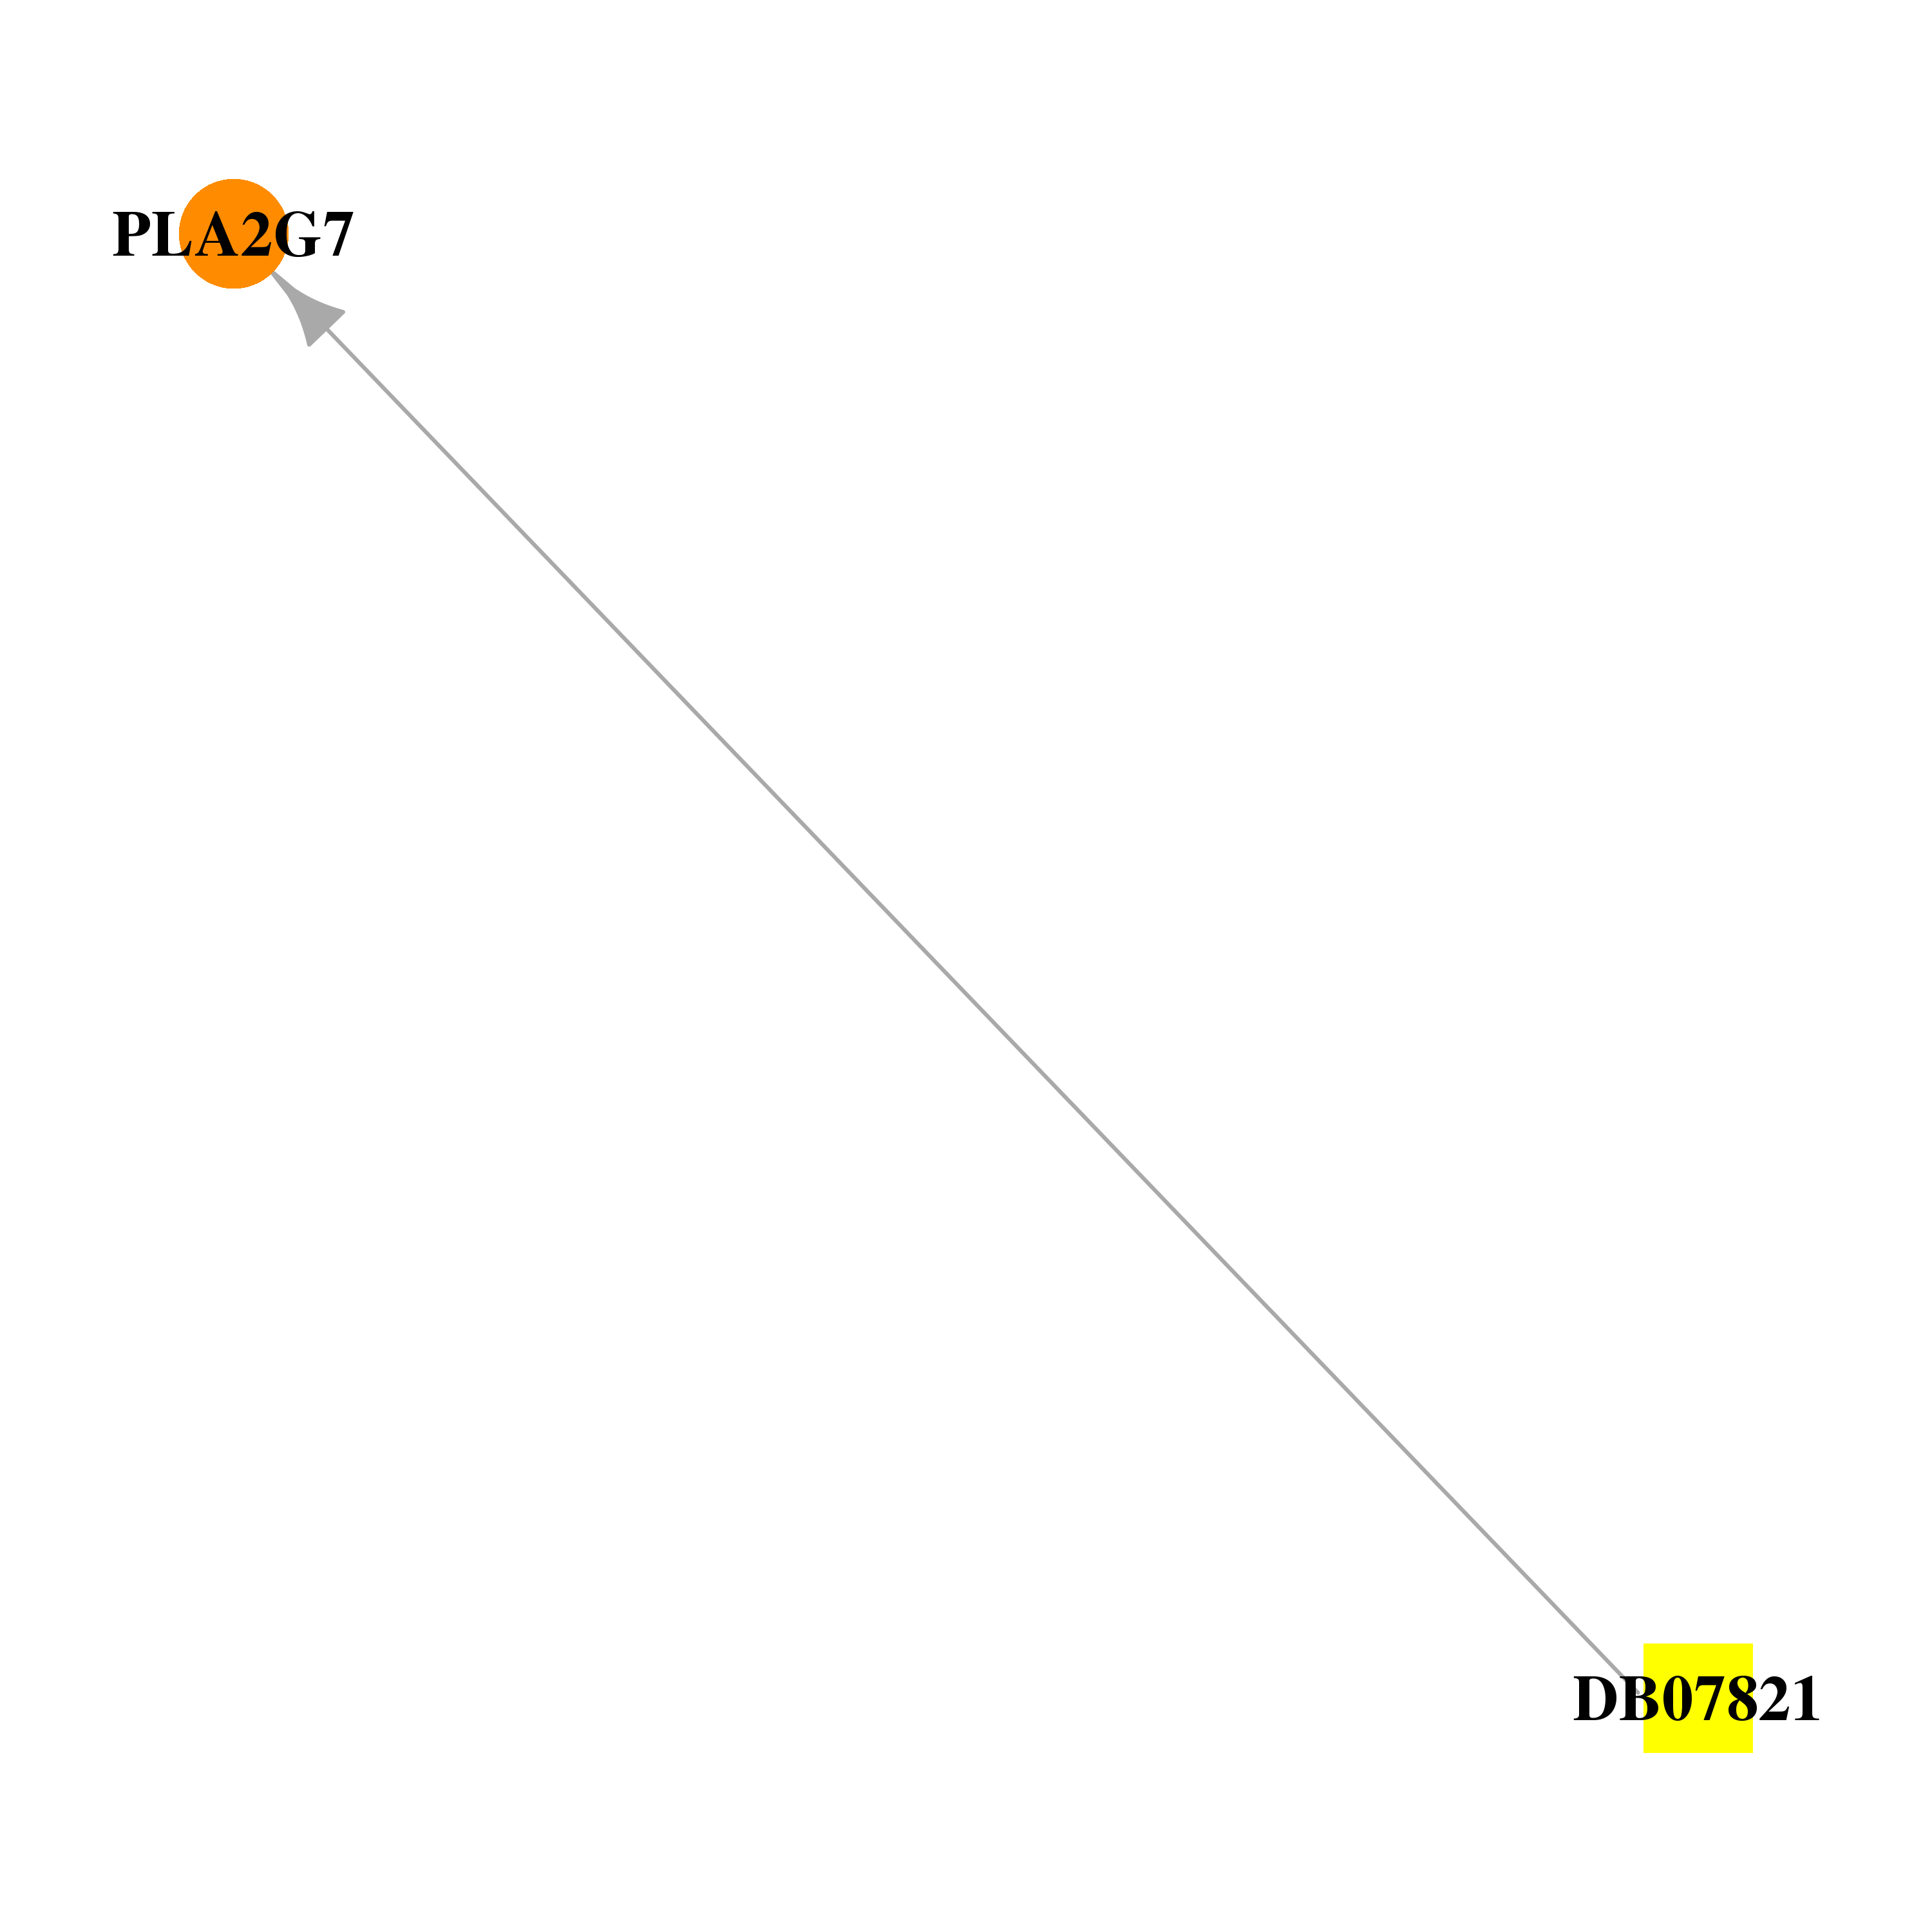 |
| * Drug Centered Interaction Network. |
| DrugBank ID | Target Name | Drug Groups | Generic Name | Drug Centered Network | Drug Structure |
| DB07821 | phospholipase A2, group VII (platelet-activating factor acetylhydrolase, plasma) | experimental | (1R)-1,2,2-TRIMETHYLPROPYL (R)-METHYLPHOSPHINATE | 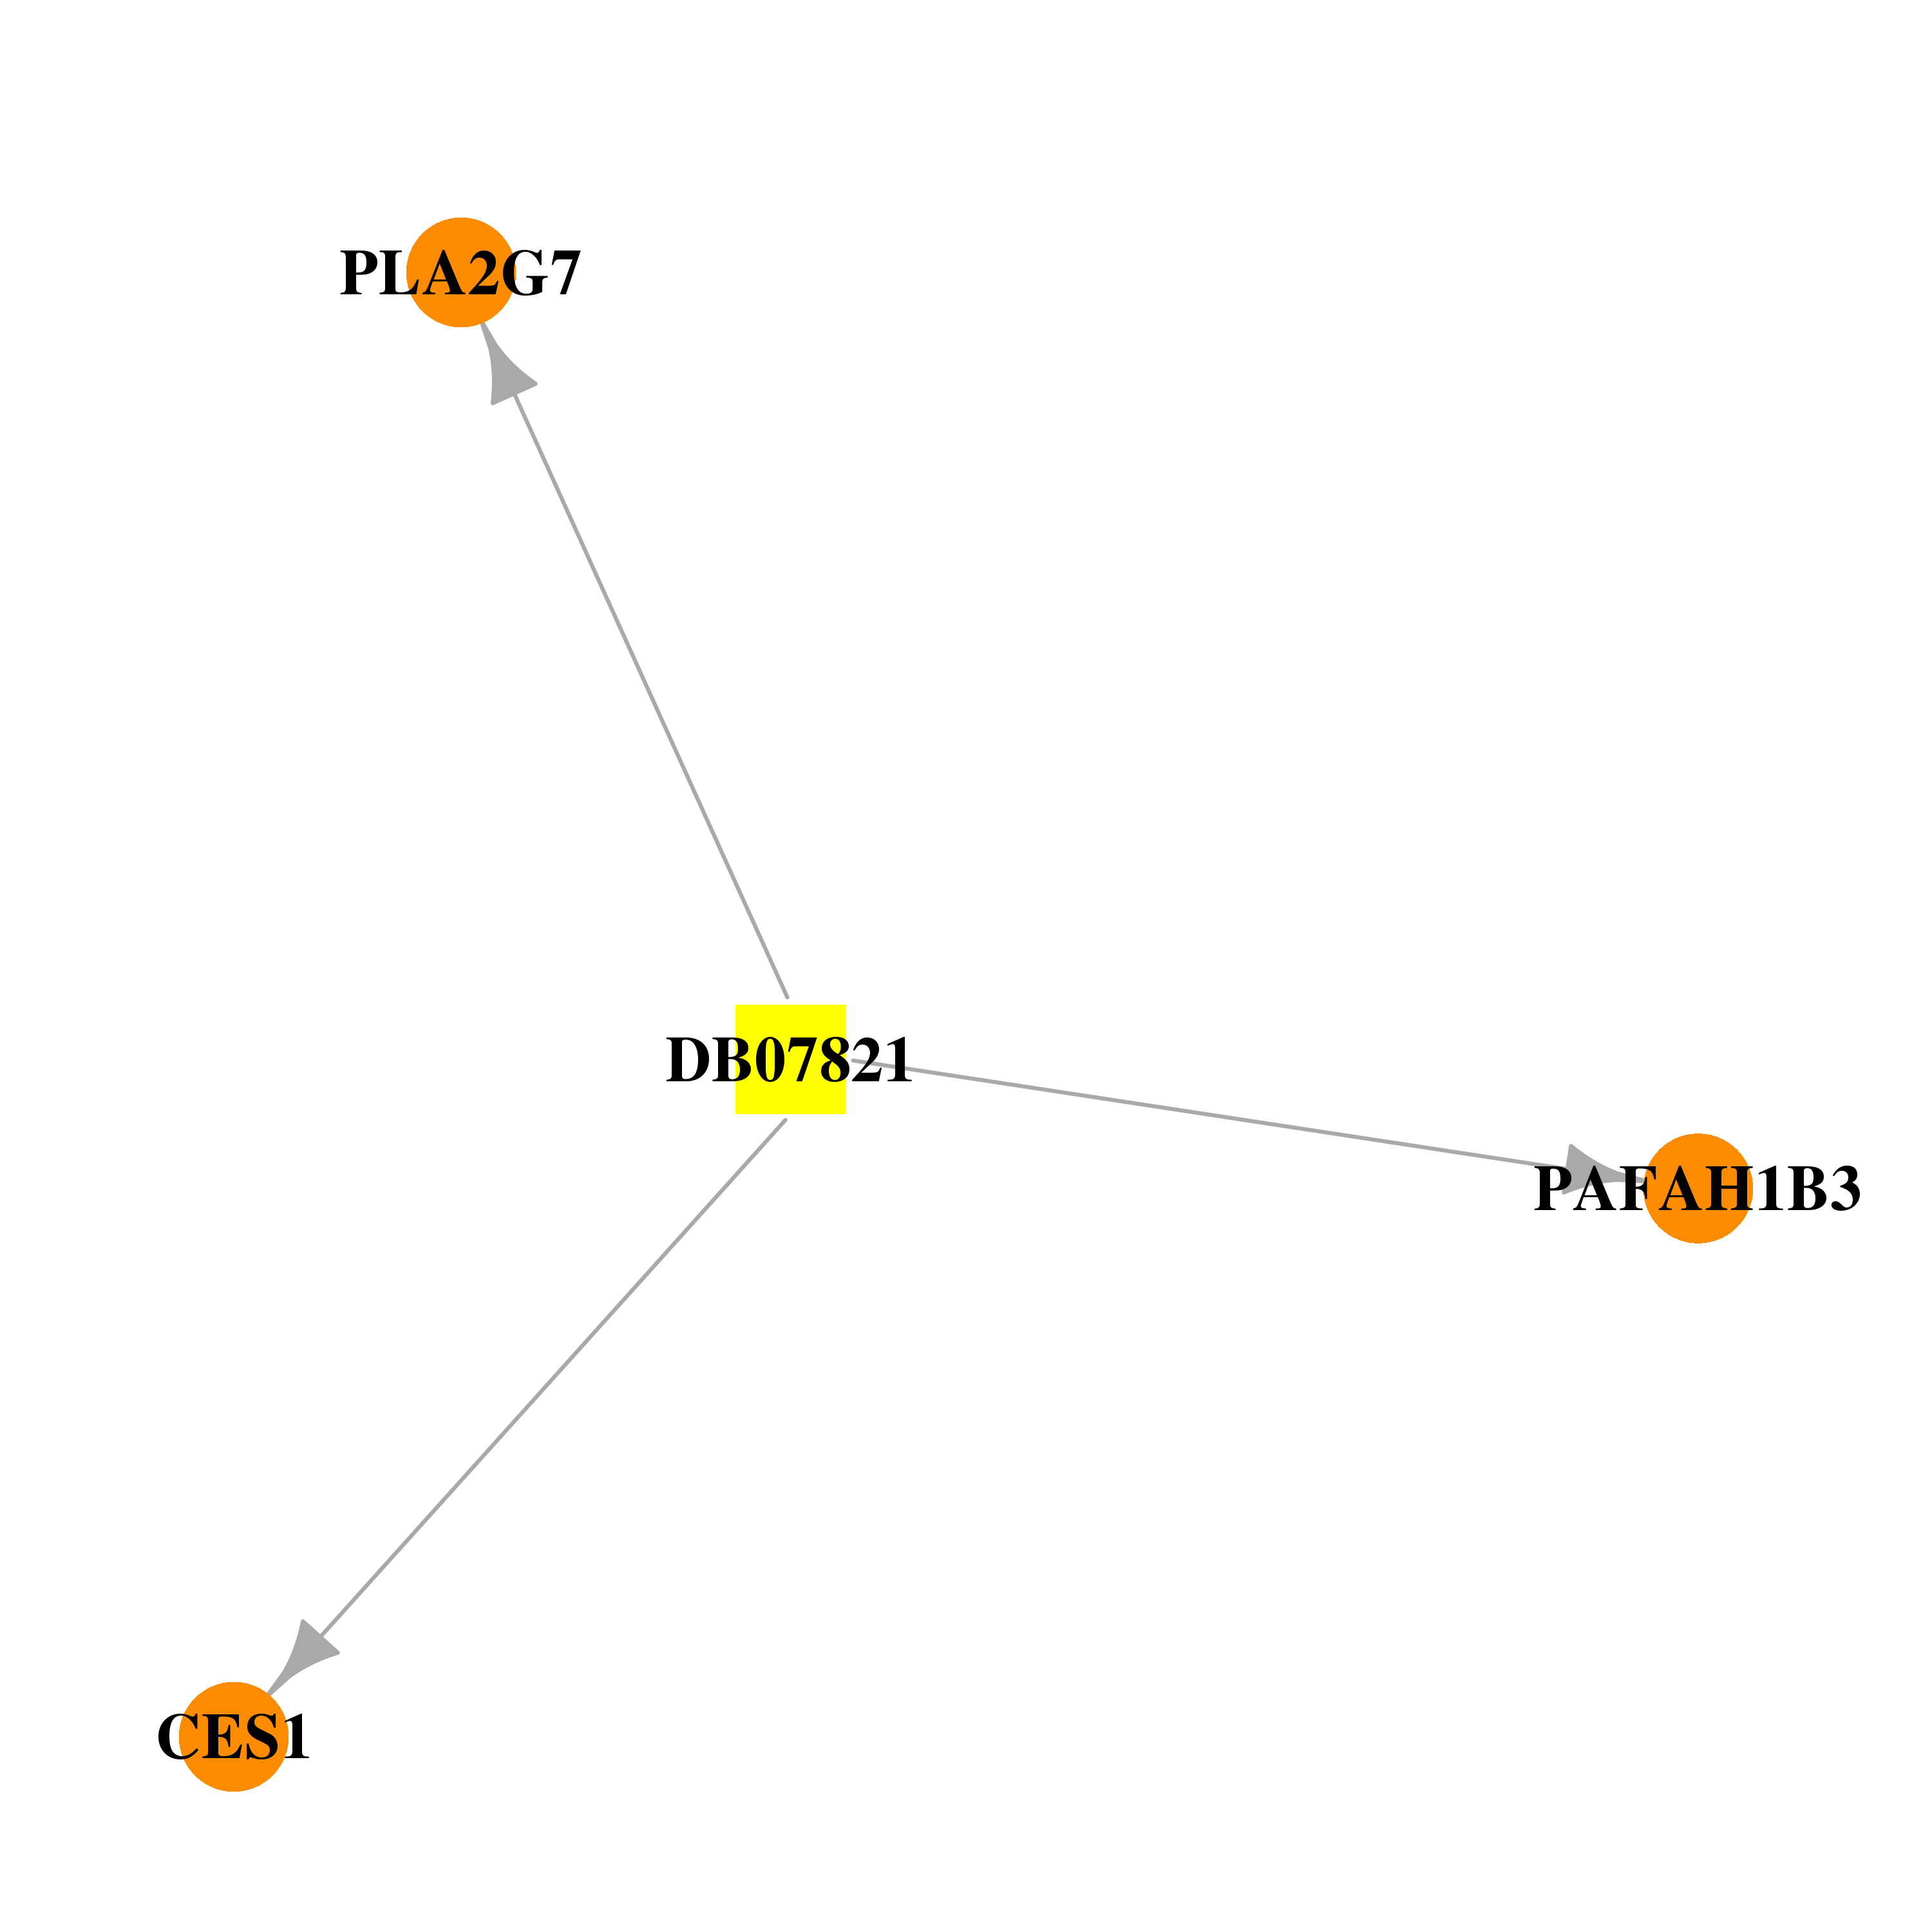 | 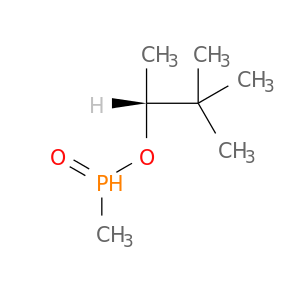 |
| Top |
| Cross referenced IDs for PLA2G7 |
| * We obtained these cross-references from Uniprot database. It covers 150 different DBs, 18 categories. http://www.uniprot.org/help/cross_references_section |
: Open all cross reference information
|
Copyright © 2016-Present - The Univsersity of Texas Health Science Center at Houston @ |