|
||||||||||||||||||||
| |
| Phenotypic Information (metabolism pathway, cancer, disease, phenome) |
| |
| |
| Gene-Gene Network Information: Co-Expression Network, Interacting Genes & KEGG |
| |
|


| Gene Summary for CHPF |
| Basic gene info. | Gene symbol | CHPF |
| Gene name | chondroitin polymerizing factor | |
| Synonyms | CHSY2|CSS2 | |
| Cytomap | UCSC genome browser: 2q35 | |
| Genomic location | chr2 :220403668-220407819 | |
| Type of gene | protein-coding | |
| RefGenes | NM_001195731.1, NM_024536.5, | |
| Ensembl id | ENSG00000123989 | |
| Description | N-acetylgalactosaminyl-proteoglycan 3-beta-glucuronosyltransferase IIN-acetylgalactosaminyltransferase 2chondroitin glucuronyltransferase 2chondroitin sulfate synthase 2chondroitin-polymerizing factorglucuronosyl-N-acetylgalactosaminyl-proteoglycan 4 | |
| Modification date | 20141217 | |
| dbXrefs | MIM : 610405 | |
| HGNC : HGNC | ||
| Ensembl : ENSG00000123989 | ||
| HPRD : 10829 | ||
| Vega : OTTHUMG00000058929 | ||
| Protein | UniProt: go to UniProt's Cross Reference DB Table | |
| Expression | CleanEX: HS_CHPF | |
| BioGPS: 79586 | ||
| Gene Expression Atlas: ENSG00000123989 | ||
| The Human Protein Atlas: ENSG00000123989 | ||
| Pathway | NCI Pathway Interaction Database: CHPF | |
| KEGG: CHPF | ||
| REACTOME: CHPF | ||
| ConsensusPathDB | ||
| Pathway Commons: CHPF | ||
| Metabolism | MetaCyc: CHPF | |
| HUMANCyc: CHPF | ||
| Regulation | Ensembl's Regulation: ENSG00000123989 | |
| miRBase: chr2 :220,403,668-220,407,819 | ||
| TargetScan: NM_001195731 | ||
| cisRED: ENSG00000123989 | ||
| Context | iHOP: CHPF | |
| cancer metabolism search in PubMed: CHPF | ||
| UCL Cancer Institute: CHPF | ||
| Assigned class in ccmGDB | C | |
| Top |
| Phenotypic Information for CHPF(metabolism pathway, cancer, disease, phenome) |
| Cancer | CGAP: CHPF |
| Familial Cancer Database: CHPF | |
| * This gene is included in those cancer gene databases. |
|
|
|
|
|
|
| ||||||||||||||
Oncogene 1 | Significant driver gene in | |||||||||||||||||||
| cf) number; DB name 1 Oncogene; http://nar.oxfordjournals.org/content/35/suppl_1/D721.long, 2 Tumor Suppressor gene; https://bioinfo.uth.edu/TSGene/, 3 Cancer Gene Census; http://www.nature.com/nrc/journal/v4/n3/abs/nrc1299.html, 4 CancerGenes; http://nar.oxfordjournals.org/content/35/suppl_1/D721.long, 5 Network of Cancer Gene; http://ncg.kcl.ac.uk/index.php, 1Therapeutic Vulnerabilities in Cancer; http://cbio.mskcc.org/cancergenomics/statius/ |
| REACTOME_METABOLISM_OF_CARBOHYDRATES | |
| OMIM | |
| Orphanet | |
| Disease | KEGG Disease: CHPF |
| MedGen: CHPF (Human Medical Genetics with Condition) | |
| ClinVar: CHPF | |
| Phenotype | MGI: CHPF (International Mouse Phenotyping Consortium) |
| PhenomicDB: CHPF | |
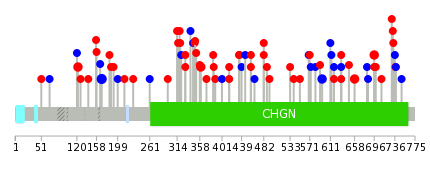
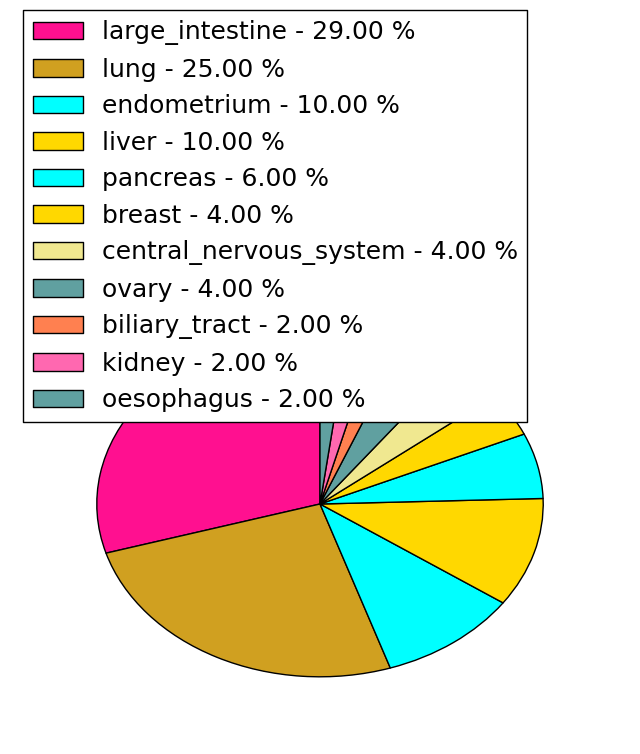
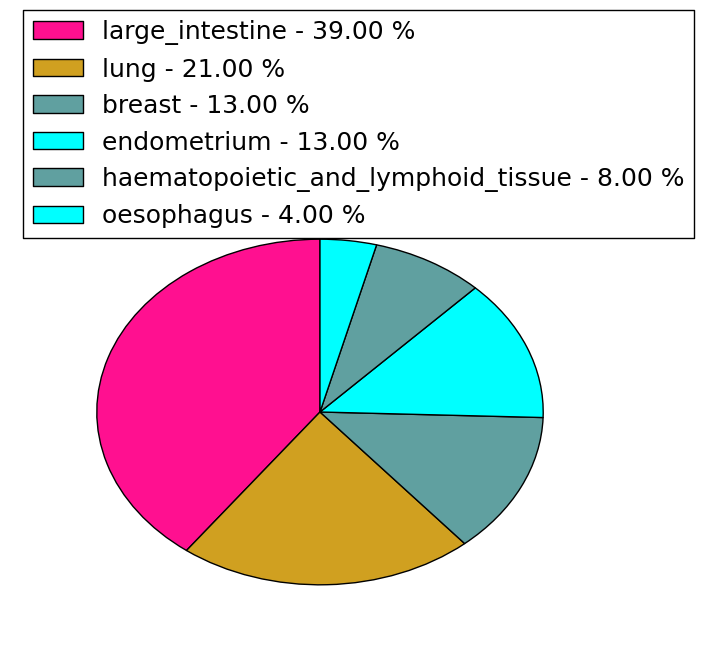
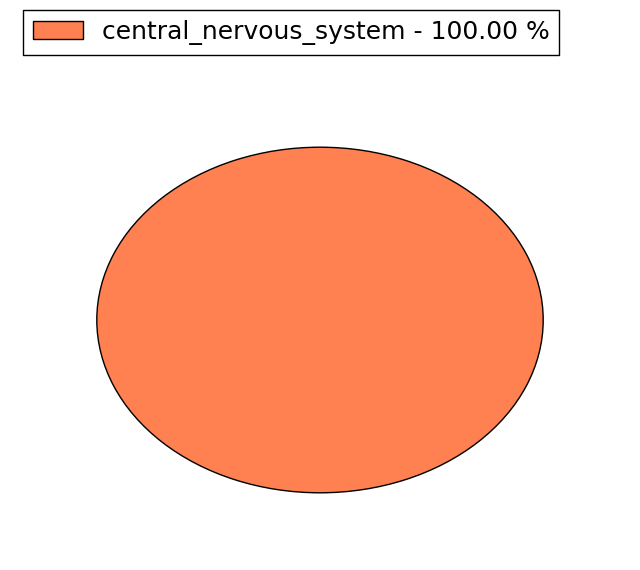
| Mutations for CHPF |
| * Under tables are showing count per each tissue to give us broad intuition about tissue specific mutation patterns.You can go to the detailed page for each mutation database's web site. |
| There's no structural variation information in COSMIC data for this gene. |
| * From mRNA Sanger sequences, Chitars2.0 arranged chimeric transcripts. This table shows CHPF related fusion information. |
| ID | Head Gene | Tail Gene | Accession | Gene_a | qStart_a | qEnd_a | Chromosome_a | tStart_a | tEnd_a | Gene_a | qStart_a | qEnd_a | Chromosome_a | tStart_a | tEnd_a |
| Top |
| There's no copy number variation information in COSMIC data for this gene. |
| Top |
|
 |
| Top |
| Stat. for Non-Synonymous SNVs (# total SNVs=48) | (# total SNVs=23) |
 |  |
(# total SNVs=1) | (# total SNVs=2) |
 |  |
| Top |
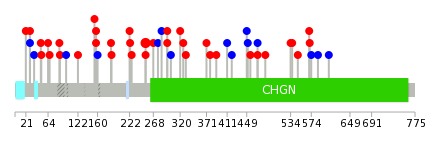
| * When you move the cursor on each content, you can see more deailed mutation information on the Tooltip. Those are primary_site,primary_histology,mutation(aa),pubmedID. |
| GRCh37 position | Mutation(aa) | Unique sampleID count |
| chr2:220404347-220404347 | p.E696K | 3 |
| chr2:220406722-220406722 | p.L168L | 3 |
| chr2:220406861-220406861 | p.A122V | 2 |
| chr2:220405354-220405354 | p.Q360R | 2 |
| chr2:220404648-220404648 | p.L595L | 2 |
| chr2:220404460-220404460 | p.G658E | 2 |
| chr2:220404687-220404687 | p.V582V | 1 |
| chr2:220405747-220405748 | p.P330I | 1 |
| chr2:220404225-220404225 | p.C736C | 1 |
| chr2:220405041-220405041 | p.T464T | 1 |
| Top |
|
 |
| Point Mutation/ Tissue ID | 1 | 2 | 3 | 4 | 5 | 6 | 7 | 8 | 9 | 10 | 11 | 12 | 13 | 14 | 15 | 16 | 17 | 18 | 19 | 20 |
| # sample | 1 | 2 | 1 | 13 | 2 | 8 | 5 | 1 | 1 | 5 | 3 | 8 | ||||||||
| # mutation | 1 | 2 | 1 | 11 | 3 | 8 | 5 | 1 | 1 | 5 | 3 | 8 | ||||||||
| nonsynonymous SNV | 1 | 1 | 9 | 3 | 7 | 1 | 1 | 1 | 4 | 2 | 5 | |||||||||
| synonymous SNV | 1 | 1 | 2 | 1 | 4 | 1 | 1 | 3 |
| cf) Tissue ID; Tissue type (1; BLCA[Bladder Urothelial Carcinoma], 2; BRCA[Breast invasive carcinoma], 3; CESC[Cervical squamous cell carcinoma and endocervical adenocarcinoma], 4; COAD[Colon adenocarcinoma], 5; GBM[Glioblastoma multiforme], 6; Glioma Low Grade, 7; HNSC[Head and Neck squamous cell carcinoma], 8; KICH[Kidney Chromophobe], 9; KIRC[Kidney renal clear cell carcinoma], 10; KIRP[Kidney renal papillary cell carcinoma], 11; LAML[Acute Myeloid Leukemia], 12; LUAD[Lung adenocarcinoma], 13; LUSC[Lung squamous cell carcinoma], 14; OV[Ovarian serous cystadenocarcinoma ], 15; PAAD[Pancreatic adenocarcinoma], 16; PRAD[Prostate adenocarcinoma], 17; SKCM[Skin Cutaneous Melanoma], 18:STAD[Stomach adenocarcinoma], 19:THCA[Thyroid carcinoma], 20:UCEC[Uterine Corpus Endometrial Carcinoma]) |
| Top |
| * We represented just top 10 SNVs. When you move the cursor on each content, you can see more deailed mutation information on the Tooltip. Those are primary_site, primary_histology, mutation(aa), pubmedID. |
| Genomic Position | Mutation(aa) | Unique sampleID count |
| chr2:220405189 | p.R253H,CHPF | 3 |
| chr2:220405064 | p.R570Q,CHPF | 1 |
| chr2:220404235 | p.L326F,CHPF | 1 |
| chr2:220405770 | p.R157Q,CHPF | 1 |
| chr2:220404687 | p.L548M,CHPF | 1 |
| chr2:220406861 | p.T320S,CHPF | 1 |
| chr2:220405095 | p.P154L,CHPF | 1 |
| chr2:220404238 | p.E537Q,CHPF | 1 |
| chr2:220405780 | p.T302T,CHPF | 1 |
| chr2:220404716 | p.P99P,CHPF | 1 |
| * Copy number data were extracted from TCGA using R package TCGA-Assembler. The URLs of all public data files on TCGA DCC data server were gathered on Jan-05-2015. Function ProcessCNAData in TCGA-Assembler package was used to obtain gene-level copy number value which is calculated as the average copy number of the genomic region of a gene. |
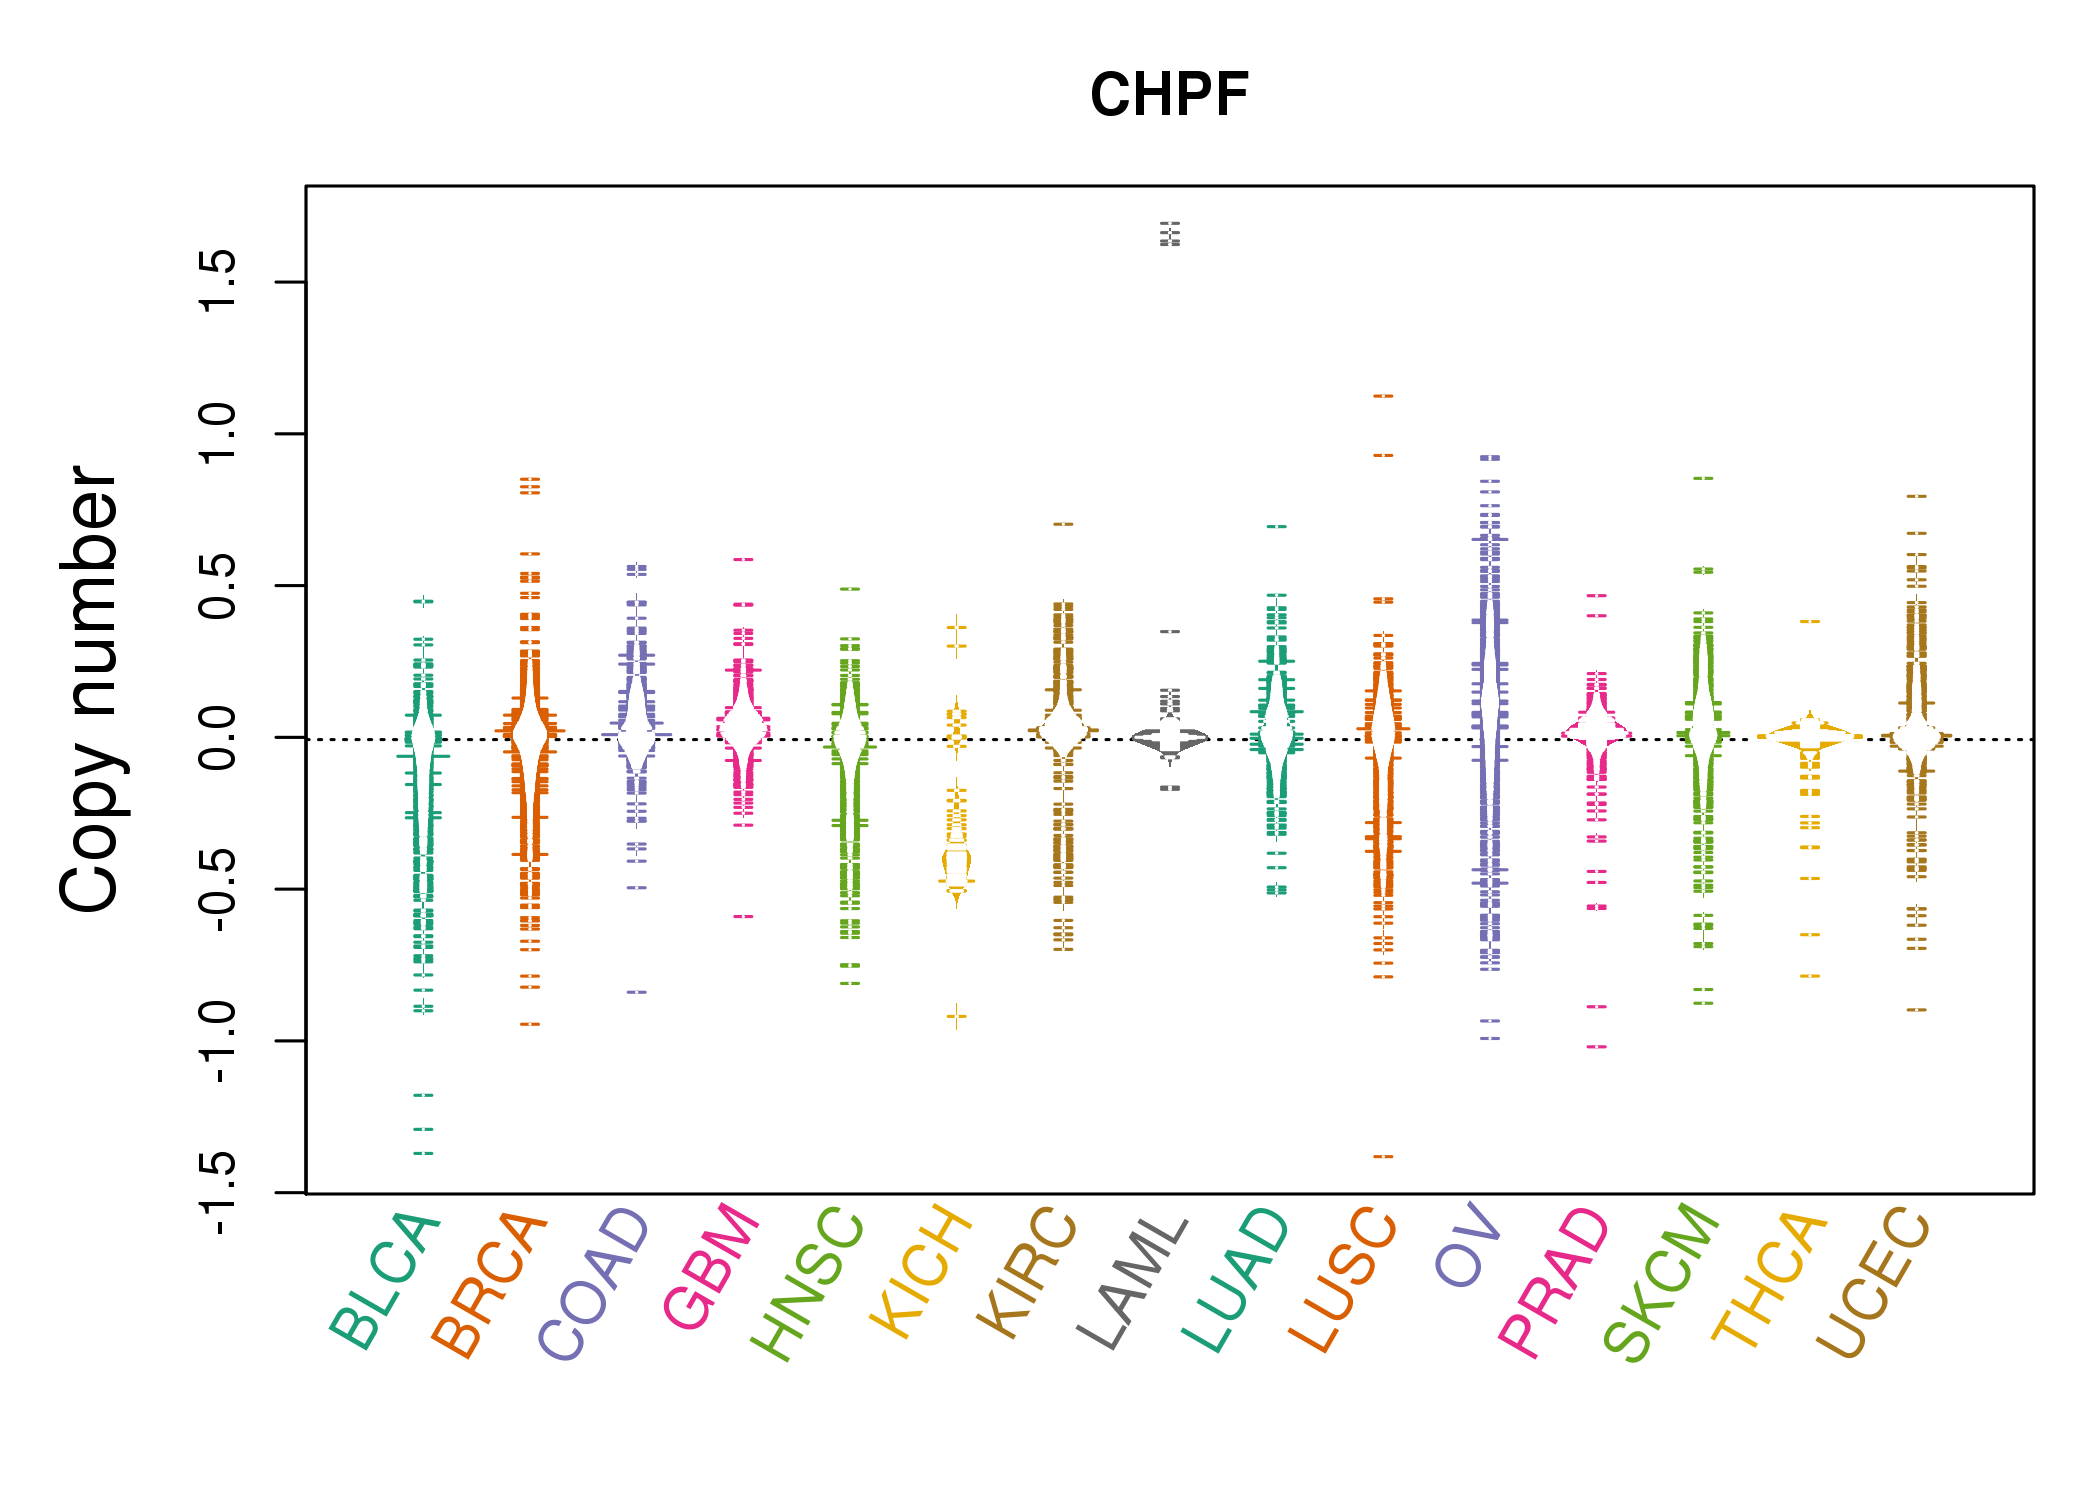 |
| cf) Tissue ID[Tissue type]: BLCA[Bladder Urothelial Carcinoma], BRCA[Breast invasive carcinoma], CESC[Cervical squamous cell carcinoma and endocervical adenocarcinoma], COAD[Colon adenocarcinoma], GBM[Glioblastoma multiforme], Glioma Low Grade, HNSC[Head and Neck squamous cell carcinoma], KICH[Kidney Chromophobe], KIRC[Kidney renal clear cell carcinoma], KIRP[Kidney renal papillary cell carcinoma], LAML[Acute Myeloid Leukemia], LUAD[Lung adenocarcinoma], LUSC[Lung squamous cell carcinoma], OV[Ovarian serous cystadenocarcinoma ], PAAD[Pancreatic adenocarcinoma], PRAD[Prostate adenocarcinoma], SKCM[Skin Cutaneous Melanoma], STAD[Stomach adenocarcinoma], THCA[Thyroid carcinoma], UCEC[Uterine Corpus Endometrial Carcinoma] |
| Top |
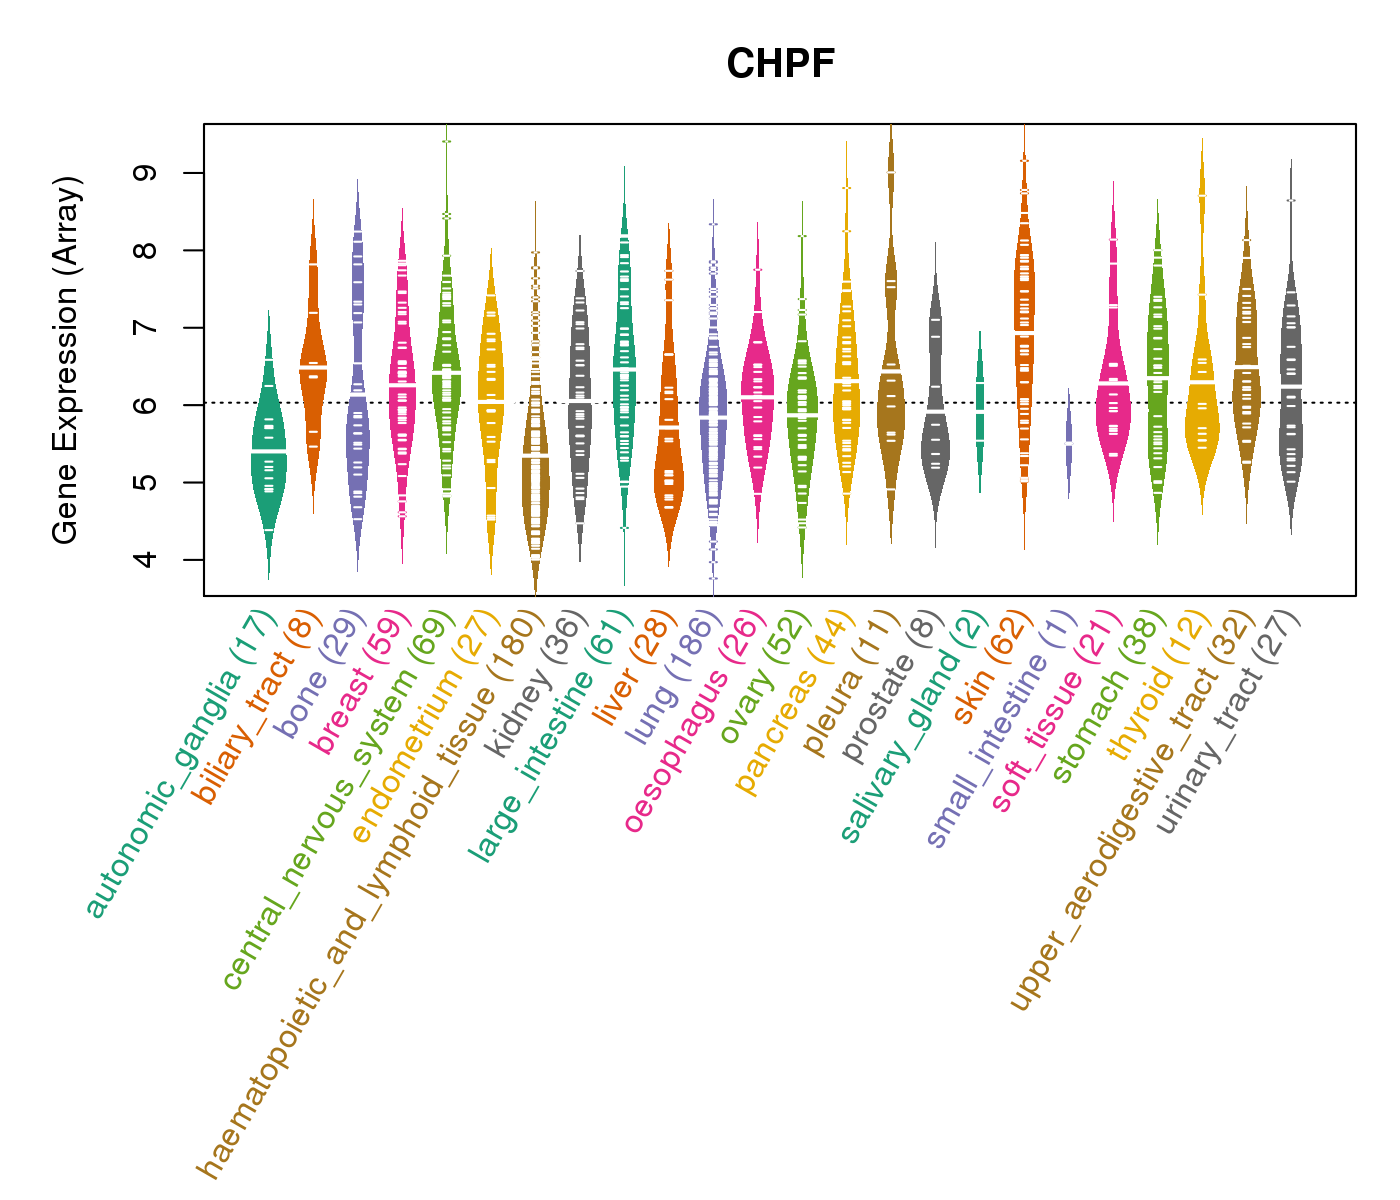
| Gene Expression for CHPF |
| * CCLE gene expression data were extracted from CCLE_Expression_Entrez_2012-10-18.res: Gene-centric RMA-normalized mRNA expression data. |
 |
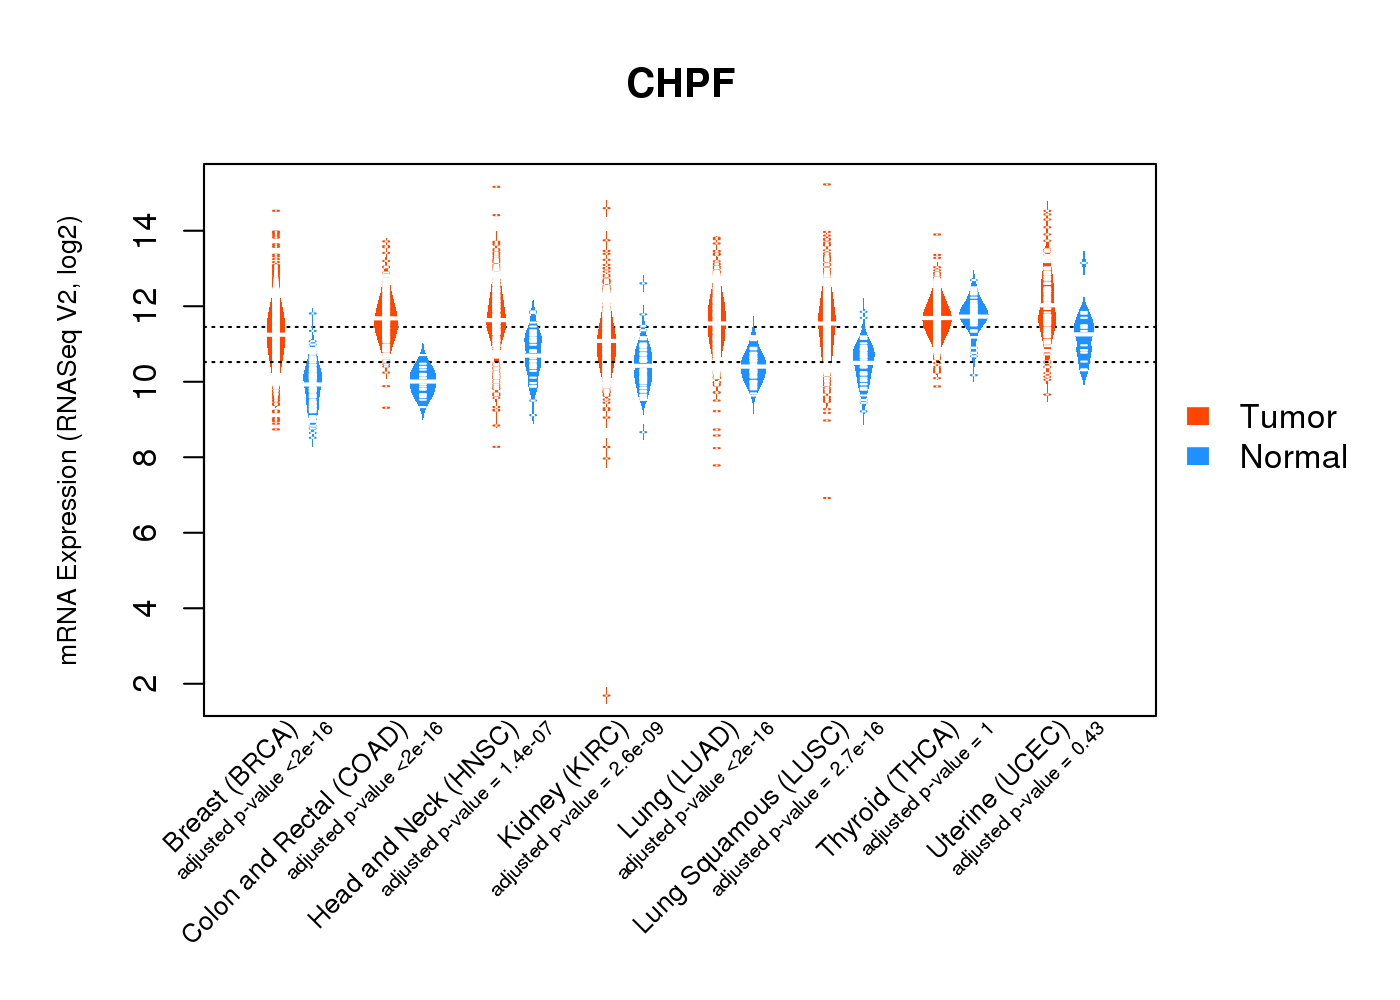
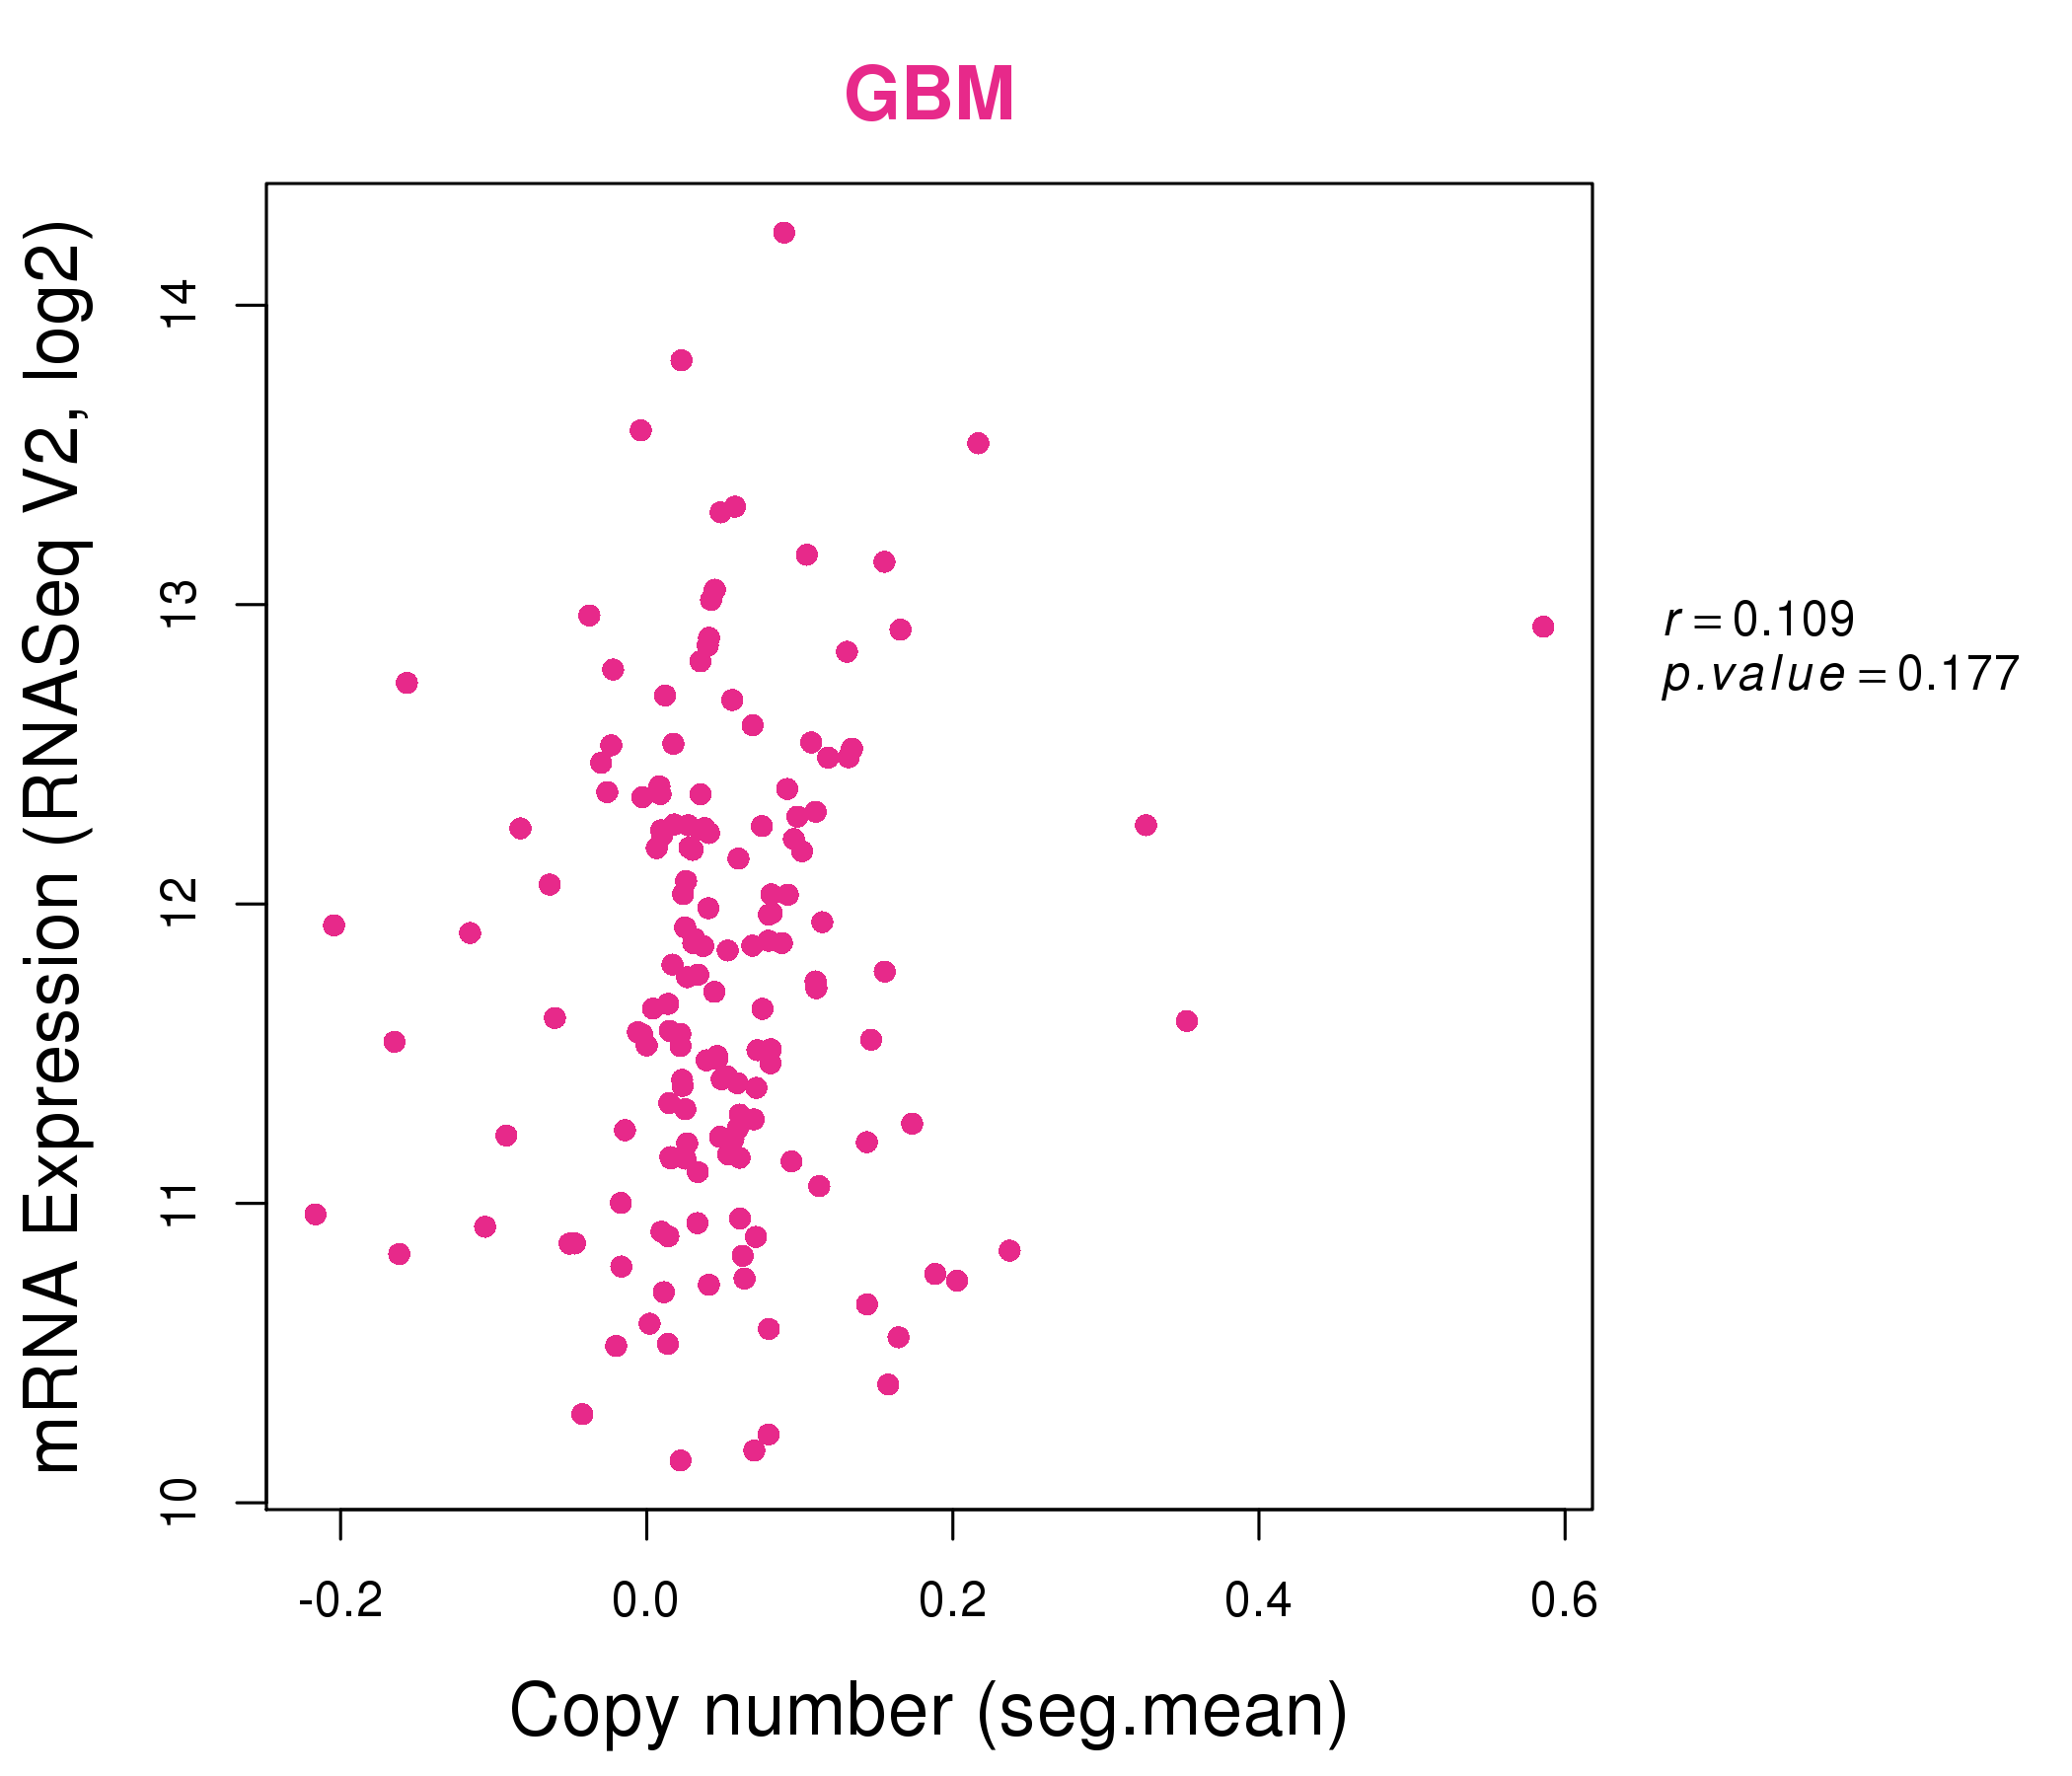
| * Normalized gene expression data of RNASeqV2 was extracted from TCGA using R package TCGA-Assembler. The URLs of all public data files on TCGA DCC data server were gathered at Jan-05-2015. Only eight cancer types have enough normal control samples for differential expression analysis. (t test, adjusted p<0.05 (using Benjamini-Hochberg FDR)) |
 |
| Top |
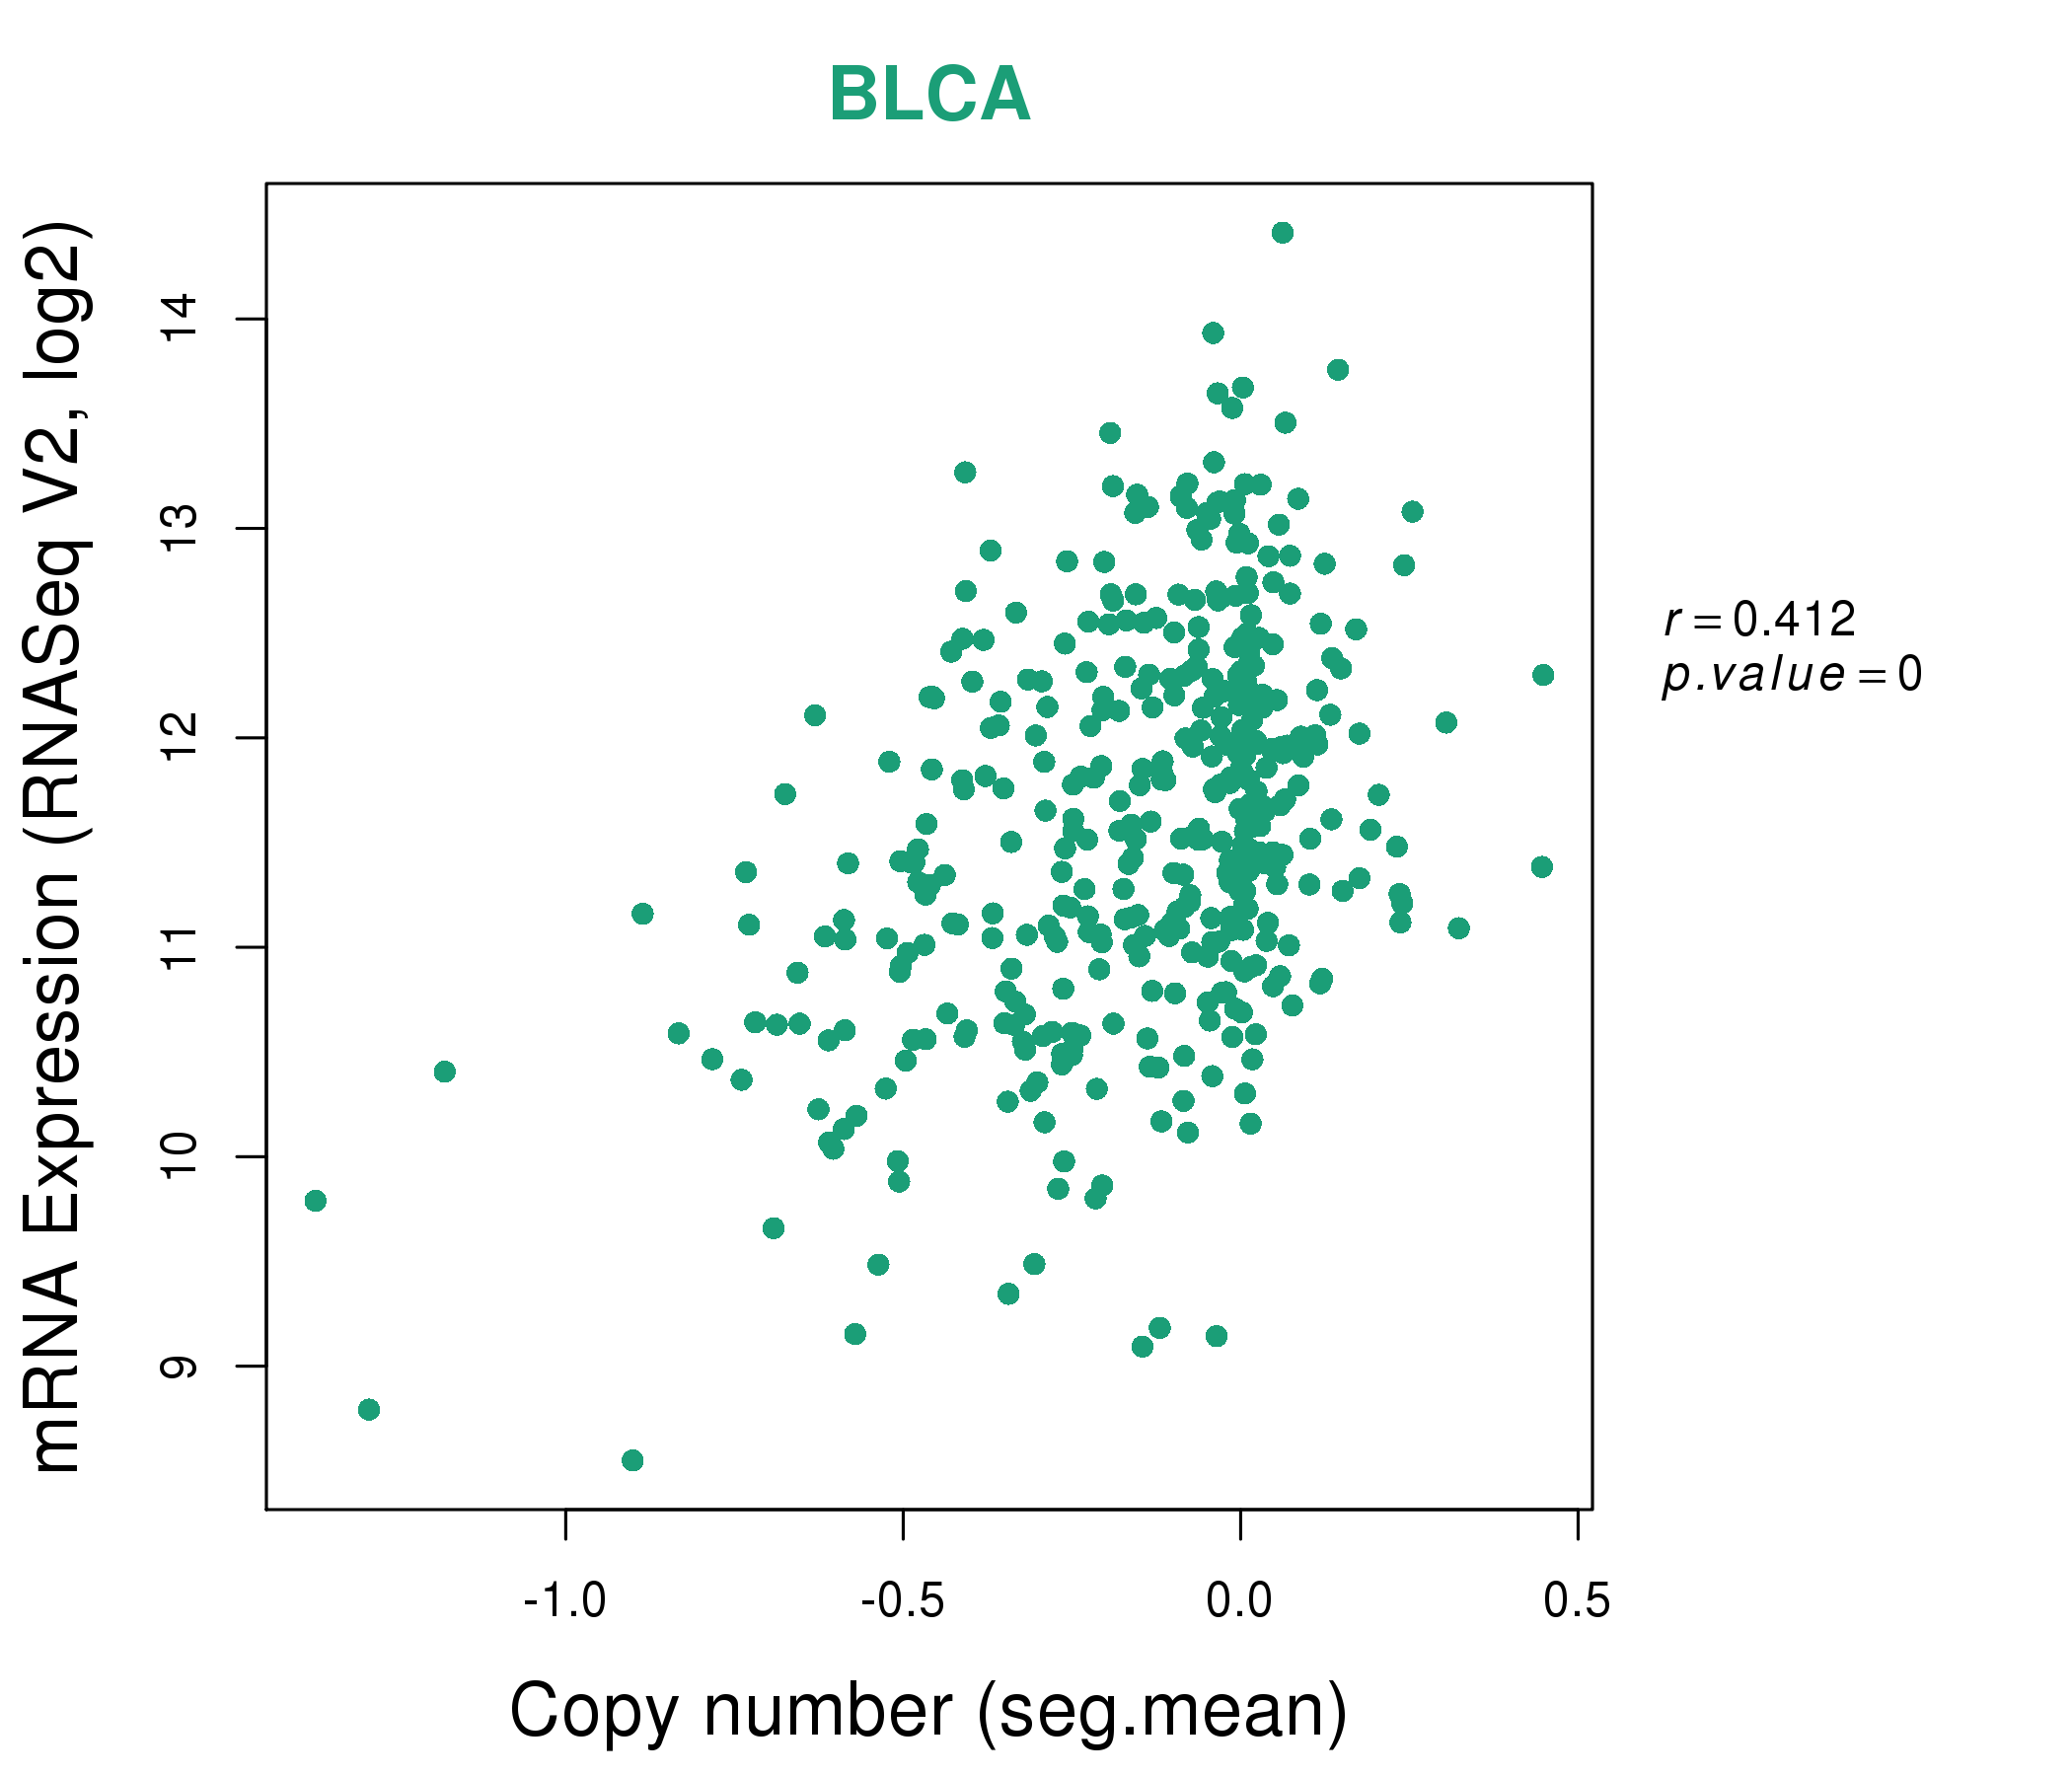
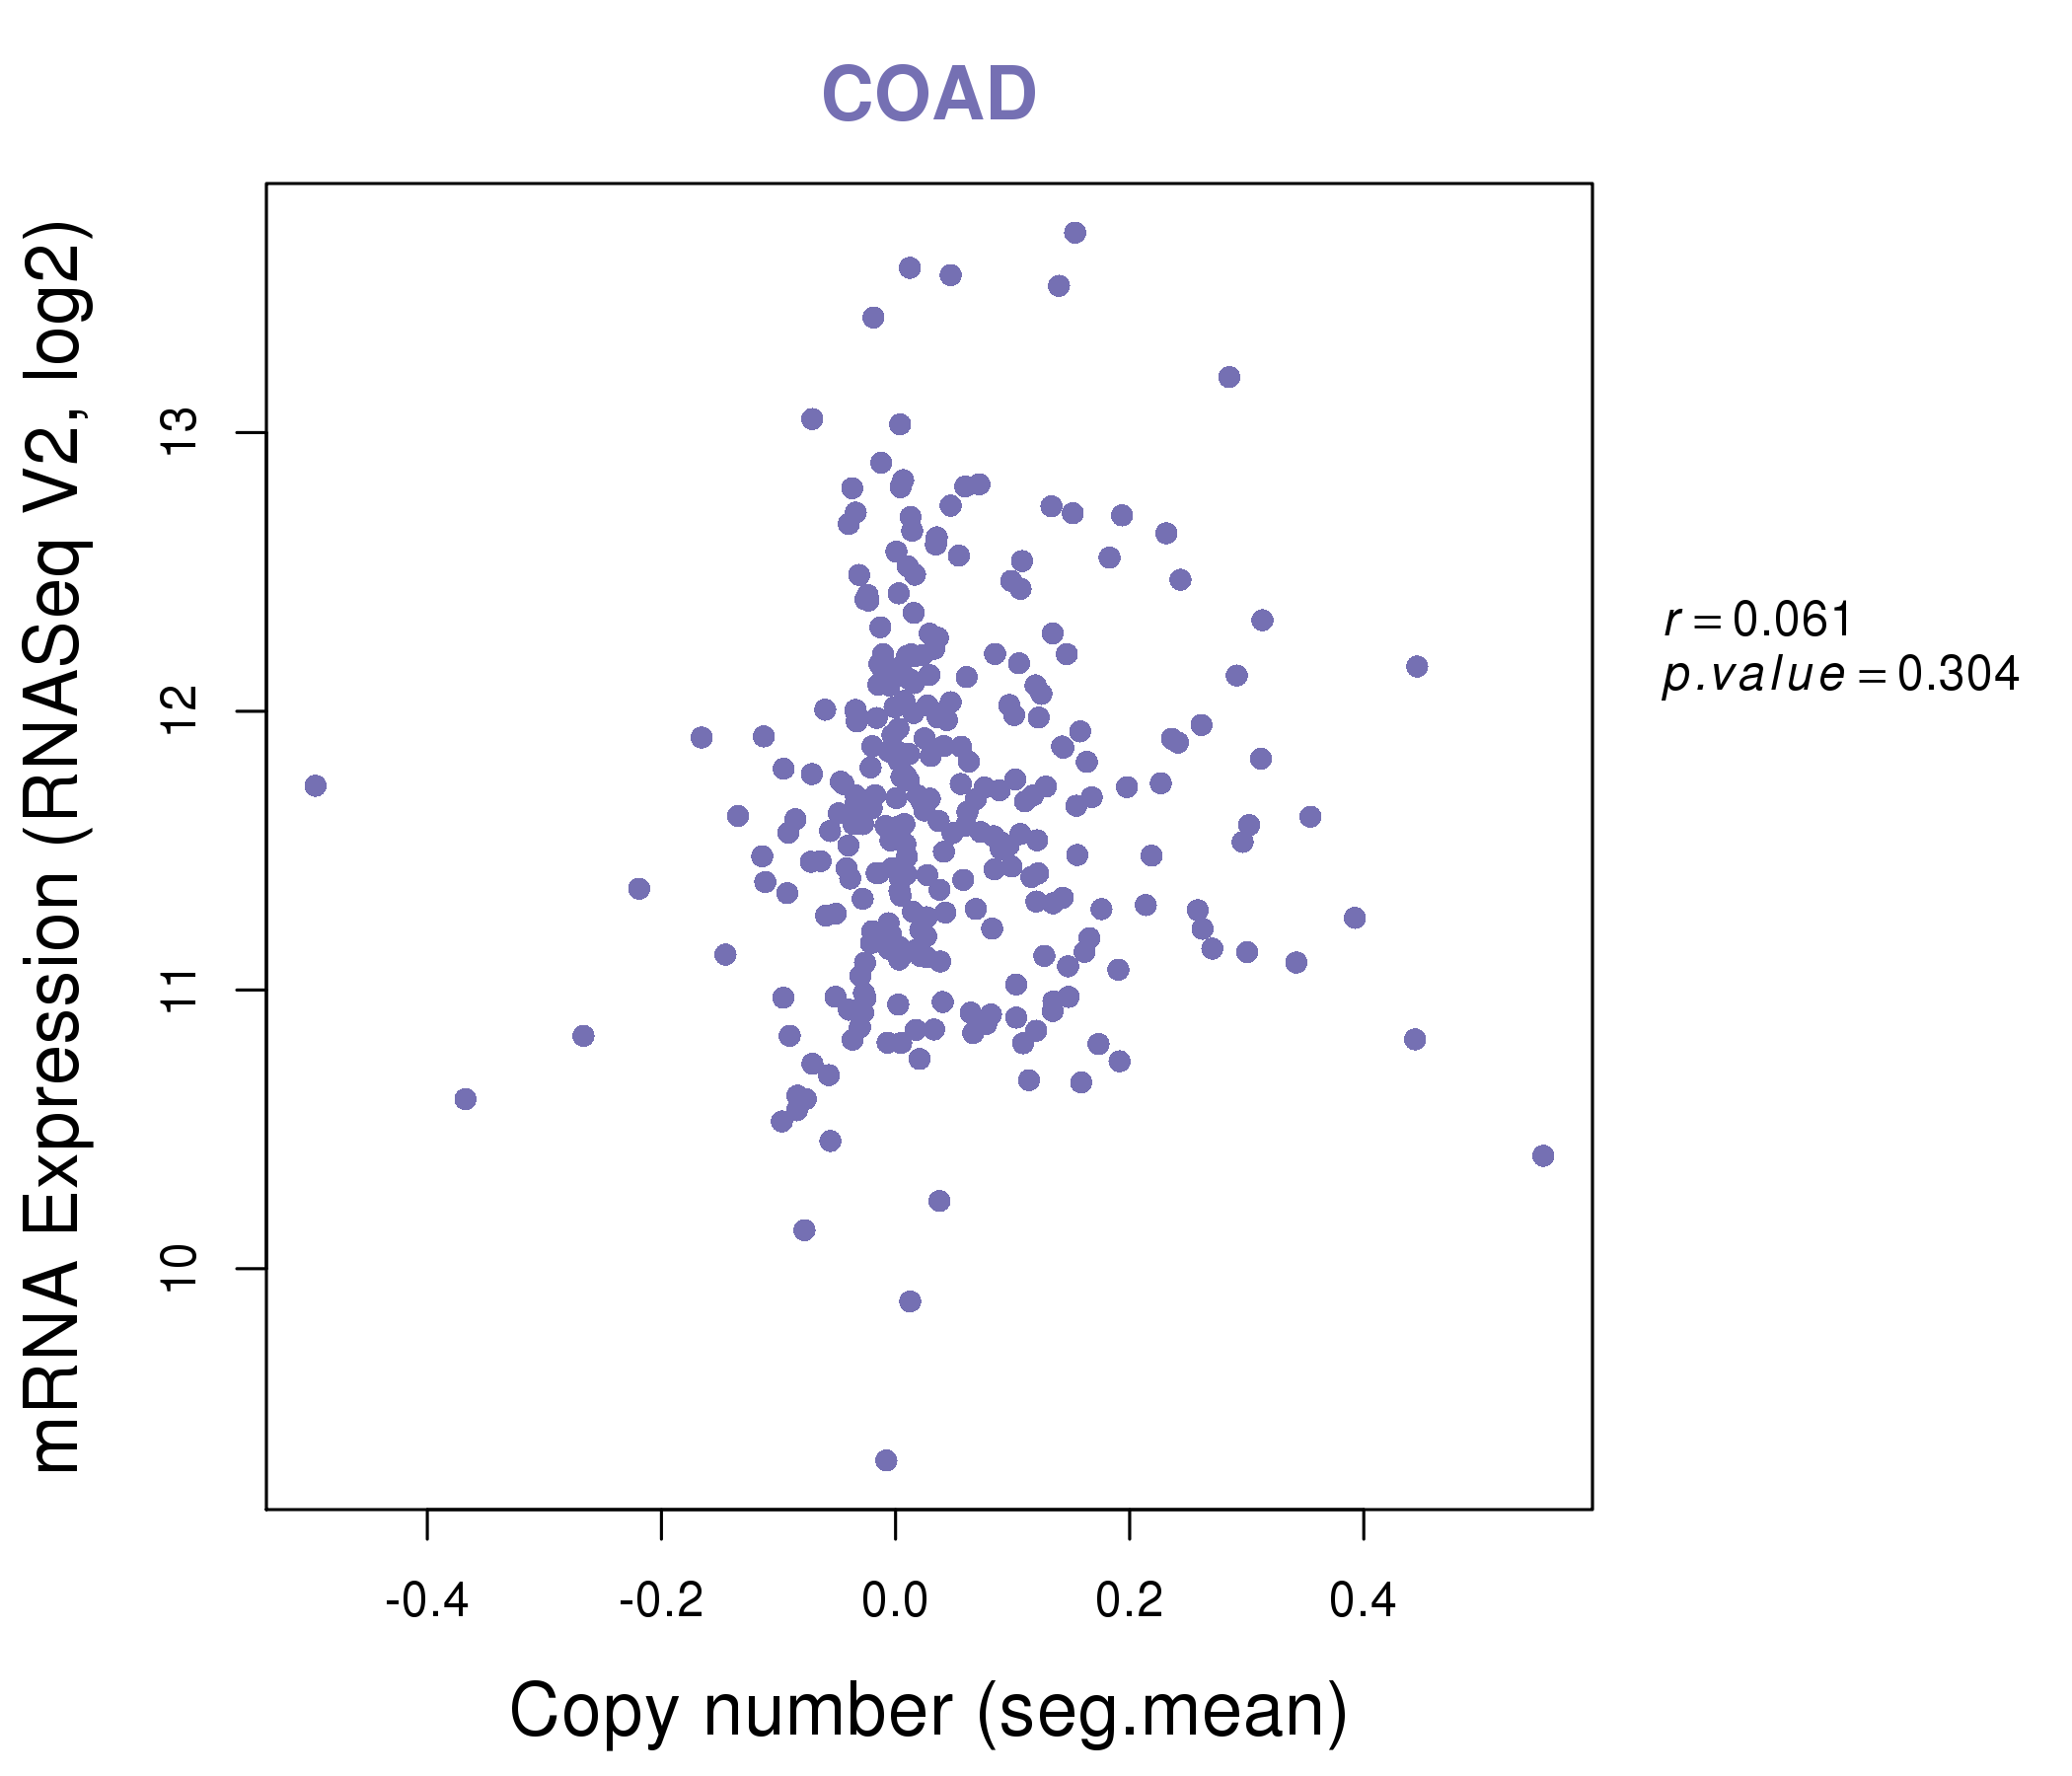
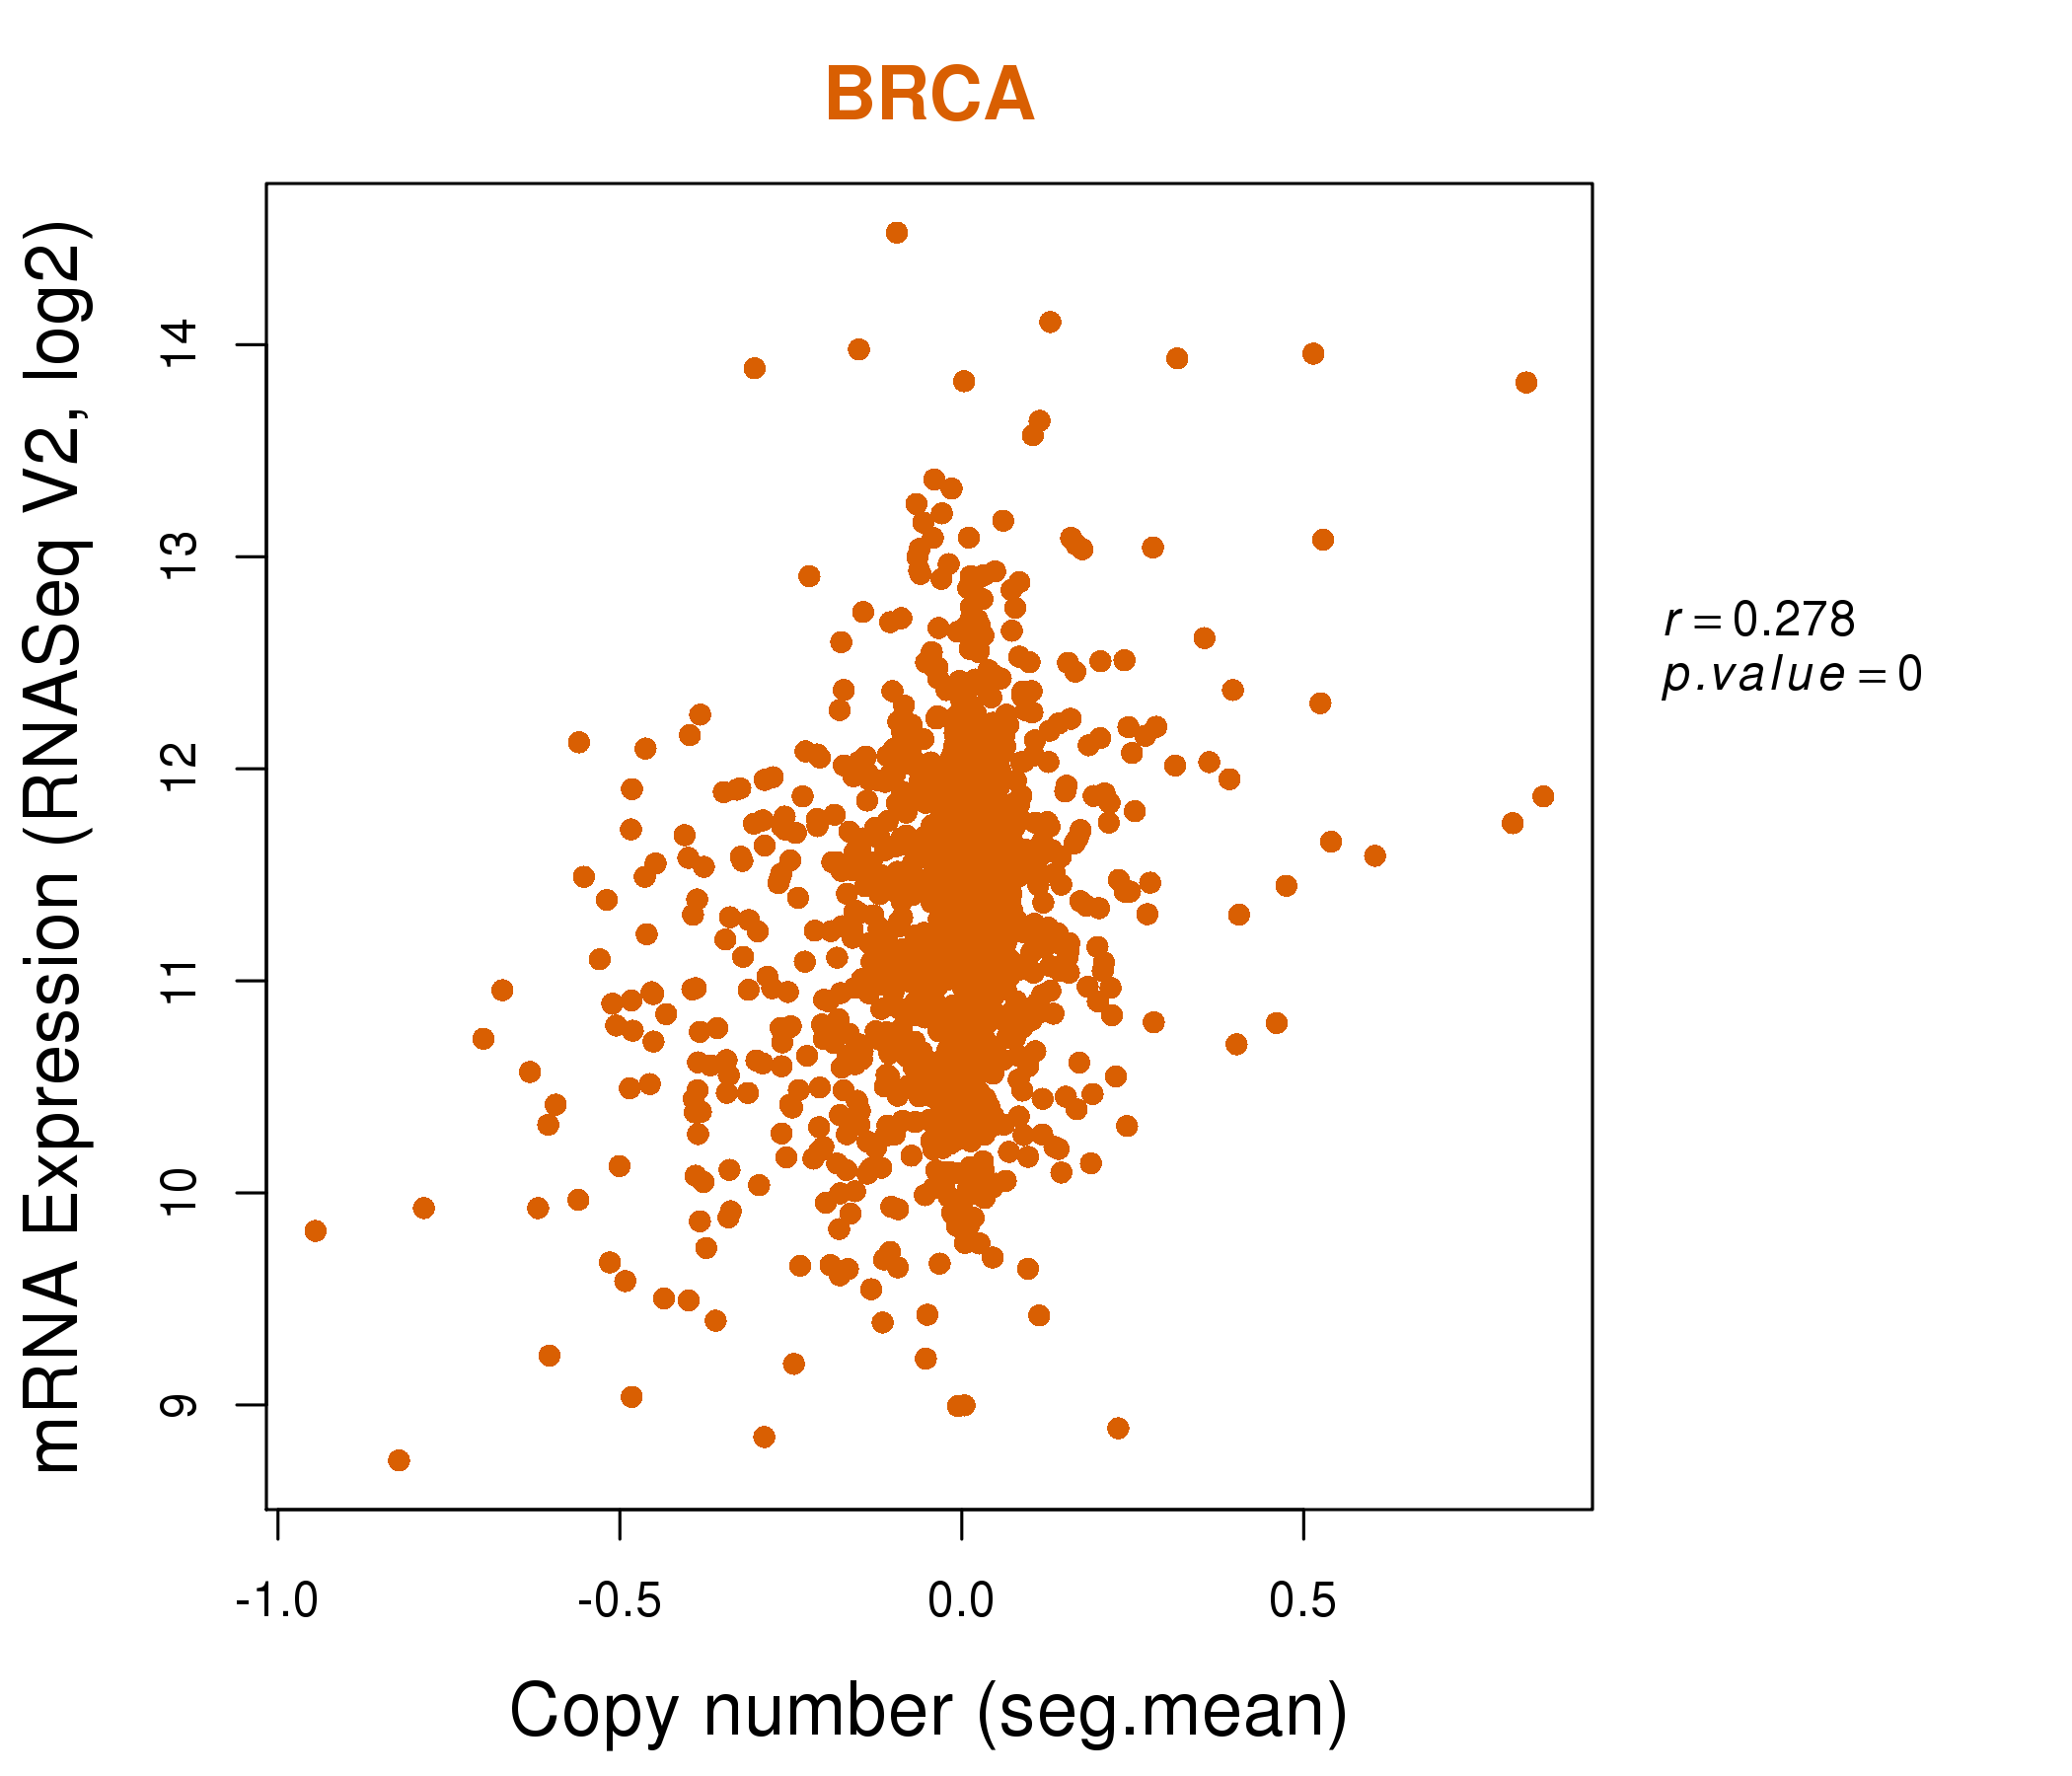
| * This plots show the correlation between CNV and gene expression. |
: Open all plots for all cancer types
 |
|
 |
|
| Top |
| Gene-Gene Network Information |
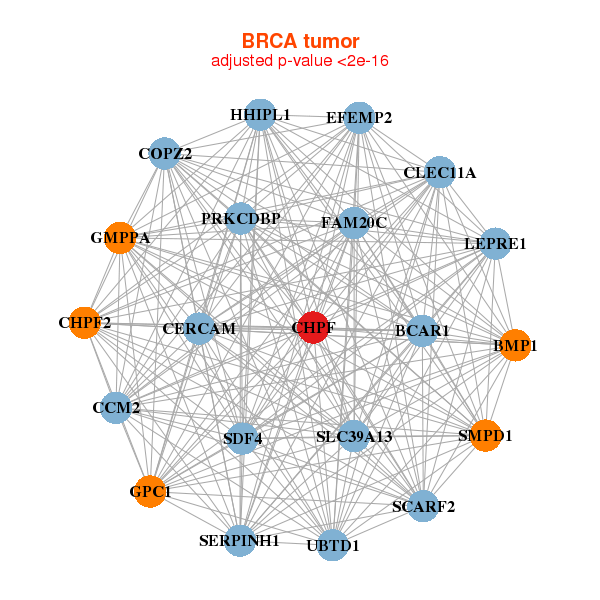
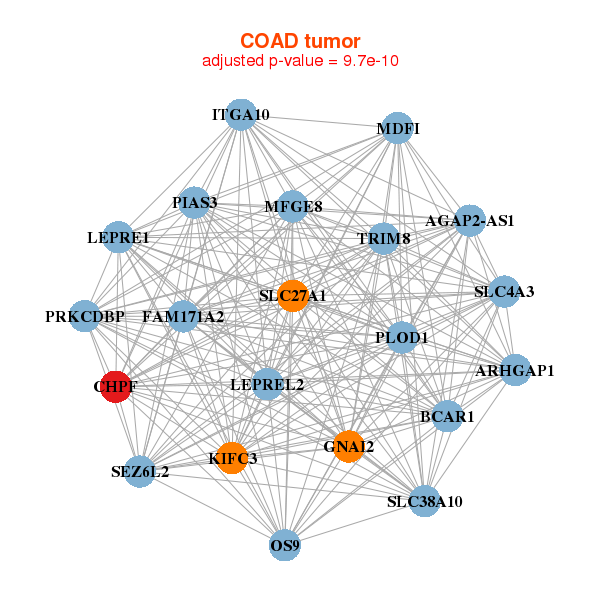
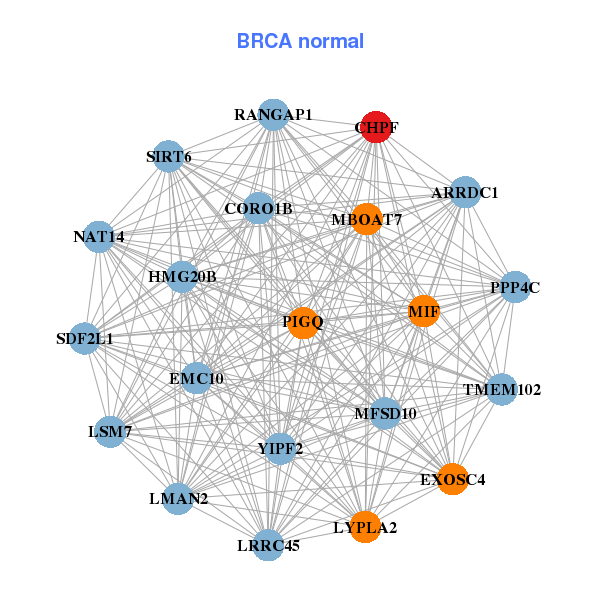
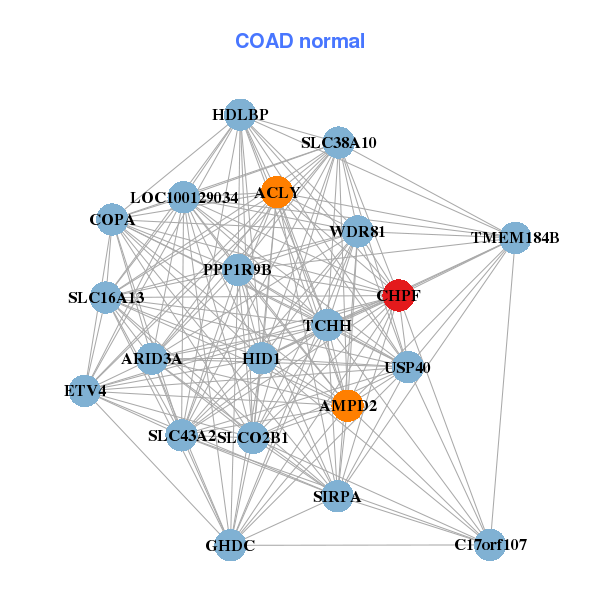
| * Co-Expression network figures were drawn using R package igraph. Only the top 20 genes with the highest correlations were shown. Red circle: input gene, orange circle: cell metabolism gene, sky circle: other gene |
: Open all plots for all cancer types
 |
|
| AGAP3,BMP1,CCM2,CHPF2,CHPF,CHST12,FASTK, AP5Z1,KIFC3,LEPRE1,MGAT1,MOGS,PLOD3,SDF4, SERPINH1,SLC12A9,SLC39A13,TMUB1,VASN,ZNF282,ZNF777 | C17orf70,CAPN1,CHPF2,CHPF,CTDP1,FAM129B,FRMD8, GAK,GATAD2A,GPSM1,NACC1,ORAI2,PITPNM1,RANGAP1, SEPT9,SLC12A9,ST14,TCF3,THOC6,TRAF7,U2AF2 |
 |
|
| AGAP3,CHPF2,CHPF,EVA1B,GNA12,GNAI2,IL4R, ITGB5,MGAT1,N4BP1,NCKAP5L,PACS1,PIP5K1C,SHISA4, SLC12A4,SLC39A13,TECPR1,ULK1,VASN,ZER1,ZNF746 | BCAR1,CDC42BPG,CHPF2,CORO7,CTDP1,EPHA10,FAM83E, FAM83G,FURIN,GAK,GMIP,GRAMD4,LLGL2,MINK1, PCNXL3,PITPNM1,PPP6R2,CAPN15,TRIM11,WWP2,ZFYVE28 |
| * Co-Expression network figures were drawn using R package igraph. Only the top 20 genes with the highest correlations were shown. Red circle: input gene, orange circle: cell metabolism gene, sky circle: other gene |
: Open all plots for all cancer types
| Top |
: Open all interacting genes' information including KEGG pathway for all interacting genes from DAVID
| Top |
| Pharmacological Information for CHPF |
| There's no related Drug. |
| Top |
| Cross referenced IDs for CHPF |
| * We obtained these cross-references from Uniprot database. It covers 150 different DBs, 18 categories. http://www.uniprot.org/help/cross_references_section |
: Open all cross reference information
|
Copyright © 2016-Present - The Univsersity of Texas Health Science Center at Houston @ |