|
||||||||||||||||||||||||||||||||||||||||||||||||||||||||||||||||||||||||||||||||||||||||||||||||||||||||||||||||||||||||||||||||||||||||||||||||||||||||||||||||||||||||||||||||||||||||||||||||||||||||||||||||||||||||||||||||||||||||||||||||||||||||||||||||||||||||||||||||||||||||||||||||||||||||||||||||||||||||||
| |
| Phenotypic Information (metabolism pathway, cancer, disease, phenome) |
| |
| |
| Gene-Gene Network Information: Co-Expression Network, Interacting Genes & KEGG |
| |
|


| Gene Summary for ACSS3 |
| Top |
| Phenotypic Information for ACSS3(metabolism pathway, cancer, disease, phenome) |
| Cancer | CGAP: ACSS3 |
| Familial Cancer Database: ACSS3 | |
| * This gene is included in those cancer gene databases. |
|
|
|
|
|
|
| ||||||||||||||||||||||||||||||||||||||||||||||||||||||||||||||||||||||||||||||||||||||||||||||||||||||||||||||||||||||||||||||||||||||||||||||||||||||||||||||||||||||||||||||||||||||||||||||||||||||||||||||||||||||||||||||||||||||||||||||||||||||||||||||||||||||||||||||||||||||||||||||||||||||||||||||||||||
Oncogene 1 | Significant driver gene in | |||||||||||||||||||||||||||||||||||||||||||||||||||||||||||||||||||||||||||||||||||||||||||||||||||||||||||||||||||||||||||||||||||||||||||||||||||||||||||||||||||||||||||||||||||||||||||||||||||||||||||||||||||||||||||||||||||||||||||||||||||||||||||||||||||||||||||||||||||||||||||||||||||||||||||||||||||||||||
| cf) number; DB name 1 Oncogene; http://nar.oxfordjournals.org/content/35/suppl_1/D721.long, 2 Tumor Suppressor gene; https://bioinfo.uth.edu/TSGene/, 3 Cancer Gene Census; http://www.nature.com/nrc/journal/v4/n3/abs/nrc1299.html, 4 CancerGenes; http://nar.oxfordjournals.org/content/35/suppl_1/D721.long, 5 Network of Cancer Gene; http://ncg.kcl.ac.uk/index.php, 1Therapeutic Vulnerabilities in Cancer; http://cbio.mskcc.org/cancergenomics/statius/ |
| KEGG_PROPANOATE_METABOLISM | |
| OMIM | |
| Orphanet | |
| Disease | KEGG Disease: ACSS3 |
| MedGen: ACSS3 (Human Medical Genetics with Condition) | |
| ClinVar: ACSS3 | |
| Phenotype | MGI: ACSS3 (International Mouse Phenotyping Consortium) |
| PhenomicDB: ACSS3 | |
| Mutations for ACSS3 |
| * Under tables are showing count per each tissue to give us broad intuition about tissue specific mutation patterns.You can go to the detailed page for each mutation database's web site. |
| - Statistics for Tissue and Mutation type | Top |
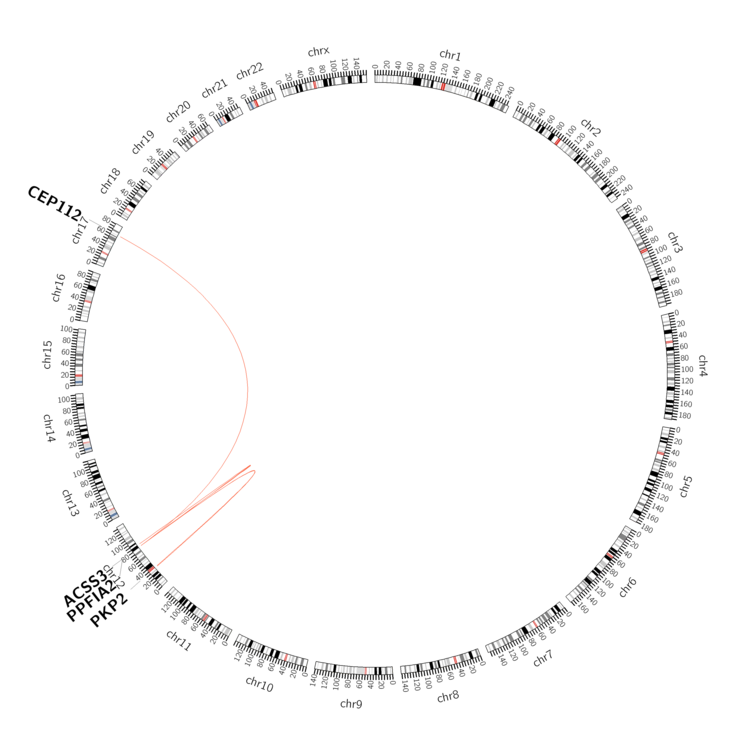 |
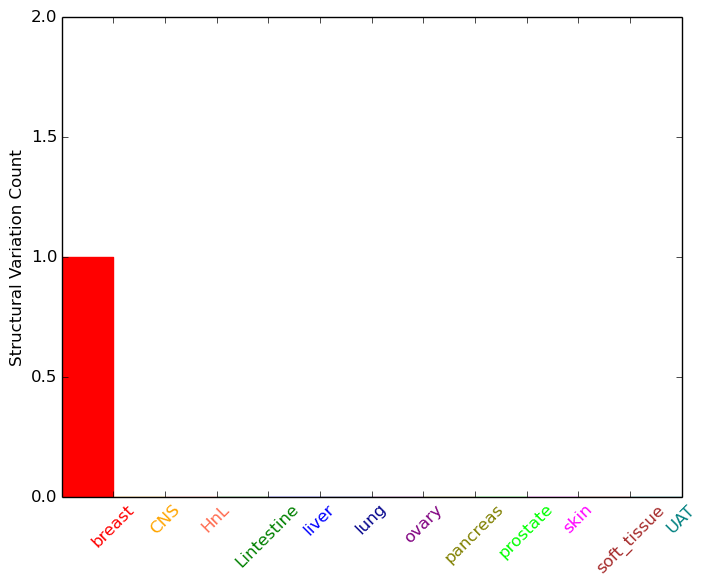
| - For Inter-chromosomal Variations |
| * Inter-chromosomal variantions includes 'interchromosomal amplicon to amplicon', 'interchromosomal amplicon to non-amplified dna', 'interchromosomal insertion', 'Interchromosomal unknown type'. |
 |
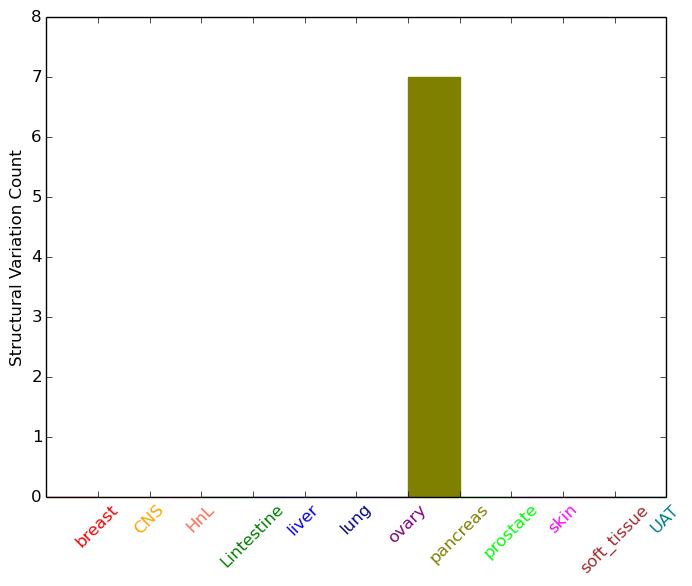
| - For Intra-chromosomal Variations |
| * Intra-chromosomal variantions includes 'intrachromosomal amplicon to amplicon', 'intrachromosomal amplicon to non-amplified dna', 'intrachromosomal deletion', 'intrachromosomal fold-back inversion', 'intrachromosomal inversion', 'intrachromosomal tandem duplication', 'Intrachromosomal unknown type', 'intrachromosomal with inverted orientation', 'intrachromosomal with non-inverted orientation'. |
 |
| Sample | Symbol_a | Chr_a | Start_a | End_a | Symbol_b | Chr_b | Start_b | End_b |
| breast | ACSS3 | chr12 | 81587845 | 81588245 | CEP112 | chr17 | 63948178 | 63948578 |
| pancreas | ACSS3 | chr12 | 81479391 | 81479411 | PKP2 | chr12 | 32952829 | 32952849 |
| pancreas | ACSS3 | chr12 | 81489983 | 81490003 | chr12 | 85846409 | 85846429 | |
| pancreas | ACSS3 | chr12 | 81490511 | 81490531 | ACSS3 | chr12 | 81490836 | 81490856 |
| pancreas | ACSS3 | chr12 | 81507943 | 81507963 | chr12 | 81431514 | 81431534 | |
| pancreas | ACSS3 | chr12 | 81527413 | 81527433 | chr12 | 34067790 | 34067810 | |
| pancreas | ACSS3 | chr12 | 81596525 | 81596545 | PPFIA2 | chr12 | 81678351 | 81678371 |
| pancreas | ACSS3 | chr12 | 81603456 | 81603476 | ACSS3 | chr12 | 81596396 | 81596416 |
| cf) Tissue number; Tissue name (1;Breast, 2;Central_nervous_system, 3;Haematopoietic_and_lymphoid_tissue, 4;Large_intestine, 5;Liver, 6;Lung, 7;Ovary, 8;Pancreas, 9;Prostate, 10;Skin, 11;Soft_tissue, 12;Upper_aerodigestive_tract) |
| * From mRNA Sanger sequences, Chitars2.0 arranged chimeric transcripts. This table shows ACSS3 related fusion information. |
| ID | Head Gene | Tail Gene | Accession | Gene_a | qStart_a | qEnd_a | Chromosome_a | tStart_a | tEnd_a | Gene_a | qStart_a | qEnd_a | Chromosome_a | tStart_a | tEnd_a |
| AI871518 | SMARCD2 | 1 | 332 | 17 | 61909444 | 61909772 | ACSS3 | 317 | 337 | 12 | 81612754 | 81612774 | |
| Top |
| Mutation type/ Tissue ID | brca | cns | cerv | endome | haematopo | kidn | Lintest | liver | lung | ns | ovary | pancre | prost | skin | stoma | thyro | urina | |||
| Total # sample | 1 | 1 | 1 | 1 | 1 | |||||||||||||||
| GAIN (# sample) | 1 | 1 | 1 | 1 | 1 | |||||||||||||||
| LOSS (# sample) |
| cf) Tissue ID; Tissue type (1; Breast, 2; Central_nervous_system, 3; Cervix, 4; Endometrium, 5; Haematopoietic_and_lymphoid_tissue, 6; Kidney, 7; Large_intestine, 8; Liver, 9; Lung, 10; NS, 11; Ovary, 12; Pancreas, 13; Prostate, 14; Skin, 15; Stomach, 16; Thyroid, 17; Urinary_tract) |
| Top |
|
 |
| Top |
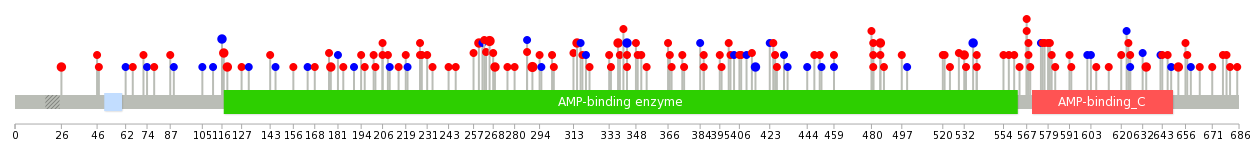
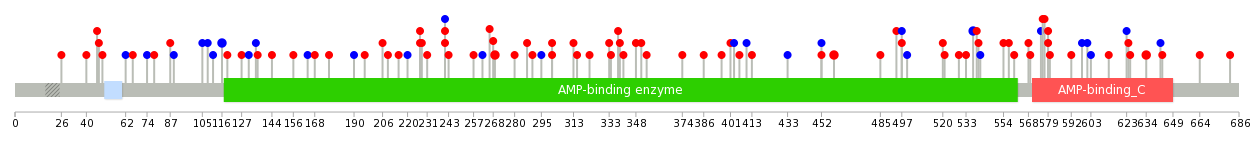
| Stat. for Non-Synonymous SNVs (# total SNVs=89) | (# total SNVs=25) |
 |  |
(# total SNVs=3) | (# total SNVs=0) |
 |
| Top |
| * When you move the cursor on each content, you can see more deailed mutation information on the Tooltip. Those are primary_site,primary_histology,mutation(aa),pubmedID. |
| GRCh37 position | Mutation(aa) | Unique sampleID count |
| chr12:81647354-81647354 | p.R634* | 4 |
| chr12:81536902-81536902 | p.A266V | 3 |
| chr12:81536974-81536974 | p.S290L | 3 |
| chr12:81648681-81648681 | p.E681* | 2 |
| chr12:81503375-81503375 | p.A116A | 2 |
| chr12:81545790-81545790 | p.A338E | 2 |
| chr12:81503376-81503376 | p.V117I | 2 |
| chr12:81647408-81647408 | p.R652G | 2 |
| chr12:81624915-81624915 | p.P532S | 2 |
| chr12:81537028-81537028 | p.? | 2 |
| Top |
|
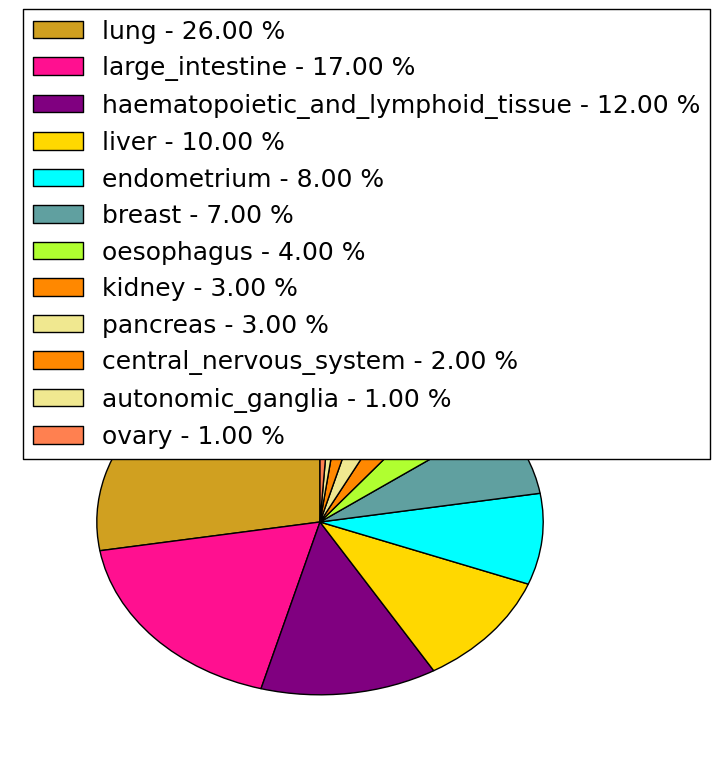
 |
| Point Mutation/ Tissue ID | 1 | 2 | 3 | 4 | 5 | 6 | 7 | 8 | 9 | 10 | 11 | 12 | 13 | 14 | 15 | 16 | 17 | 18 | 19 | 20 |
| # sample | 5 | 4 | 13 | 11 | 1 | 1 | 12 | 8 | 1 | 24 | 6 | 8 | ||||||||
| # mutation | 5 | 4 | 13 | 10 | 1 | 1 | 14 | 8 | 1 | 35 | 7 | 9 | ||||||||
| nonsynonymous SNV | 3 | 3 | 8 | 7 | 1 | 1 | 8 | 7 | 27 | 6 | 8 | |||||||||
| synonymous SNV | 2 | 1 | 5 | 3 | 6 | 1 | 1 | 8 | 1 | 1 |
| cf) Tissue ID; Tissue type (1; BLCA[Bladder Urothelial Carcinoma], 2; BRCA[Breast invasive carcinoma], 3; CESC[Cervical squamous cell carcinoma and endocervical adenocarcinoma], 4; COAD[Colon adenocarcinoma], 5; GBM[Glioblastoma multiforme], 6; Glioma Low Grade, 7; HNSC[Head and Neck squamous cell carcinoma], 8; KICH[Kidney Chromophobe], 9; KIRC[Kidney renal clear cell carcinoma], 10; KIRP[Kidney renal papillary cell carcinoma], 11; LAML[Acute Myeloid Leukemia], 12; LUAD[Lung adenocarcinoma], 13; LUSC[Lung squamous cell carcinoma], 14; OV[Ovarian serous cystadenocarcinoma ], 15; PAAD[Pancreatic adenocarcinoma], 16; PRAD[Prostate adenocarcinoma], 17; SKCM[Skin Cutaneous Melanoma], 18:STAD[Stomach adenocarcinoma], 19:THCA[Thyroid carcinoma], 20:UCEC[Uterine Corpus Endometrial Carcinoma]) |
| Top |
| * We represented just top 10 SNVs. When you move the cursor on each content, you can see more deailed mutation information on the Tooltip. Those are primary_site, primary_histology, mutation(aa), pubmedID. |
| Genomic Position | Mutation(aa) | Unique sampleID count |
| chr12:81503375 | p.E452E | 2 |
| chr12:81610681 | p.R634Q | 2 |
| chr12:81537007 | p.A459V | 2 |
| chr12:81627142 | p.R269C | 2 |
| chr12:81610701 | p.G579C | 2 |
| chr12:81647355 | p.A116A | 2 |
| chr12:81647101 | p.T537T | 2 |
| chr12:81536910 | p.G301V | 2 |
| chr12:81532986 | p.A241E | 2 |
| chr12:81536990 | p.D557Y | 1 |
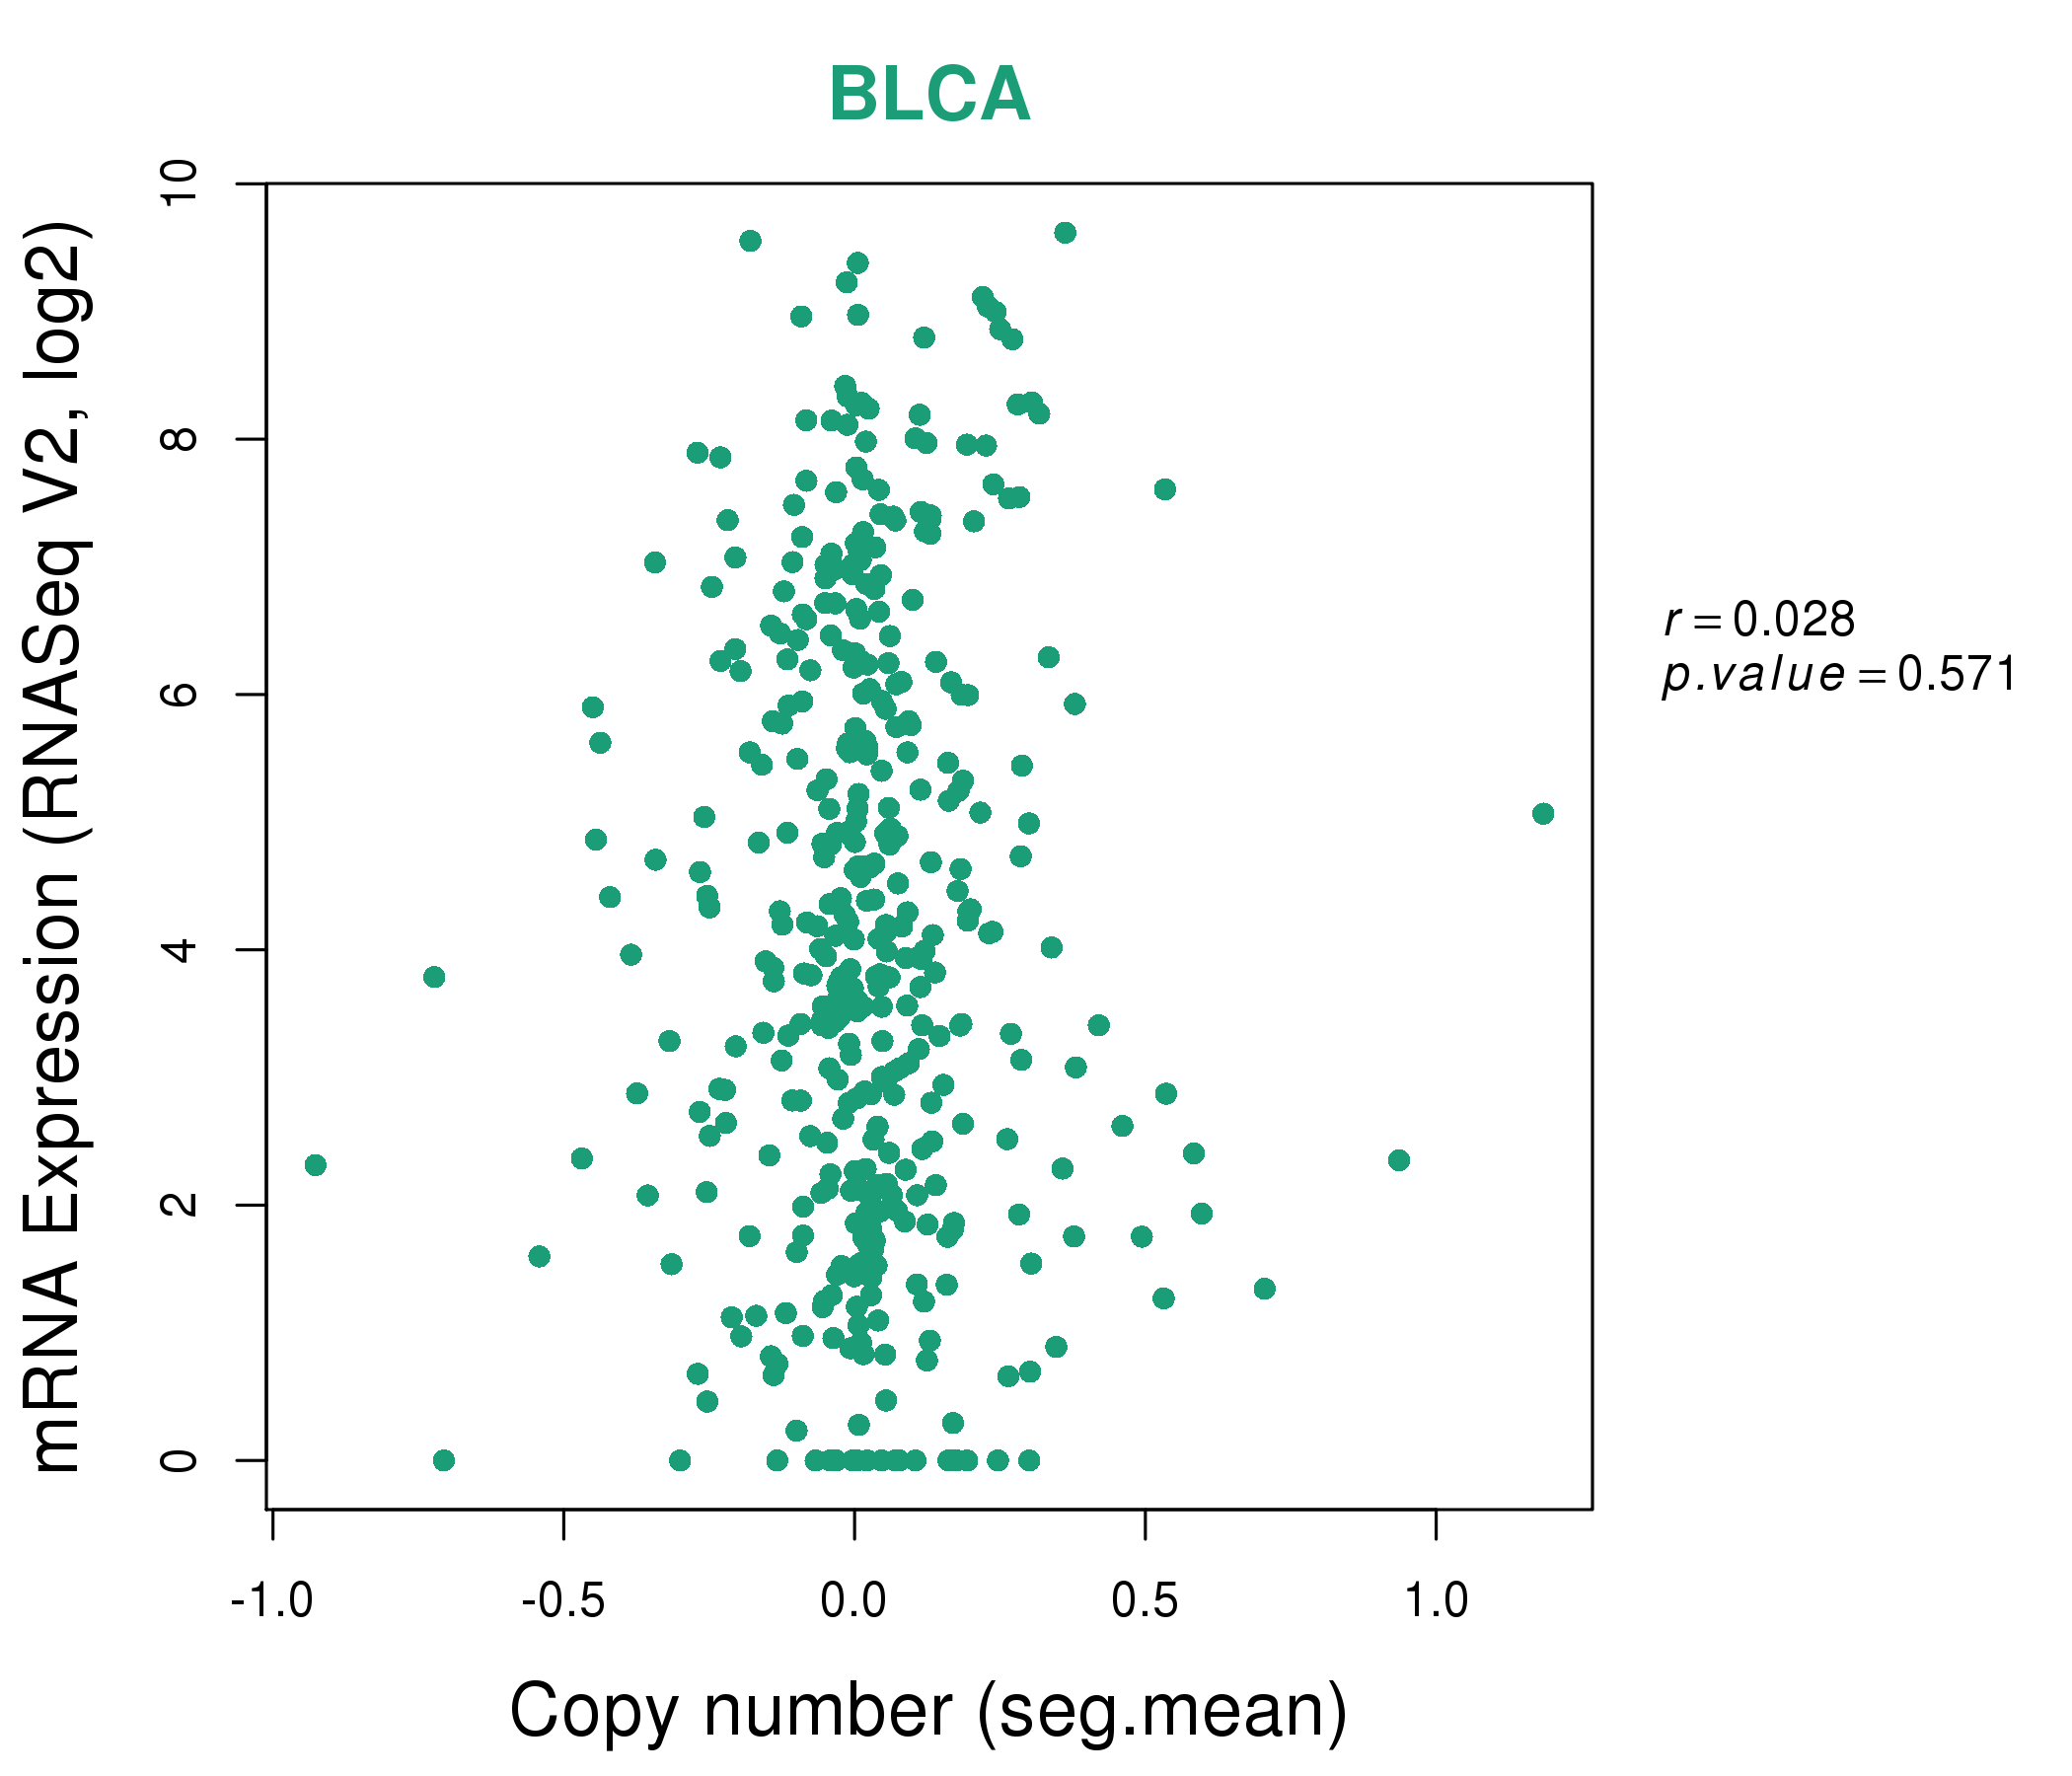
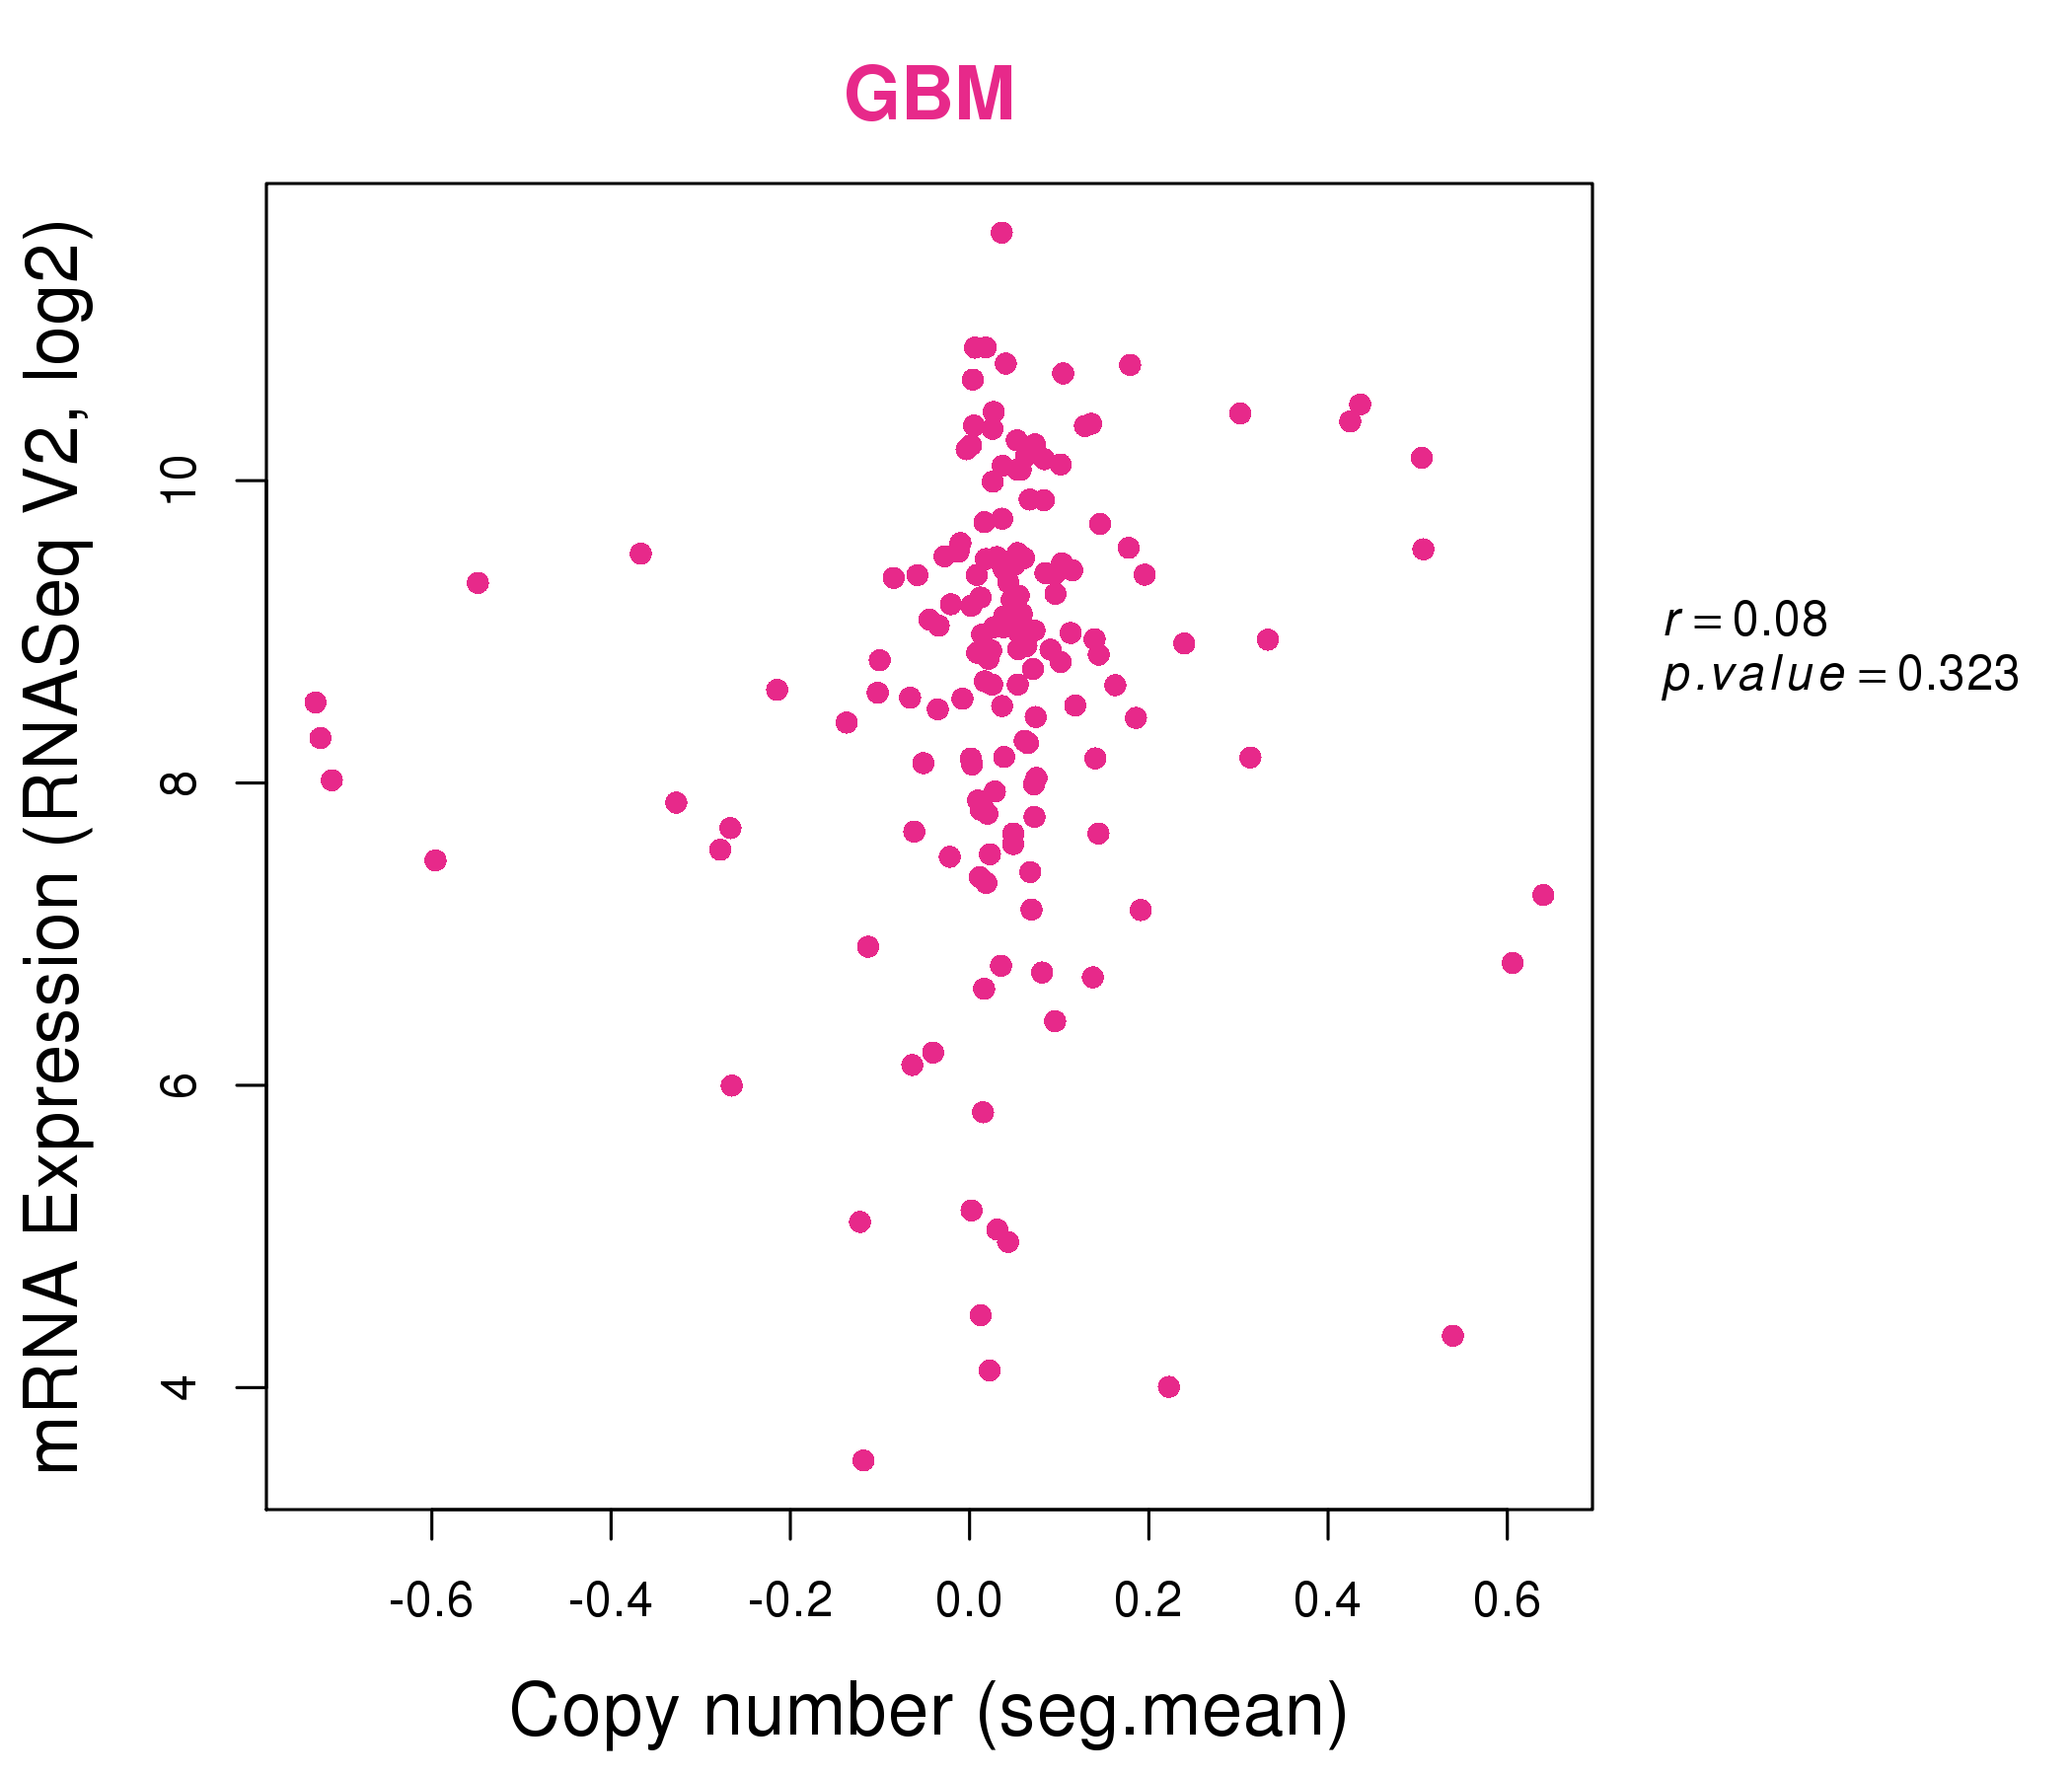
| * Copy number data were extracted from TCGA using R package TCGA-Assembler. The URLs of all public data files on TCGA DCC data server were gathered on Jan-05-2015. Function ProcessCNAData in TCGA-Assembler package was used to obtain gene-level copy number value which is calculated as the average copy number of the genomic region of a gene. |
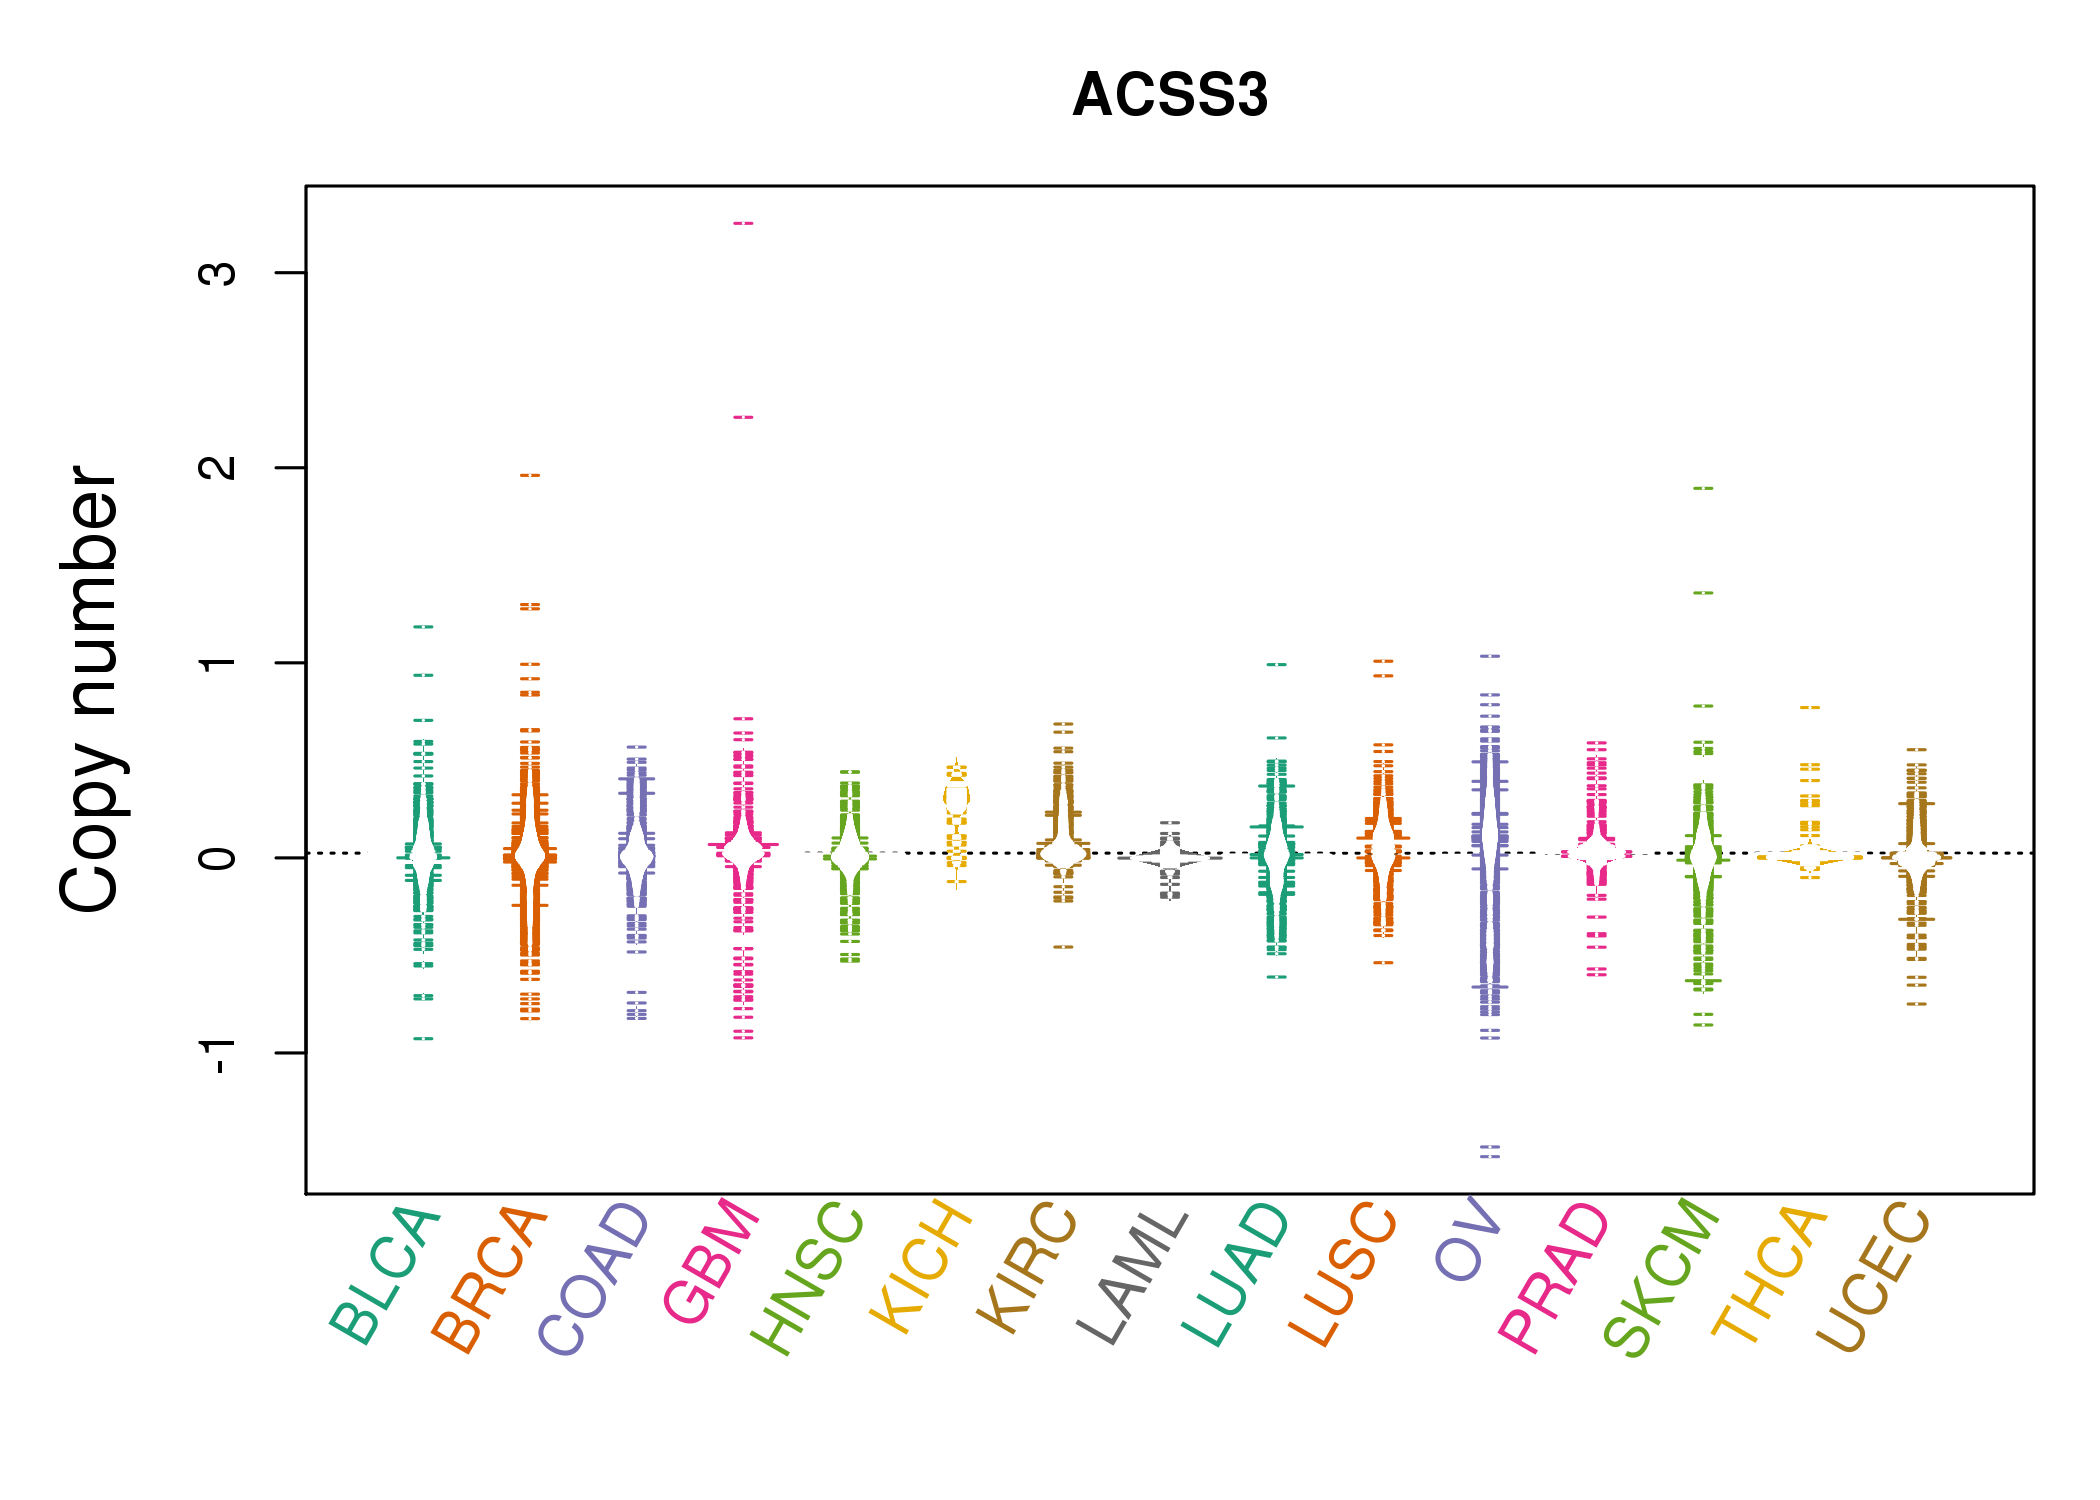 |
| cf) Tissue ID[Tissue type]: BLCA[Bladder Urothelial Carcinoma], BRCA[Breast invasive carcinoma], CESC[Cervical squamous cell carcinoma and endocervical adenocarcinoma], COAD[Colon adenocarcinoma], GBM[Glioblastoma multiforme], Glioma Low Grade, HNSC[Head and Neck squamous cell carcinoma], KICH[Kidney Chromophobe], KIRC[Kidney renal clear cell carcinoma], KIRP[Kidney renal papillary cell carcinoma], LAML[Acute Myeloid Leukemia], LUAD[Lung adenocarcinoma], LUSC[Lung squamous cell carcinoma], OV[Ovarian serous cystadenocarcinoma ], PAAD[Pancreatic adenocarcinoma], PRAD[Prostate adenocarcinoma], SKCM[Skin Cutaneous Melanoma], STAD[Stomach adenocarcinoma], THCA[Thyroid carcinoma], UCEC[Uterine Corpus Endometrial Carcinoma] |
| Top |
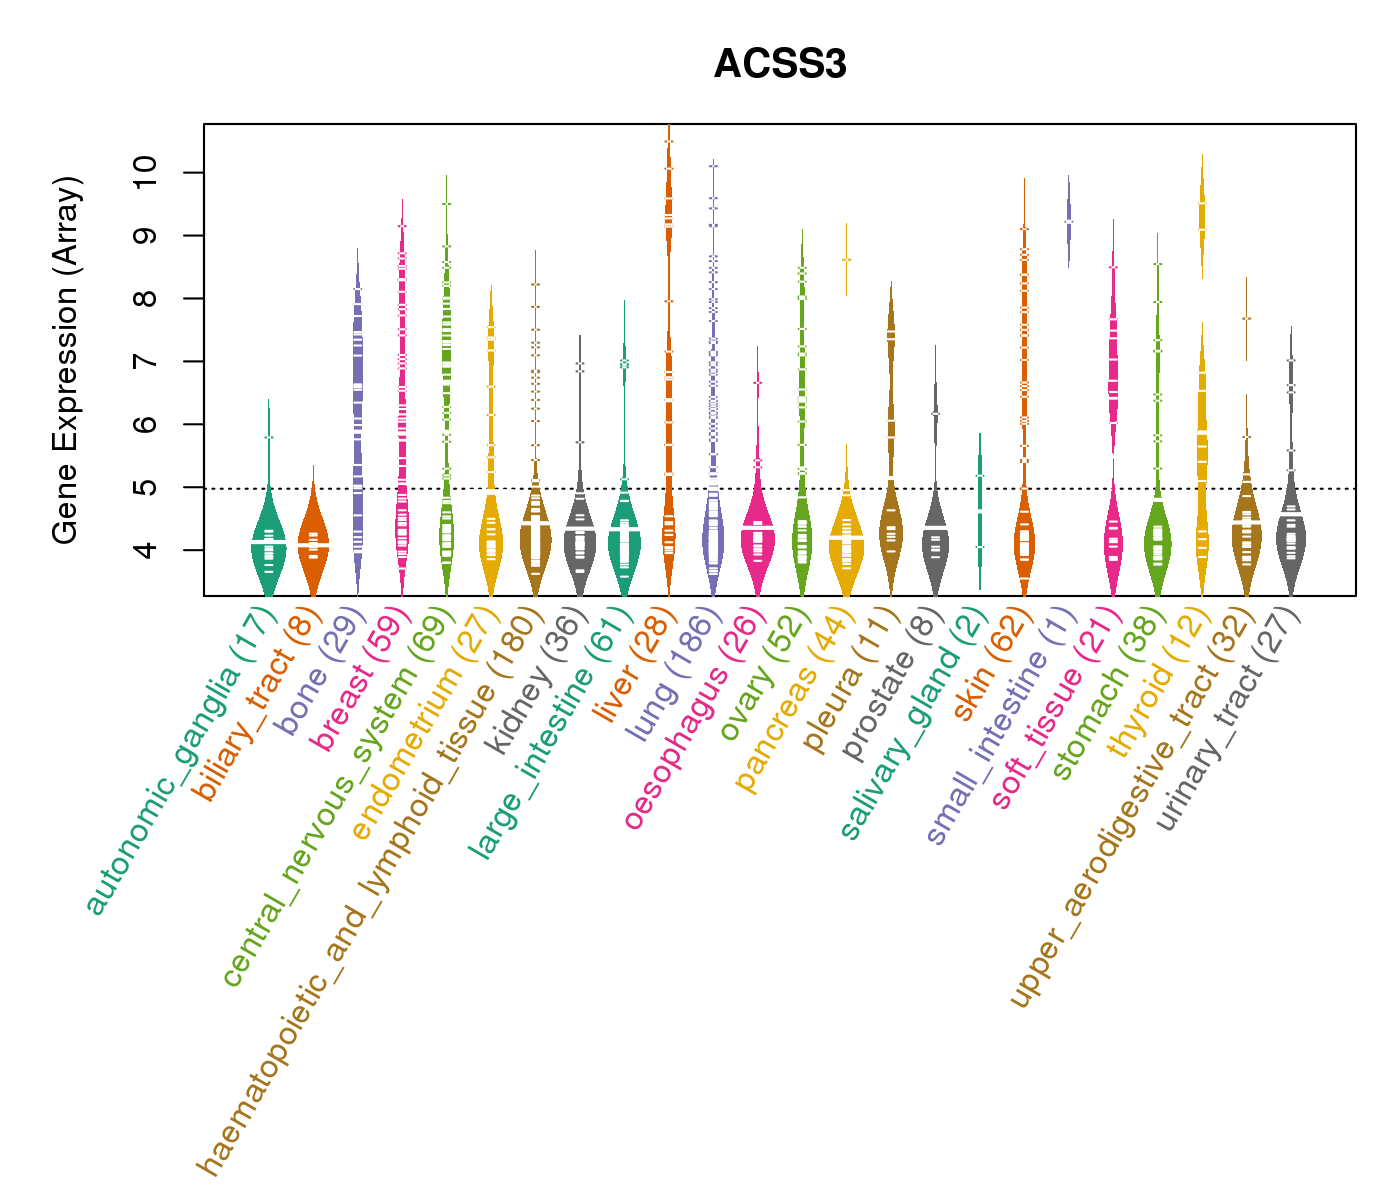
| Gene Expression for ACSS3 |
| * CCLE gene expression data were extracted from CCLE_Expression_Entrez_2012-10-18.res: Gene-centric RMA-normalized mRNA expression data. |
 |
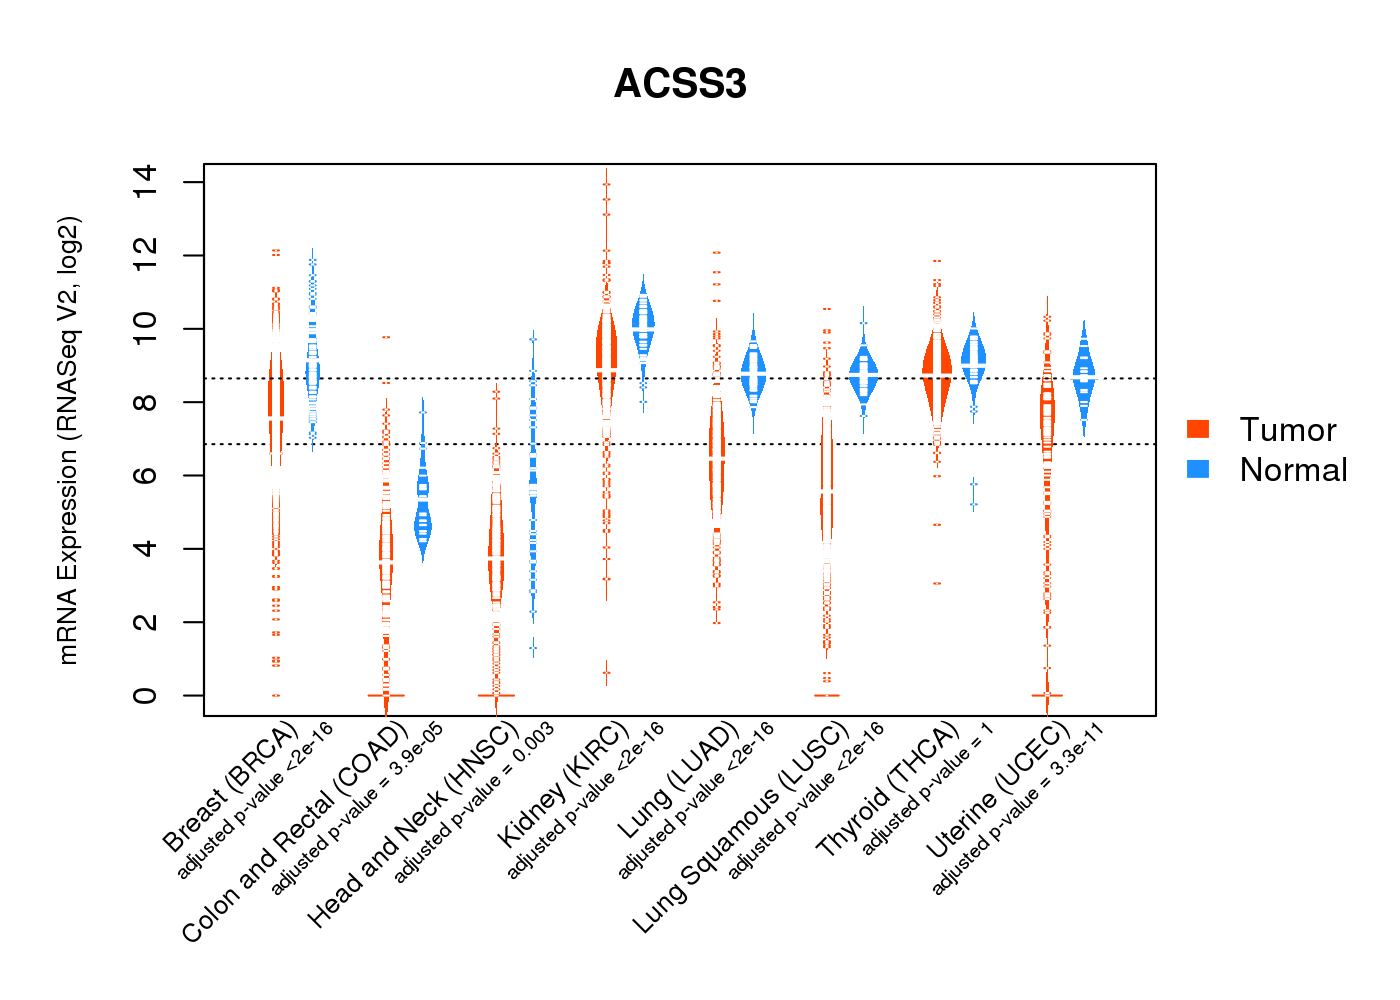
| * Normalized gene expression data of RNASeqV2 was extracted from TCGA using R package TCGA-Assembler. The URLs of all public data files on TCGA DCC data server were gathered at Jan-05-2015. Only eight cancer types have enough normal control samples for differential expression analysis. (t test, adjusted p<0.05 (using Benjamini-Hochberg FDR)) |
 |
| Top |
| * This plots show the correlation between CNV and gene expression. |
: Open all plots for all cancer types
 |
|
 |
|

| Top |
| Gene-Gene Network Information |
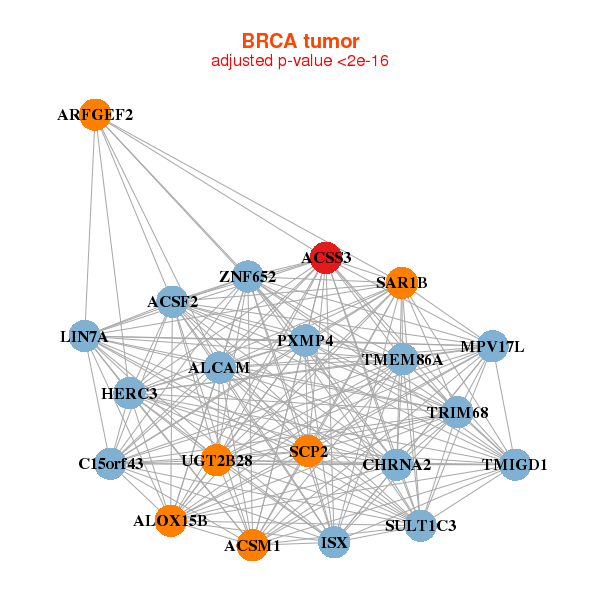
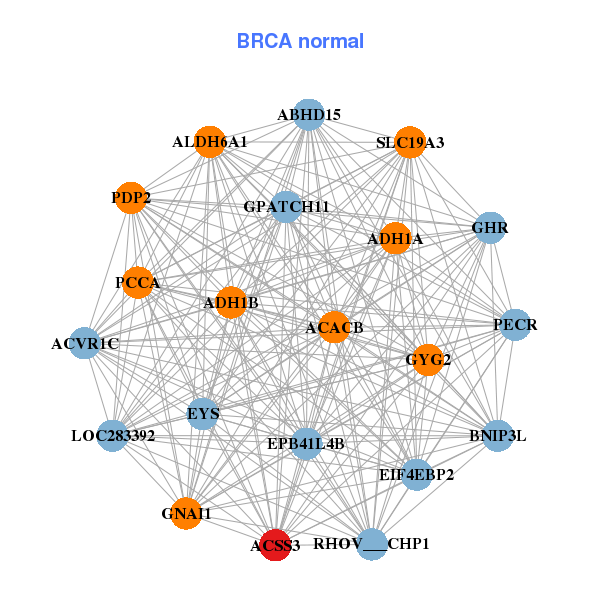
| * Co-Expression network figures were drawn using R package igraph. Only the top 20 genes with the highest correlations were shown. Red circle: input gene, orange circle: cell metabolism gene, sky circle: other gene |
: Open all plots for all cancer types
 |
|
| ACSF2,ACSM1,ACSS3,ALCAM,ALOX15B,ARFGEF2,C15orf43, CHRNA2,HERC3,ISX,LIN7A,MPV17L,PXMP4,SAR1B, SCP2,SULT1C3,TMEM86A,TMIGD1,TRIM68,UGT2B28,ZNF652 | ABHD15,ACACB,ACSS3,ACVR1C,ADH1A,ADH1B,ALDH6A1, BNIP3L,GPATCH11,RHOV___CHP1,EIF4EBP2,EPB41L4B,EYS,GHR, GNAI1,GYG2,LOC283392,PCCA,PDP2,PECR,SLC19A3 |
 |
|
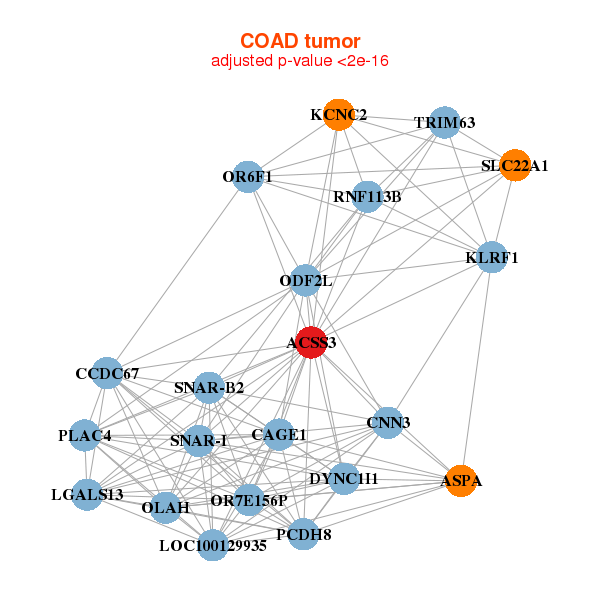
| ACSS3,ASPA,CAGE1,CCDC67,CNN3,DYNC1I1,KCNC2, KLRF1,LGALS13,LOC100129935,ODF2L,OLAH,OR6F1,OR7E156P, PCDH8,PLAC4,RNF113B,SLC22A1,SNAR-B2,SNAR-I,TRIM63 | ABCC9,ACSS3,ATP2B3,BHLHB9,BOC,CNGA3,CPEB1, DIXDC1,DMGDH,SUPT20HL2,FBXL22,HLF,KCNJ8,LGI2, LOXL4,PDE2A,PHGDH,RGS4,RHOJ,SALL2,SEMA4C |

| * Co-Expression network figures were drawn using R package igraph. Only the top 20 genes with the highest correlations were shown. Red circle: input gene, orange circle: cell metabolism gene, sky circle: other gene |
: Open all plots for all cancer types
| Top |
: Open all interacting genes' information including KEGG pathway for all interacting genes from DAVID
| Top |
| Pharmacological Information for ACSS3 |
| There's no related Drug. |
| Top |
| Cross referenced IDs for ACSS3 |
| * We obtained these cross-references from Uniprot database. It covers 150 different DBs, 18 categories. http://www.uniprot.org/help/cross_references_section |
: Open all cross reference information
|
Copyright © 2016-Present - The Univsersity of Texas Health Science Center at Houston @ |