|
||||||||||||||||||||||||||||||||||||||||||||||||||||||||||||||||||||||||||||||||||||||||||||||||||||||||||||||||||||||||||||||||||||||||||||||||||||||||||||||||||||||||||||||||||||||||||||||||||||||||||||||||||||||||||||||||||||||||||||||||||||||||||||||||||||||||||||||||||||||||||||||||||||||||||||||||||||||||||
| |
| Phenotypic Information (metabolism pathway, cancer, disease, phenome) |
| |
| |
| Gene-Gene Network Information: Co-Expression Network, Interacting Genes & KEGG |
| |
|


| Gene Summary for PANK3 |
| Basic gene info. | Gene symbol | PANK3 |
| Gene name | pantothenate kinase 3 | |
| Synonyms | - | |
| Cytomap | UCSC genome browser: 5q34 | |
| Genomic location | chr5 :167982627-168006614 | |
| Type of gene | protein-coding | |
| RefGenes | NM_024594.3, | |
| Ensembl id | ENSG00000120137 | |
| Description | hPanK3pantothenic acid kinase 3 | |
| Modification date | 20141207 | |
| dbXrefs | MIM : 606161 | |
| HGNC : HGNC | ||
| HPRD : 07312 | ||
| Protein | UniProt: go to UniProt's Cross Reference DB Table | |
| Expression | CleanEX: HS_PANK3 | |
| BioGPS: 79646 | ||
| Gene Expression Atlas: ENSG00000120137 | ||
| The Human Protein Atlas: ENSG00000120137 | ||
| Pathway | NCI Pathway Interaction Database: PANK3 | |
| KEGG: PANK3 | ||
| REACTOME: PANK3 | ||
| ConsensusPathDB | ||
| Pathway Commons: PANK3 | ||
| Metabolism | MetaCyc: PANK3 | |
| HUMANCyc: PANK3 | ||
| Regulation | Ensembl's Regulation: ENSG00000120137 | |
| miRBase: chr5 :167,982,627-168,006,614 | ||
| TargetScan: NM_024594 | ||
| cisRED: ENSG00000120137 | ||
| Context | iHOP: PANK3 | |
| cancer metabolism search in PubMed: PANK3 | ||
| UCL Cancer Institute: PANK3 | ||
| Assigned class in ccmGDB | C | |
| Top |
| Phenotypic Information for PANK3(metabolism pathway, cancer, disease, phenome) |
| Cancer | CGAP: PANK3 |
| Familial Cancer Database: PANK3 | |
| * This gene is included in those cancer gene databases. |
|
|
|
|
|
|
| ||||||||||||||||||||||||||||||||||||||||||||||||||||||||||||||||||||||||||||||||||||||||||||||||||||||||||||||||||||||||||||||||||||||||||||||||||||||||||||||||||||||||||||||||||||||||||||||||||||||||||||||||||||||||||||||||||||||||||||||||||||||||||||||||||||||||||||||||||||||||||||||||||||||||||||||||||||
Oncogene 1 | Significant driver gene in | |||||||||||||||||||||||||||||||||||||||||||||||||||||||||||||||||||||||||||||||||||||||||||||||||||||||||||||||||||||||||||||||||||||||||||||||||||||||||||||||||||||||||||||||||||||||||||||||||||||||||||||||||||||||||||||||||||||||||||||||||||||||||||||||||||||||||||||||||||||||||||||||||||||||||||||||||||||||||
| cf) number; DB name 1 Oncogene; http://nar.oxfordjournals.org/content/35/suppl_1/D721.long, 2 Tumor Suppressor gene; https://bioinfo.uth.edu/TSGene/, 3 Cancer Gene Census; http://www.nature.com/nrc/journal/v4/n3/abs/nrc1299.html, 4 CancerGenes; http://nar.oxfordjournals.org/content/35/suppl_1/D721.long, 5 Network of Cancer Gene; http://ncg.kcl.ac.uk/index.php, 1Therapeutic Vulnerabilities in Cancer; http://cbio.mskcc.org/cancergenomics/statius/ |
| REACTOME_METABOLISM_OF_VITAMINS_AND_COFACTORS | |
| OMIM | |
| Orphanet | |
| Disease | KEGG Disease: PANK3 |
| MedGen: PANK3 (Human Medical Genetics with Condition) | |
| ClinVar: PANK3 | |
| Phenotype | MGI: PANK3 (International Mouse Phenotyping Consortium) |
| PhenomicDB: PANK3 | |
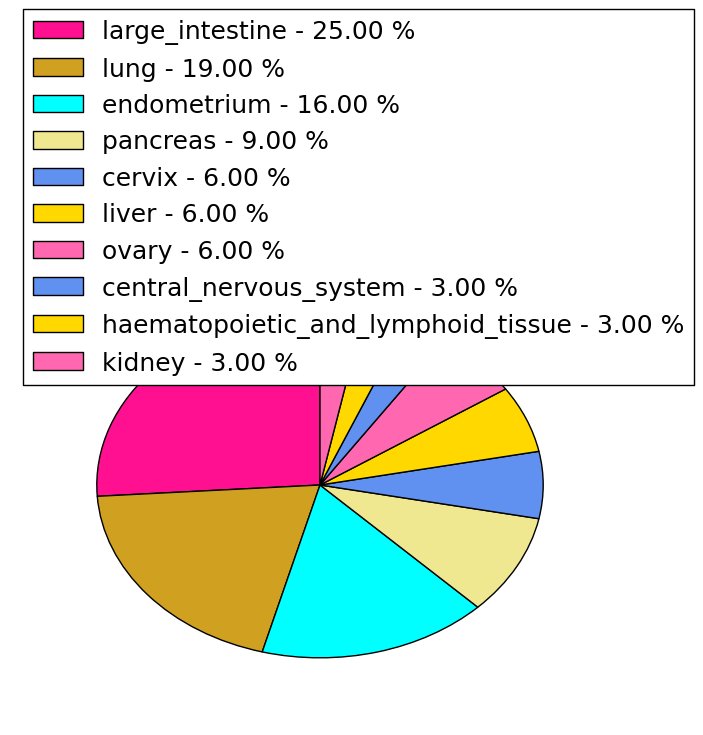
| Mutations for PANK3 |
| * Under tables are showing count per each tissue to give us broad intuition about tissue specific mutation patterns.You can go to the detailed page for each mutation database's web site. |
| - Statistics for Tissue and Mutation type | Top |
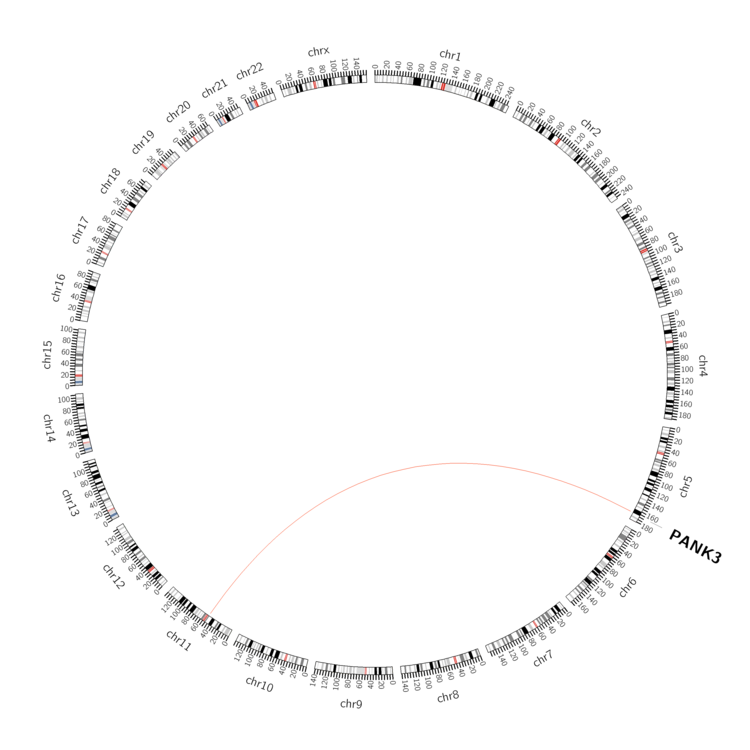 |
| - For Inter-chromosomal Variations |
| There's no inter-chromosomal structural variation. |
| - For Intra-chromosomal Variations |
| There's no intra-chromosomal structural variation. |
| Sample | Symbol_a | Chr_a | Start_a | End_a | Symbol_b | Chr_b | Start_b | End_b |
| pancreas | PANK3 | chr5 | 167988511 | 167988531 | chr11 | 50228168 | 50228188 |
| cf) Tissue number; Tissue name (1;Breast, 2;Central_nervous_system, 3;Haematopoietic_and_lymphoid_tissue, 4;Large_intestine, 5;Liver, 6;Lung, 7;Ovary, 8;Pancreas, 9;Prostate, 10;Skin, 11;Soft_tissue, 12;Upper_aerodigestive_tract) |
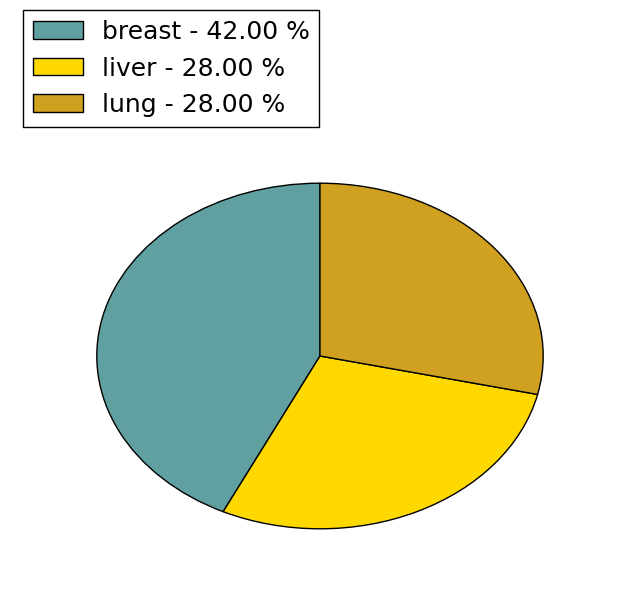
| * From mRNA Sanger sequences, Chitars2.0 arranged chimeric transcripts. This table shows PANK3 related fusion information. |
| ID | Head Gene | Tail Gene | Accession | Gene_a | qStart_a | qEnd_a | Chromosome_a | tStart_a | tEnd_a | Gene_a | qStart_a | qEnd_a | Chromosome_a | tStart_a | tEnd_a |
| BG776605 | PANK3 | 1 | 473 | 5 | 167984145 | 167984617 | SLC25A32 | 470 | 620 | 8 | 104411711 | 104411861 | |
| Top |
| Mutation type/ Tissue ID | brca | cns | cerv | endome | haematopo | kidn | Lintest | liver | lung | ns | ovary | pancre | prost | skin | stoma | thyro | urina | |||
| Total # sample | 1 | |||||||||||||||||||
| GAIN (# sample) | ||||||||||||||||||||
| LOSS (# sample) | 1 |
| cf) Tissue ID; Tissue type (1; Breast, 2; Central_nervous_system, 3; Cervix, 4; Endometrium, 5; Haematopoietic_and_lymphoid_tissue, 6; Kidney, 7; Large_intestine, 8; Liver, 9; Lung, 10; NS, 11; Ovary, 12; Pancreas, 13; Prostate, 14; Skin, 15; Stomach, 16; Thyroid, 17; Urinary_tract) |
| Top |
|
 |
| Top |
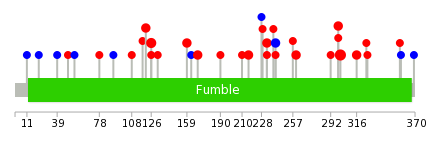
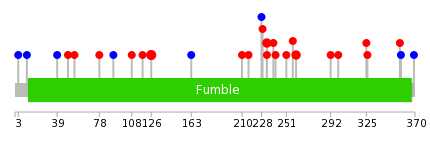
| Stat. for Non-Synonymous SNVs (# total SNVs=31) | (# total SNVs=7) |
 |  |
(# total SNVs=0) | (# total SNVs=0) |
| Top |
| * When you move the cursor on each content, you can see more deailed mutation information on the Tooltip. Those are primary_site,primary_histology,mutation(aa),pubmedID. |
| GRCh37 position | Mutation(aa) | Unique sampleID count |
| chr5:167988433-167988433 | p.I301F | 5 |
| chr5:167988397-167988397 | p.? | 3 |
| chr5:167995656-167995656 | p.R126C | 3 |
| chr5:167991008-167991008 | p.E233G | 2 |
| chr5:167995670-167995670 | p.F121C | 2 |
| chr5:167988439-167988439 | p.N299H | 2 |
| chr5:167991059-167991059 | p.G216V | 2 |
| chr5:167990927-167990927 | p.R260I | 2 |
| chr5:167993148-167993148 | p.P169S | 2 |
| chr5:167990983-167990983 | p.G241G | 2 |
| Top |
|
 |
| Point Mutation/ Tissue ID | 1 | 2 | 3 | 4 | 5 | 6 | 7 | 8 | 9 | 10 | 11 | 12 | 13 | 14 | 15 | 16 | 17 | 18 | 19 | 20 |
| # sample | 2 | 2 | 2 | 6 | 1 | 1 | 6 | 1 | 1 | 4 | 2 | 5 | ||||||||
| # mutation | 2 | 2 | 2 | 4 | 1 | 1 | 6 | 1 | 1 | 4 | 2 | 5 | ||||||||
| nonsynonymous SNV | 1 | 2 | 4 | 1 | 5 | 1 | 2 | 2 | 5 | |||||||||||
| synonymous SNV | 1 | 2 | 1 | 1 | 1 | 2 |
| cf) Tissue ID; Tissue type (1; BLCA[Bladder Urothelial Carcinoma], 2; BRCA[Breast invasive carcinoma], 3; CESC[Cervical squamous cell carcinoma and endocervical adenocarcinoma], 4; COAD[Colon adenocarcinoma], 5; GBM[Glioblastoma multiforme], 6; Glioma Low Grade, 7; HNSC[Head and Neck squamous cell carcinoma], 8; KICH[Kidney Chromophobe], 9; KIRC[Kidney renal clear cell carcinoma], 10; KIRP[Kidney renal papillary cell carcinoma], 11; LAML[Acute Myeloid Leukemia], 12; LUAD[Lung adenocarcinoma], 13; LUSC[Lung squamous cell carcinoma], 14; OV[Ovarian serous cystadenocarcinoma ], 15; PAAD[Pancreatic adenocarcinoma], 16; PRAD[Prostate adenocarcinoma], 17; SKCM[Skin Cutaneous Melanoma], 18:STAD[Stomach adenocarcinoma], 19:THCA[Thyroid carcinoma], 20:UCEC[Uterine Corpus Endometrial Carcinoma]) |
| Top |
| * We represented just top 10 SNVs. When you move the cursor on each content, you can see more deailed mutation information on the Tooltip. Those are primary_site, primary_histology, mutation(aa), pubmedID. |
| Genomic Position | Mutation(aa) | Unique sampleID count |
| chr5:167995656 | p.R126C | 3 |
| chr5:167991008 | p.E233G | 2 |
| chr5:167990927 | p.R260I | 2 |
| chr5:167993164 | p.R251S | 1 |
| chr5:167990936 | p.R49W | 1 |
| chr5:167990955 | p.G241A | 1 |
| chr5:167995679 | p.Q39Q | 1 |
| chr5:167990984 | p.S239F | 1 |
| chr5:167995708 | p.F11F | 1 |
| chr5:167984582 | p.E233D | 1 |
| * Copy number data were extracted from TCGA using R package TCGA-Assembler. The URLs of all public data files on TCGA DCC data server were gathered on Jan-05-2015. Function ProcessCNAData in TCGA-Assembler package was used to obtain gene-level copy number value which is calculated as the average copy number of the genomic region of a gene. |
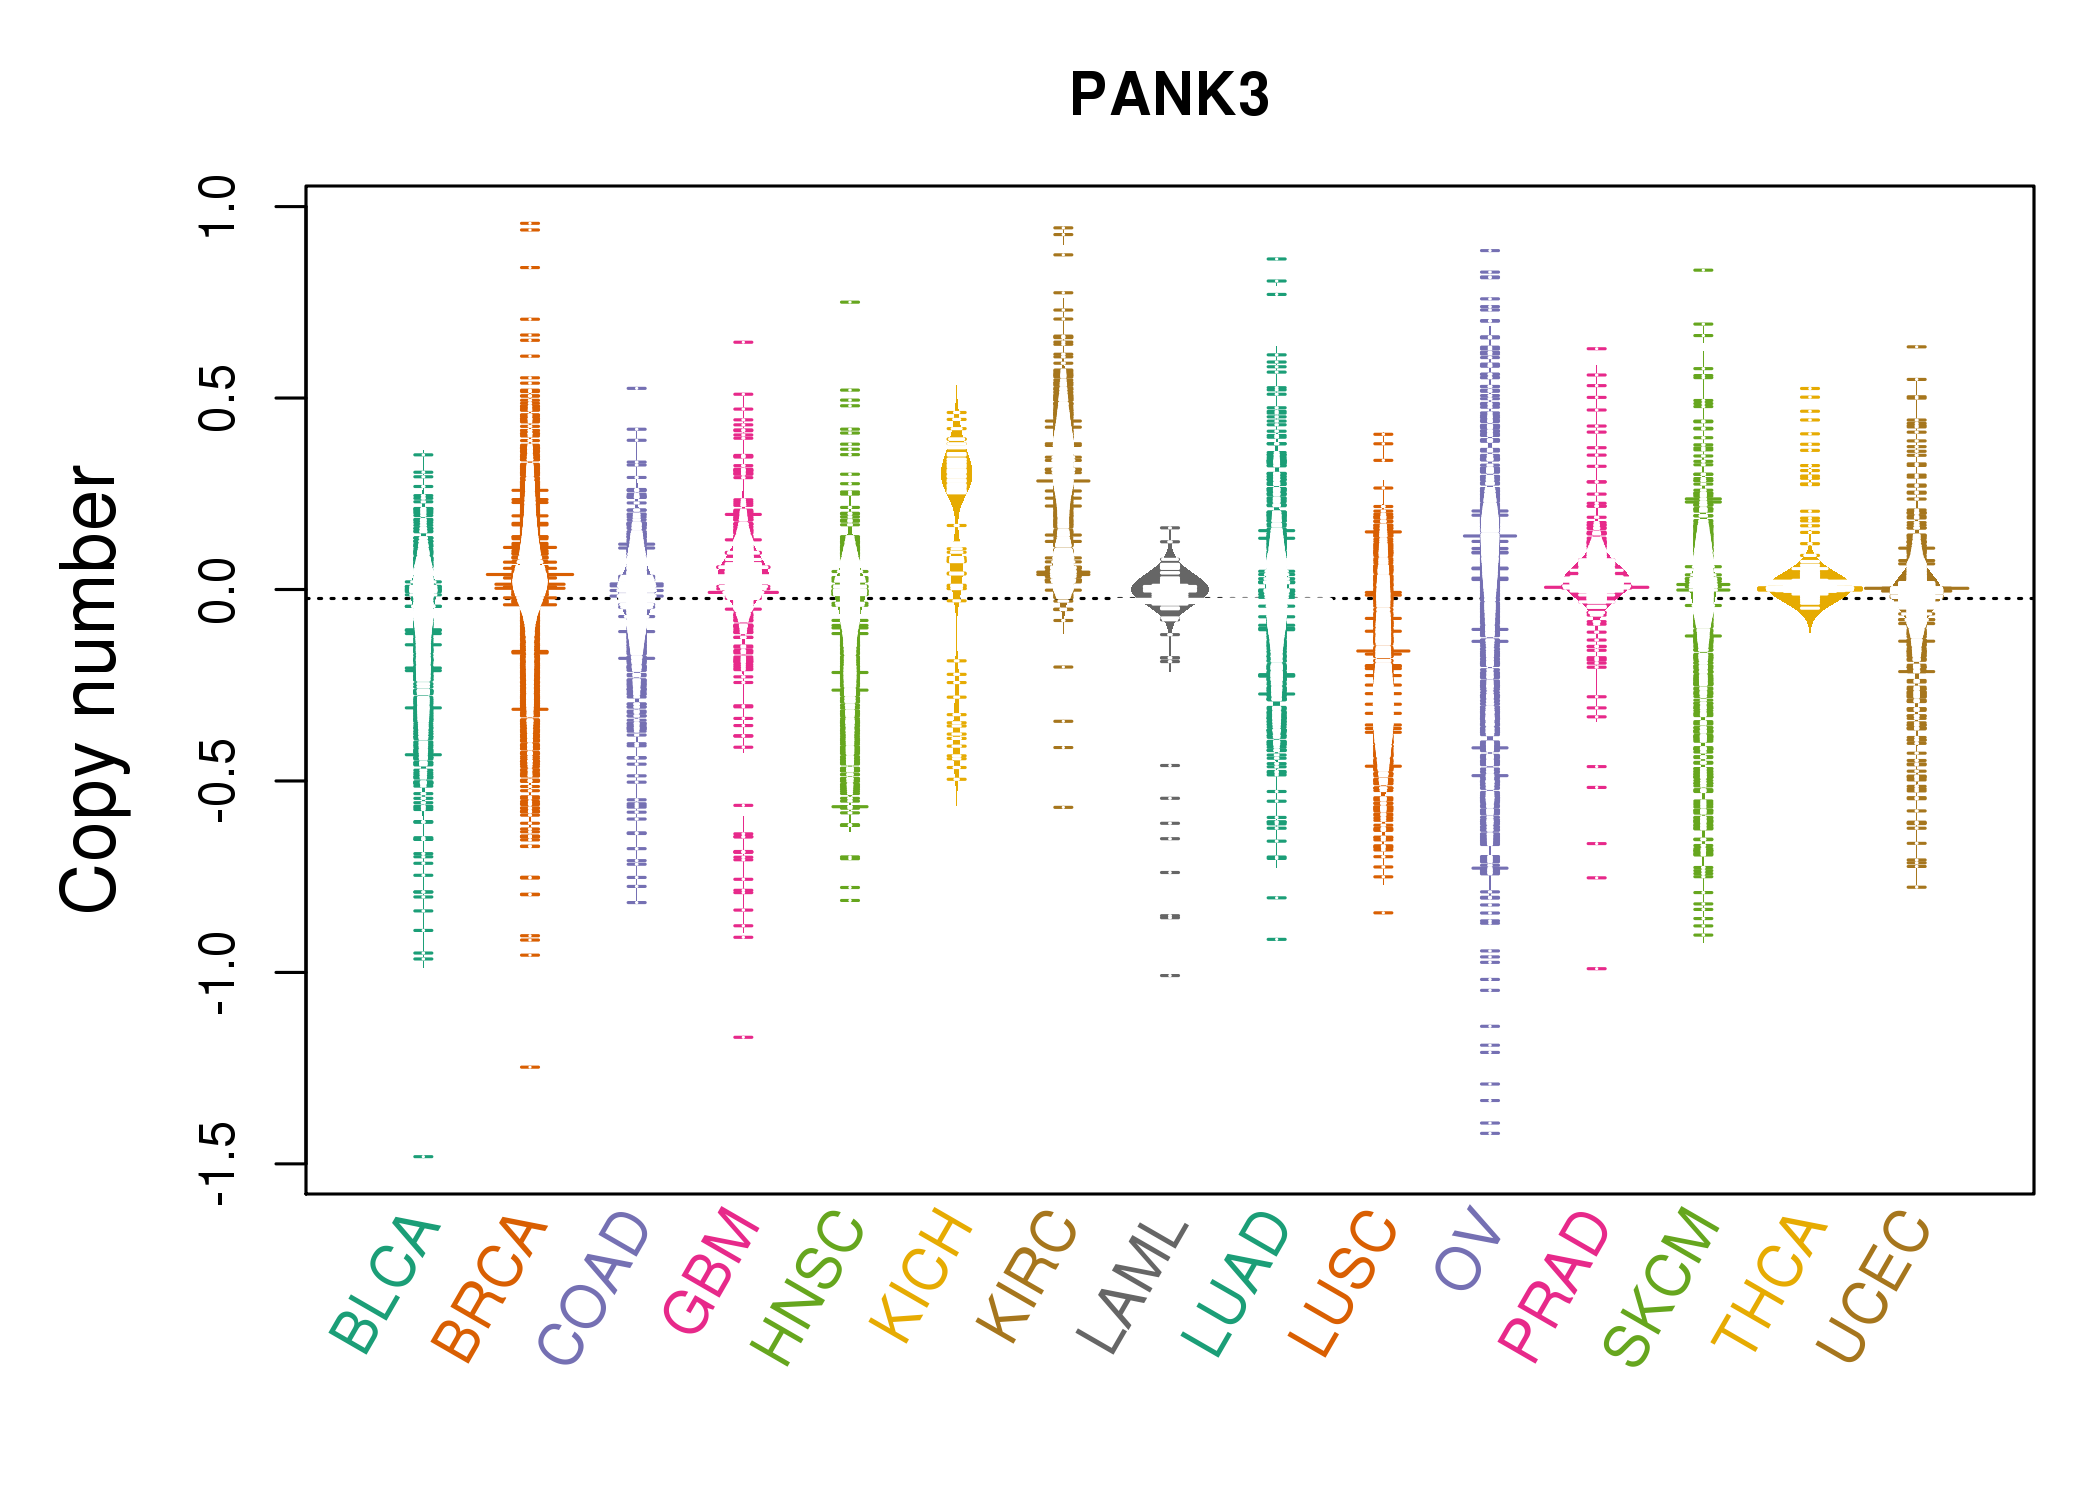 |
| cf) Tissue ID[Tissue type]: BLCA[Bladder Urothelial Carcinoma], BRCA[Breast invasive carcinoma], CESC[Cervical squamous cell carcinoma and endocervical adenocarcinoma], COAD[Colon adenocarcinoma], GBM[Glioblastoma multiforme], Glioma Low Grade, HNSC[Head and Neck squamous cell carcinoma], KICH[Kidney Chromophobe], KIRC[Kidney renal clear cell carcinoma], KIRP[Kidney renal papillary cell carcinoma], LAML[Acute Myeloid Leukemia], LUAD[Lung adenocarcinoma], LUSC[Lung squamous cell carcinoma], OV[Ovarian serous cystadenocarcinoma ], PAAD[Pancreatic adenocarcinoma], PRAD[Prostate adenocarcinoma], SKCM[Skin Cutaneous Melanoma], STAD[Stomach adenocarcinoma], THCA[Thyroid carcinoma], UCEC[Uterine Corpus Endometrial Carcinoma] |
| Top |
| Gene Expression for PANK3 |
| * CCLE gene expression data were extracted from CCLE_Expression_Entrez_2012-10-18.res: Gene-centric RMA-normalized mRNA expression data. |
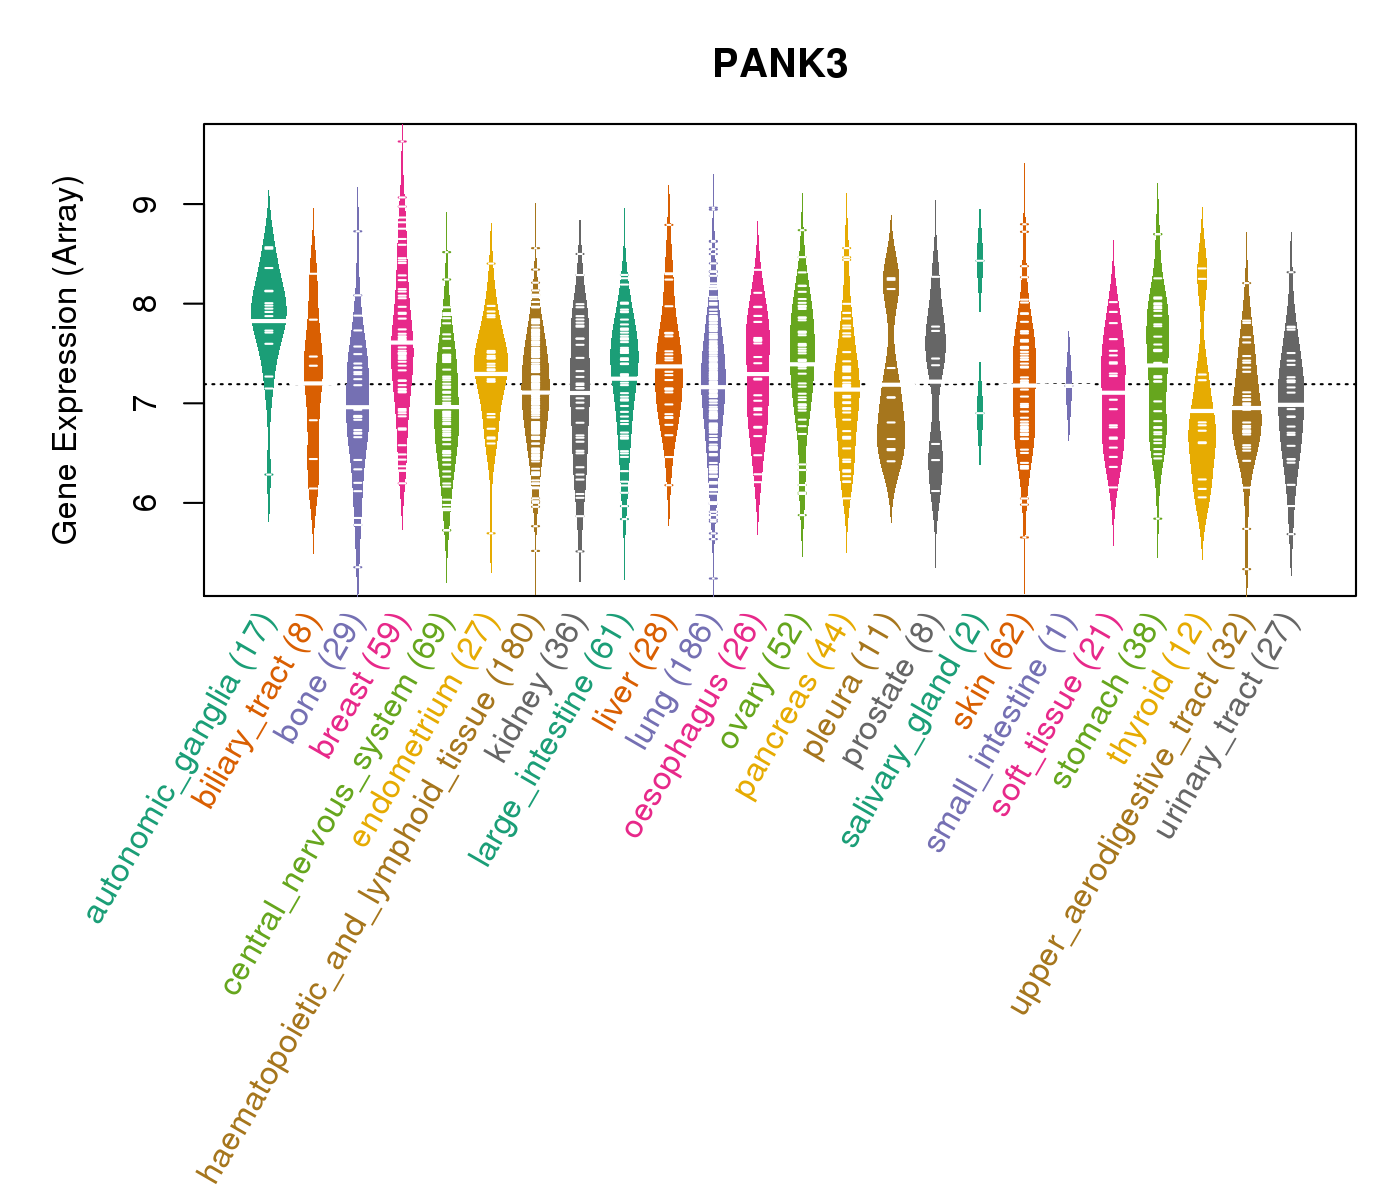 |
| * Normalized gene expression data of RNASeqV2 was extracted from TCGA using R package TCGA-Assembler. The URLs of all public data files on TCGA DCC data server were gathered at Jan-05-2015. Only eight cancer types have enough normal control samples for differential expression analysis. (t test, adjusted p<0.05 (using Benjamini-Hochberg FDR)) |
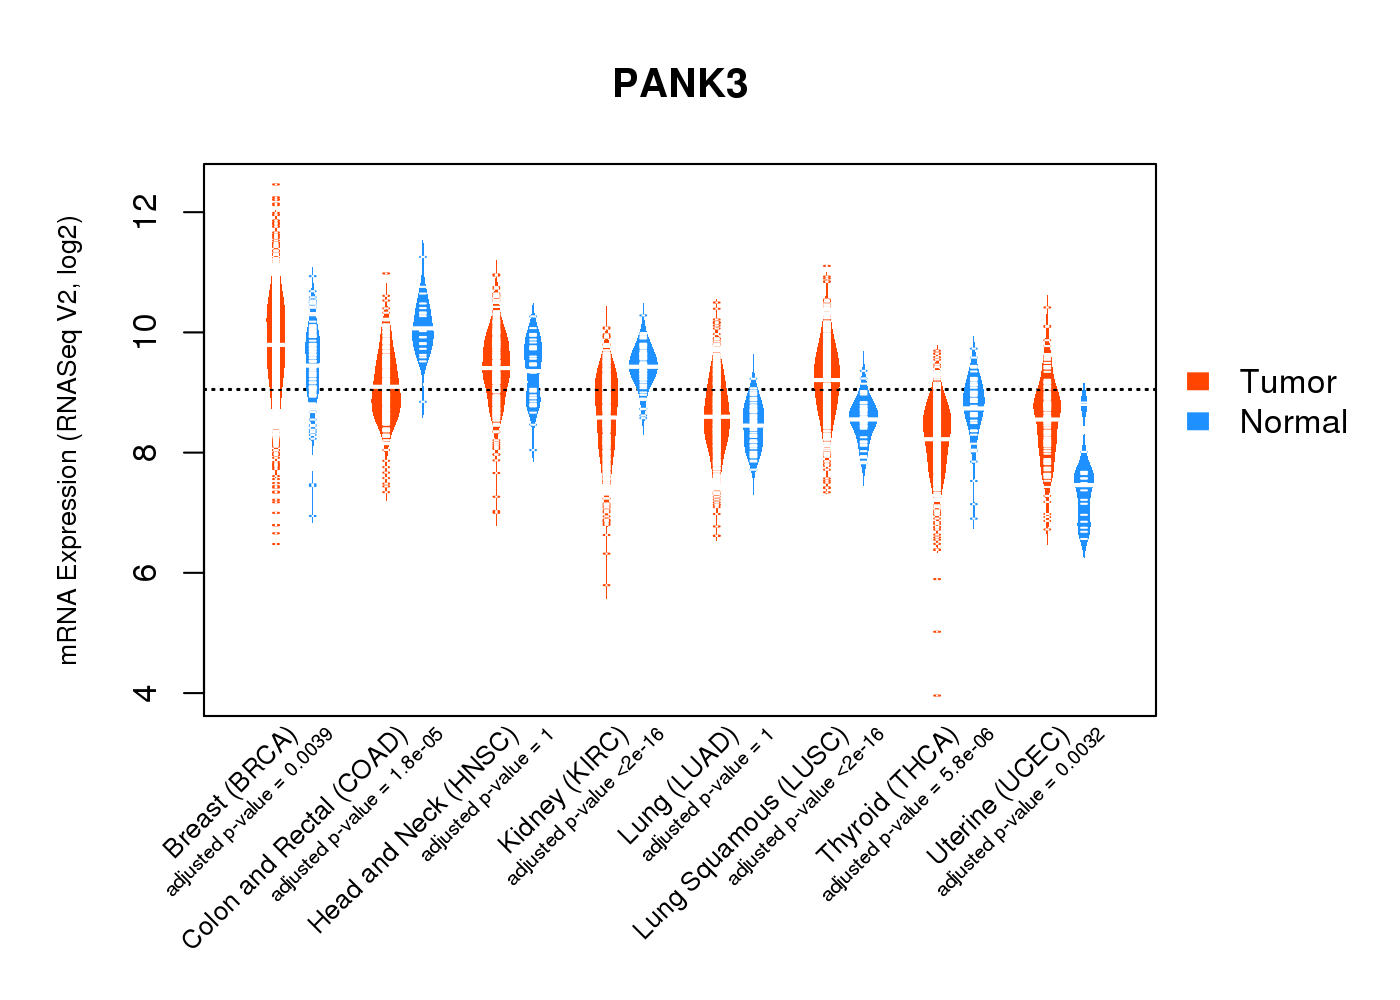 |
| Top |
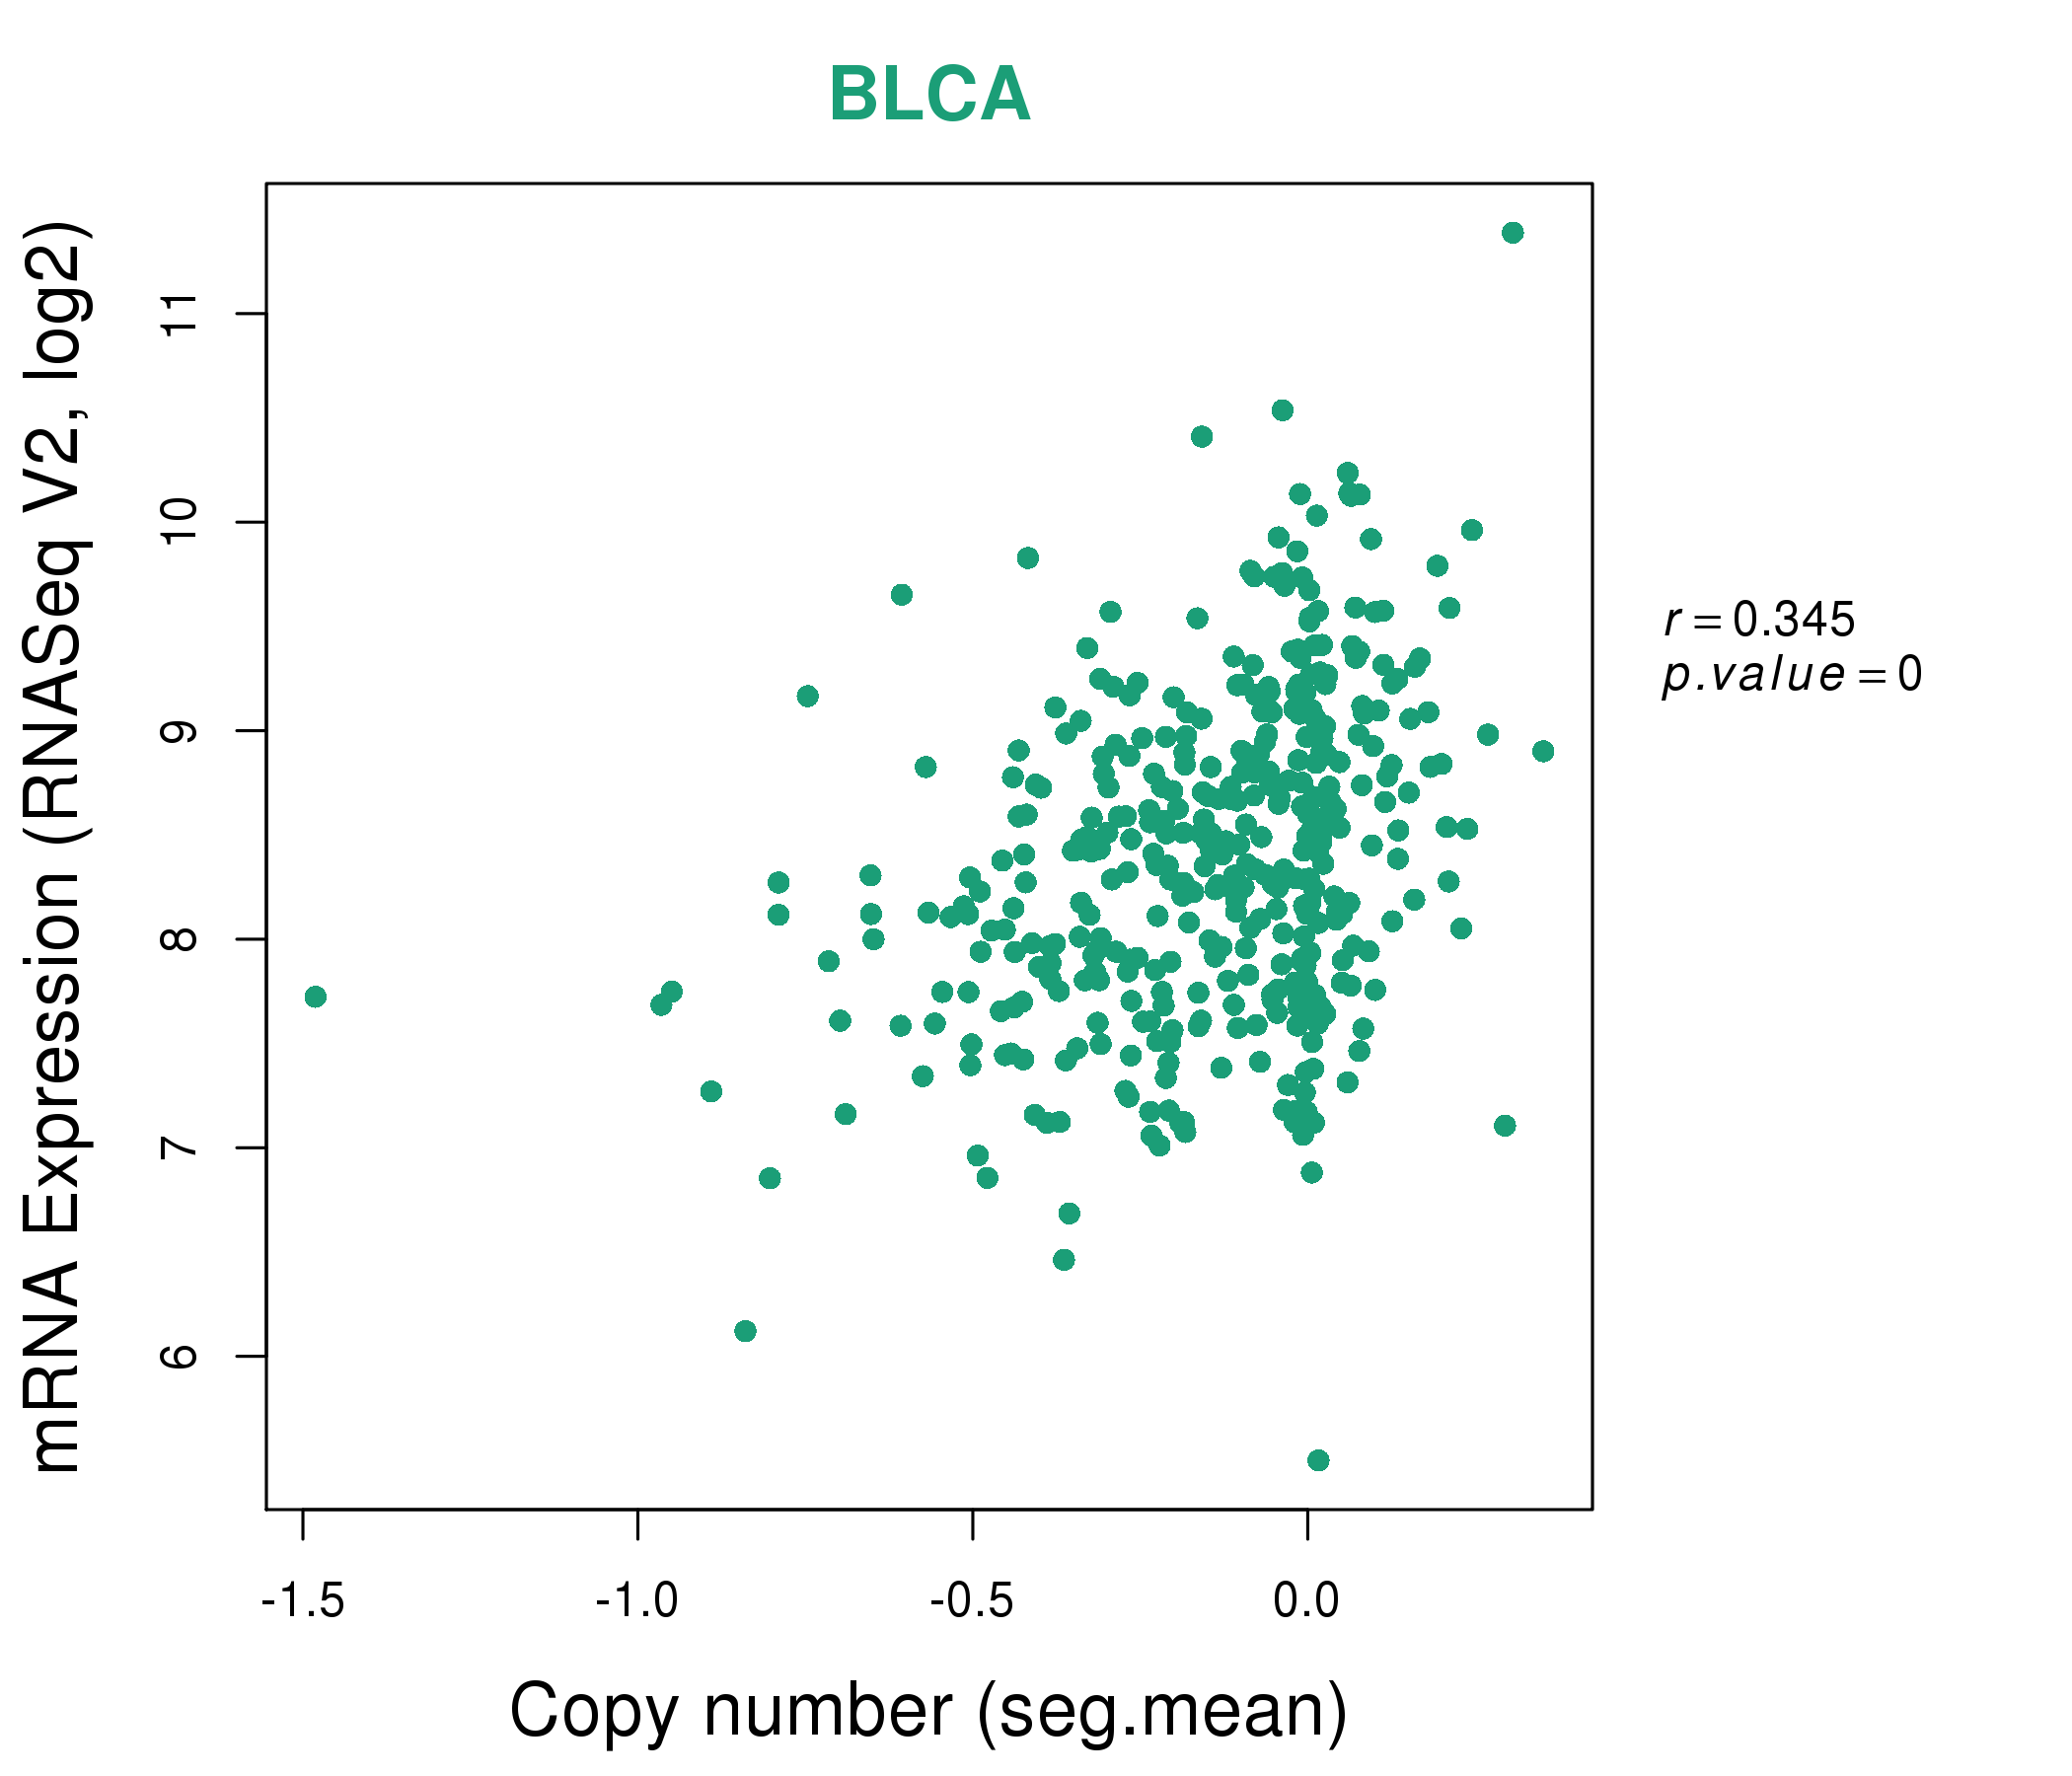
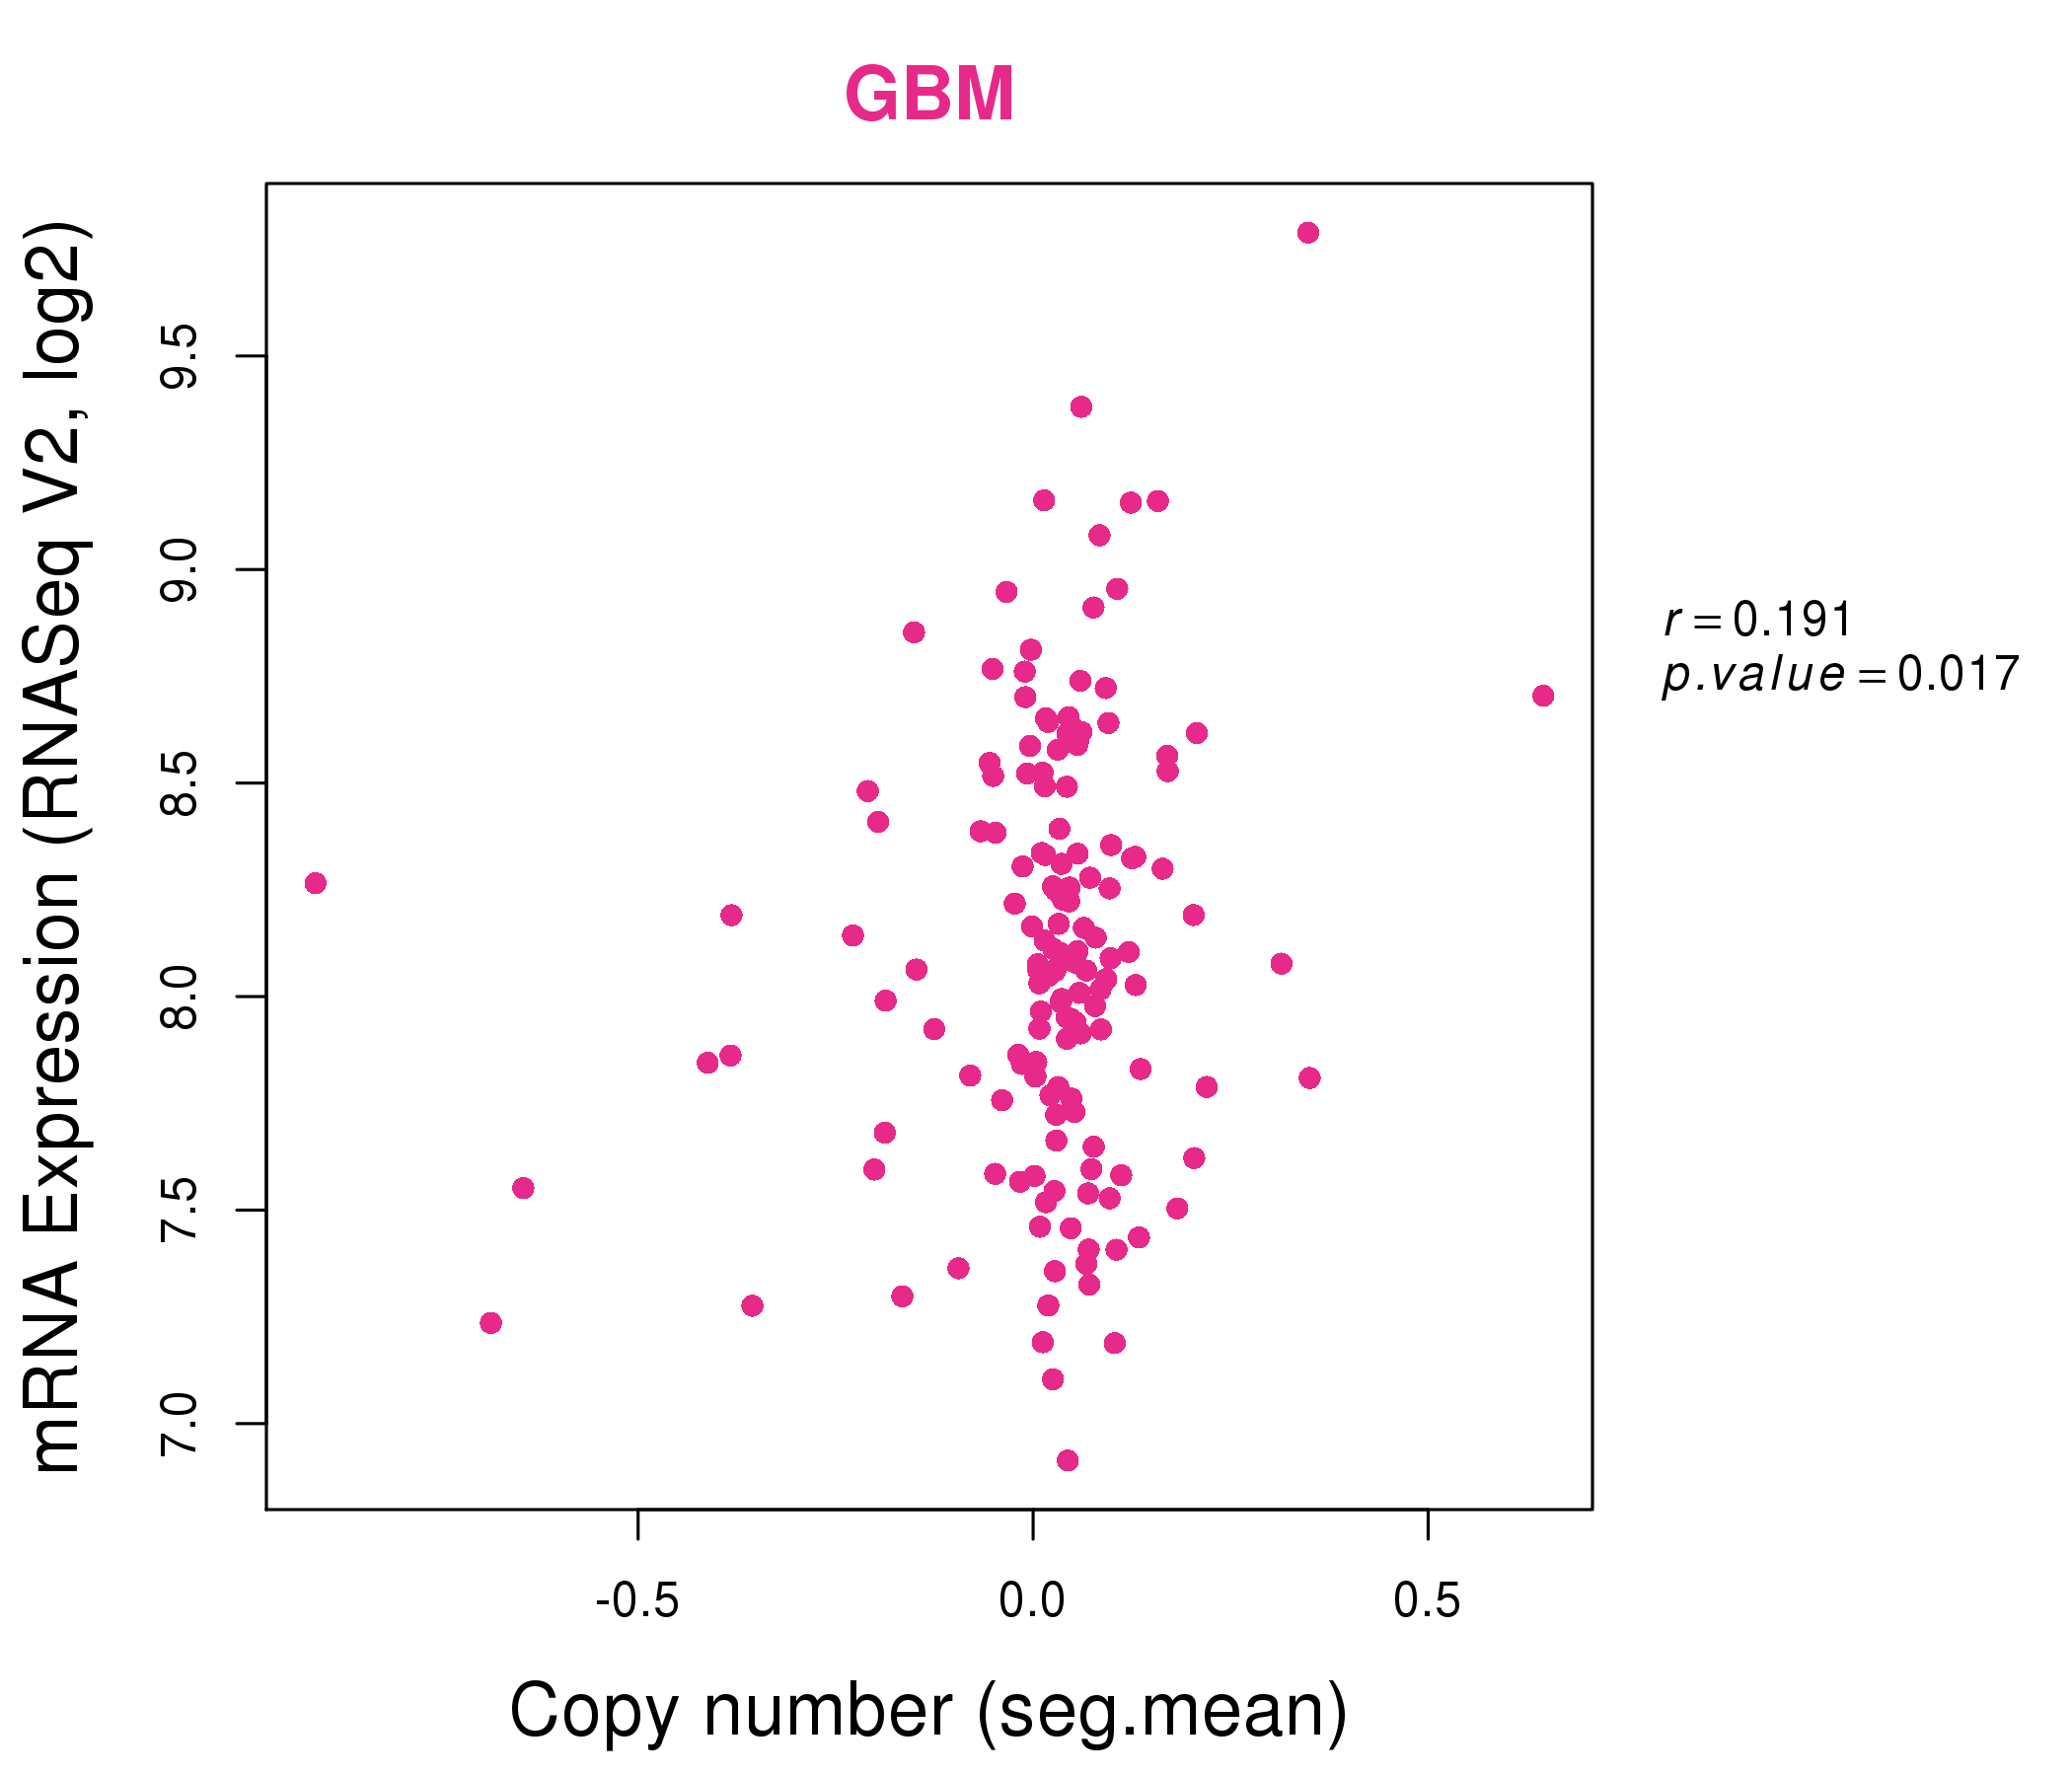
| * This plots show the correlation between CNV and gene expression. |
: Open all plots for all cancer types
 |
|
 |
|

| Top |
| Gene-Gene Network Information |
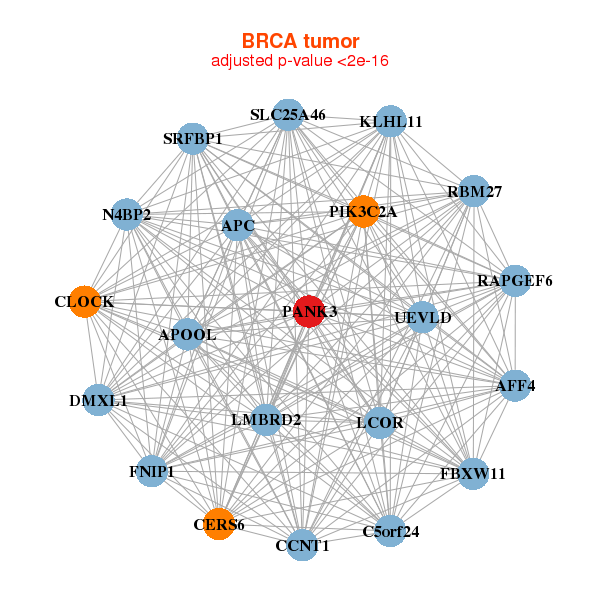
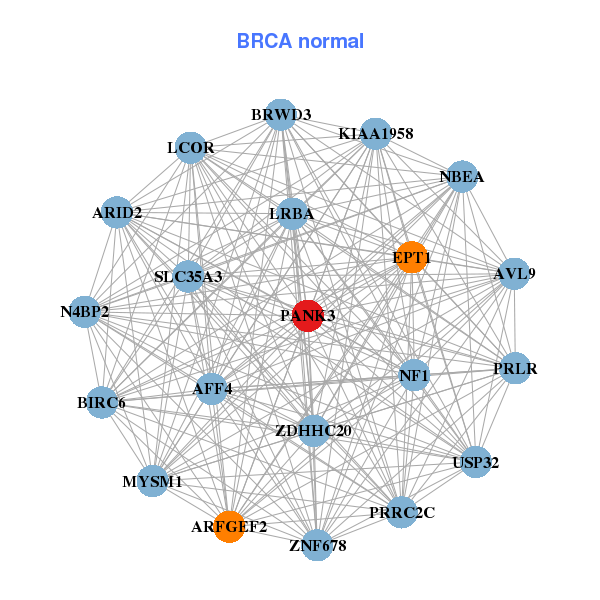
| * Co-Expression network figures were drawn using R package igraph. Only the top 20 genes with the highest correlations were shown. Red circle: input gene, orange circle: cell metabolism gene, sky circle: other gene |
: Open all plots for all cancer types
 |
|
| AFF4,APC,APOOL,C5orf24,CCNT1,CLOCK,DMXL1, FBXW11,FNIP1,KLHL11,CERS6,LCOR,LMBRD2,N4BP2, PANK3,PIK3C2A,RAPGEF6,RBM27,SLC25A46,SRFBP1,UEVLD | AFF4,ARFGEF2,ARID2,AVL9,PRRC2C,BIRC6,BRWD3, EPT1,KIAA1958,LCOR,LRBA,MYSM1,N4BP2,NBEA, NF1,PANK3,PRLR,SLC35A3,USP32,ZDHHC20,ZNF678 |
 |
|
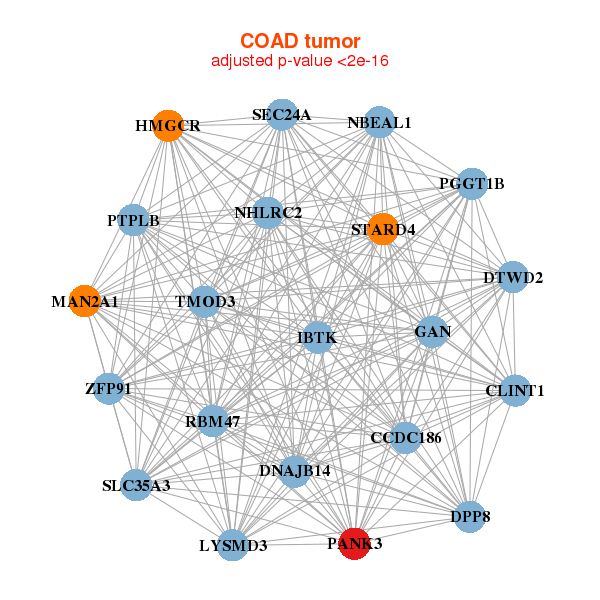
| CCDC186,CLINT1,DNAJB14,DPP8,DTWD2,GAN,HMGCR, IBTK,LYSMD3,MAN2A1,NBEAL1,NHLRC2,PANK3,PGGT1B, PTPLB,RBM47,SEC24A,SLC35A3,STARD4,TMOD3,ZFP91 | ABCD3,ACAP2,CCDC186,MCU,DENND1B,DSG2,FAM126B, GPD2,ITCH,NBEAL1,NSUN3,NT5C2,PANK3,PPP4R2, PRSS12,RASSF6,SULT1B1,TMEM135,TMEM56,TTC19,VDAC1 |
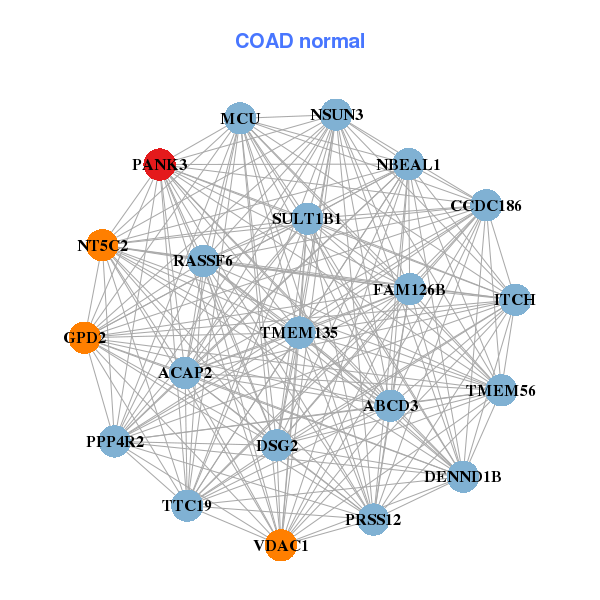
| * Co-Expression network figures were drawn using R package igraph. Only the top 20 genes with the highest correlations were shown. Red circle: input gene, orange circle: cell metabolism gene, sky circle: other gene |
: Open all plots for all cancer types
| Top |
: Open all interacting genes' information including KEGG pathway for all interacting genes from DAVID
| Top |
| Pharmacological Information for PANK3 |
| There's no related Drug. |
| Top |
| Cross referenced IDs for PANK3 |
| * We obtained these cross-references from Uniprot database. It covers 150 different DBs, 18 categories. http://www.uniprot.org/help/cross_references_section |
: Open all cross reference information
|
Copyright © 2016-Present - The Univsersity of Texas Health Science Center at Houston @ |