|
||||||||||||||||||||||||||||||||||||||||||||||||||||||||||||||||||||||||||||||||||||||||||||||||||||||||||||||||||||||||||||||||||||||||||||||||||||||||||||||||||||||||||||||||||||||||||||||||||||||||||||||||||||||||||||||||||||||||||||||||||||||||||||||||||||||||||||||||||||||||||||||||||||||||||||||||||||||||||
| |
| Phenotypic Information (metabolism pathway, cancer, disease, phenome) |
| |
| |
| Gene-Gene Network Information: Co-Expression Network, Interacting Genes & KEGG |
| |
|


| Gene Summary for GALNT12 |
| Basic gene info. | Gene symbol | GALNT12 |
| Gene name | polypeptide N-acetylgalactosaminyltransferase 12 | |
| Synonyms | CRCS1|GalNAc-T12 | |
| Cytomap | UCSC genome browser: 9q22.33 | |
| Genomic location | chr9 :101569980-101612363 | |
| Type of gene | protein-coding | |
| RefGenes | NM_024642.4, | |
| Ensembl id | ENSG00000119514 | |
| Description | UDP-GalNAc:polypeptide N-acetylgalactosaminyltransferase 12UDP-N-acetyl-alpha-D-galactosamine:polypeptide N-acetylgalactosaminyltransferase 12 (GalNAc-T12)colorectal cancer, susceptibility to 1polypeptide GalNAc transferase 12pp-GaNTase 12protein-UDP | |
| Modification date | 20141207 | |
| dbXrefs | MIM : 610290 | |
| HGNC : HGNC | ||
| Ensembl : ENSG00000119514 | ||
| HPRD : 13561 | ||
| Vega : OTTHUMG00000020348 | ||
| Protein | UniProt: go to UniProt's Cross Reference DB Table | |
| Expression | CleanEX: HS_GALNT12 | |
| BioGPS: 79695 | ||
| Gene Expression Atlas: ENSG00000119514 | ||
| The Human Protein Atlas: ENSG00000119514 | ||
| Pathway | NCI Pathway Interaction Database: GALNT12 | |
| KEGG: GALNT12 | ||
| REACTOME: GALNT12 | ||
| ConsensusPathDB | ||
| Pathway Commons: GALNT12 | ||
| Metabolism | MetaCyc: GALNT12 | |
| HUMANCyc: GALNT12 | ||
| Regulation | Ensembl's Regulation: ENSG00000119514 | |
| miRBase: chr9 :101,569,980-101,612,363 | ||
| TargetScan: NM_024642 | ||
| cisRED: ENSG00000119514 | ||
| Context | iHOP: GALNT12 | |
| cancer metabolism search in PubMed: GALNT12 | ||
| UCL Cancer Institute: GALNT12 | ||
| Assigned class in ccmGDB | C | |
| Top |
| Phenotypic Information for GALNT12(metabolism pathway, cancer, disease, phenome) |
| Cancer | CGAP: GALNT12 |
| Familial Cancer Database: GALNT12 | |
| * This gene is included in those cancer gene databases. |
|
|
|
|
|
| . | ||||||||||||||||||||||||||||||||||||||||||||||||||||||||||||||||||||||||||||||||||||||||||||||||||||||||||||||||||||||||||||||||||||||||||||||||||||||||||||||||||||||||||||||||||||||||||||||||||||||||||||||||||||||||||||||||||||||||||||||||||||||||||||||||||||||||||||||||||||||||||||||||||||||||||||||||||||
Oncogene 1 | Significant driver gene in | |||||||||||||||||||||||||||||||||||||||||||||||||||||||||||||||||||||||||||||||||||||||||||||||||||||||||||||||||||||||||||||||||||||||||||||||||||||||||||||||||||||||||||||||||||||||||||||||||||||||||||||||||||||||||||||||||||||||||||||||||||||||||||||||||||||||||||||||||||||||||||||||||||||||||||||||||||||||||
| cf) number; DB name 1 Oncogene; http://nar.oxfordjournals.org/content/35/suppl_1/D721.long, 2 Tumor Suppressor gene; https://bioinfo.uth.edu/TSGene/, 3 Cancer Gene Census; http://www.nature.com/nrc/journal/v4/n3/abs/nrc1299.html, 4 CancerGenes; http://nar.oxfordjournals.org/content/35/suppl_1/D721.long, 5 Network of Cancer Gene; http://ncg.kcl.ac.uk/index.php, 1Therapeutic Vulnerabilities in Cancer; http://cbio.mskcc.org/cancergenomics/statius/ |
| REACTOME_METABOLISM_OF_PROTEINS | |
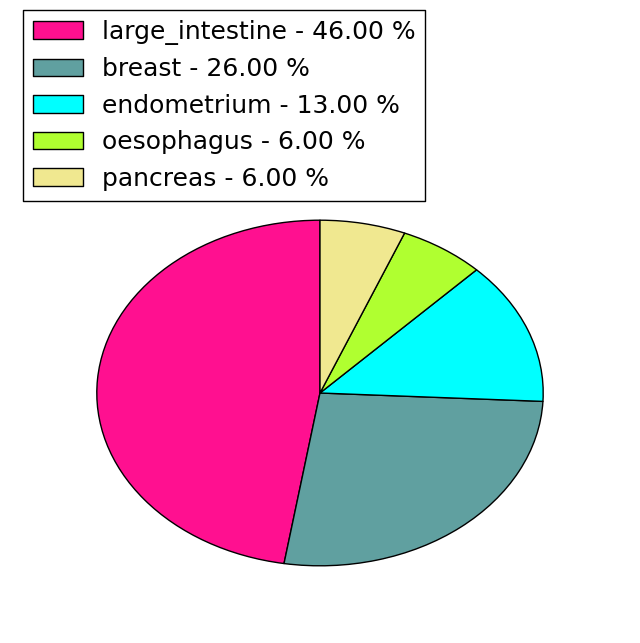
| Mutations for GALNT12 |
| * Under tables are showing count per each tissue to give us broad intuition about tissue specific mutation patterns.You can go to the detailed page for each mutation database's web site. |
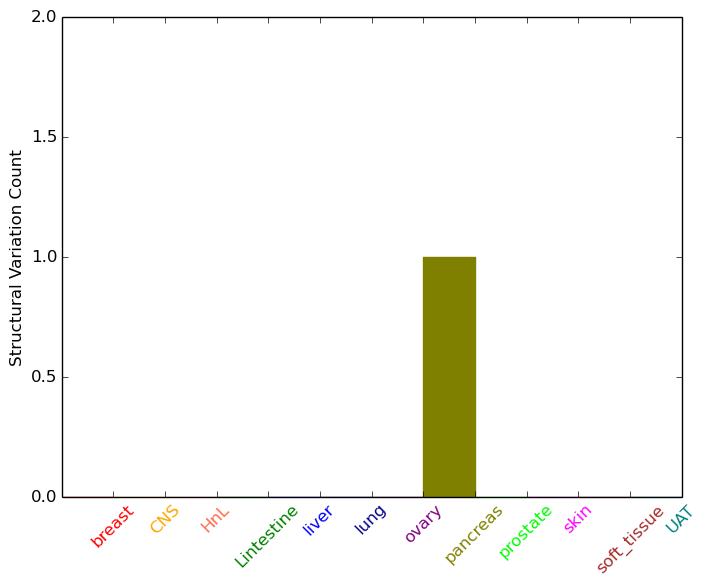
| - Statistics for Tissue and Mutation type | Top |
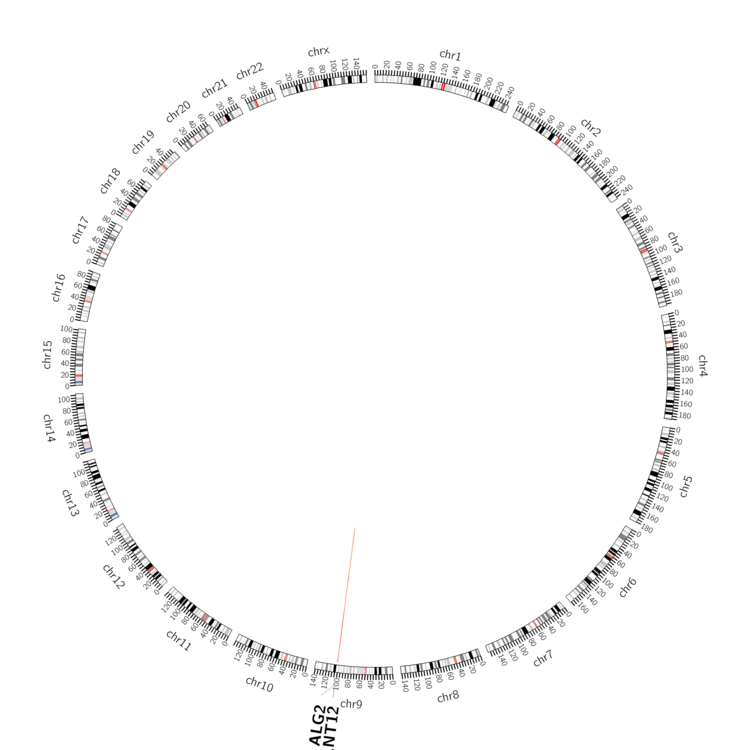 |
| - For Inter-chromosomal Variations |
| There's no inter-chromosomal structural variation. |
| - For Intra-chromosomal Variations |
| * Intra-chromosomal variantions includes 'intrachromosomal amplicon to amplicon', 'intrachromosomal amplicon to non-amplified dna', 'intrachromosomal deletion', 'intrachromosomal fold-back inversion', 'intrachromosomal inversion', 'intrachromosomal tandem duplication', 'Intrachromosomal unknown type', 'intrachromosomal with inverted orientation', 'intrachromosomal with non-inverted orientation'. |
 |
| Sample | Symbol_a | Chr_a | Start_a | End_a | Symbol_b | Chr_b | Start_b | End_b |
| pancreas | GALNT12 | chr9 | 101583250 | 101583270 | ALG2 | chr9 | 101979004 | 101979024 |
| cf) Tissue number; Tissue name (1;Breast, 2;Central_nervous_system, 3;Haematopoietic_and_lymphoid_tissue, 4;Large_intestine, 5;Liver, 6;Lung, 7;Ovary, 8;Pancreas, 9;Prostate, 10;Skin, 11;Soft_tissue, 12;Upper_aerodigestive_tract) |
| * From mRNA Sanger sequences, Chitars2.0 arranged chimeric transcripts. This table shows GALNT12 related fusion information. |
| ID | Head Gene | Tail Gene | Accession | Gene_a | qStart_a | qEnd_a | Chromosome_a | tStart_a | tEnd_a | Gene_a | qStart_a | qEnd_a | Chromosome_a | tStart_a | tEnd_a |
| Top |
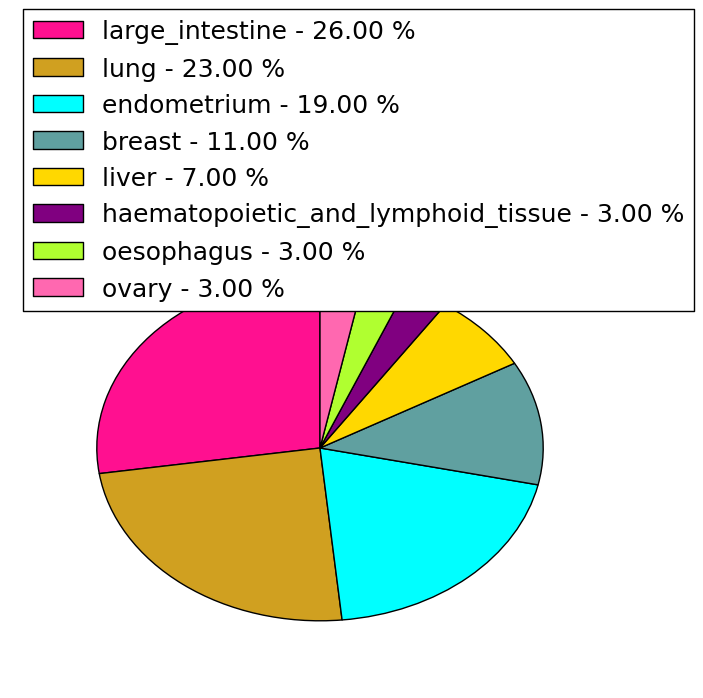
| Mutation type/ Tissue ID | brca | cns | cerv | endome | haematopo | kidn | Lintest | liver | lung | ns | ovary | pancre | prost | skin | stoma | thyro | urina | |||
| Total # sample | 1 | 11 | 1 | 1 | ||||||||||||||||
| GAIN (# sample) | ||||||||||||||||||||
| LOSS (# sample) | 1 | 11 | 1 | 1 |
| cf) Tissue ID; Tissue type (1; Breast, 2; Central_nervous_system, 3; Cervix, 4; Endometrium, 5; Haematopoietic_and_lymphoid_tissue, 6; Kidney, 7; Large_intestine, 8; Liver, 9; Lung, 10; NS, 11; Ovary, 12; Pancreas, 13; Prostate, 14; Skin, 15; Stomach, 16; Thyroid, 17; Urinary_tract) |
| Top |
|
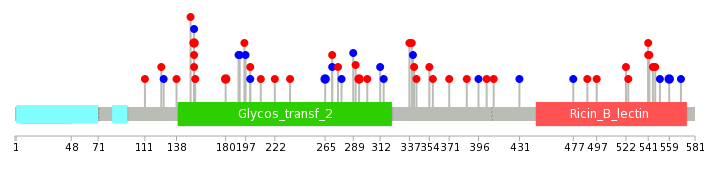 |
| Top |
| Stat. for Non-Synonymous SNVs (# total SNVs=26) | (# total SNVs=15) |
 |  |
(# total SNVs=0) | (# total SNVs=0) |
| Top |
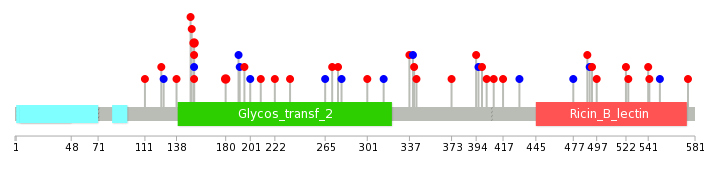
| * When you move the cursor on each content, you can see more deailed mutation information on the Tooltip. Those are primary_site,primary_histology,mutation(aa),pubmedID. |
| GRCh37 position | Mutation(aa) | Unique sampleID count |
| chr9:101585705-101585705 | p.R180I | 2 |
| chr9:101594117-101594117 | p.F265F | 2 |
| chr9:101611249-101611249 | p.H541N | 2 |
| chr9:101611305-101611305 | p.F559F | 2 |
| chr9:101585623-101585623 | p.L153V | 2 |
| chr9:101594202-101594202 | p.E294Q | 2 |
| chr9:101585624-101585624 | p.L153P | 2 |
| chr9:101608363-101608363 | p.C521* | 2 |
| chr9:101597549-101597549 | p.G312G | 1 |
| chr9:101585627-101585627 | p.R154Q | 1 |
| Top |
|
 |
| Point Mutation/ Tissue ID | 1 | 2 | 3 | 4 | 5 | 6 | 7 | 8 | 9 | 10 | 11 | 12 | 13 | 14 | 15 | 16 | 17 | 18 | 19 | 20 |
| # sample | 1 | 1 | 8 | 4 | 3 | 3 | 1 | 11 | 4 | 1 | 6 | |||||||||
| # mutation | 1 | 1 | 7 | 4 | 5 | 3 | 1 | 12 | 4 | 1 | 7 | |||||||||
| nonsynonymous SNV | 1 | 4 | 3 | 4 | 3 | 1 | 9 | 2 | 5 | |||||||||||
| synonymous SNV | 1 | 3 | 1 | 1 | 3 | 2 | 1 | 2 |
| cf) Tissue ID; Tissue type (1; BLCA[Bladder Urothelial Carcinoma], 2; BRCA[Breast invasive carcinoma], 3; CESC[Cervical squamous cell carcinoma and endocervical adenocarcinoma], 4; COAD[Colon adenocarcinoma], 5; GBM[Glioblastoma multiforme], 6; Glioma Low Grade, 7; HNSC[Head and Neck squamous cell carcinoma], 8; KICH[Kidney Chromophobe], 9; KIRC[Kidney renal clear cell carcinoma], 10; KIRP[Kidney renal papillary cell carcinoma], 11; LAML[Acute Myeloid Leukemia], 12; LUAD[Lung adenocarcinoma], 13; LUSC[Lung squamous cell carcinoma], 14; OV[Ovarian serous cystadenocarcinoma ], 15; PAAD[Pancreatic adenocarcinoma], 16; PRAD[Prostate adenocarcinoma], 17; SKCM[Skin Cutaneous Melanoma], 18:STAD[Stomach adenocarcinoma], 19:THCA[Thyroid carcinoma], 20:UCEC[Uterine Corpus Endometrial Carcinoma]) |
| Top |
| * We represented just top 10 SNVs. When you move the cursor on each content, you can see more deailed mutation information on the Tooltip. Those are primary_site, primary_histology, mutation(aa), pubmedID. |
| Genomic Position | Mutation(aa) | Unique sampleID count |
| chr9:101585705 | p.R180I | 2 |
| chr9:101585623 | p.L153F | 2 |
| chr9:101585624 | p.L153P | 2 |
| chr9:101599413 | p.L153L | 1 |
| chr9:101608371 | p.L340L | 1 |
| chr9:101594159 | p.E522K | 1 |
| chr9:101599426 | p.E341K | 1 |
| chr9:101589065 | p.T524N | 1 |
| chr9:101611249 | p.L191L | 1 |
| chr9:101594224 | p.S343F | 1 |
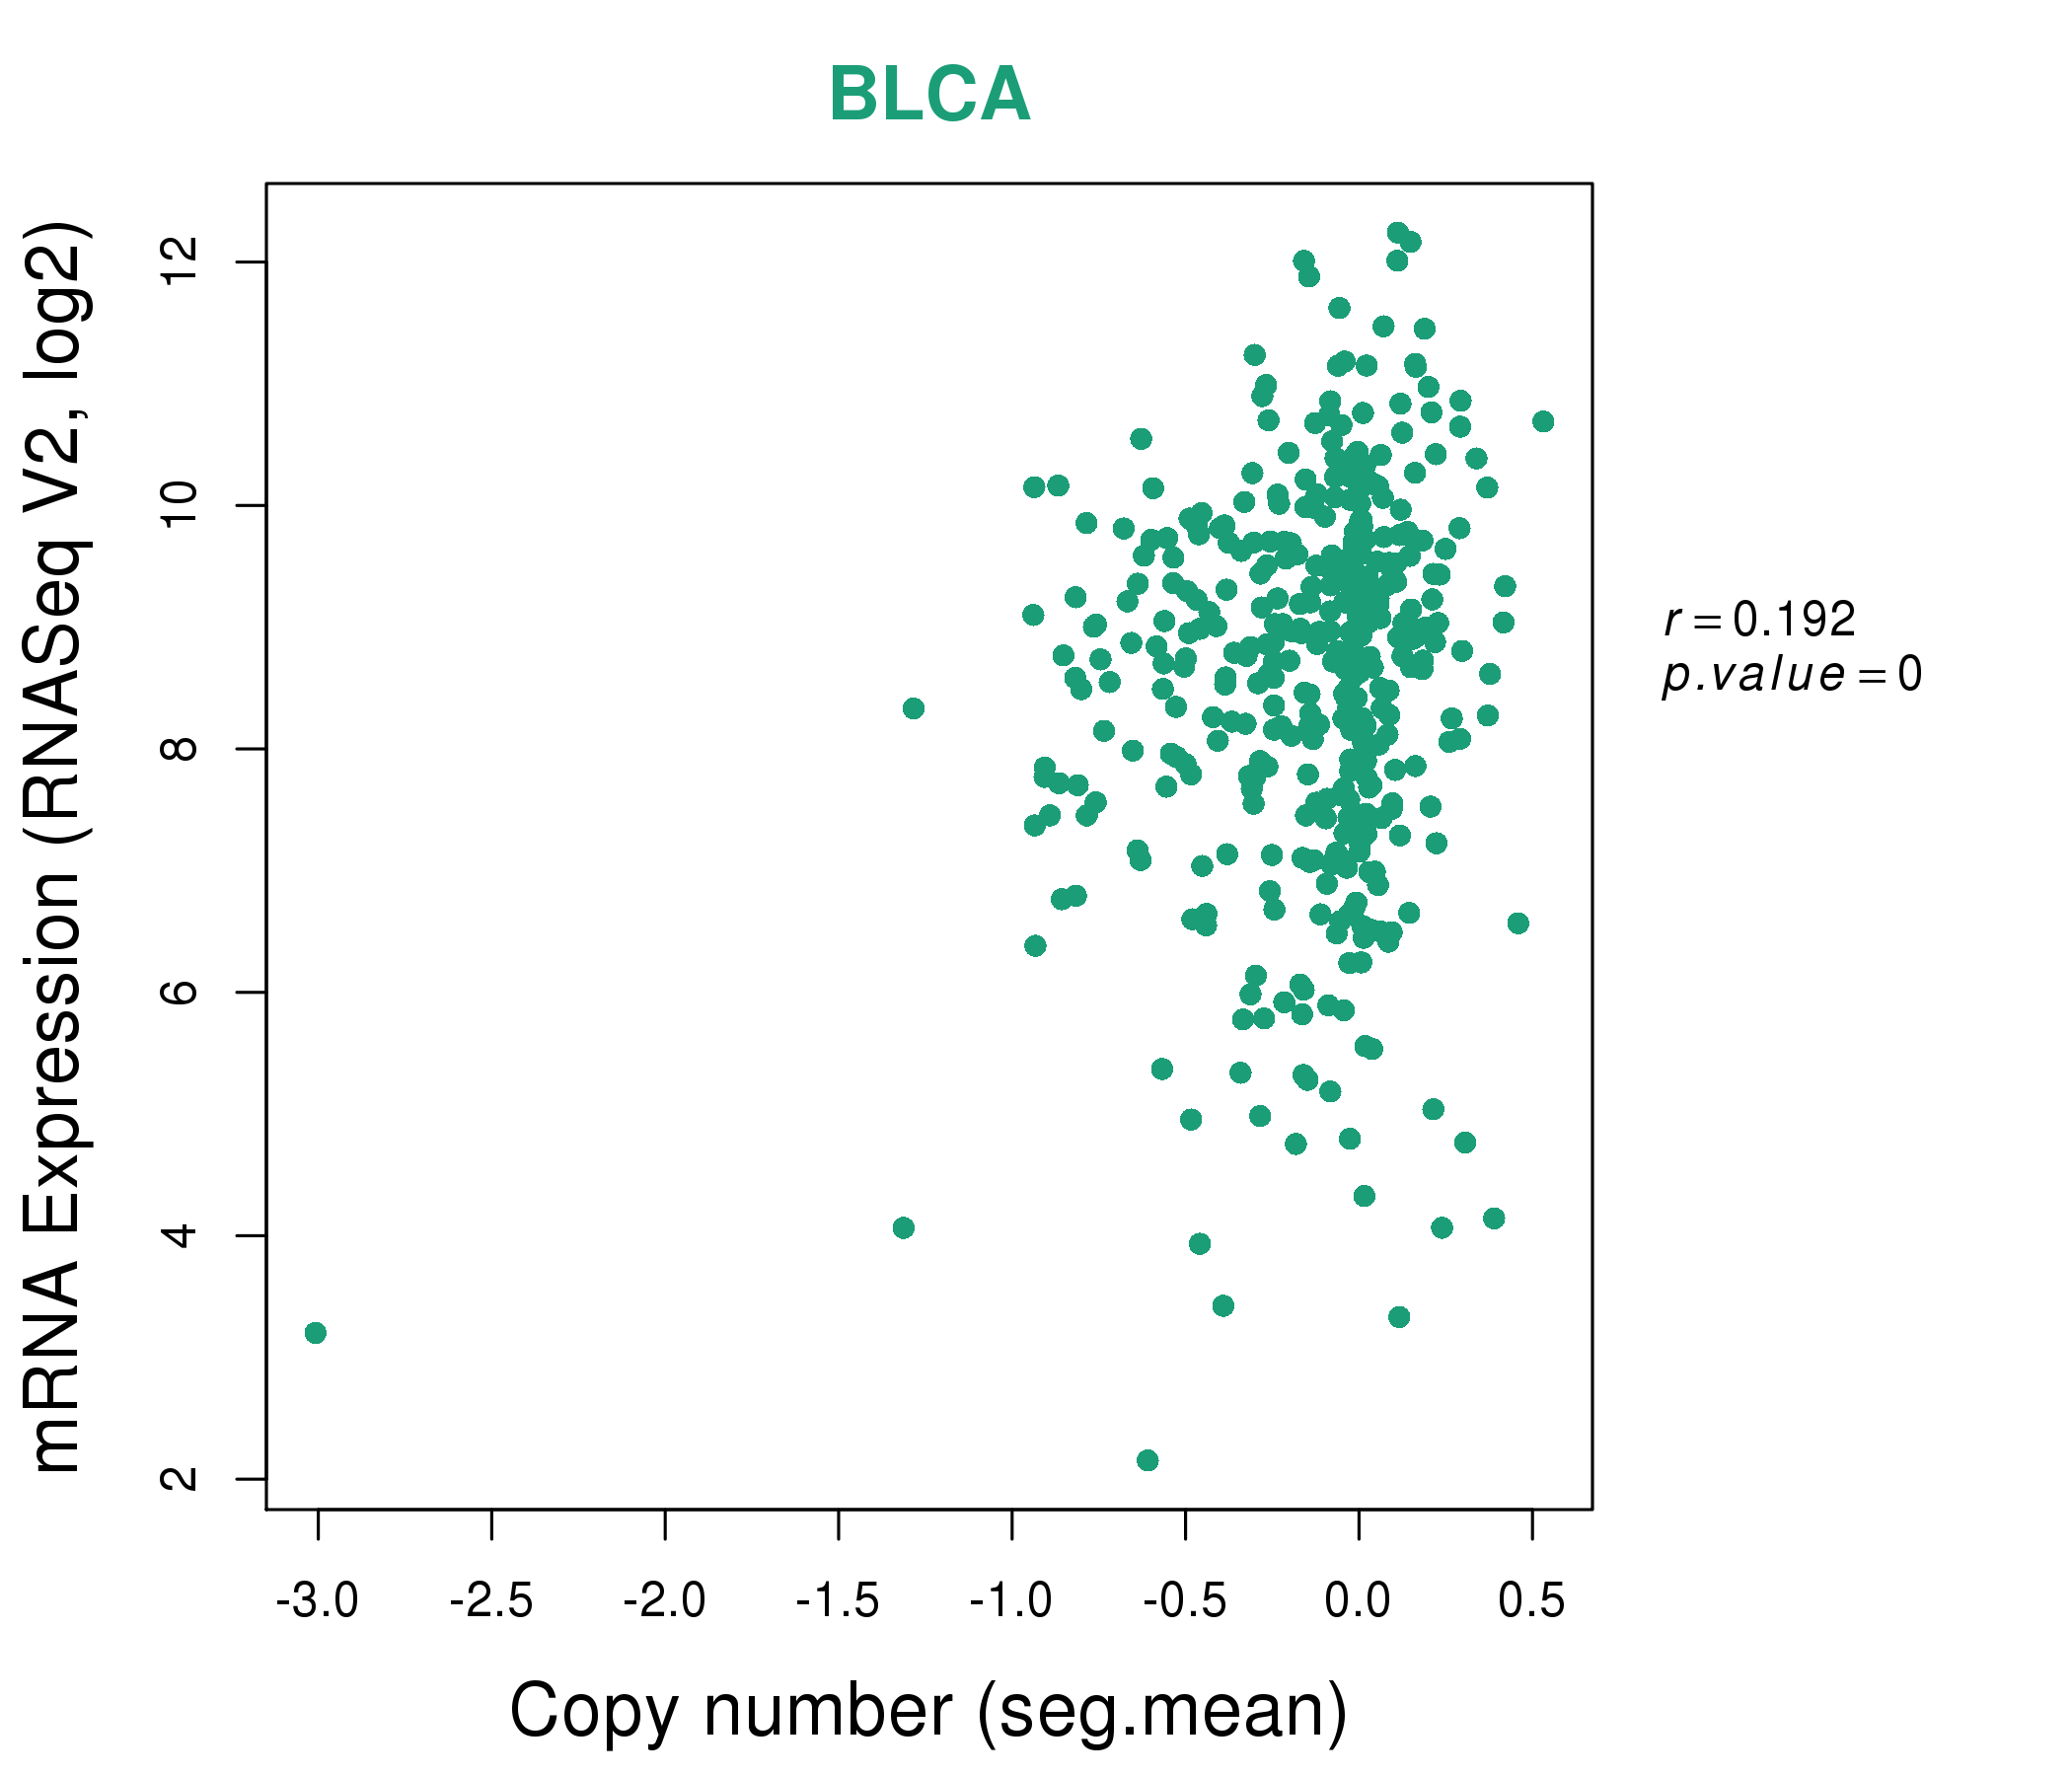
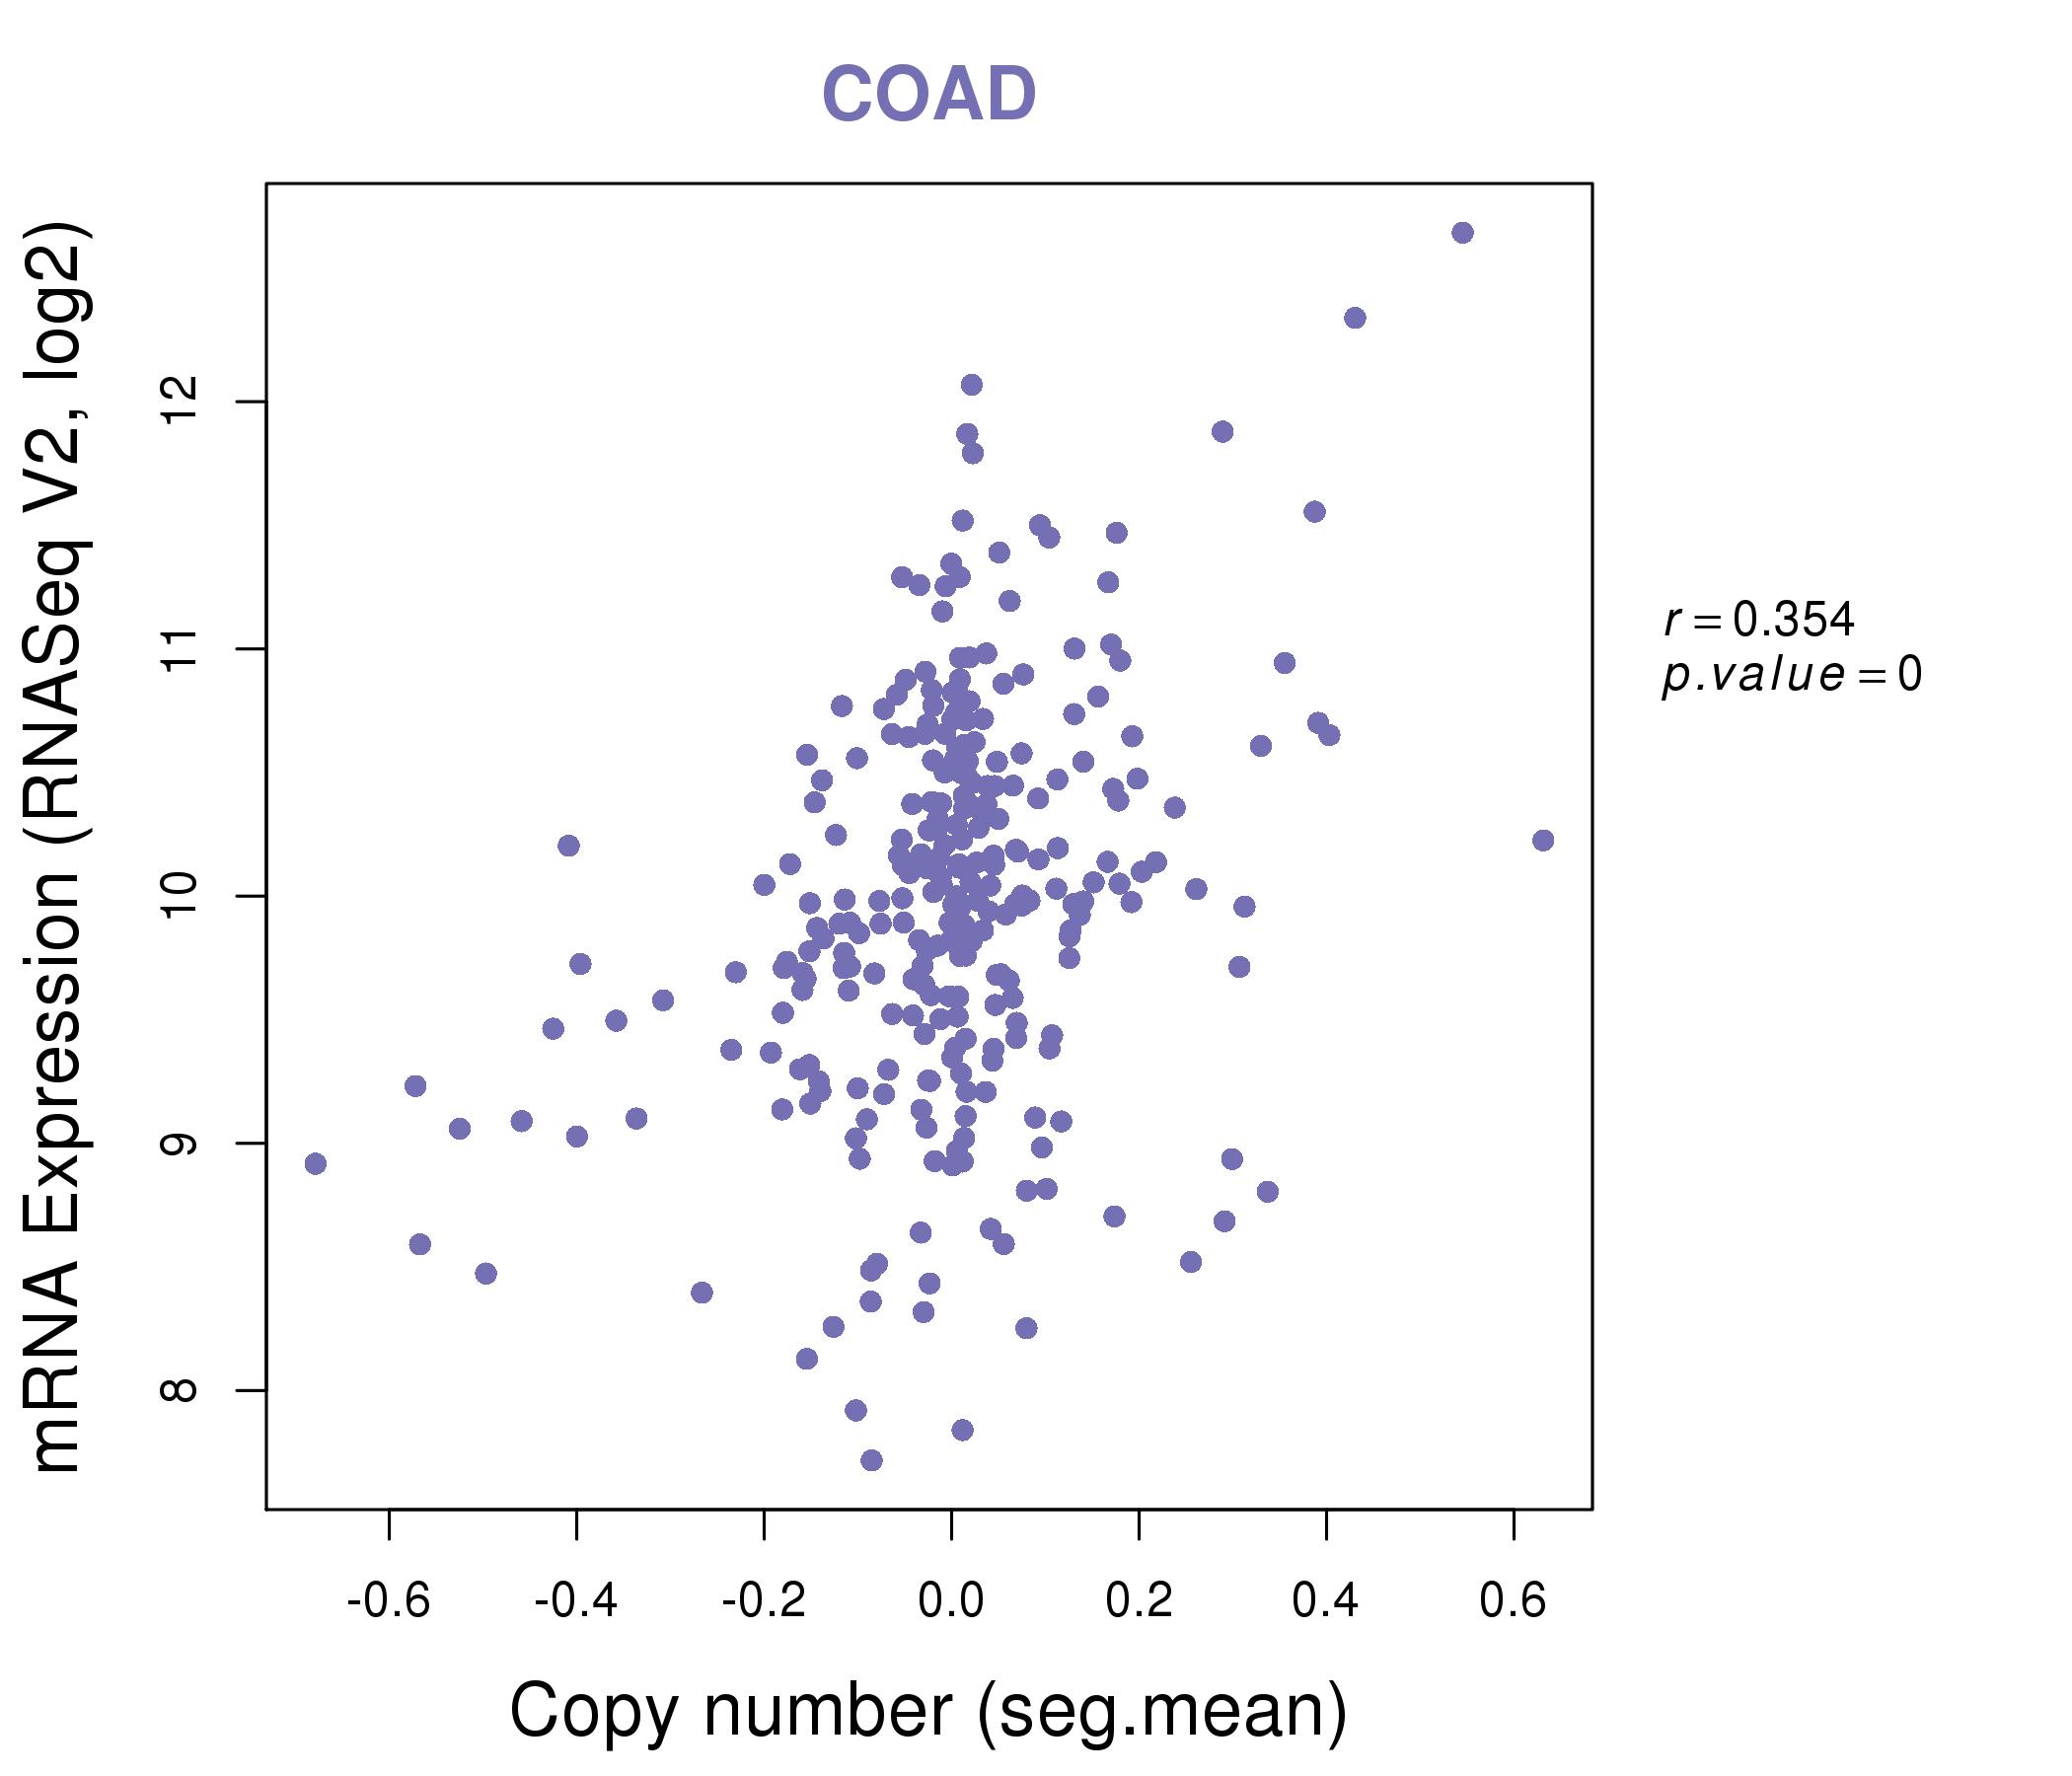
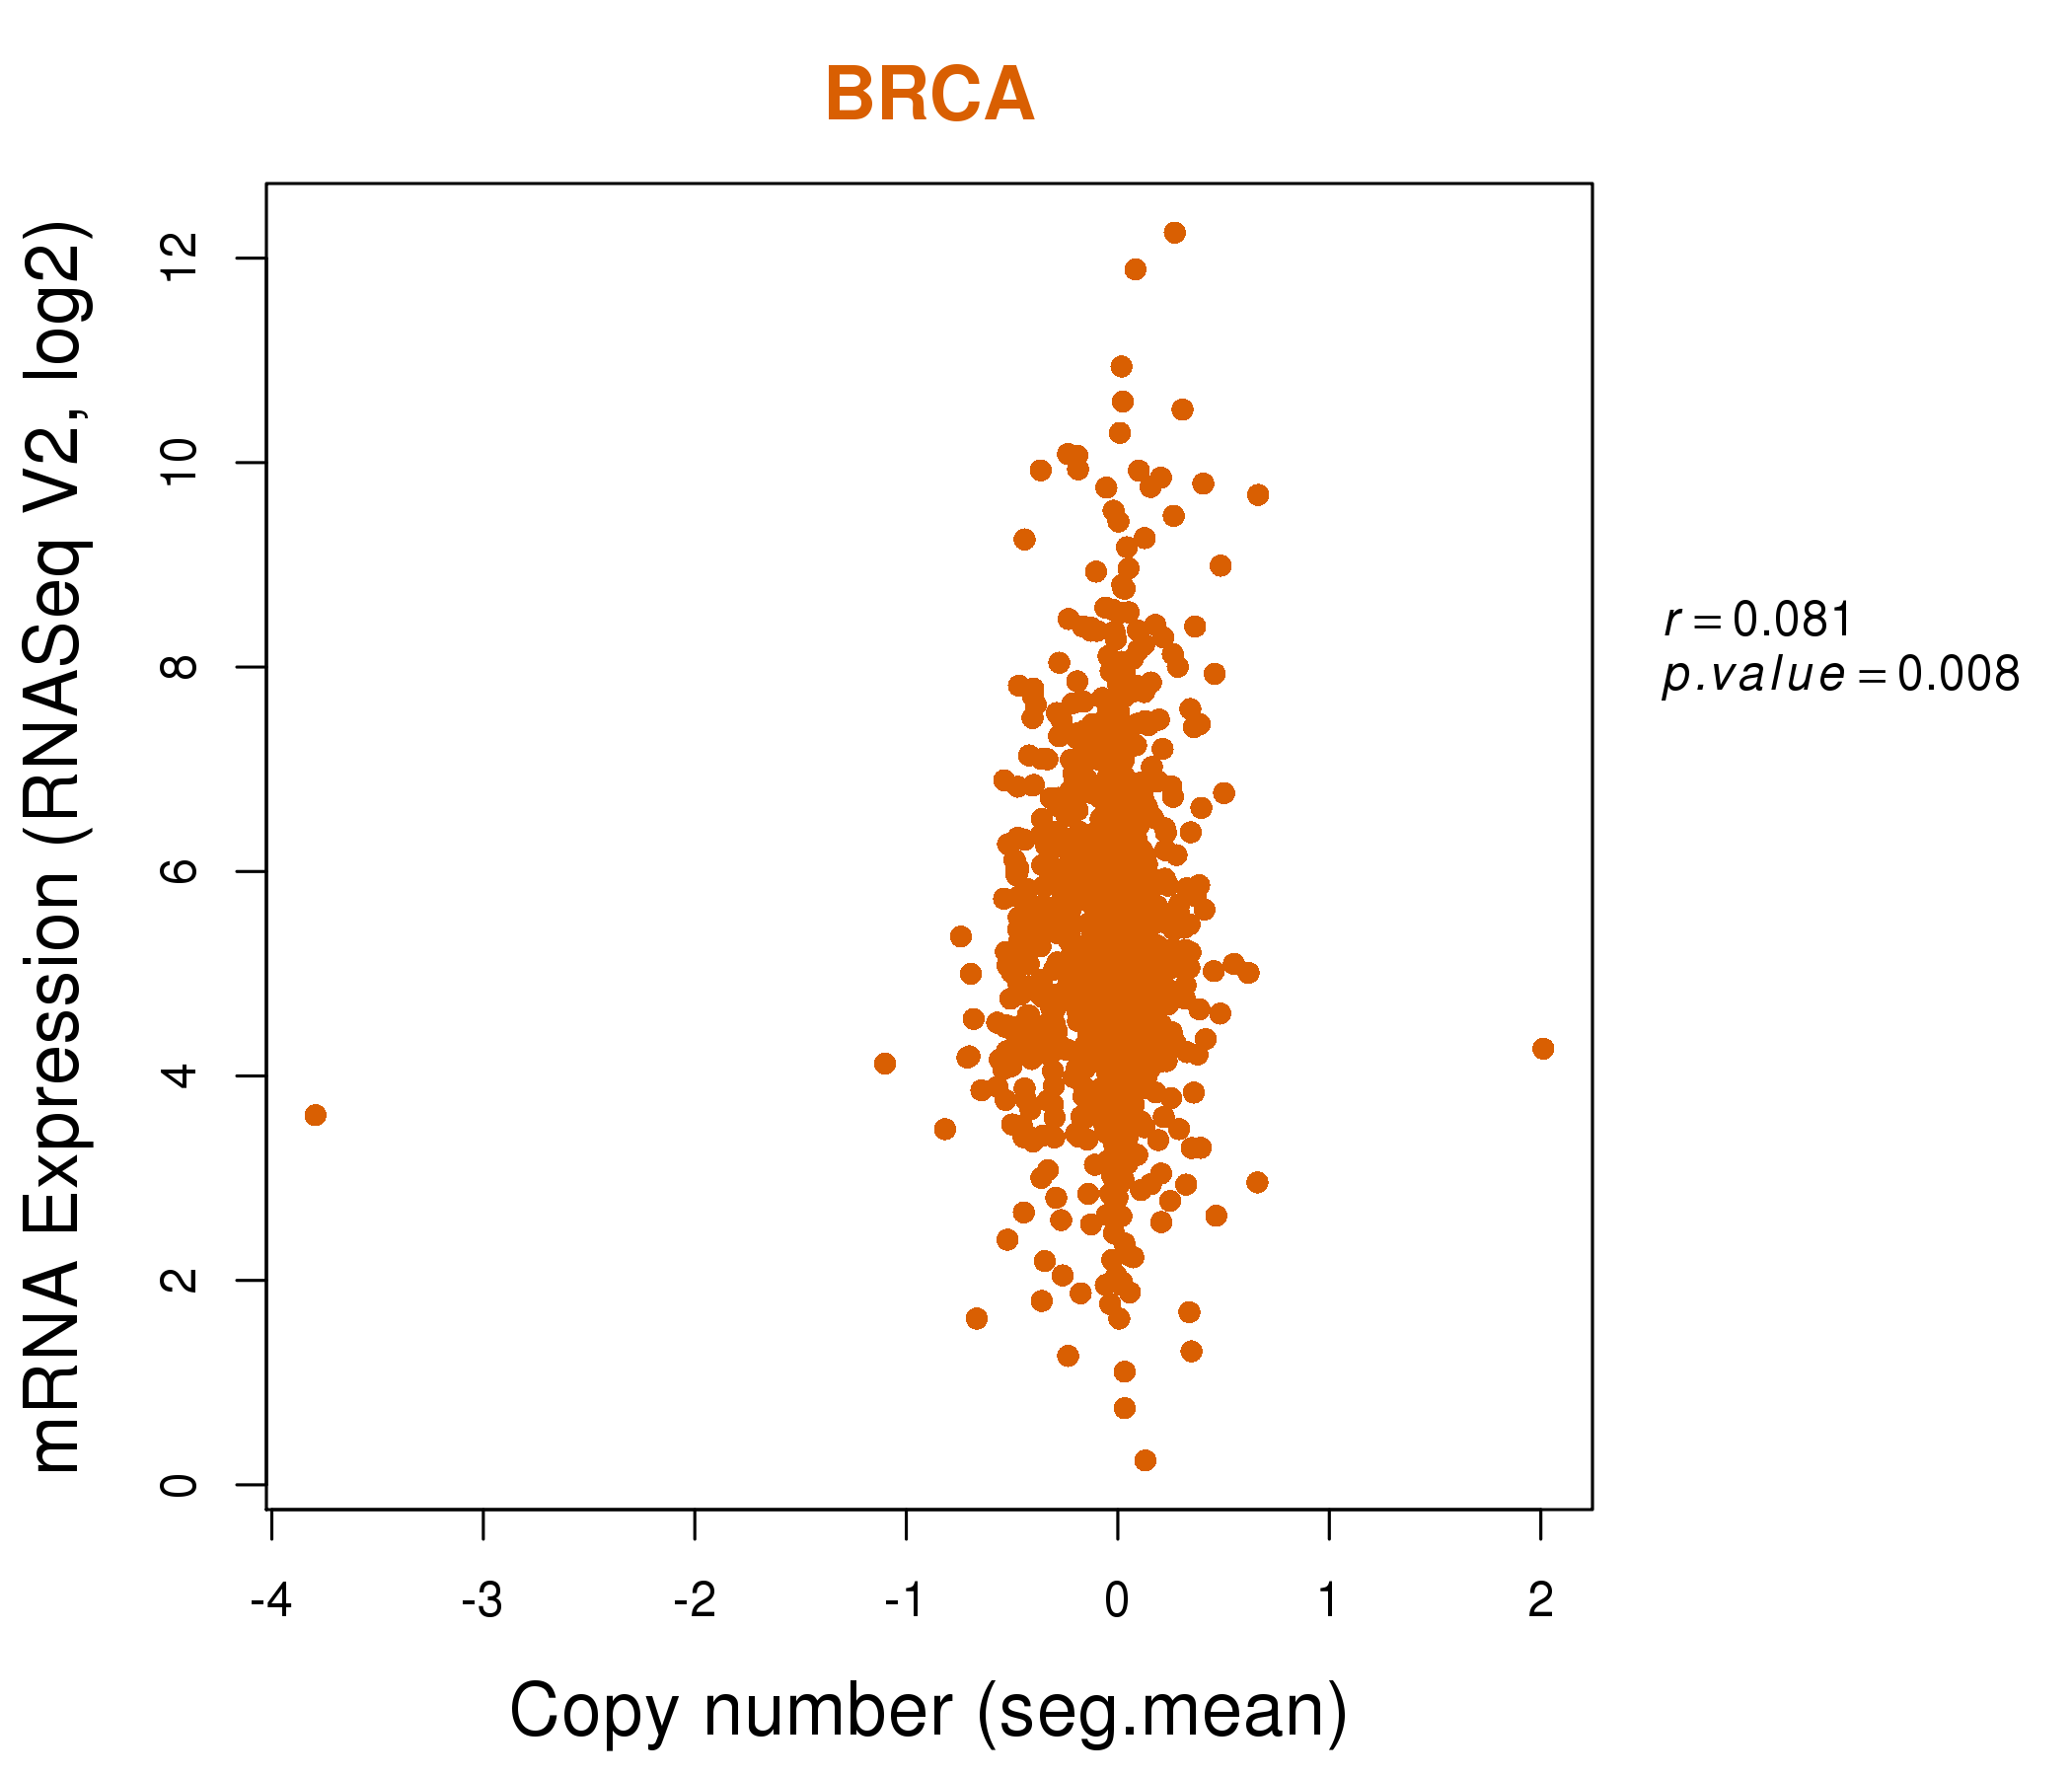
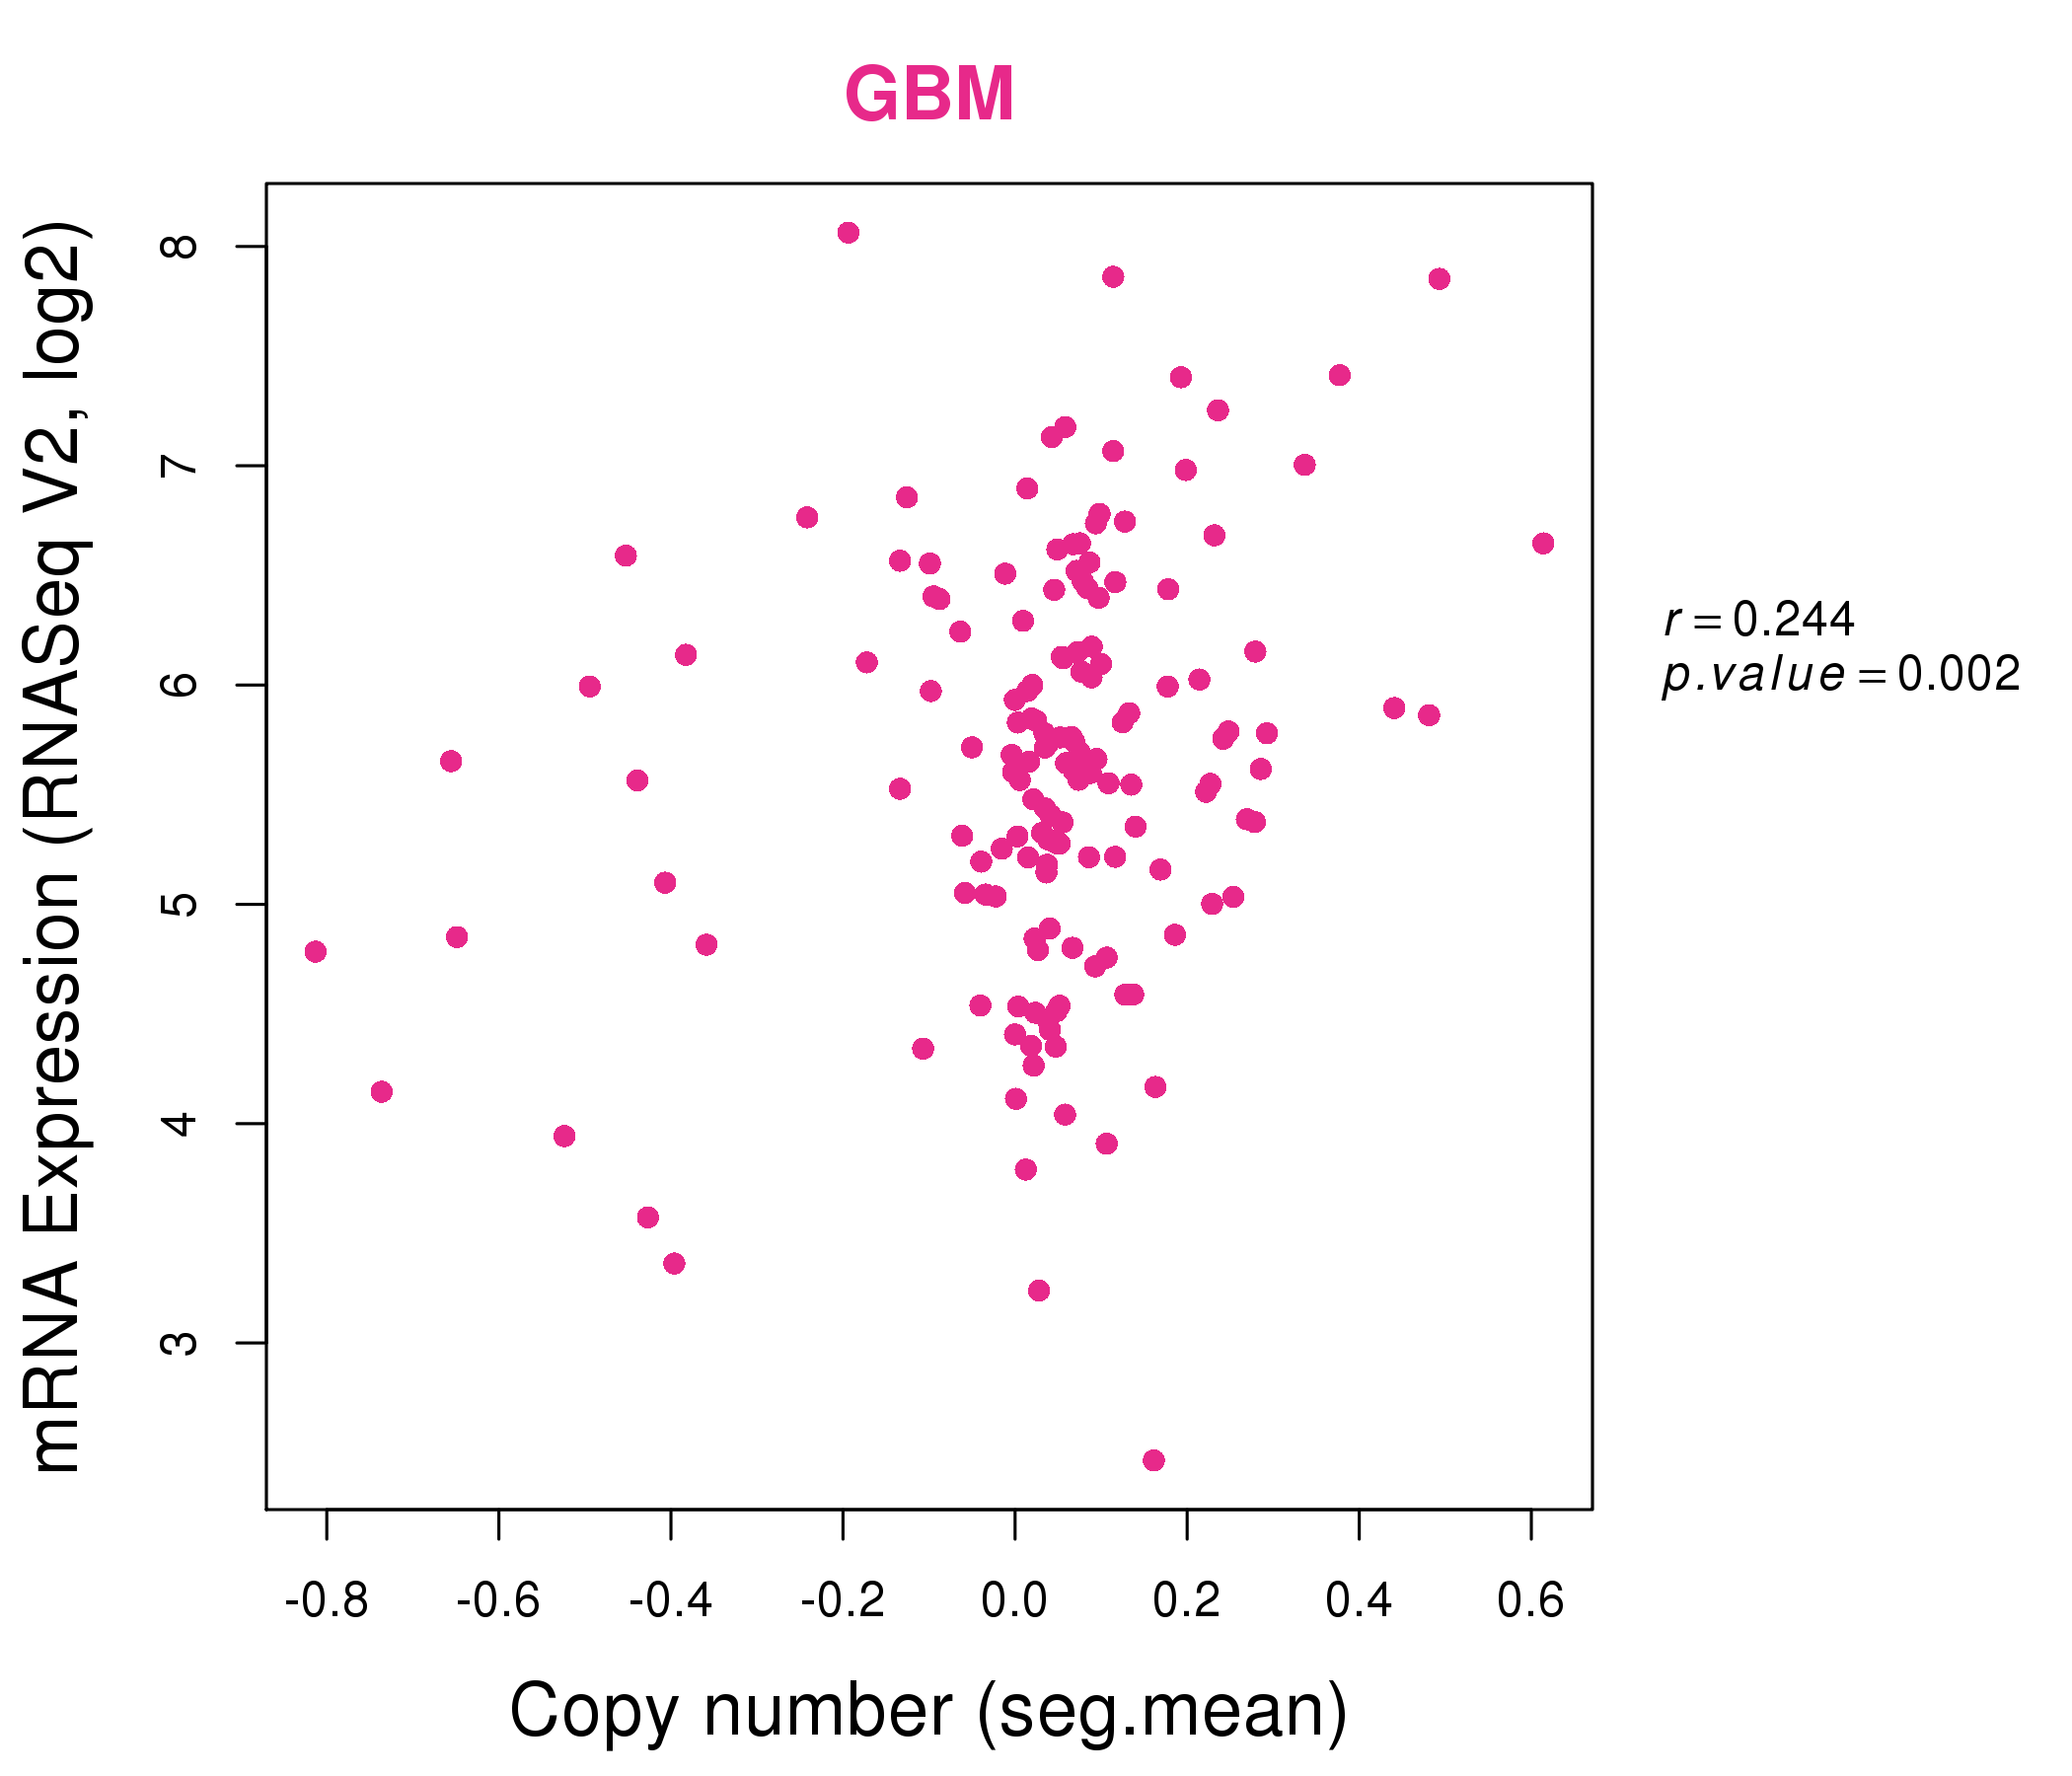
| * Copy number data were extracted from TCGA using R package TCGA-Assembler. The URLs of all public data files on TCGA DCC data server were gathered on Jan-05-2015. Function ProcessCNAData in TCGA-Assembler package was used to obtain gene-level copy number value which is calculated as the average copy number of the genomic region of a gene. |
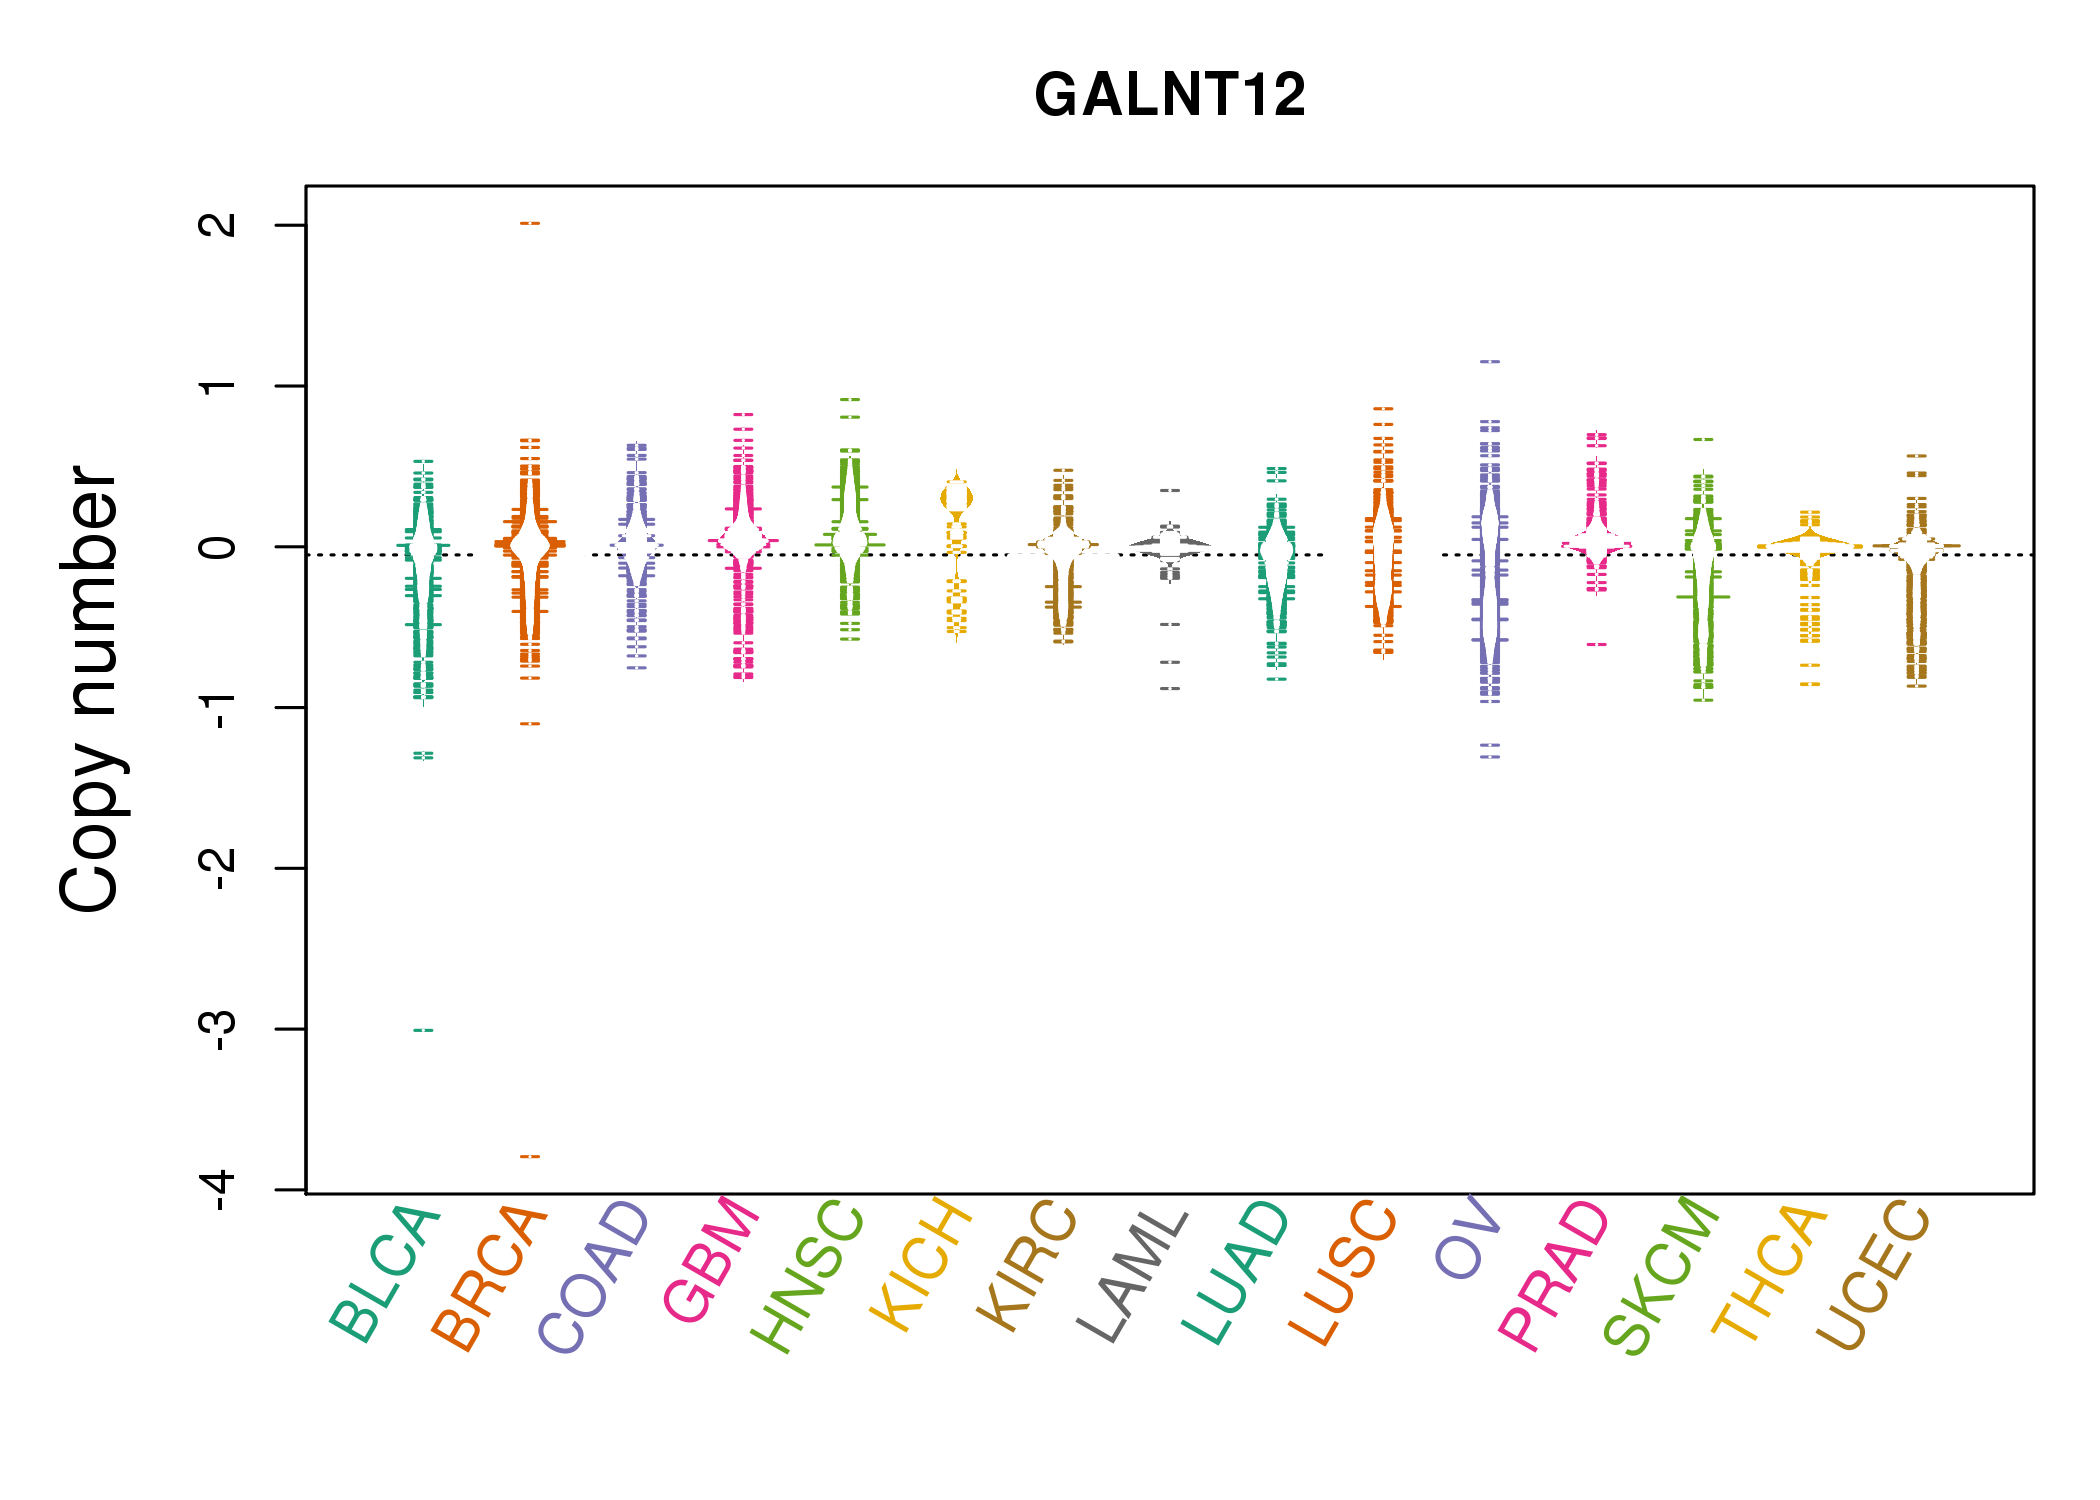 |
| cf) Tissue ID[Tissue type]: BLCA[Bladder Urothelial Carcinoma], BRCA[Breast invasive carcinoma], CESC[Cervical squamous cell carcinoma and endocervical adenocarcinoma], COAD[Colon adenocarcinoma], GBM[Glioblastoma multiforme], Glioma Low Grade, HNSC[Head and Neck squamous cell carcinoma], KICH[Kidney Chromophobe], KIRC[Kidney renal clear cell carcinoma], KIRP[Kidney renal papillary cell carcinoma], LAML[Acute Myeloid Leukemia], LUAD[Lung adenocarcinoma], LUSC[Lung squamous cell carcinoma], OV[Ovarian serous cystadenocarcinoma ], PAAD[Pancreatic adenocarcinoma], PRAD[Prostate adenocarcinoma], SKCM[Skin Cutaneous Melanoma], STAD[Stomach adenocarcinoma], THCA[Thyroid carcinoma], UCEC[Uterine Corpus Endometrial Carcinoma] |
| Top |
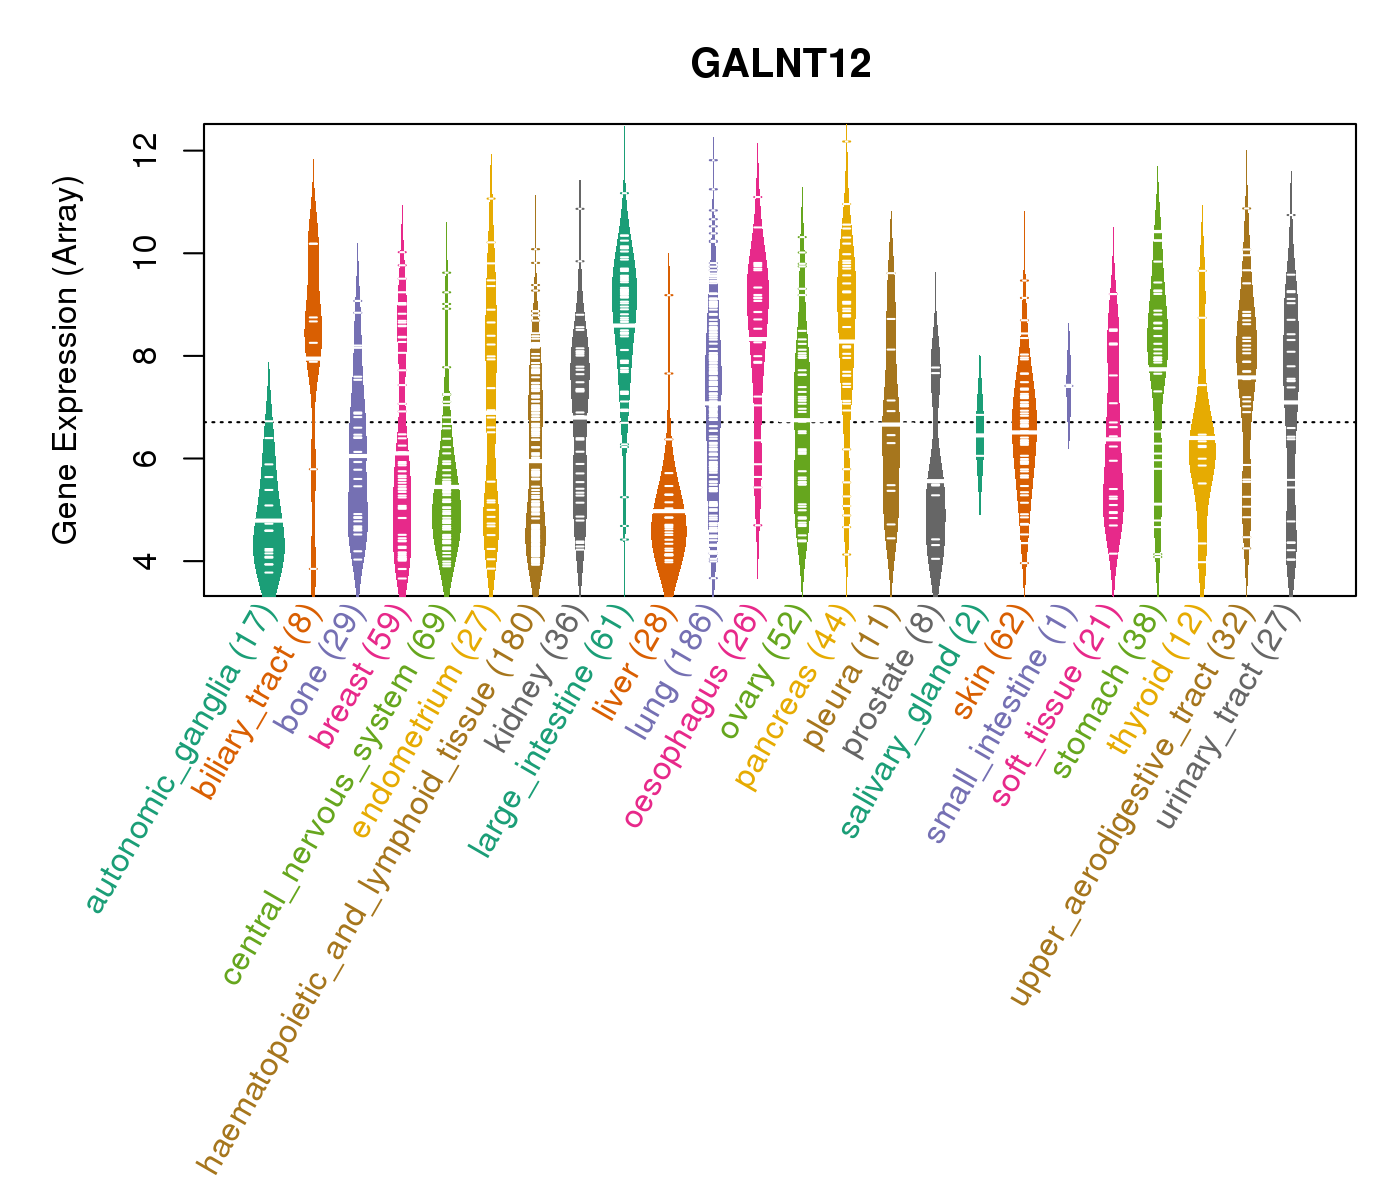
| Gene Expression for GALNT12 |
| * CCLE gene expression data were extracted from CCLE_Expression_Entrez_2012-10-18.res: Gene-centric RMA-normalized mRNA expression data. |
 |
| * Normalized gene expression data of RNASeqV2 was extracted from TCGA using R package TCGA-Assembler. The URLs of all public data files on TCGA DCC data server were gathered at Jan-05-2015. Only eight cancer types have enough normal control samples for differential expression analysis. (t test, adjusted p<0.05 (using Benjamini-Hochberg FDR)) |
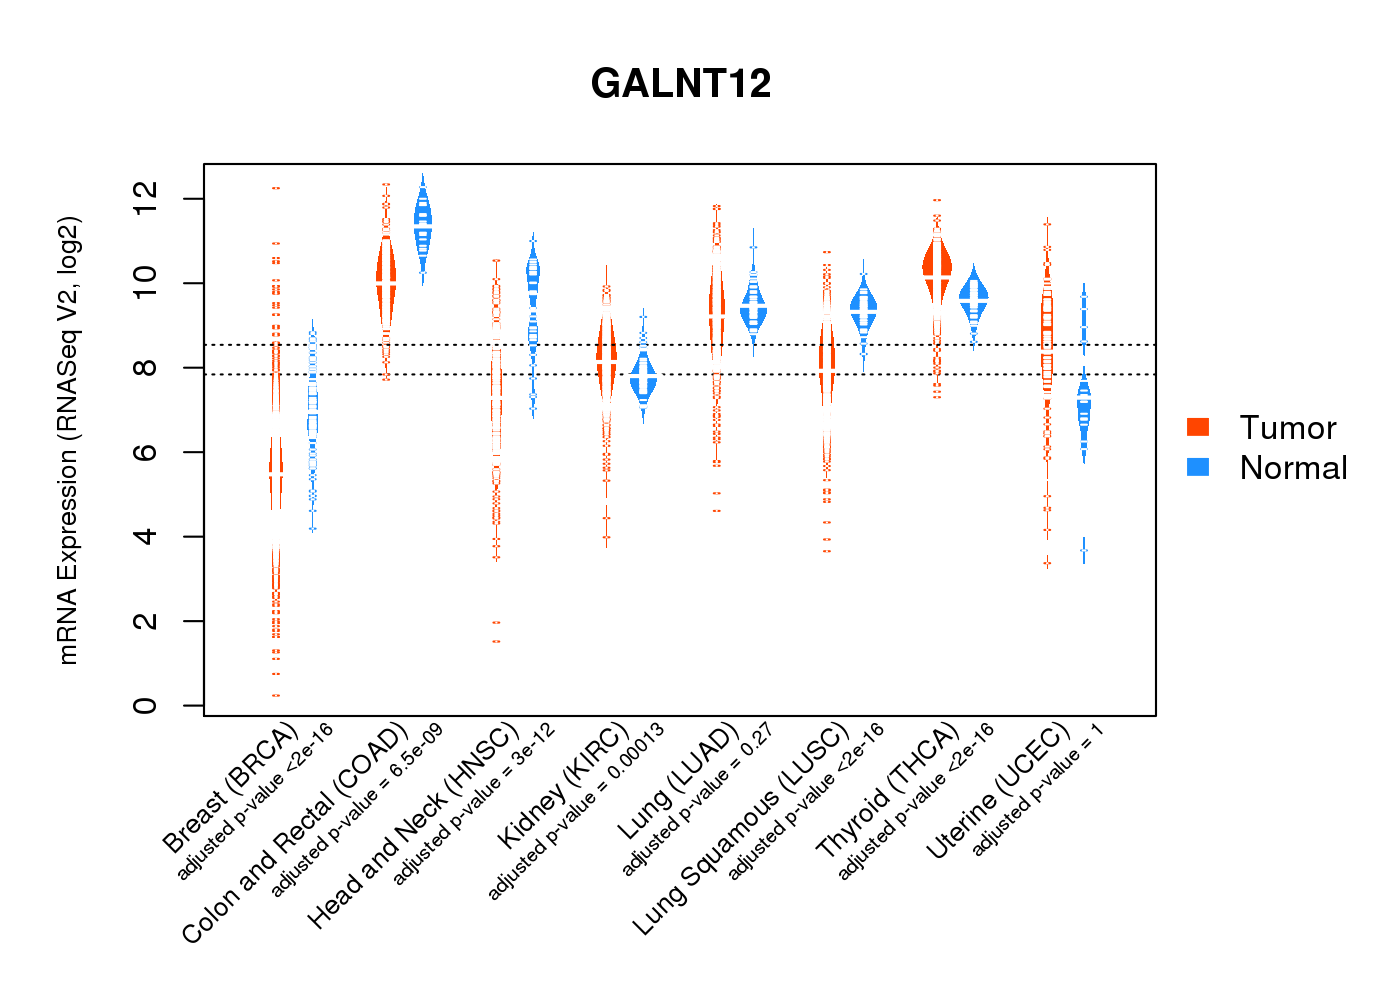 |
| Top |
| * This plots show the correlation between CNV and gene expression. |
: Open all plots for all cancer types
 |
|
 |
|
| Top |
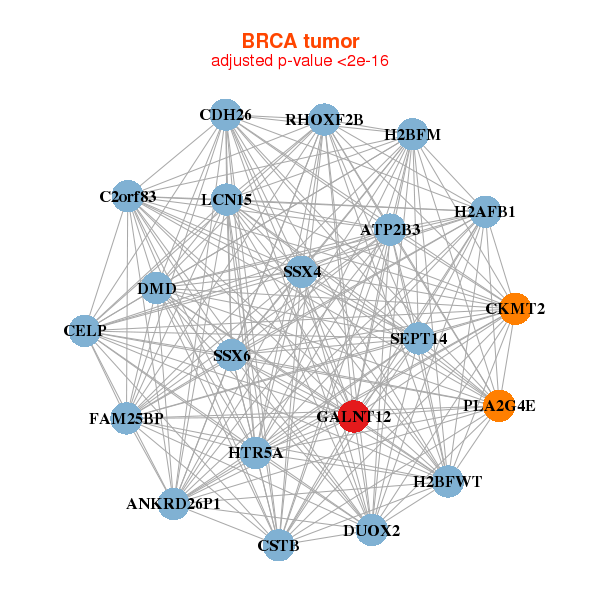
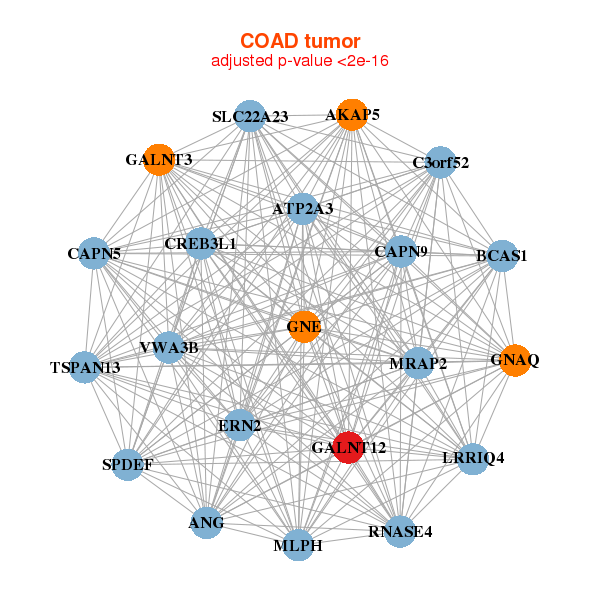
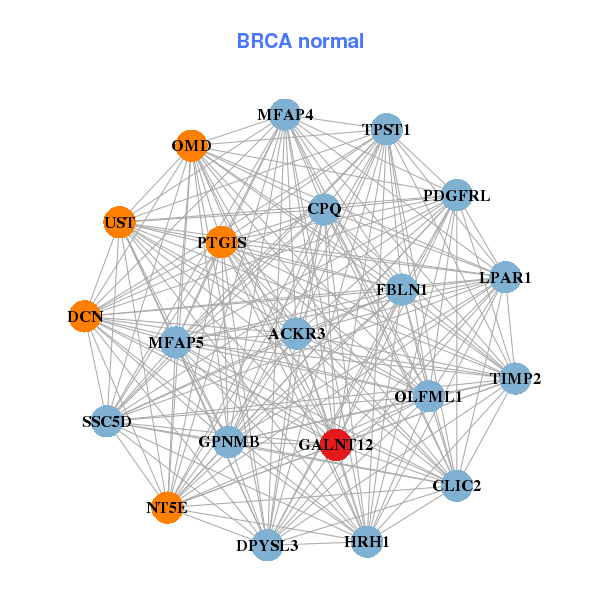
| Gene-Gene Network Information |
| * Co-Expression network figures were drawn using R package igraph. Only the top 20 genes with the highest correlations were shown. Red circle: input gene, orange circle: cell metabolism gene, sky circle: other gene |
: Open all plots for all cancer types
 |
|
| ANKRD26P1,ATP2B3,C2orf83,CDH26,CELP,CKMT2,CSTB, DMD,DUOX2,FAM25BP,GALNT12,H2AFB1,H2BFM,H2BFWT, HTR5A,LCN15,PLA2G4E,RHOXF2B,SEPT14,SSX4,SSX6 | CLIC2,ACKR3,DCN,DPYSL3,FBLN1,GALNT12,GPNMB, HRH1,LPAR1,MFAP4,MFAP5,NT5E,OLFML1,OMD, PDGFRL,CPQ,PTGIS,SSC5D,TIMP2,TPST1,UST |
 |
|
| AKAP5,ANG,ATP2A3,BCAS1,C3orf52,CAPN5,CAPN9, CREB3L1,ERN2,GALNT12,GALNT3,GNAQ,GNE,LRRIQ4, MLPH,MRAP2,RNASE4,SLC22A23,SPDEF,TSPAN13,VWA3B | ACVR1B,AMACR,BCAS1,C12orf75,DHX32,ENDOD1,GALNT12, ILDR1,IRF6,ITM2C,LSR,MARCH3,MTM1,OAF, PRDX6,RIMKLA,SLC26A6,SPINT2,SYTL2,TMPRSS4,TSPAN3 |
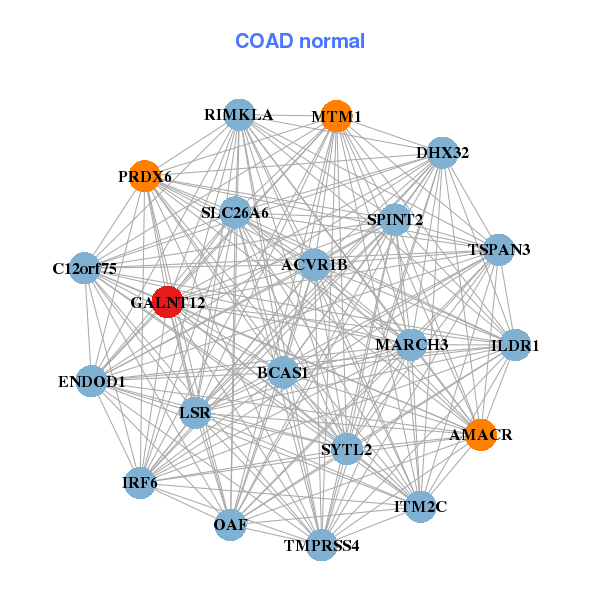
| * Co-Expression network figures were drawn using R package igraph. Only the top 20 genes with the highest correlations were shown. Red circle: input gene, orange circle: cell metabolism gene, sky circle: other gene |
: Open all plots for all cancer types
| Top |
: Open all interacting genes' information including KEGG pathway for all interacting genes from DAVID
| Top |
| Pharmacological Information for GALNT12 |
| There's no related Drug. |
| Top |
| Cross referenced IDs for GALNT12 |
| * We obtained these cross-references from Uniprot database. It covers 150 different DBs, 18 categories. http://www.uniprot.org/help/cross_references_section |
: Open all cross reference information
|
Copyright © 2016-Present - The Univsersity of Texas Health Science Center at Houston @ |