|
||||||||||||||||||||
| |
| Phenotypic Information (metabolism pathway, cancer, disease, phenome) |
| |
| |
| Gene-Gene Network Information: Co-Expression Network, Interacting Genes & KEGG |
| |
|


| Gene Summary for PPCS |
| Top |
| Phenotypic Information for PPCS(metabolism pathway, cancer, disease, phenome) |
| Cancer | CGAP: PPCS |
| Familial Cancer Database: PPCS | |
| * This gene is included in those cancer gene databases. |
|
|
|
|
|
| . | ||||||||||||||
Oncogene 1 | Significant driver gene in | |||||||||||||||||||
| cf) number; DB name 1 Oncogene; http://nar.oxfordjournals.org/content/35/suppl_1/D721.long, 2 Tumor Suppressor gene; https://bioinfo.uth.edu/TSGene/, 3 Cancer Gene Census; http://www.nature.com/nrc/journal/v4/n3/abs/nrc1299.html, 4 CancerGenes; http://nar.oxfordjournals.org/content/35/suppl_1/D721.long, 5 Network of Cancer Gene; http://ncg.kcl.ac.uk/index.php, 1Therapeutic Vulnerabilities in Cancer; http://cbio.mskcc.org/cancergenomics/statius/ |
| REACTOME_METABOLISM_OF_VITAMINS_AND_COFACTORS | |
| OMIM | |
| Orphanet | |
| Disease | KEGG Disease: PPCS |
| MedGen: PPCS (Human Medical Genetics with Condition) | |
| ClinVar: PPCS | |
| Phenotype | MGI: PPCS (International Mouse Phenotyping Consortium) |
| PhenomicDB: PPCS | |
| Mutations for PPCS |
| * Under tables are showing count per each tissue to give us broad intuition about tissue specific mutation patterns.You can go to the detailed page for each mutation database's web site. |
| There's no structural variation information in COSMIC data for this gene. |
| * From mRNA Sanger sequences, Chitars2.0 arranged chimeric transcripts. This table shows PPCS related fusion information. |
| ID | Head Gene | Tail Gene | Accession | Gene_a | qStart_a | qEnd_a | Chromosome_a | tStart_a | tEnd_a | Gene_a | qStart_a | qEnd_a | Chromosome_a | tStart_a | tEnd_a |
| Top |
| There's no copy number variation information in COSMIC data for this gene. |
| Top |
|
 |
| Top |
| Stat. for Non-Synonymous SNVs (# total SNVs=15) | (# total SNVs=4) |
 |  |
(# total SNVs=1) | (# total SNVs=1) |
 |  |
| Top |
| * When you move the cursor on each content, you can see more deailed mutation information on the Tooltip. Those are primary_site,primary_histology,mutation(aa),pubmedID. |
| GRCh37 position | Mutation(aa) | Unique sampleID count |
| chr1:42922612-42922612 | p.P126S | 3 |
| chr1:42925369-42925369 | p.P236P | 2 |
| chr1:42925482-42925482 | p.S274L | 1 |
| chr1:42922652-42922652 | p.A139V | 1 |
| chr1:42925368-42925368 | p.P236L | 1 |
| chr1:42925517-42925517 | p.E286Q | 1 |
| chr1:42922666-42922666 | p.F144I | 1 |
| chr1:42922346-42922346 | p.V37G | 1 |
| chr1:42925522-42925522 | p.K287K | 1 |
| chr1:42922700-42922700 | p.Y155C | 1 |
| Top |
|
 |
| Point Mutation/ Tissue ID | 1 | 2 | 3 | 4 | 5 | 6 | 7 | 8 | 9 | 10 | 11 | 12 | 13 | 14 | 15 | 16 | 17 | 18 | 19 | 20 |
| # sample | 2 | 4 | 1 | 2 | 1 | 2 | 2 | 2 | 4 | |||||||||||
| # mutation | 2 | 4 | 1 | 2 | 1 | 3 | 2 | 2 | 4 | |||||||||||
| nonsynonymous SNV | 1 | 3 | 1 | 1 | 1 | 3 | 2 | 4 | ||||||||||||
| synonymous SNV | 1 | 1 | 1 | 2 |
| cf) Tissue ID; Tissue type (1; BLCA[Bladder Urothelial Carcinoma], 2; BRCA[Breast invasive carcinoma], 3; CESC[Cervical squamous cell carcinoma and endocervical adenocarcinoma], 4; COAD[Colon adenocarcinoma], 5; GBM[Glioblastoma multiforme], 6; Glioma Low Grade, 7; HNSC[Head and Neck squamous cell carcinoma], 8; KICH[Kidney Chromophobe], 9; KIRC[Kidney renal clear cell carcinoma], 10; KIRP[Kidney renal papillary cell carcinoma], 11; LAML[Acute Myeloid Leukemia], 12; LUAD[Lung adenocarcinoma], 13; LUSC[Lung squamous cell carcinoma], 14; OV[Ovarian serous cystadenocarcinoma ], 15; PAAD[Pancreatic adenocarcinoma], 16; PRAD[Prostate adenocarcinoma], 17; SKCM[Skin Cutaneous Melanoma], 18:STAD[Stomach adenocarcinoma], 19:THCA[Thyroid carcinoma], 20:UCEC[Uterine Corpus Endometrial Carcinoma]) |
| Top |
| * We represented just top 10 SNVs. When you move the cursor on each content, you can see more deailed mutation information on the Tooltip. Those are primary_site, primary_histology, mutation(aa), pubmedID. |
| Genomic Position | Mutation(aa) | Unique sampleID count |
| chr1:42923009 | p.S56F,PPCS | 1 |
| chr1:42925522 | p.P63L,PPCS | 1 |
| chr1:42925334 | p.A64T,PPCS | 1 |
| chr1:42922269 | p.R71W,PPCS | 1 |
| chr1:42925347 | p.Q80E,PPCS | 1 |
| chr1:42922574 | p.P11P,PPCS | 1 |
| chr1:42925368 | p.A84A,PPCS | 1 |
| chr1:42922602 | p.S113L,PPCS | 1 |
| chr1:42925370 | p.N85D,PPCS | 1 |
| chr1:42922612 | p.E122E,PPCS | 1 |
| * Copy number data were extracted from TCGA using R package TCGA-Assembler. The URLs of all public data files on TCGA DCC data server were gathered on Jan-05-2015. Function ProcessCNAData in TCGA-Assembler package was used to obtain gene-level copy number value which is calculated as the average copy number of the genomic region of a gene. |
 |
| cf) Tissue ID[Tissue type]: BLCA[Bladder Urothelial Carcinoma], BRCA[Breast invasive carcinoma], CESC[Cervical squamous cell carcinoma and endocervical adenocarcinoma], COAD[Colon adenocarcinoma], GBM[Glioblastoma multiforme], Glioma Low Grade, HNSC[Head and Neck squamous cell carcinoma], KICH[Kidney Chromophobe], KIRC[Kidney renal clear cell carcinoma], KIRP[Kidney renal papillary cell carcinoma], LAML[Acute Myeloid Leukemia], LUAD[Lung adenocarcinoma], LUSC[Lung squamous cell carcinoma], OV[Ovarian serous cystadenocarcinoma ], PAAD[Pancreatic adenocarcinoma], PRAD[Prostate adenocarcinoma], SKCM[Skin Cutaneous Melanoma], STAD[Stomach adenocarcinoma], THCA[Thyroid carcinoma], UCEC[Uterine Corpus Endometrial Carcinoma] |
| Top |
| Gene Expression for PPCS |
| * CCLE gene expression data were extracted from CCLE_Expression_Entrez_2012-10-18.res: Gene-centric RMA-normalized mRNA expression data. |
 |
| * Normalized gene expression data of RNASeqV2 was extracted from TCGA using R package TCGA-Assembler. The URLs of all public data files on TCGA DCC data server were gathered at Jan-05-2015. Only eight cancer types have enough normal control samples for differential expression analysis. (t test, adjusted p<0.05 (using Benjamini-Hochberg FDR)) |
 |
| Top |
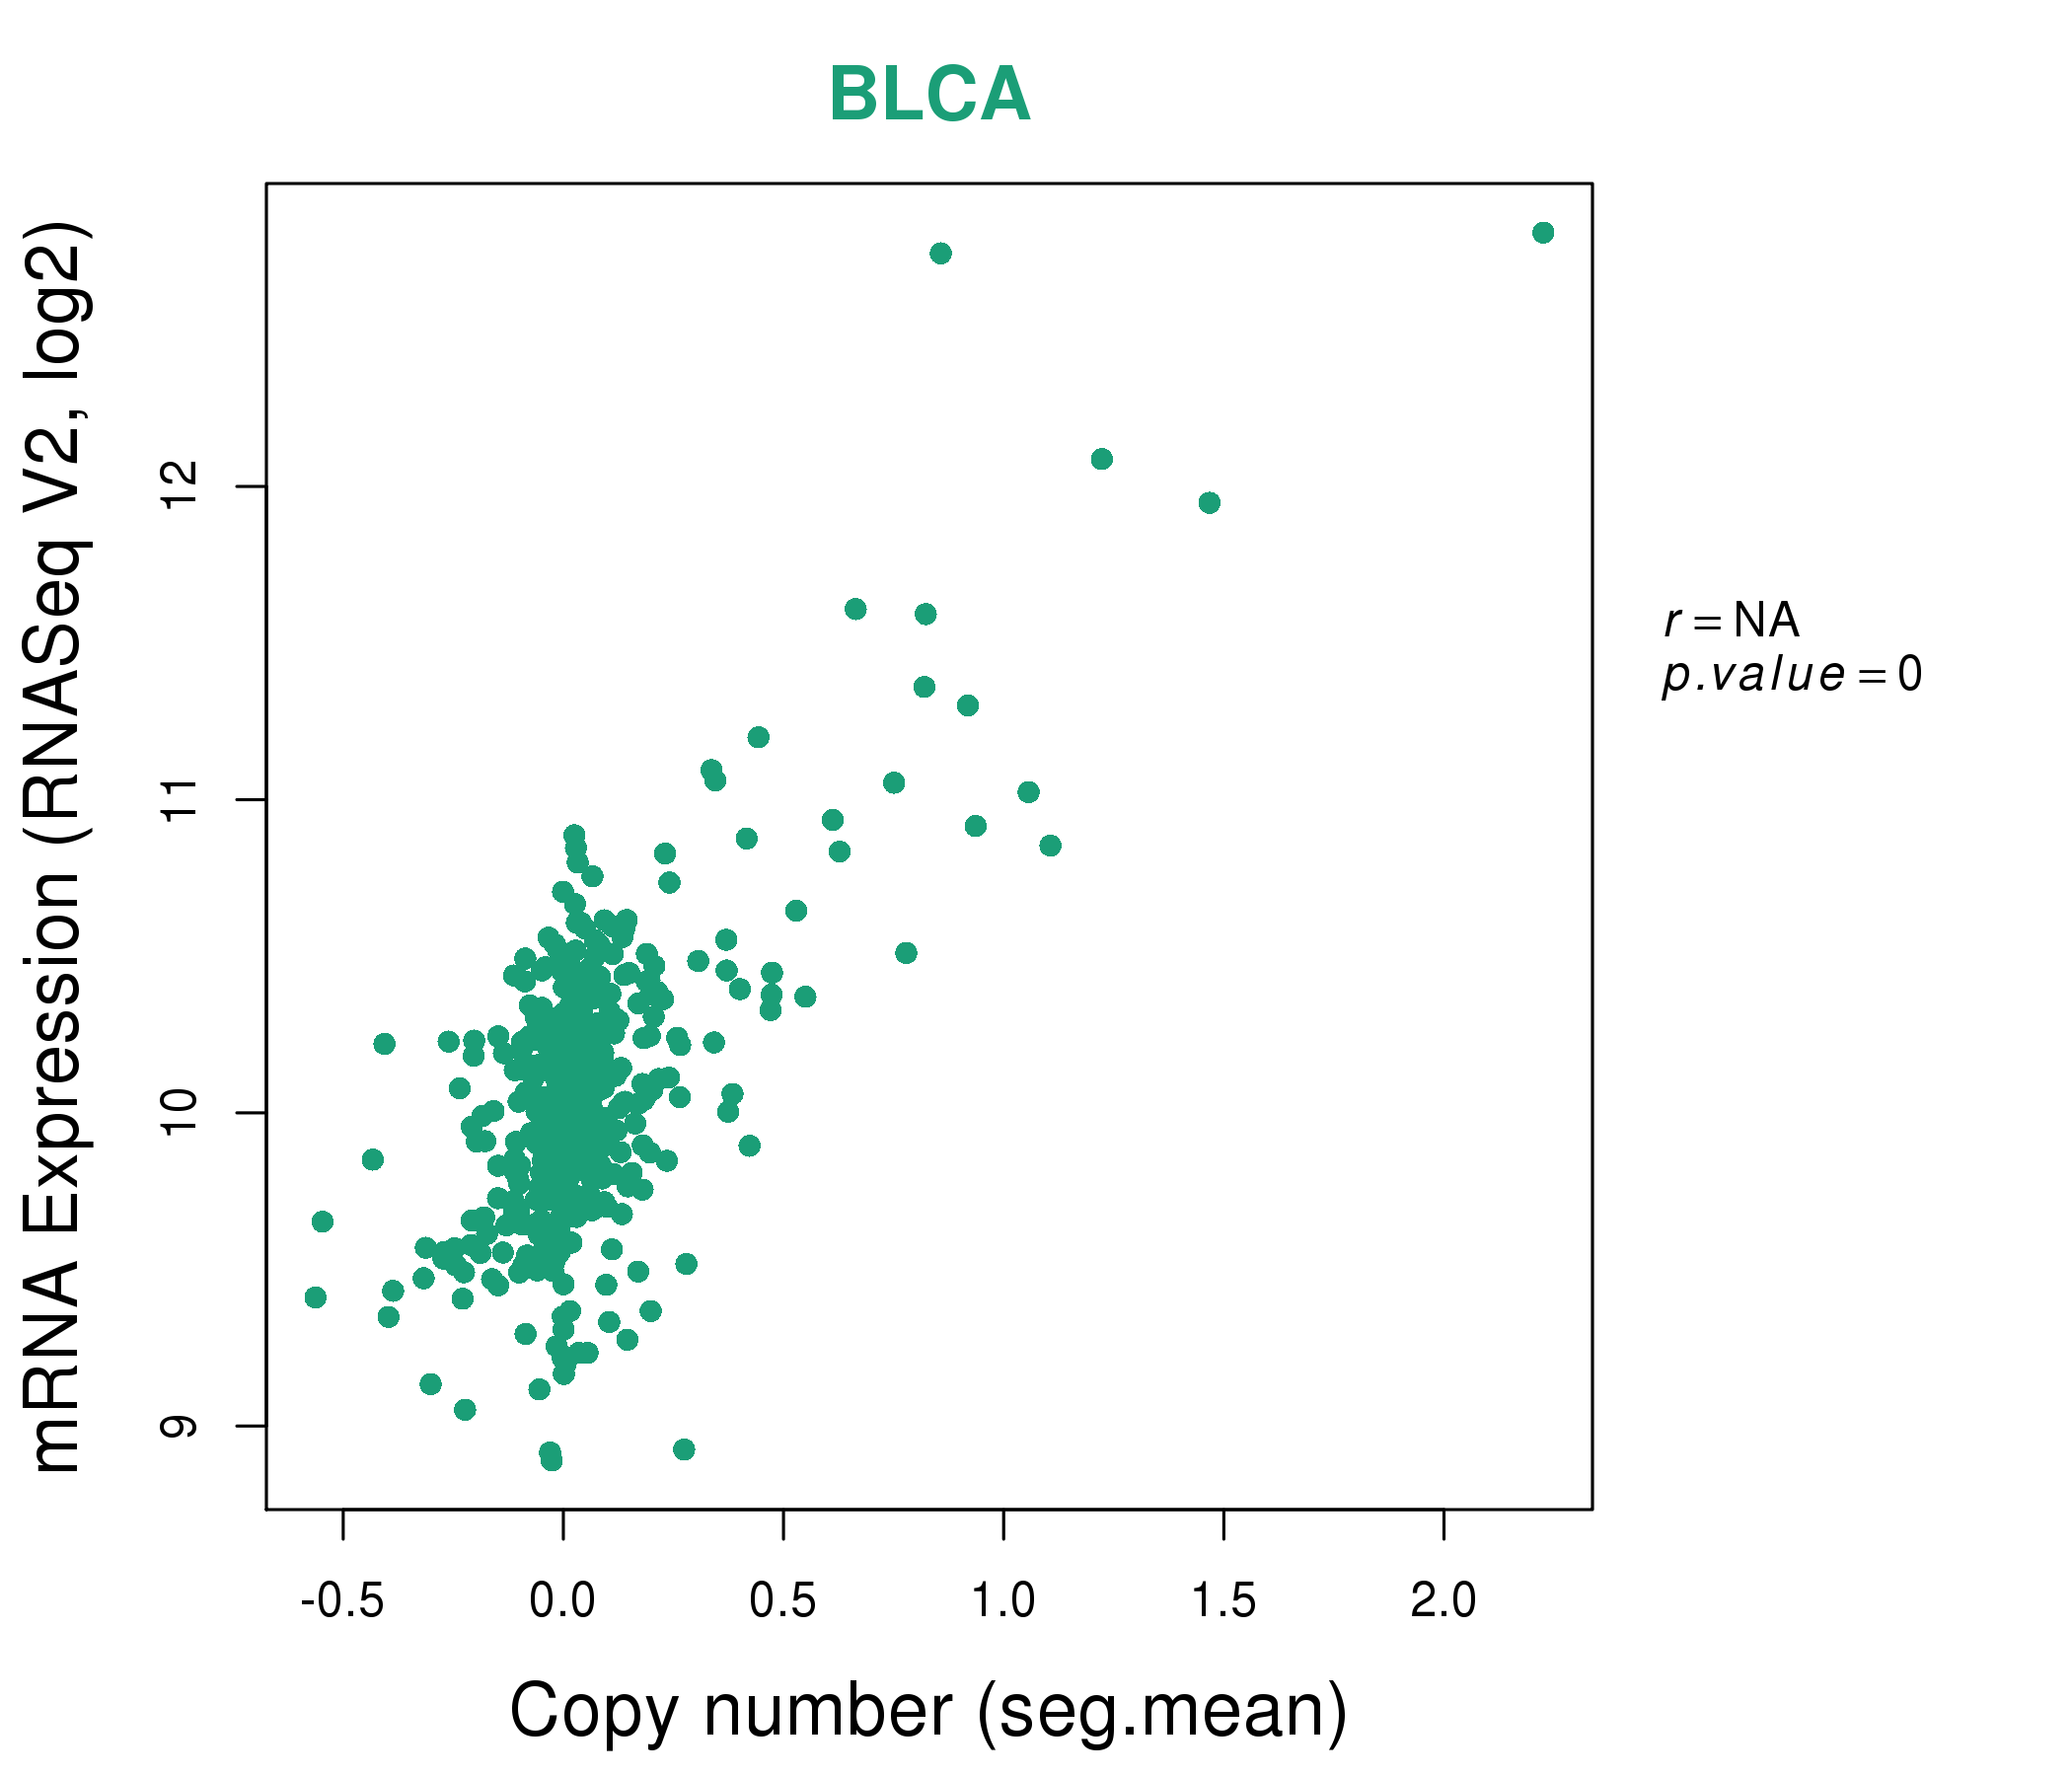
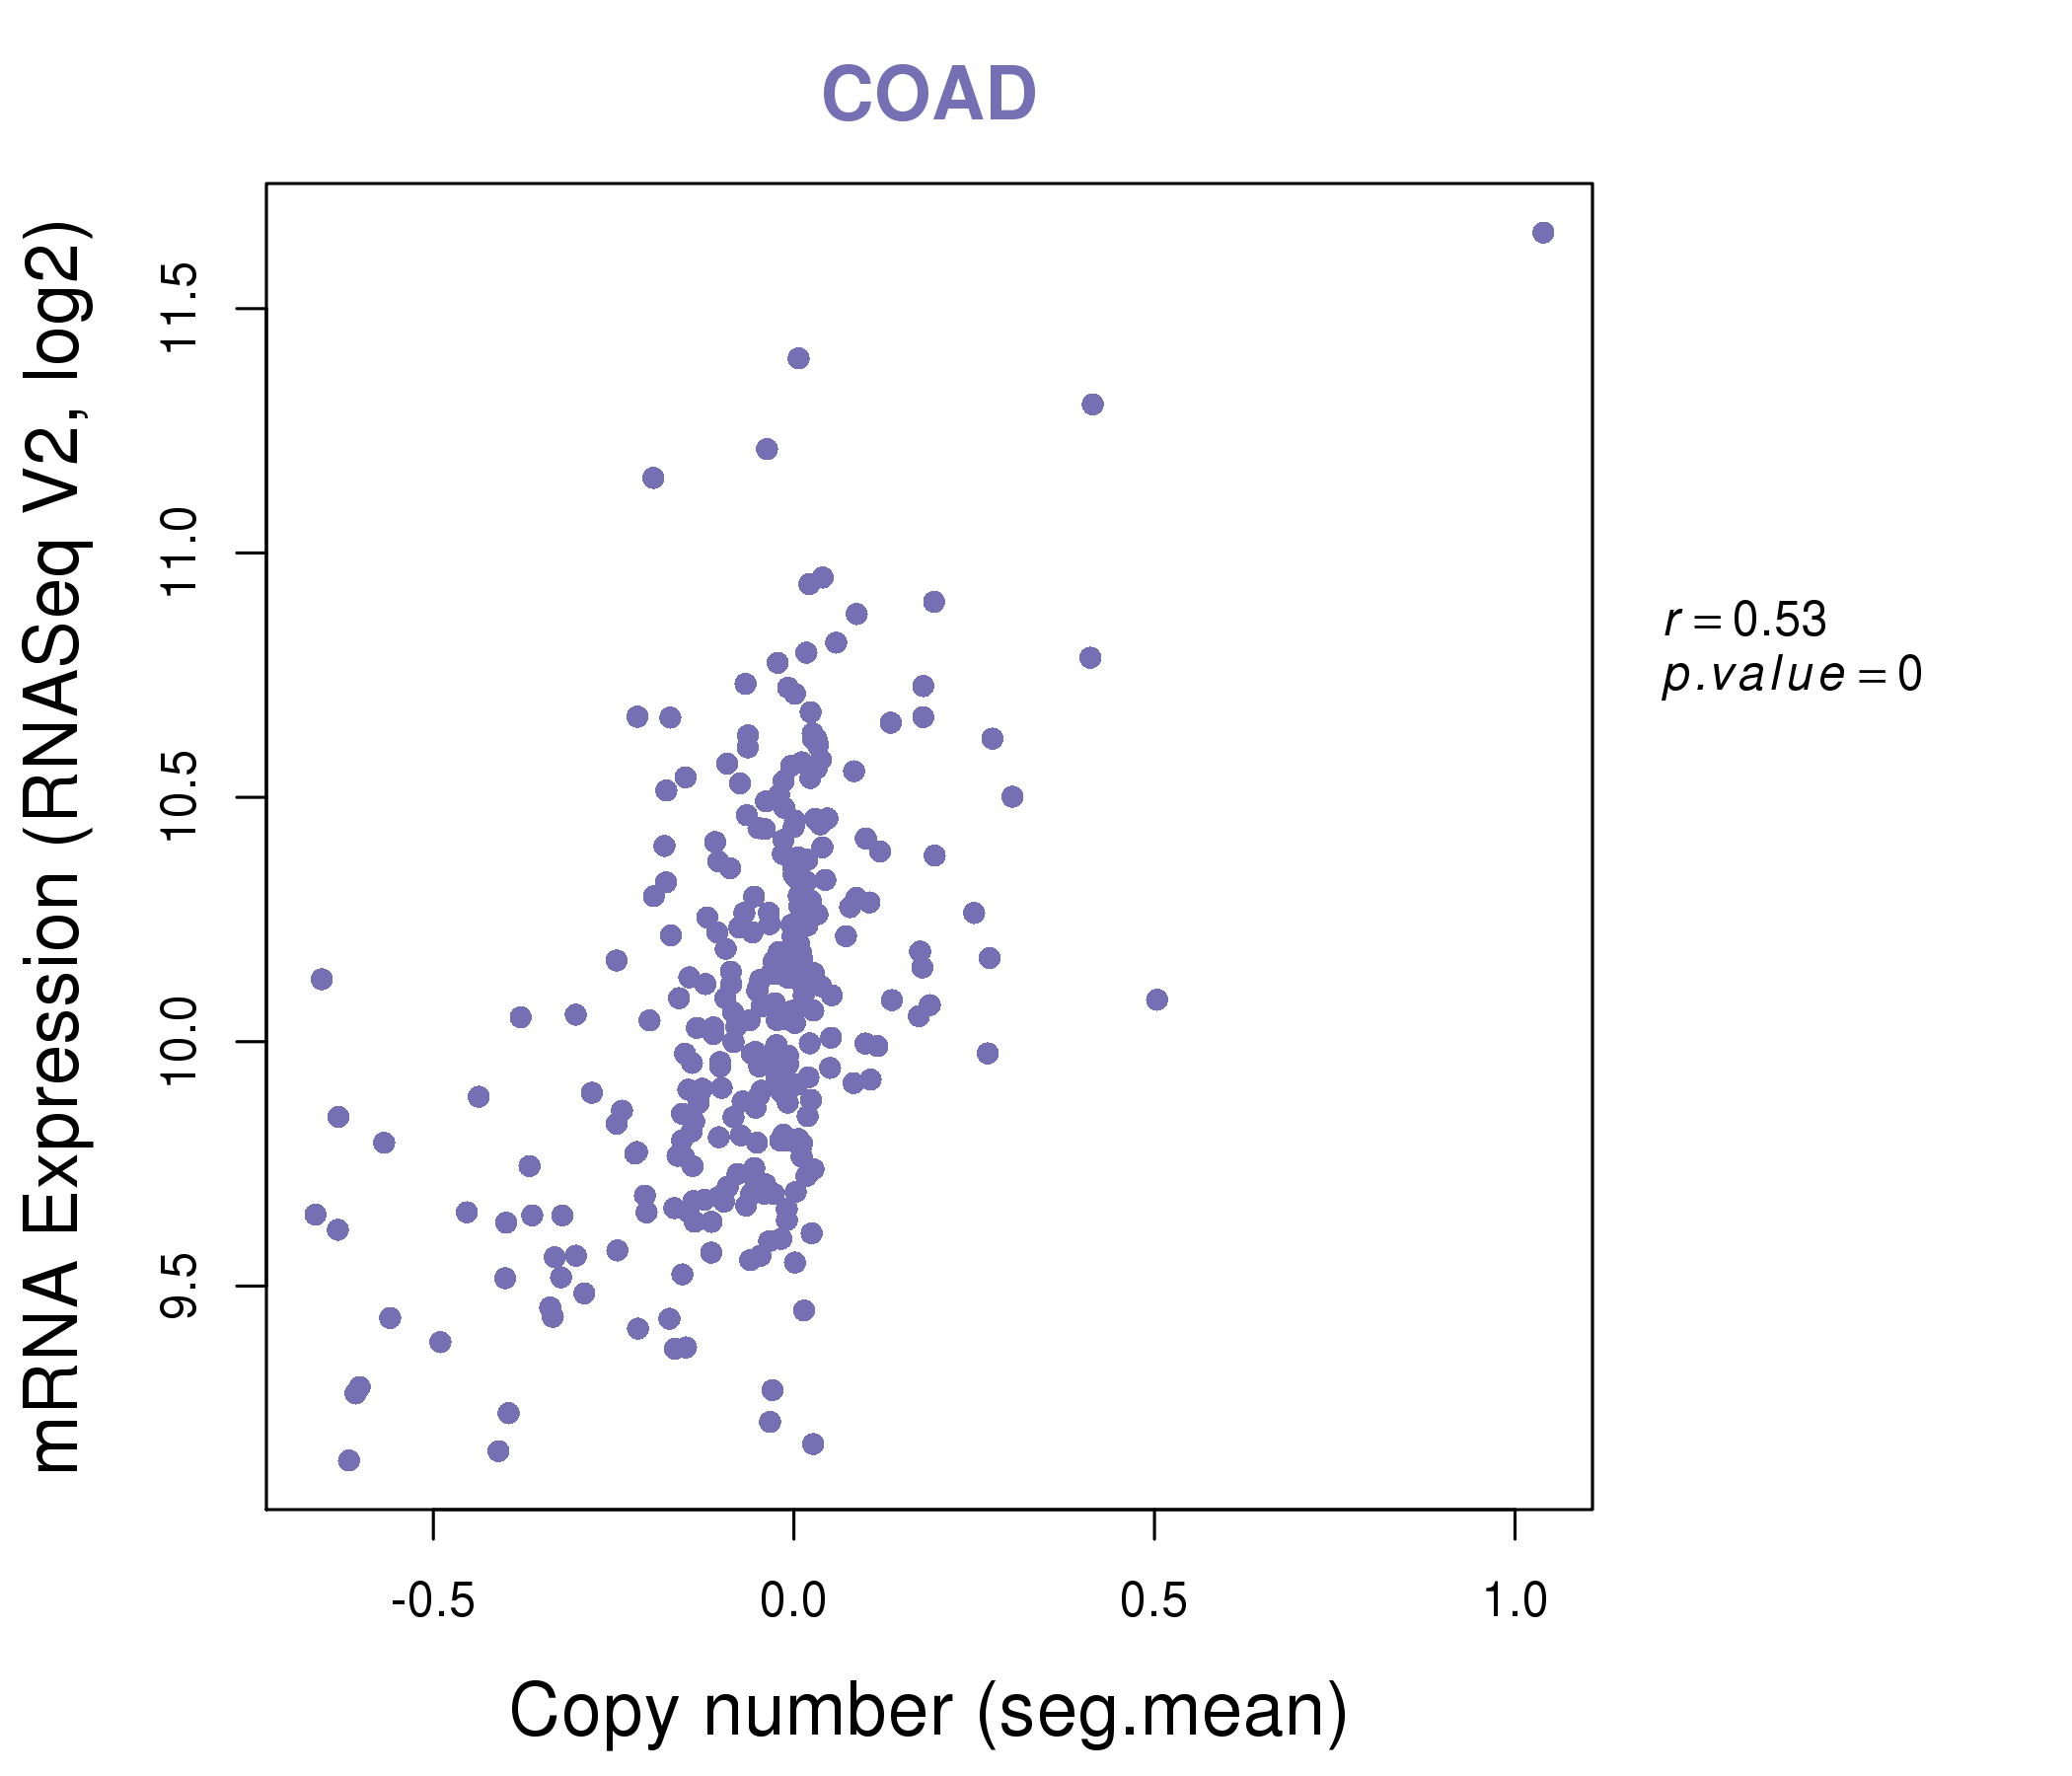
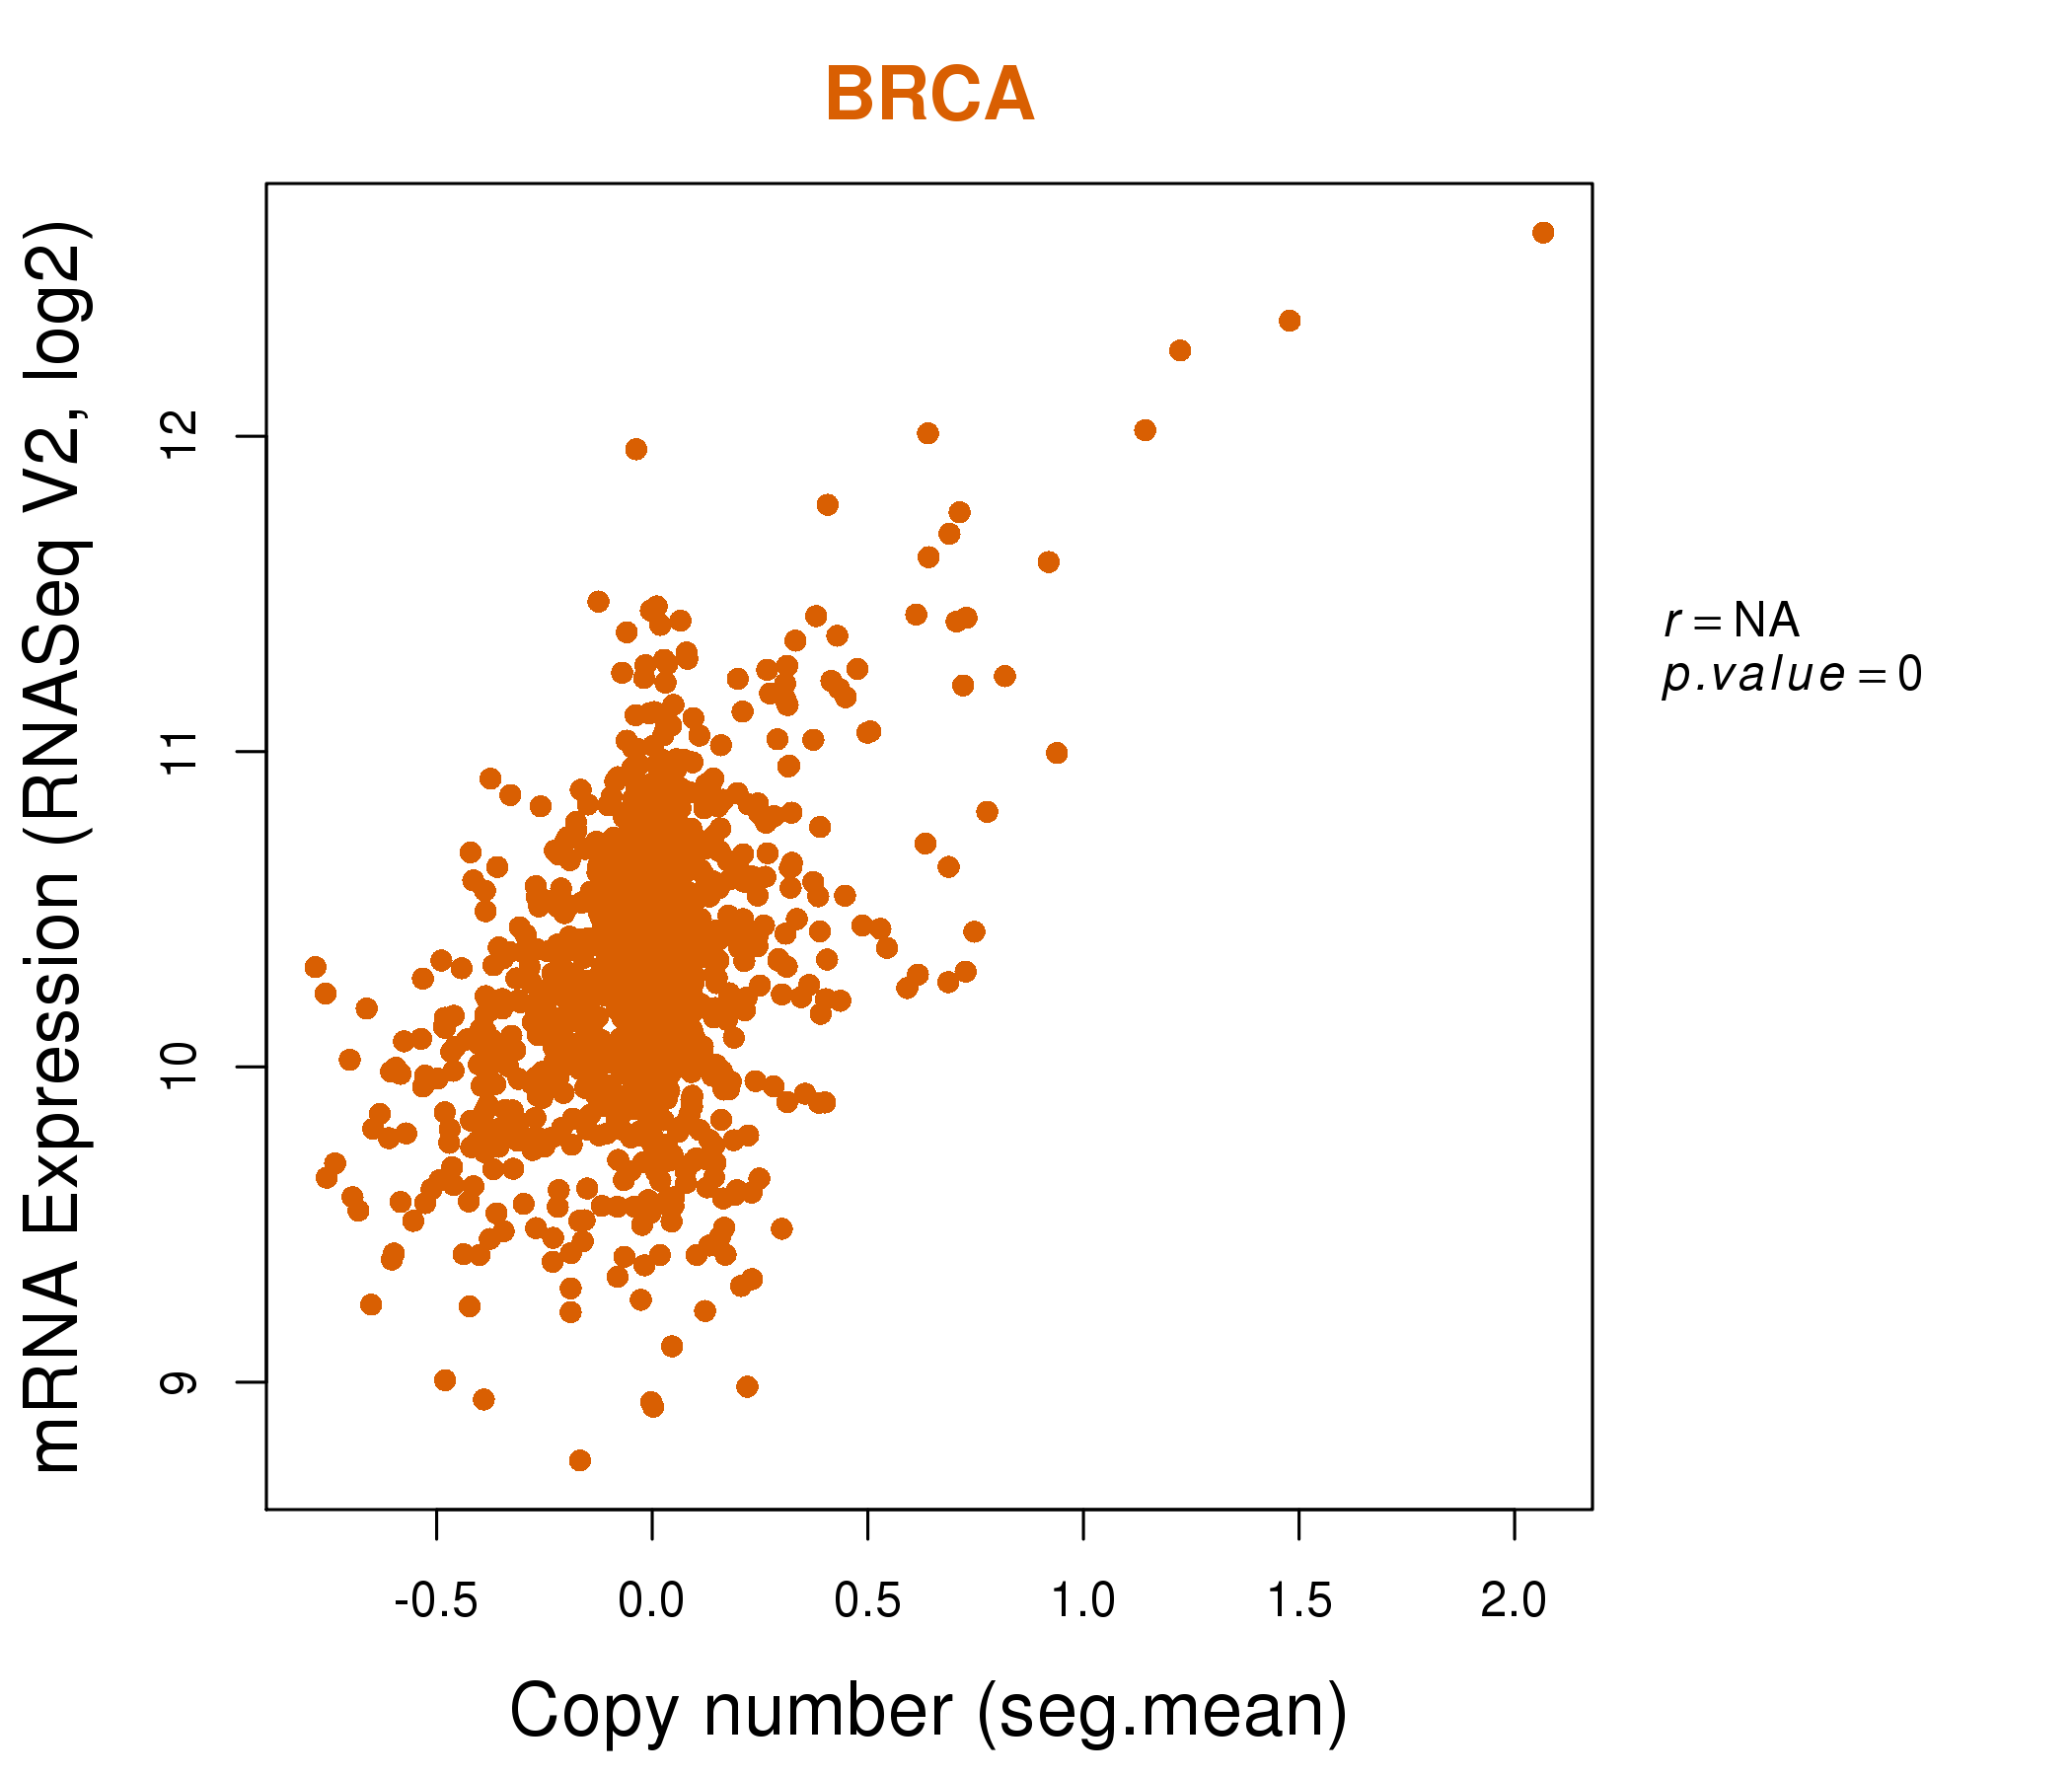
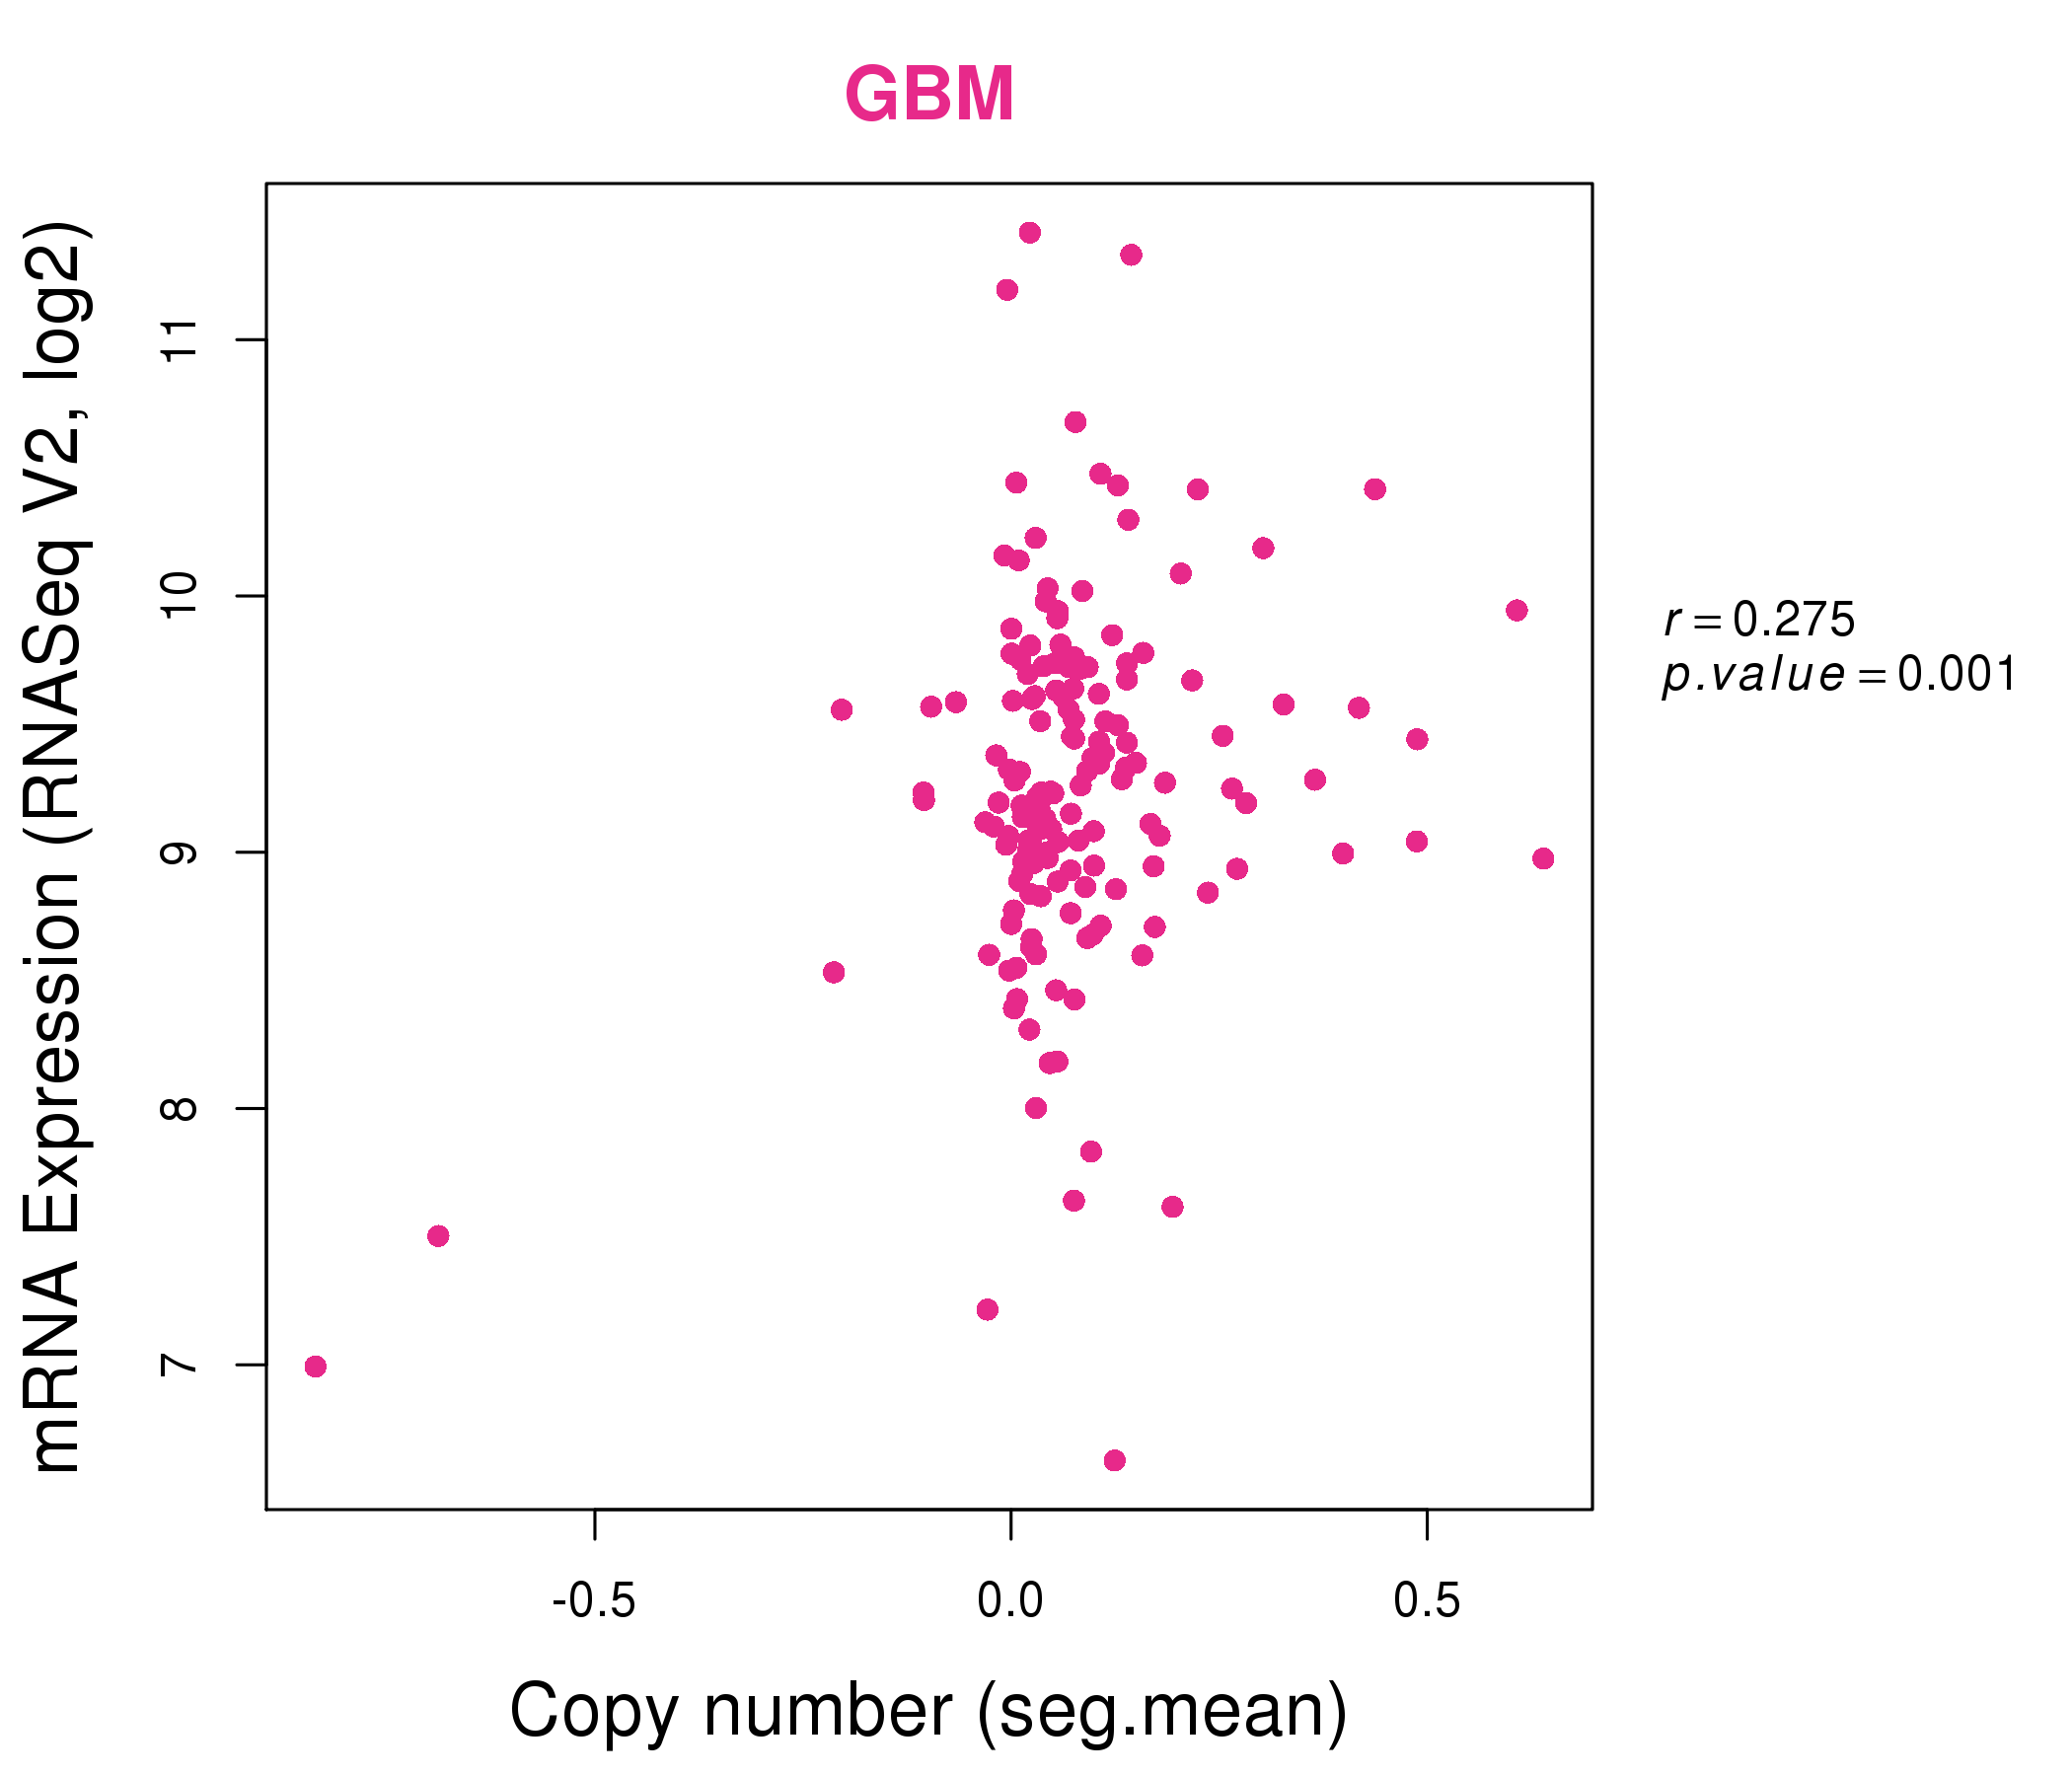
| * This plots show the correlation between CNV and gene expression. |
: Open all plots for all cancer types
 |
|
 |
|
| Top |
| Gene-Gene Network Information |
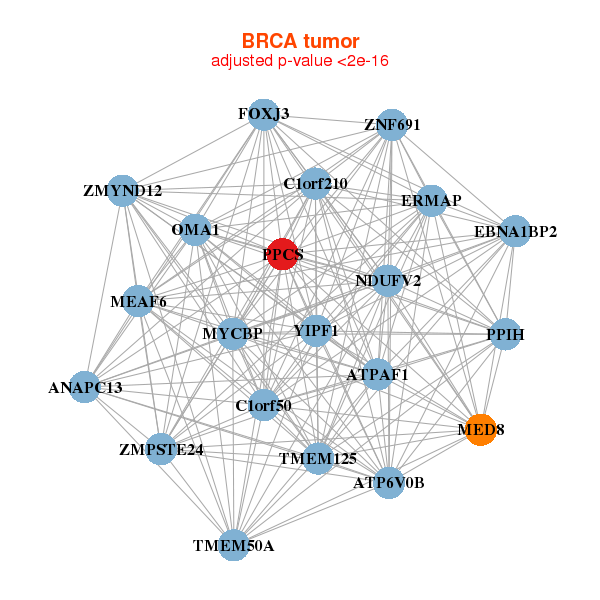
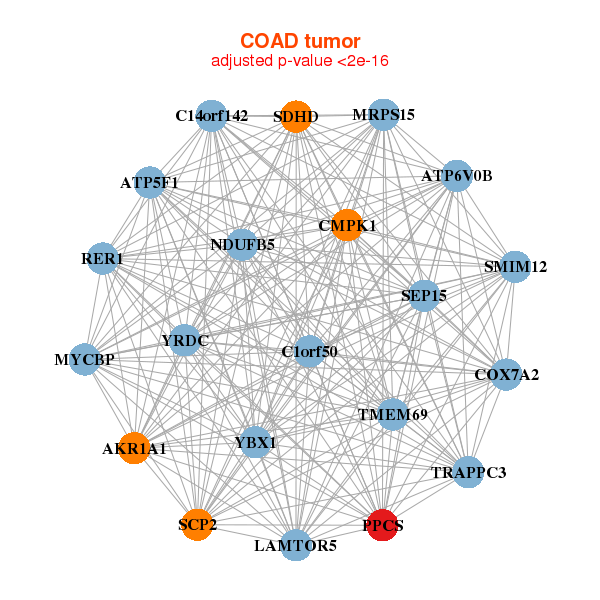
| * Co-Expression network figures were drawn using R package igraph. Only the top 20 genes with the highest correlations were shown. Red circle: input gene, orange circle: cell metabolism gene, sky circle: other gene |
: Open all plots for all cancer types
 |
| ||||
| ANAPC13,ATP6V0B,ATPAF1,C1orf210,C1orf50,EBNA1BP2,ERMAP, FOXJ3,MEAF6,MED8,MYCBP,NDUFV2,OMA1,PPCS, PPIH,TMEM125,TMEM50A,YIPF1,ZMPSTE24,ZMYND12,ZNF691 | ADK,ALG14,ALG5,ATP6V0E1,SMIM7,C1GALT1C1,IDNK, COMMD7,CPSF3,DERL2,FAM120AOS,HEBP1,LSM1,NUDT5, PDZD11,PMS2P1,POP4,PPCS,PTPMT1,TRAPPC3,WDR61 | ||||
 |
| ||||
| AKR1A1,ATP5F1,ATP6V0B,C14orf142,SMIM12,C1orf50,CMPK1, COX7A2,LAMTOR5,MRPS15,MYCBP,NDUFB5,PPCS,RER1, SCP2,SDHD,SEP15,TMEM69,TRAPPC3,YBX1,YRDC | ATG5,TMEM251,C14orf142,C15orf48,MIEN1,C3orf38,COX7A2, FAM96A,GTF2B,HINT1,MRPL14,MRPS11,MRPS36,NDUFA2, NOP10,PDCD6,PDZD11,PPCS,SDHD,UQCRQ,VPS25 |
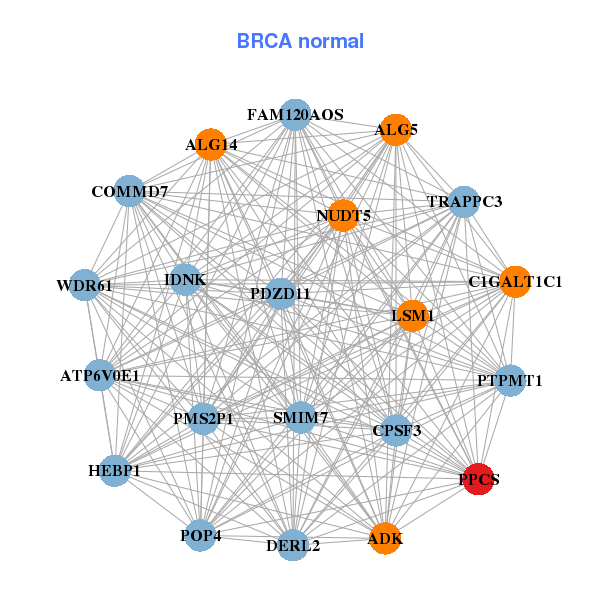
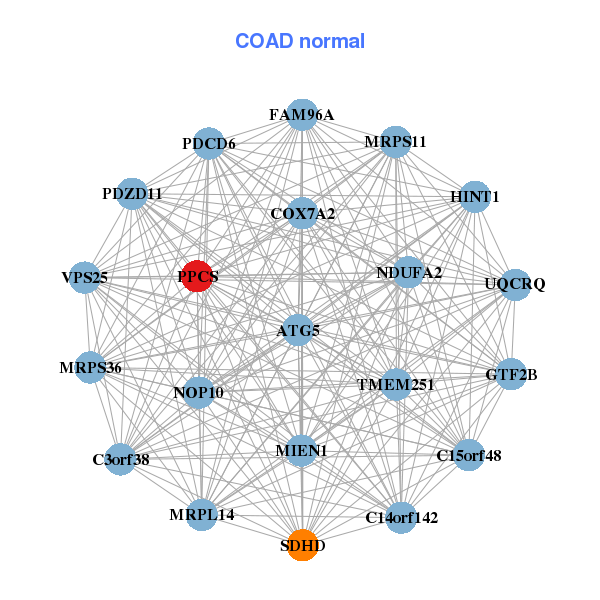
| * Co-Expression network figures were drawn using R package igraph. Only the top 20 genes with the highest correlations were shown. Red circle: input gene, orange circle: cell metabolism gene, sky circle: other gene |
: Open all plots for all cancer types
| Top |
: Open all interacting genes' information including KEGG pathway for all interacting genes from DAVID
| Top |
| Pharmacological Information for PPCS |
| DB Category | DB Name | DB's ID and Url link |
| * Gene Centered Interaction Network. |
 |
| * Drug Centered Interaction Network. |
| DrugBank ID | Target Name | Drug Groups | Generic Name | Drug Centered Network | Drug Structure |
| DB00151 | phosphopantothenoylcysteine synthetase | approved; nutraceutical | L-Cysteine | 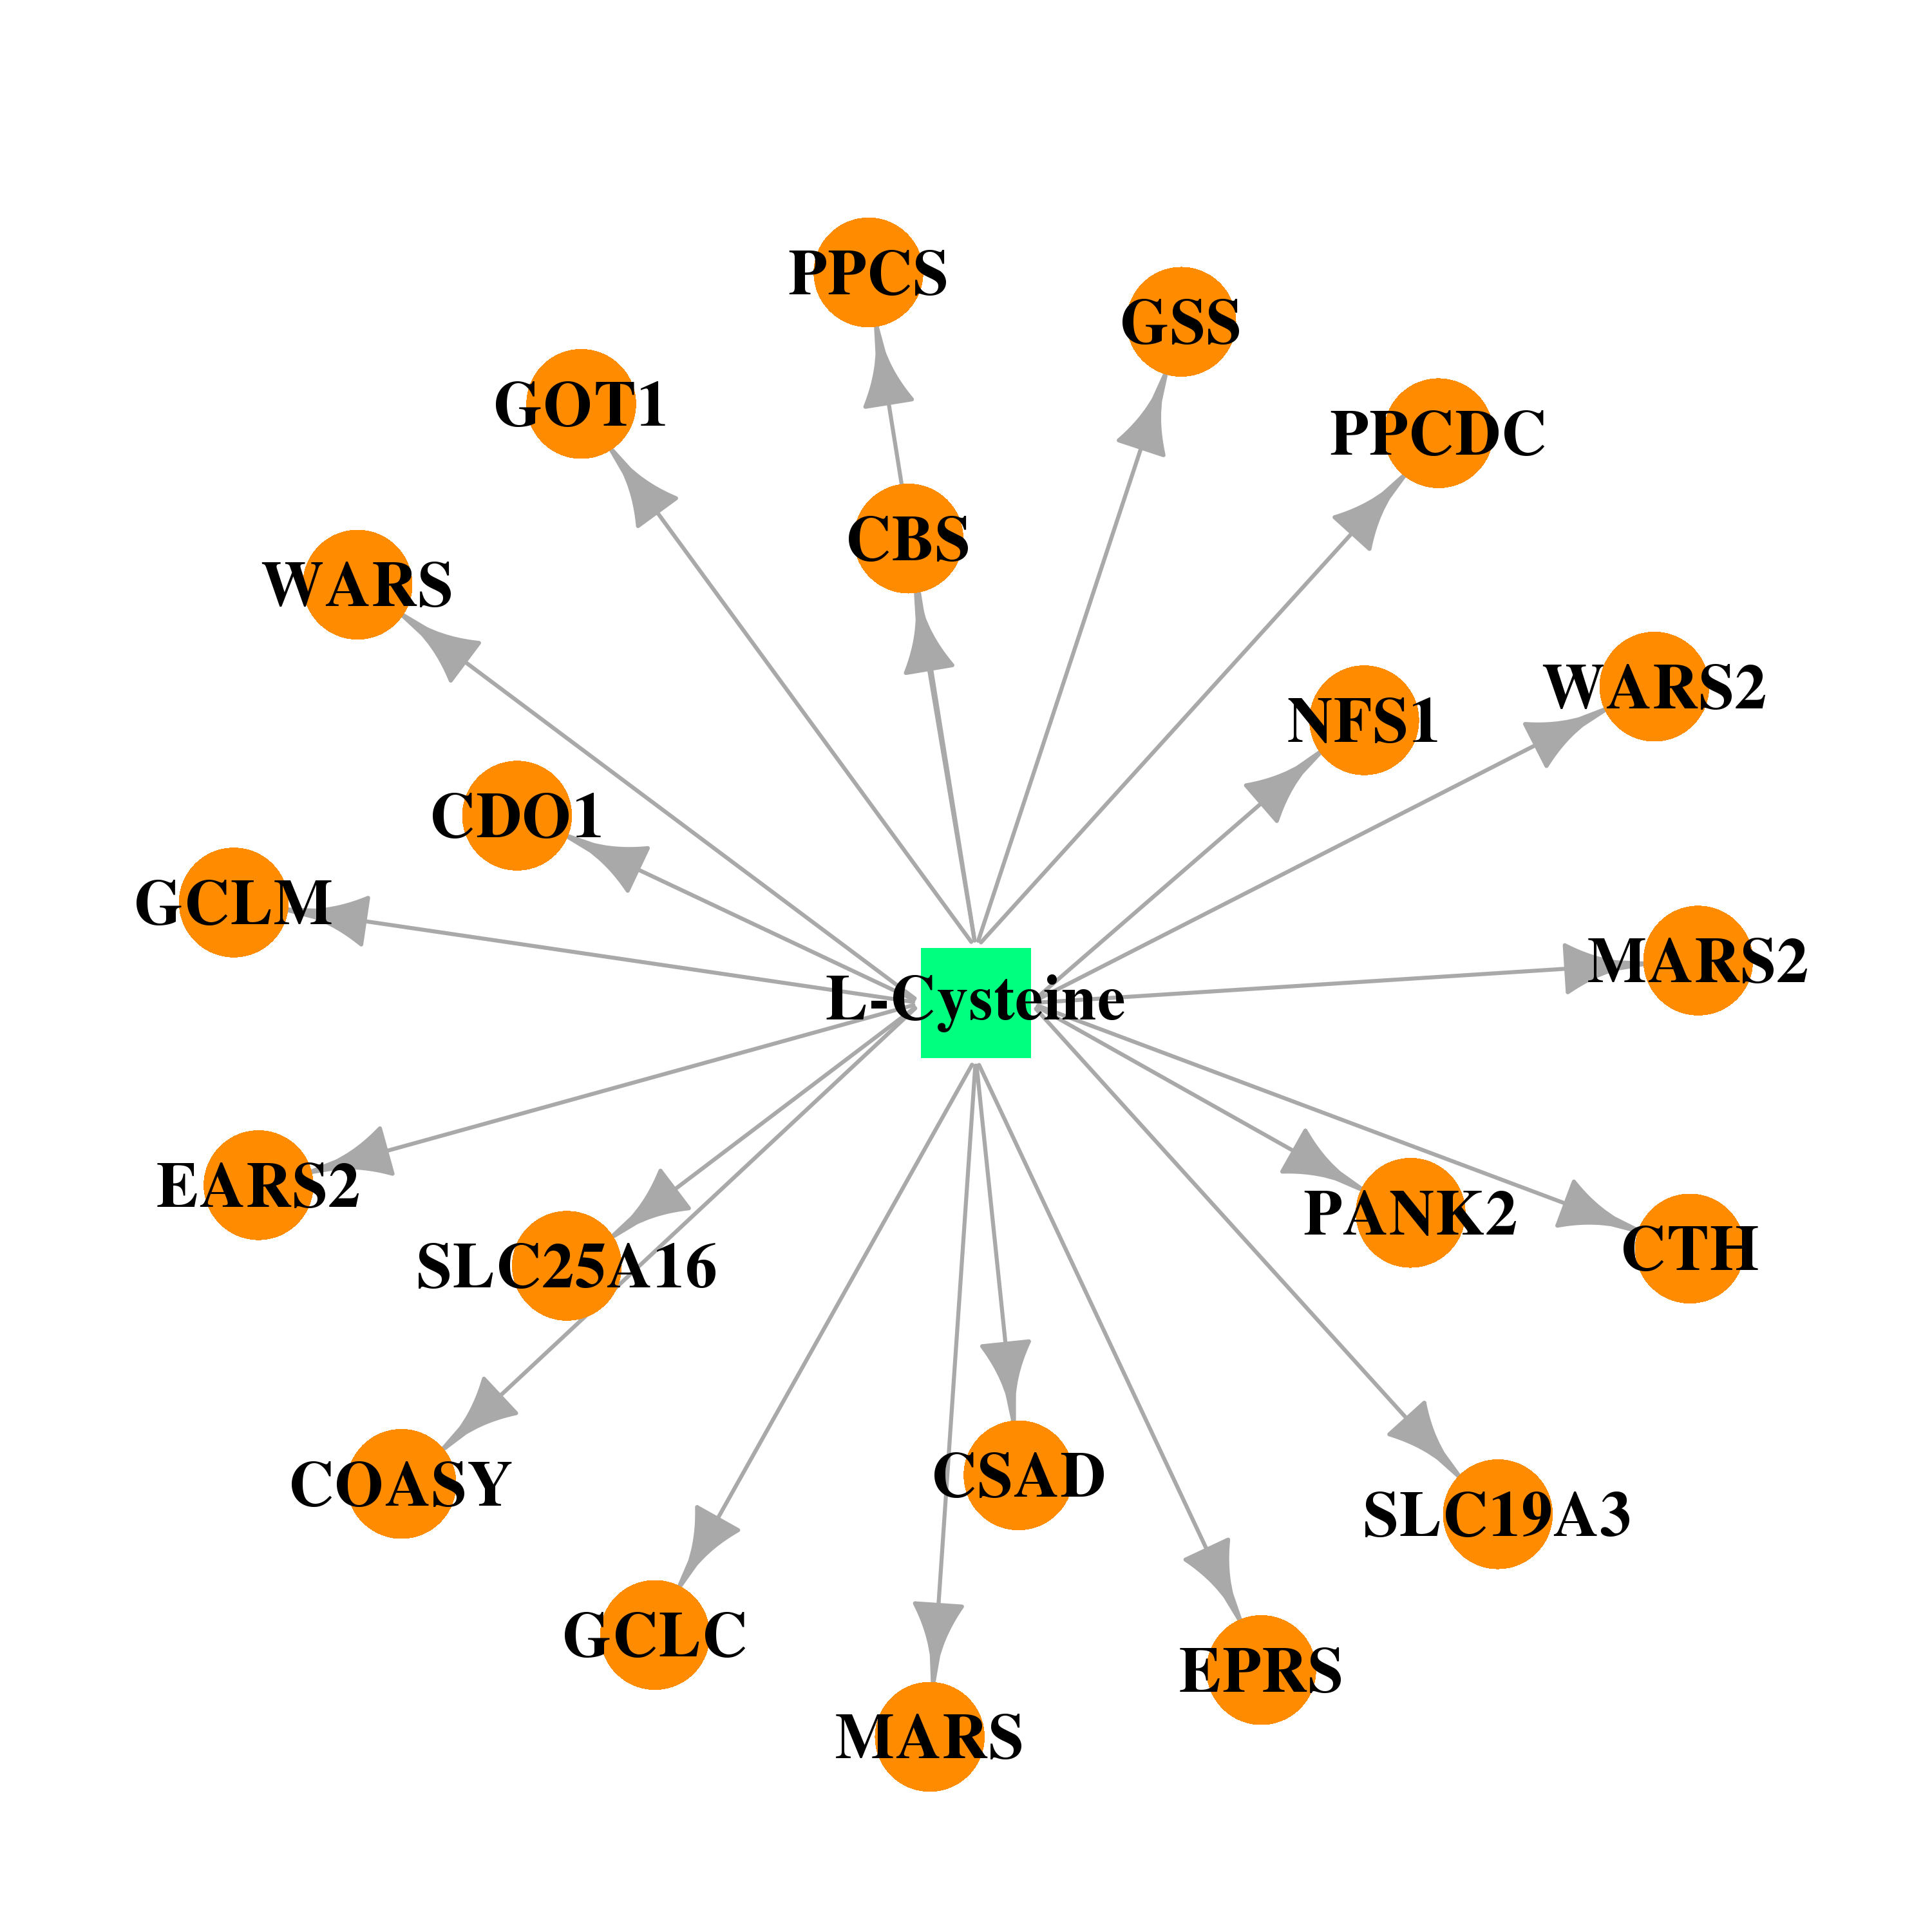 | 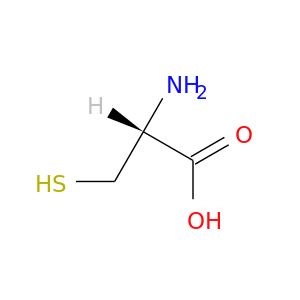 |
| Top |
| Cross referenced IDs for PPCS |
| * We obtained these cross-references from Uniprot database. It covers 150 different DBs, 18 categories. http://www.uniprot.org/help/cross_references_section |
: Open all cross reference information
|
Copyright © 2016-Present - The Univsersity of Texas Health Science Center at Houston @ |