|
||||||||||||||||||||||||||||||||||||||||||||||||||||||||||||||||||||||||||||||||||||||||||||||||||||||||||||||||||||||||||||||||||||||||||||||||||||||||||||||||||||||||||||||||||||||||||||||||||||||||||||||||||||||||||||||||||||||||||||||||||||||||||||||||||||||||||||||||||||||||||||||||||||||||||||||||||||||||||
| |
| Phenotypic Information (metabolism pathway, cancer, disease, phenome) |
| |
| |
| Gene-Gene Network Information: Co-Expression Network, Interacting Genes & KEGG |
| |
|


| Gene Summary for ALG9 |
| Basic gene info. | Gene symbol | ALG9 |
| Gene name | ALG9, alpha-1,2-mannosyltransferase | |
| Synonyms | CDG1L|DIBD1|LOH11CR1J | |
| Cytomap | UCSC genome browser: 11q23 | |
| Genomic location | chr11 :111652918-111742004 | |
| Type of gene | protein-coding | |
| RefGenes | NM_001077690.1, NM_001077691.1,NM_001077692.1,NM_024740.2, | |
| Ensembl id | ENSG00000262577 | |
| Description | alpha-1,2-mannosyltransferase ALG9asparagine-linked glycosylation 9 homolog (S. cerevisiae, alpha- 1,2-mannosyltransferase)asparagine-linked glycosylation 9 homolog (yeast, alpha- 1,2-mannosyltransferase)asparagine-linked glycosylation 9, alpha-1,2-man | |
| Modification date | 20141219 | |
| dbXrefs | MIM : 606941 | |
| HGNC : HGNC | ||
| Ensembl : ENSG00000086848 | ||
| HPRD : 09504 | ||
| Vega : OTTHUMG00000166819 | ||
| Protein | UniProt: go to UniProt's Cross Reference DB Table | |
| Expression | CleanEX: HS_ALG9 | |
| BioGPS: 79796 | ||
| Gene Expression Atlas: ENSG00000262577 | ||
| The Human Protein Atlas: ENSG00000262577 | ||
| Pathway | NCI Pathway Interaction Database: ALG9 | |
| KEGG: ALG9 | ||
| REACTOME: ALG9 | ||
| ConsensusPathDB | ||
| Pathway Commons: ALG9 | ||
| Metabolism | MetaCyc: ALG9 | |
| HUMANCyc: ALG9 | ||
| Regulation | Ensembl's Regulation: ENSG00000262577 | |
| miRBase: chr11 :111,652,918-111,742,004 | ||
| TargetScan: NM_001077690 | ||
| cisRED: ENSG00000262577 | ||
| Context | iHOP: ALG9 | |
| cancer metabolism search in PubMed: ALG9 | ||
| UCL Cancer Institute: ALG9 | ||
| Assigned class in ccmGDB | C | |
| Top |
| Phenotypic Information for ALG9(metabolism pathway, cancer, disease, phenome) |
| Cancer | CGAP: ALG9 |
| Familial Cancer Database: ALG9 | |
| * This gene is included in those cancer gene databases. |
|
|
|
|
|
| . | ||||||||||||||||||||||||||||||||||||||||||||||||||||||||||||||||||||||||||||||||||||||||||||||||||||||||||||||||||||||||||||||||||||||||||||||||||||||||||||||||||||||||||||||||||||||||||||||||||||||||||||||||||||||||||||||||||||||||||||||||||||||||||||||||||||||||||||||||||||||||||||||||||||||||||||||||||||
Oncogene 1 | Significant driver gene in | |||||||||||||||||||||||||||||||||||||||||||||||||||||||||||||||||||||||||||||||||||||||||||||||||||||||||||||||||||||||||||||||||||||||||||||||||||||||||||||||||||||||||||||||||||||||||||||||||||||||||||||||||||||||||||||||||||||||||||||||||||||||||||||||||||||||||||||||||||||||||||||||||||||||||||||||||||||||||
| cf) number; DB name 1 Oncogene; http://nar.oxfordjournals.org/content/35/suppl_1/D721.long, 2 Tumor Suppressor gene; https://bioinfo.uth.edu/TSGene/, 3 Cancer Gene Census; http://www.nature.com/nrc/journal/v4/n3/abs/nrc1299.html, 4 CancerGenes; http://nar.oxfordjournals.org/content/35/suppl_1/D721.long, 5 Network of Cancer Gene; http://ncg.kcl.ac.uk/index.php, 1Therapeutic Vulnerabilities in Cancer; http://cbio.mskcc.org/cancergenomics/statius/ |
| REACTOME_METABOLISM_OF_PROTEINS | |
| OMIM | |
| Orphanet | |
| Disease | KEGG Disease: ALG9 |
| MedGen: ALG9 (Human Medical Genetics with Condition) | |
| ClinVar: ALG9 | |
| Phenotype | MGI: ALG9 (International Mouse Phenotyping Consortium) |
| PhenomicDB: ALG9 | |
| Mutations for ALG9 |
| * Under tables are showing count per each tissue to give us broad intuition about tissue specific mutation patterns.You can go to the detailed page for each mutation database's web site. |
| - Statistics for Tissue and Mutation type | Top |
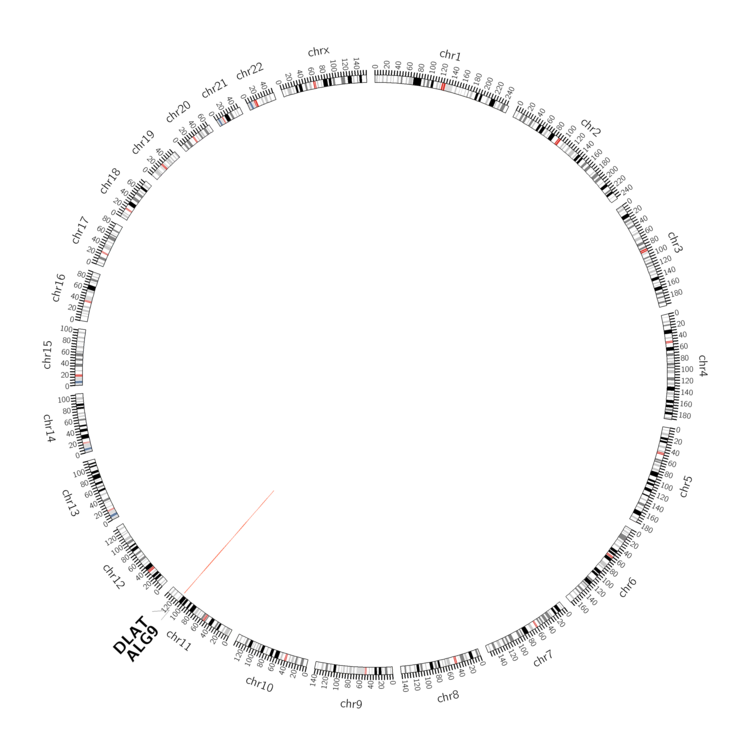 |
| - For Inter-chromosomal Variations |
| There's no inter-chromosomal structural variation. |
| - For Intra-chromosomal Variations |
| * Intra-chromosomal variantions includes 'intrachromosomal amplicon to amplicon', 'intrachromosomal amplicon to non-amplified dna', 'intrachromosomal deletion', 'intrachromosomal fold-back inversion', 'intrachromosomal inversion', 'intrachromosomal tandem duplication', 'Intrachromosomal unknown type', 'intrachromosomal with inverted orientation', 'intrachromosomal with non-inverted orientation'. |
 |
| Sample | Symbol_a | Chr_a | Start_a | End_a | Symbol_b | Chr_b | Start_b | End_b |
| ovary | ALG9 | chr11 | 111659954 | 111659974 | ALG9 | chr11 | 111660033 | 111660053 |
| pancreas | ALG9 | chr11 | 111729663 | 111729683 | DLAT | chr11 | 111904424 | 111904444 |
| cf) Tissue number; Tissue name (1;Breast, 2;Central_nervous_system, 3;Haematopoietic_and_lymphoid_tissue, 4;Large_intestine, 5;Liver, 6;Lung, 7;Ovary, 8;Pancreas, 9;Prostate, 10;Skin, 11;Soft_tissue, 12;Upper_aerodigestive_tract) |
| * From mRNA Sanger sequences, Chitars2.0 arranged chimeric transcripts. This table shows ALG9 related fusion information. |
| ID | Head Gene | Tail Gene | Accession | Gene_a | qStart_a | qEnd_a | Chromosome_a | tStart_a | tEnd_a | Gene_a | qStart_a | qEnd_a | Chromosome_a | tStart_a | tEnd_a |
| Top |
| Mutation type/ Tissue ID | brca | cns | cerv | endome | haematopo | kidn | Lintest | liver | lung | ns | ovary | pancre | prost | skin | stoma | thyro | urina | |||
| Total # sample | 1 | |||||||||||||||||||
| GAIN (# sample) | ||||||||||||||||||||
| LOSS (# sample) | 1 |
| cf) Tissue ID; Tissue type (1; Breast, 2; Central_nervous_system, 3; Cervix, 4; Endometrium, 5; Haematopoietic_and_lymphoid_tissue, 6; Kidney, 7; Large_intestine, 8; Liver, 9; Lung, 10; NS, 11; Ovary, 12; Pancreas, 13; Prostate, 14; Skin, 15; Stomach, 16; Thyroid, 17; Urinary_tract) |
| Top |
|
 |
| Top |
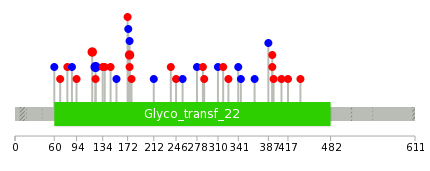
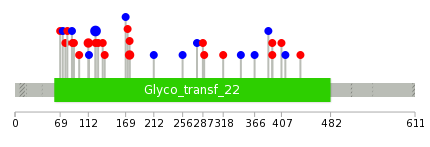
| Stat. for Non-Synonymous SNVs (# total SNVs=21) | (# total SNVs=15) |
 |  |
(# total SNVs=0) | (# total SNVs=0) |
| Top |
| * When you move the cursor on each content, you can see more deailed mutation information on the Tooltip. Those are primary_site,primary_histology,mutation(aa),pubmedID. |
| GRCh37 position | Mutation(aa) | Unique sampleID count |
| chr11:111711514-111711514 | p.P175L | 3 |
| chr11:111724116-111724116 | p.G123G | 3 |
| chr11:111708222-111708222 | p.R310* | 3 |
| chr11:111680410-111680410 | p.E393K | 2 |
| chr11:111724133-111724133 | p.V118I | 2 |
| chr11:111711513-111711513 | p.P175P | 1 |
| chr11:111724204-111724204 | p.P94L | 1 |
| chr11:111680403-111680403 | p.I395T | 1 |
| chr11:111708264-111708264 | p.E296* | 1 |
| chr11:111724365-111724365 | p.? | 1 |
| Top |
|
 |
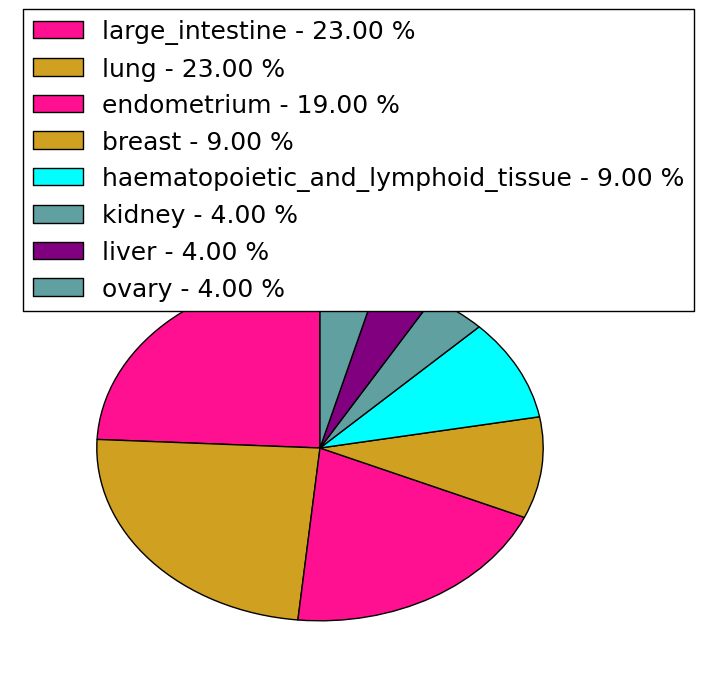
| Point Mutation/ Tissue ID | 1 | 2 | 3 | 4 | 5 | 6 | 7 | 8 | 9 | 10 | 11 | 12 | 13 | 14 | 15 | 16 | 17 | 18 | 19 | 20 |
| # sample | 1 | 2 | 10 | 2 | 2 | 1 | 5 | 3 | 1 | 5 | 1 | 5 | ||||||||
| # mutation | 1 | 2 | 6 | 2 | 2 | 1 | 5 | 3 | 1 | 5 | 1 | 5 | ||||||||
| nonsynonymous SNV | 1 | 2 | 3 | 1 | 1 | 3 | 2 | 1 | 4 | 1 | 3 | |||||||||
| synonymous SNV | 3 | 1 | 2 | 2 | 1 | 1 | 2 |
| cf) Tissue ID; Tissue type (1; BLCA[Bladder Urothelial Carcinoma], 2; BRCA[Breast invasive carcinoma], 3; CESC[Cervical squamous cell carcinoma and endocervical adenocarcinoma], 4; COAD[Colon adenocarcinoma], 5; GBM[Glioblastoma multiforme], 6; Glioma Low Grade, 7; HNSC[Head and Neck squamous cell carcinoma], 8; KICH[Kidney Chromophobe], 9; KIRC[Kidney renal clear cell carcinoma], 10; KIRP[Kidney renal papillary cell carcinoma], 11; LAML[Acute Myeloid Leukemia], 12; LUAD[Lung adenocarcinoma], 13; LUSC[Lung squamous cell carcinoma], 14; OV[Ovarian serous cystadenocarcinoma ], 15; PAAD[Pancreatic adenocarcinoma], 16; PRAD[Prostate adenocarcinoma], 17; SKCM[Skin Cutaneous Melanoma], 18:STAD[Stomach adenocarcinoma], 19:THCA[Thyroid carcinoma], 20:UCEC[Uterine Corpus Endometrial Carcinoma]) |
| Top |
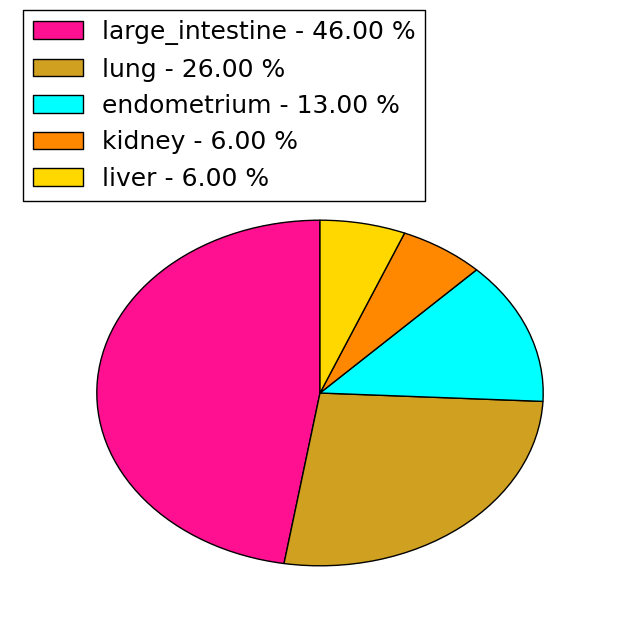
| * We represented just top 10 SNVs. When you move the cursor on each content, you can see more deailed mutation information on the Tooltip. Those are primary_site, primary_histology, mutation(aa), pubmedID. |
| Genomic Position | Mutation(aa) | Unique sampleID count |
| chr11:111724116 | p.G123G,ALG9 | 4 |
| chr11:111711514 | p.P175Q,ALG9 | 3 |
| chr11:111680410 | p.E393Q,ALG9 | 2 |
| chr11:111739396 | p.R112C,ALG9 | 2 |
| chr11:111711402 | p.R413R,ALG9 | 1 |
| chr11:111731328 | p.G123E,ALG9 | 1 |
| chr11:111680367 | p.R407T,ALG9 | 1 |
| chr11:111739350 | p.A87A,ALG9 | 1 |
| chr11:111711524 | p.F80L,ALG9 | 1 |
| chr11:111739391 | p.Y387Y,ALG9 | 1 |
| * Copy number data were extracted from TCGA using R package TCGA-Assembler. The URLs of all public data files on TCGA DCC data server were gathered on Jan-05-2015. Function ProcessCNAData in TCGA-Assembler package was used to obtain gene-level copy number value which is calculated as the average copy number of the genomic region of a gene. |
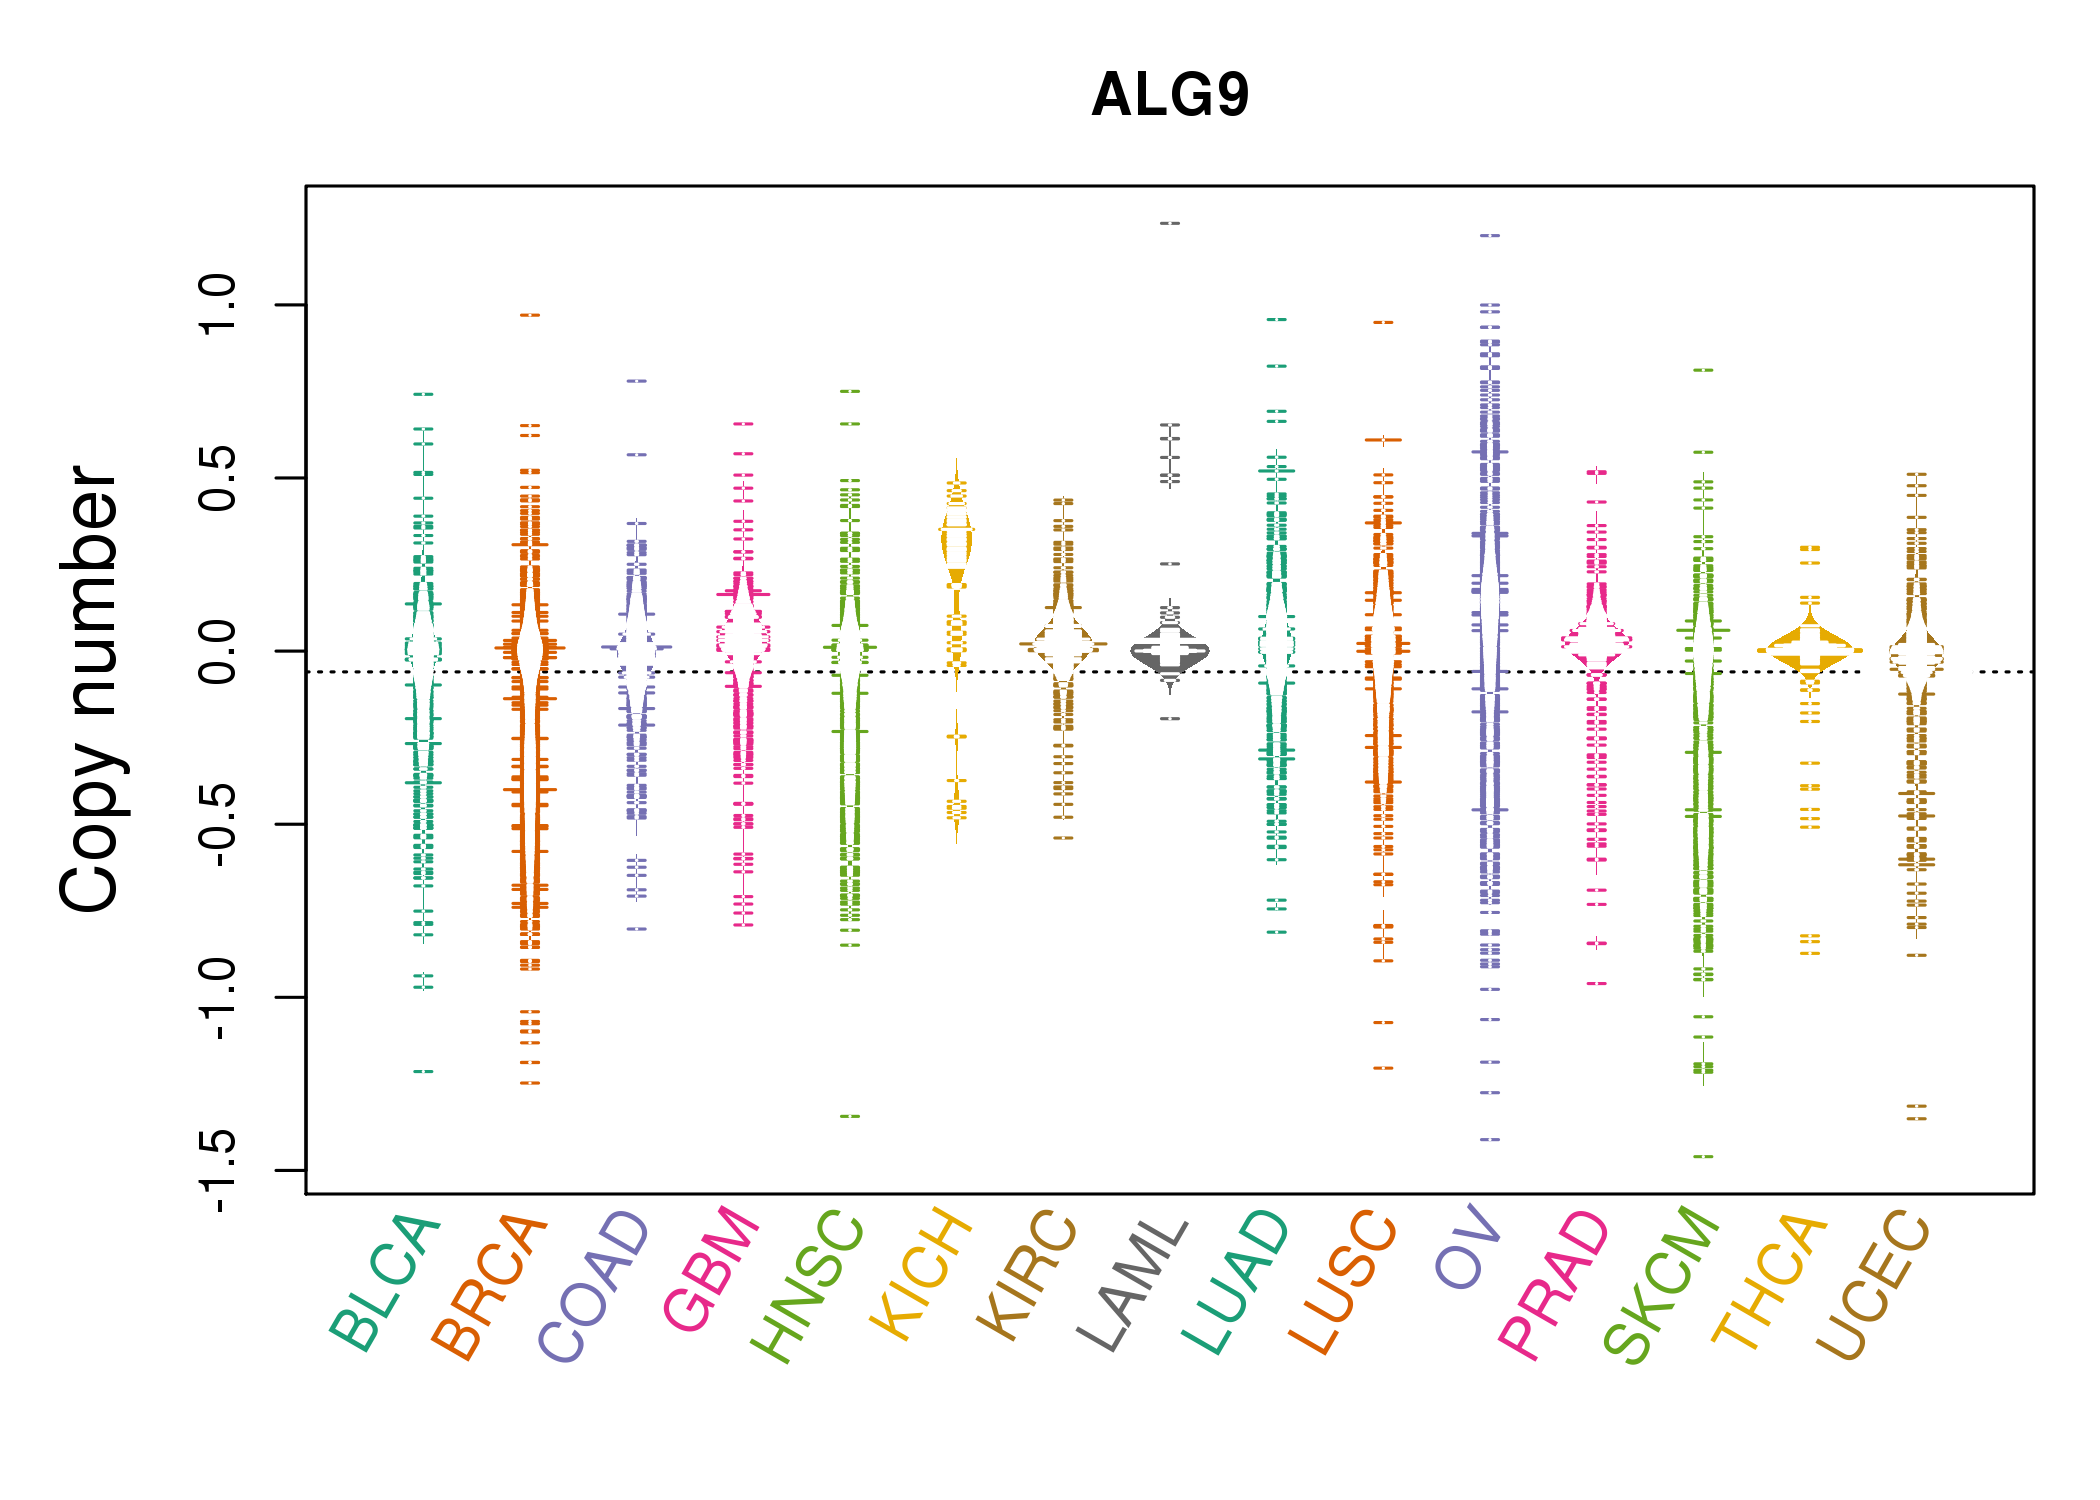 |
| cf) Tissue ID[Tissue type]: BLCA[Bladder Urothelial Carcinoma], BRCA[Breast invasive carcinoma], CESC[Cervical squamous cell carcinoma and endocervical adenocarcinoma], COAD[Colon adenocarcinoma], GBM[Glioblastoma multiforme], Glioma Low Grade, HNSC[Head and Neck squamous cell carcinoma], KICH[Kidney Chromophobe], KIRC[Kidney renal clear cell carcinoma], KIRP[Kidney renal papillary cell carcinoma], LAML[Acute Myeloid Leukemia], LUAD[Lung adenocarcinoma], LUSC[Lung squamous cell carcinoma], OV[Ovarian serous cystadenocarcinoma ], PAAD[Pancreatic adenocarcinoma], PRAD[Prostate adenocarcinoma], SKCM[Skin Cutaneous Melanoma], STAD[Stomach adenocarcinoma], THCA[Thyroid carcinoma], UCEC[Uterine Corpus Endometrial Carcinoma] |
| Top |
| Gene Expression for ALG9 |
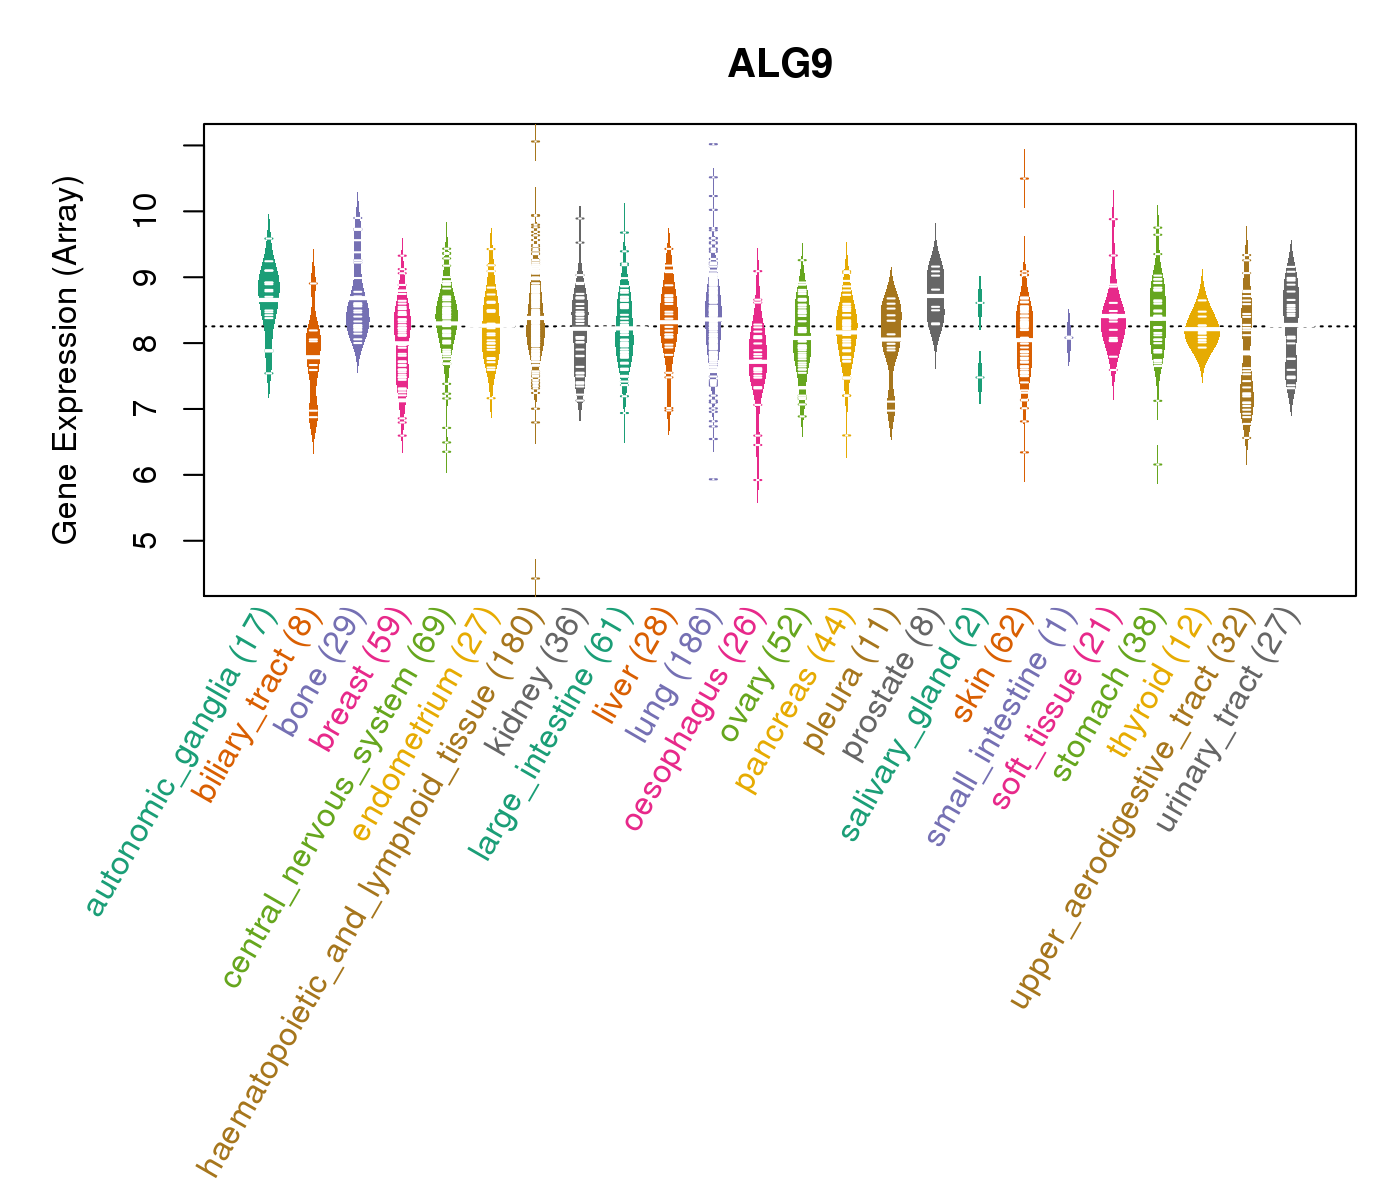
| * CCLE gene expression data were extracted from CCLE_Expression_Entrez_2012-10-18.res: Gene-centric RMA-normalized mRNA expression data. |
 |
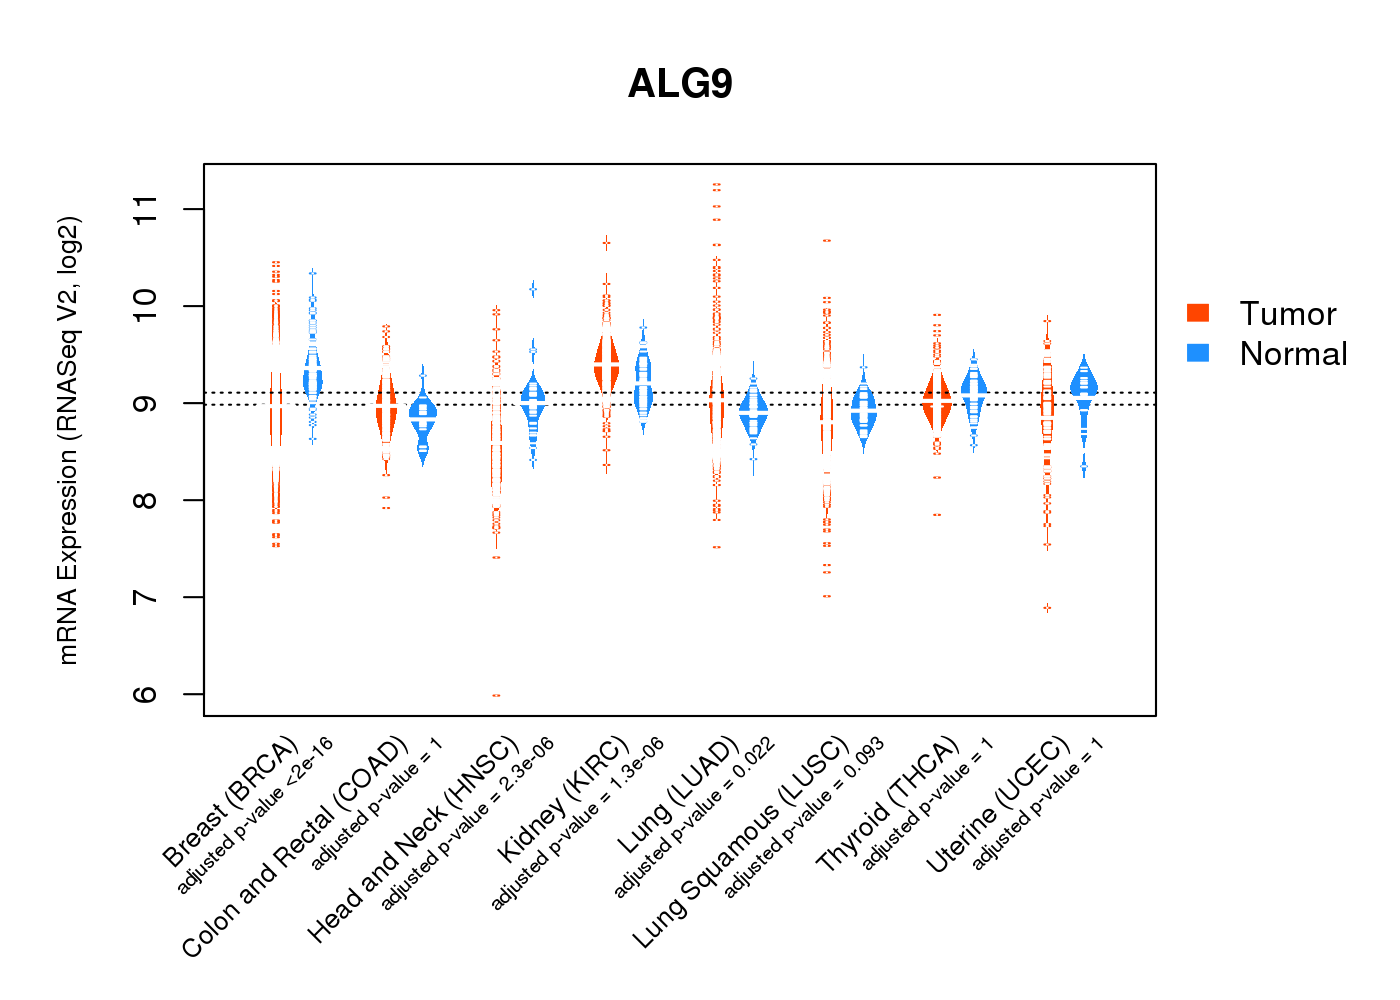
| * Normalized gene expression data of RNASeqV2 was extracted from TCGA using R package TCGA-Assembler. The URLs of all public data files on TCGA DCC data server were gathered at Jan-05-2015. Only eight cancer types have enough normal control samples for differential expression analysis. (t test, adjusted p<0.05 (using Benjamini-Hochberg FDR)) |
 |
| Top |
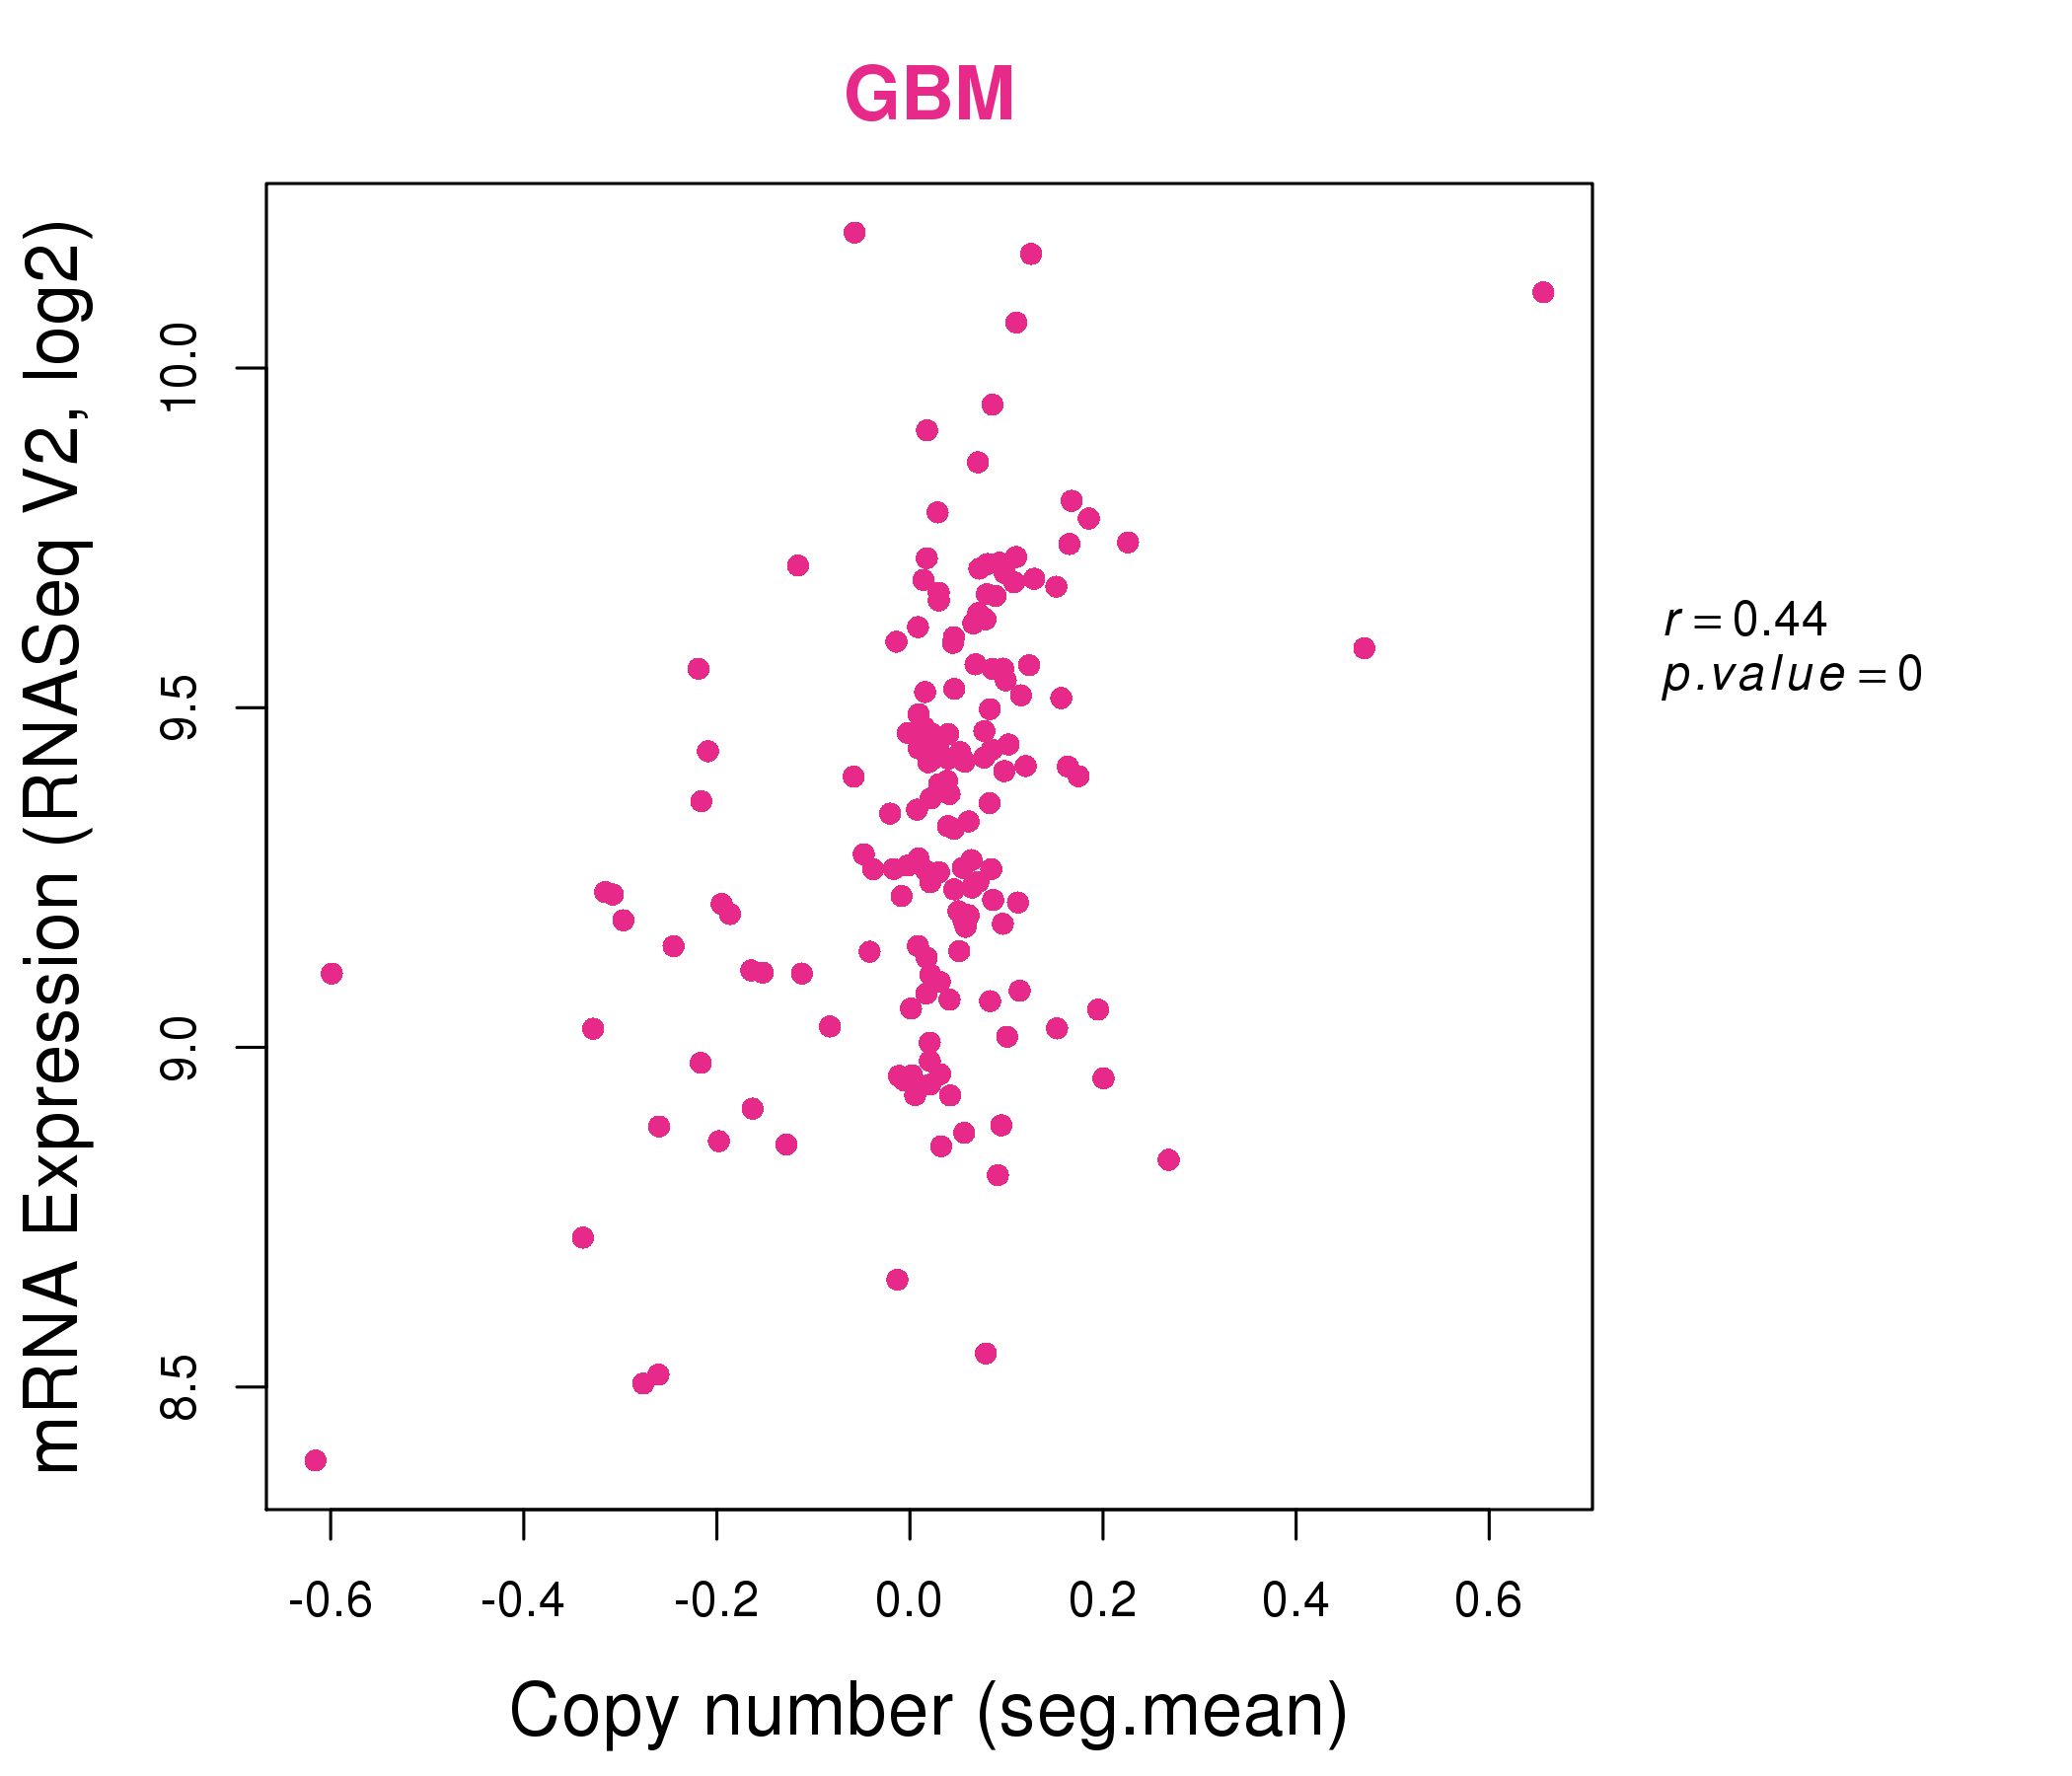
| * This plots show the correlation between CNV and gene expression. |
: Open all plots for all cancer types
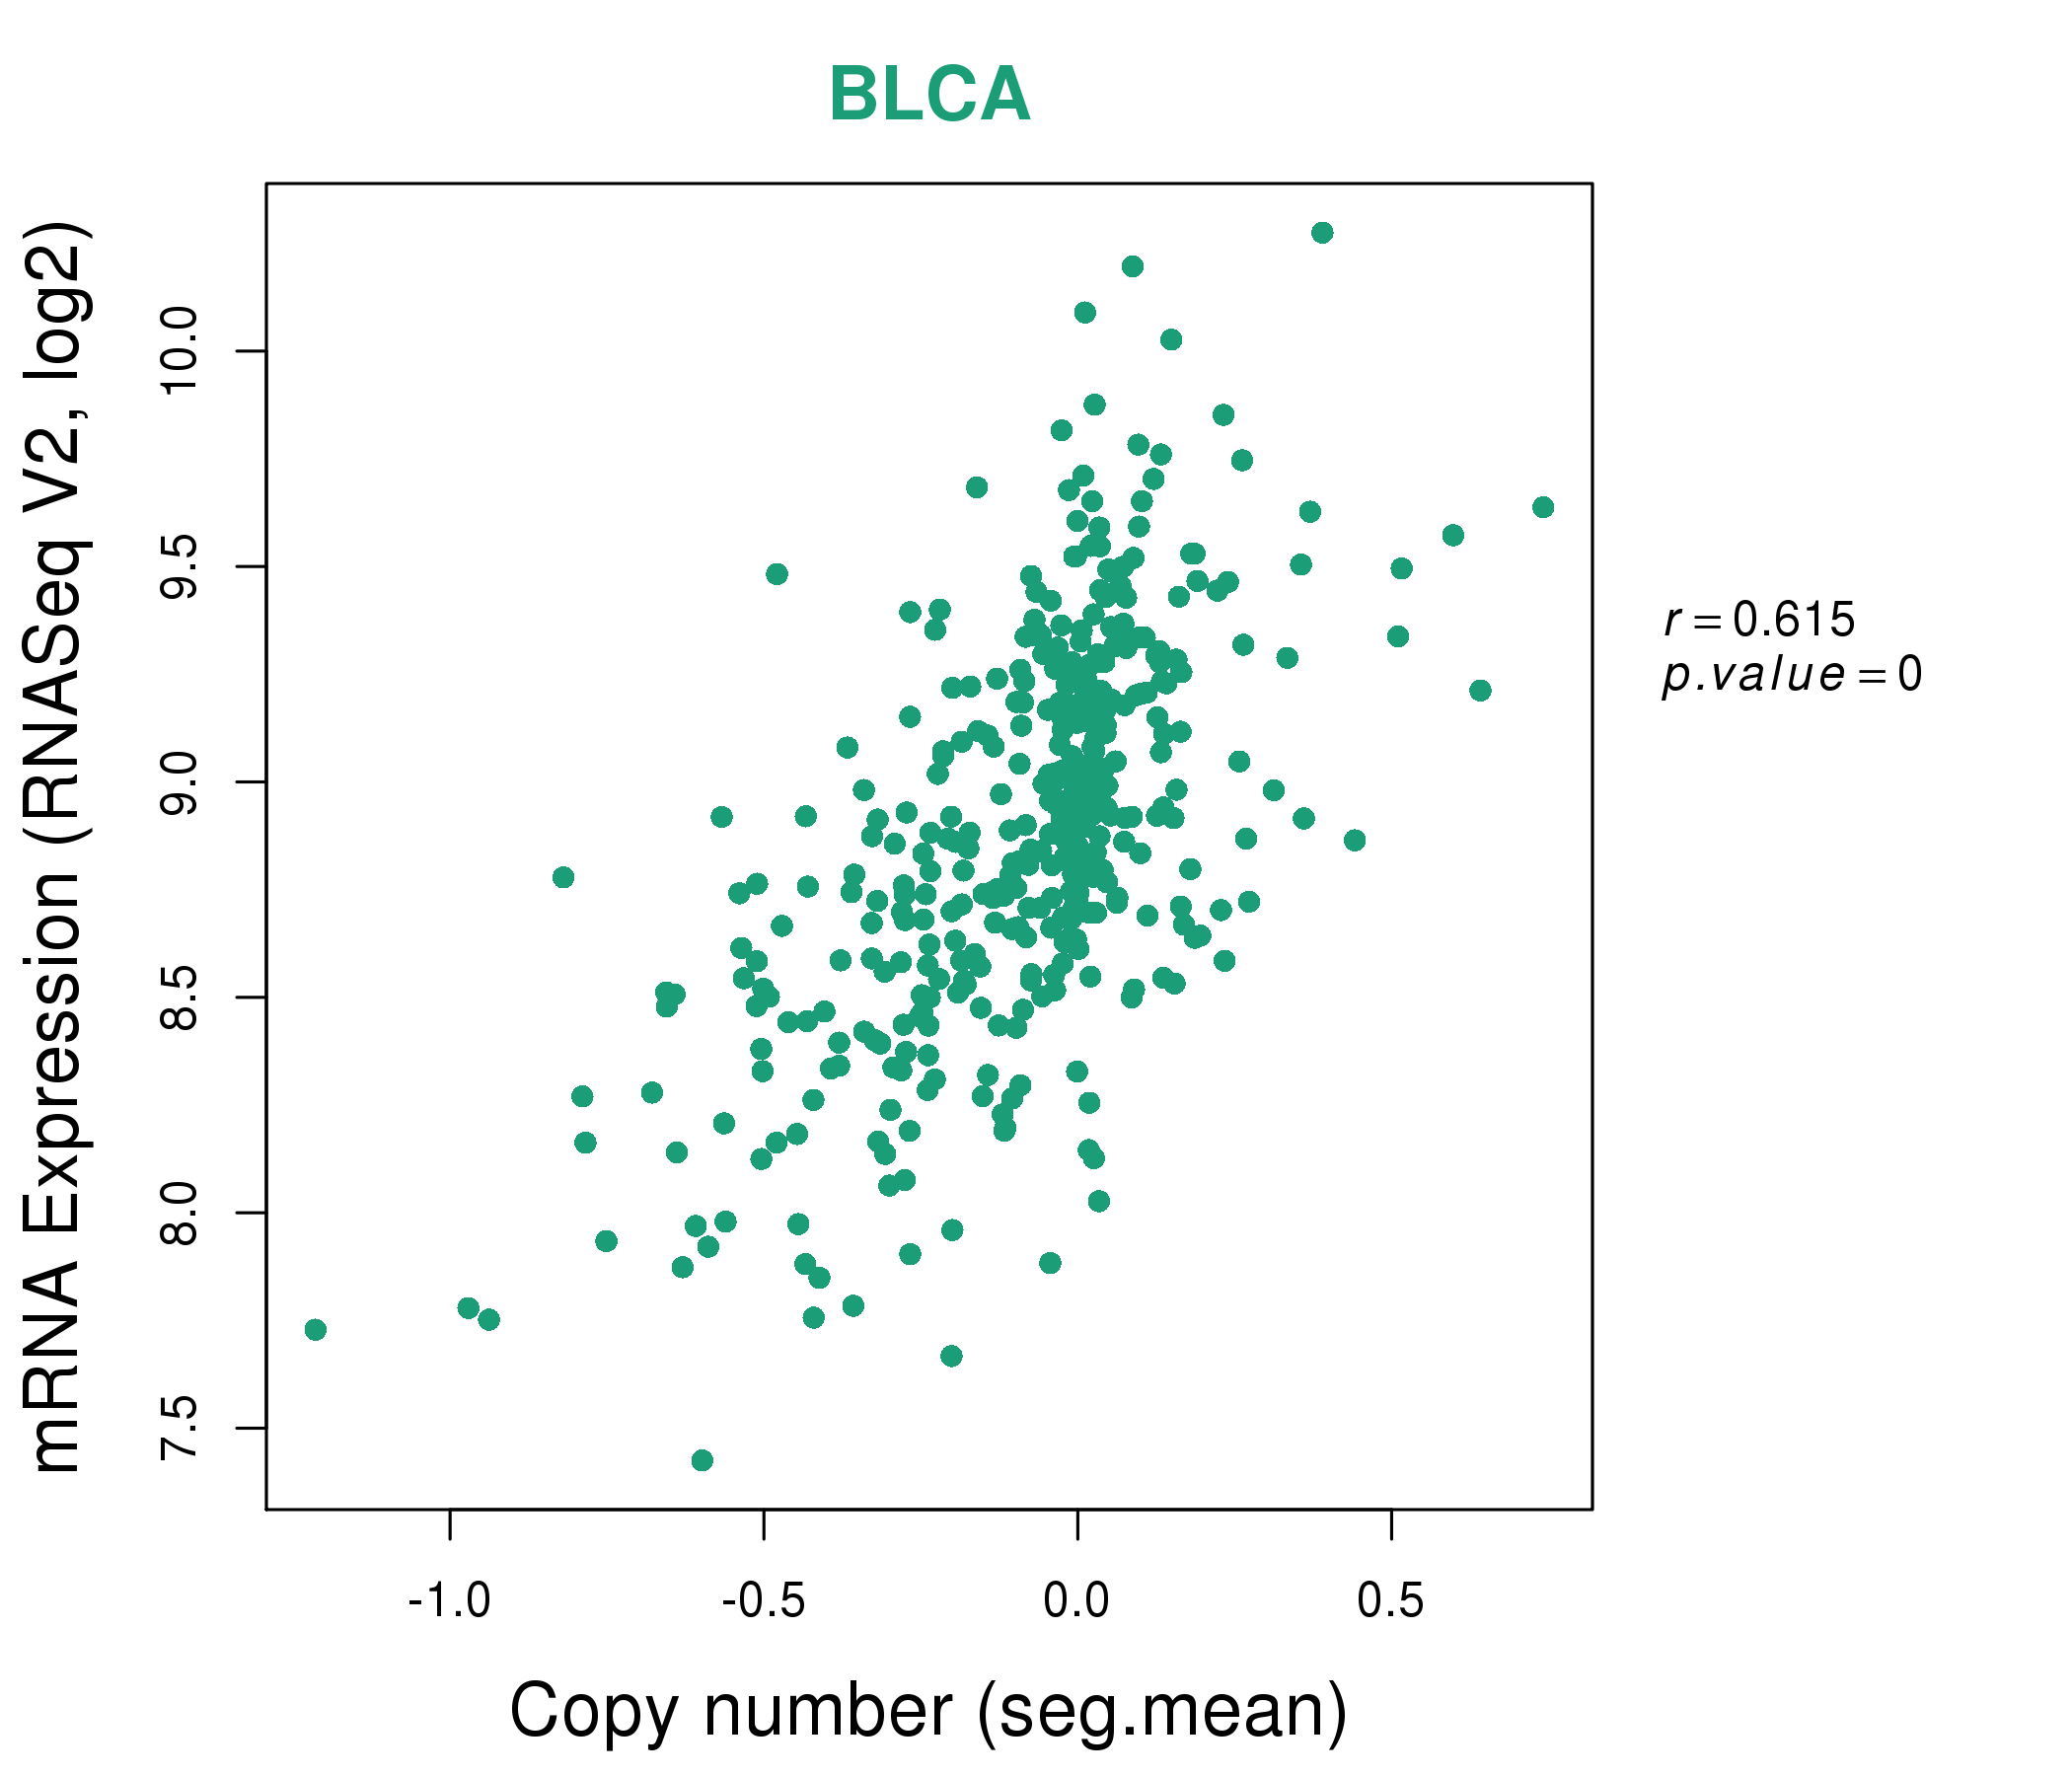 |
|
 |
|

| Top |
| Gene-Gene Network Information |
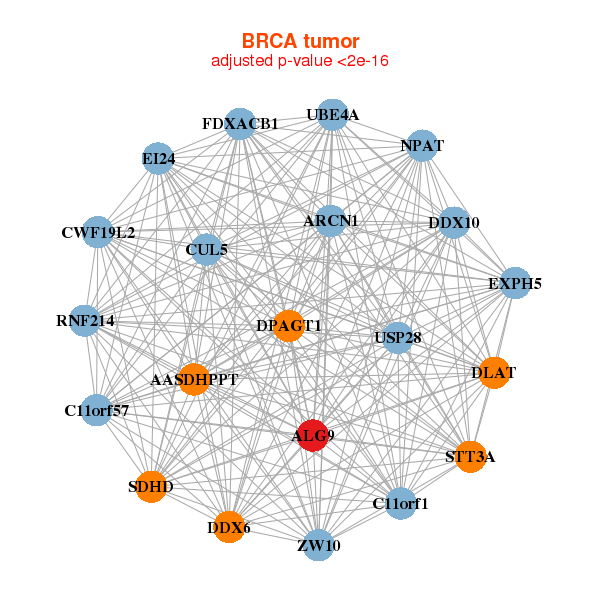
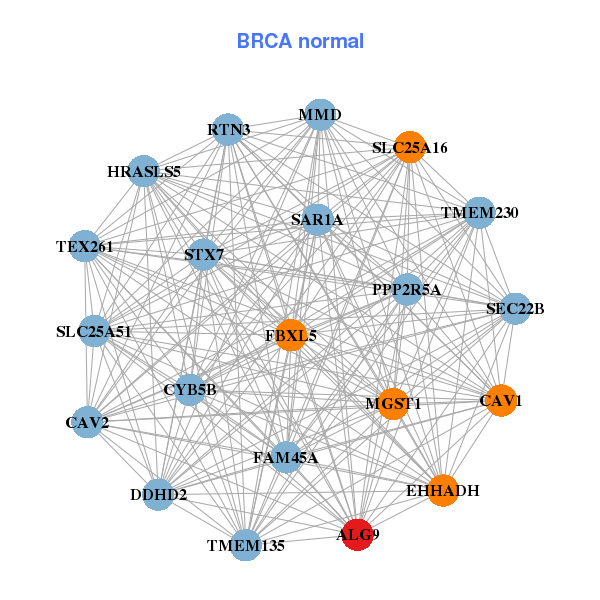
| * Co-Expression network figures were drawn using R package igraph. Only the top 20 genes with the highest correlations were shown. Red circle: input gene, orange circle: cell metabolism gene, sky circle: other gene |
: Open all plots for all cancer types
 |
|
| AASDHPPT,ALG9,ARCN1,C11orf1,C11orf57,CUL5,CWF19L2, DDX10,DDX6,DLAT,DPAGT1,EI24,EXPH5,FDXACB1, NPAT,RNF214,SDHD,STT3A,UBE4A,USP28,ZW10 | ALG9,TMEM230,CAV1,CAV2,CYB5B,DDHD2,EHHADH, FAM45A,FBXL5,HRASLS5,SLC25A51,MGST1,MMD,PPP2R5A, RTN3,SAR1A,SEC22B,SLC25A16,STX7,TEX261,TMEM135 |
 |
|
| AASDHPPT,ALG9,ALKBH8,BUD13,C11orf57,CCDC15,CEP57, CUL5,CWC15,DDX10,DPAGT1,EI24,LOC653566,MRE11A, PPP2R1B,RTN3,SPCS2,STT3A,UBE4A,USP28,ZW10 | ALG9,ARIH1,KANSL1L,C3orf58,CLCC1,DCAF10,FXR1, LRRC58,MTAP,MTR,NUP133,PCDHGA9,PCM1,PCYOX1, PREPL,SEC63,TCF12,TOMM70A,TOP2B,UBQLN2,WDR82 |
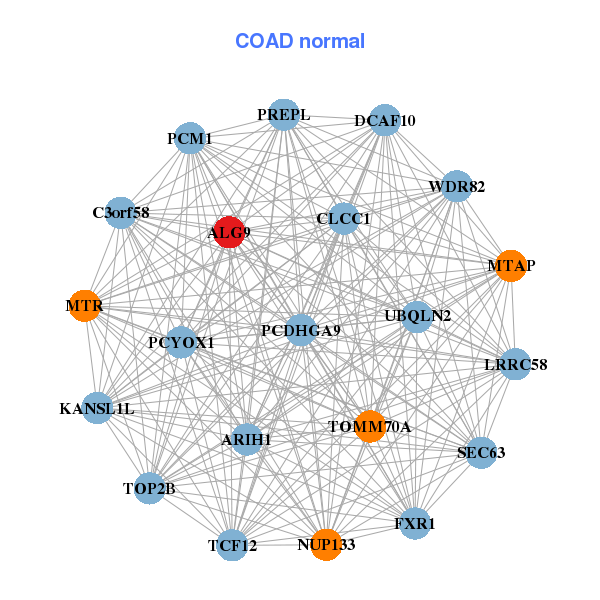
| * Co-Expression network figures were drawn using R package igraph. Only the top 20 genes with the highest correlations were shown. Red circle: input gene, orange circle: cell metabolism gene, sky circle: other gene |
: Open all plots for all cancer types
| Top |
: Open all interacting genes' information including KEGG pathway for all interacting genes from DAVID
| Top |
| Pharmacological Information for ALG9 |
| There's no related Drug. |
| Top |
| Cross referenced IDs for ALG9 |
| * We obtained these cross-references from Uniprot database. It covers 150 different DBs, 18 categories. http://www.uniprot.org/help/cross_references_section |
: Open all cross reference information
|
Copyright © 2016-Present - The Univsersity of Texas Health Science Center at Houston @ |