|
||||||||||||||||||||
| |
| Phenotypic Information (metabolism pathway, cancer, disease, phenome) |
| |
| |
| Gene-Gene Network Information: Co-Expression Network, Interacting Genes & KEGG |
| |
|


| Gene Summary for UGT2A3 |
| Top |
| Phenotypic Information for UGT2A3(metabolism pathway, cancer, disease, phenome) |
| Cancer | CGAP: UGT2A3 |
| Familial Cancer Database: UGT2A3 | |
| * This gene is included in those cancer gene databases. |
|
|
|
|
|
| . | ||||||||||||||
Oncogene 1 | Significant driver gene in GBM 6, | |||||||||||||||||||
| cf) number; DB name 1 Oncogene; http://nar.oxfordjournals.org/content/35/suppl_1/D721.long, 2 Tumor Suppressor gene; https://bioinfo.uth.edu/TSGene/, 3 Cancer Gene Census; http://www.nature.com/nrc/journal/v4/n3/abs/nrc1299.html, 4 CancerGenes; http://nar.oxfordjournals.org/content/35/suppl_1/D721.long, 5 Network of Cancer Gene; http://ncg.kcl.ac.uk/index.php, 6 http://www.sciencedirect.com/science/article/pii/S0092867413012087, 7Therapeutic Vulnerabilities in Cancer; http://cbio.mskcc.org/cancergenomics/statius/ |
| KEGG_ASCORBATE_AND_ALDARATE_METABOLISM KEGG_STARCH_AND_SUCROSE_METABOLISM KEGG_RETINOL_METABOLISM KEGG_PORPHYRIN_AND_CHLOROPHYLL_METABOLISM KEGG_METABOLISM_OF_XENOBIOTICS_BY_CYTOCHROME_P450 KEGG_DRUG_METABOLISM_CYTOCHROME_P450 KEGG_DRUG_METABOLISM_OTHER_ENZYMES | |
| OMIM | |
| Orphanet | |
| Disease | KEGG Disease: UGT2A3 |
| MedGen: UGT2A3 (Human Medical Genetics with Condition) | |
| ClinVar: UGT2A3 | |
| Phenotype | MGI: UGT2A3 (International Mouse Phenotyping Consortium) |
| PhenomicDB: UGT2A3 | |
| Mutations for UGT2A3 |
| * Under tables are showing count per each tissue to give us broad intuition about tissue specific mutation patterns.You can go to the detailed page for each mutation database's web site. |
| There's no structural variation information in COSMIC data for this gene. |
| * From mRNA Sanger sequences, Chitars2.0 arranged chimeric transcripts. This table shows UGT2A3 related fusion information. |
| ID | Head Gene | Tail Gene | Accession | Gene_a | qStart_a | qEnd_a | Chromosome_a | tStart_a | tEnd_a | Gene_a | qStart_a | qEnd_a | Chromosome_a | tStart_a | tEnd_a |
| Top |
| There's no copy number variation information in COSMIC data for this gene. |
| Top |
|
 |
| Top |
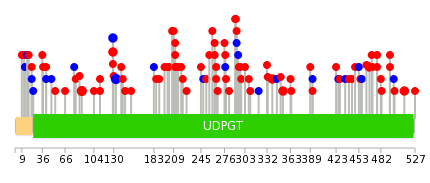
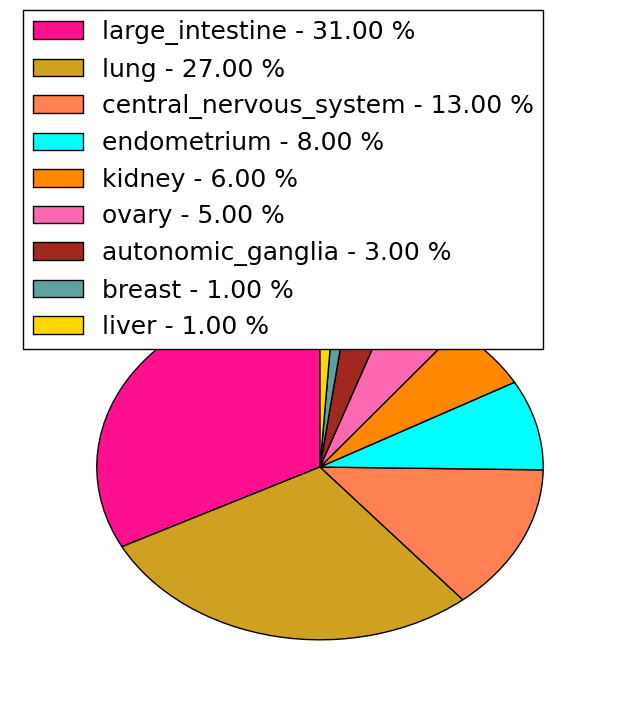
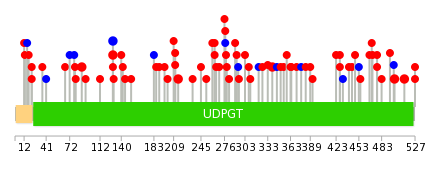
| Stat. for Non-Synonymous SNVs (# total SNVs=58) | (# total SNVs=15) |
 | 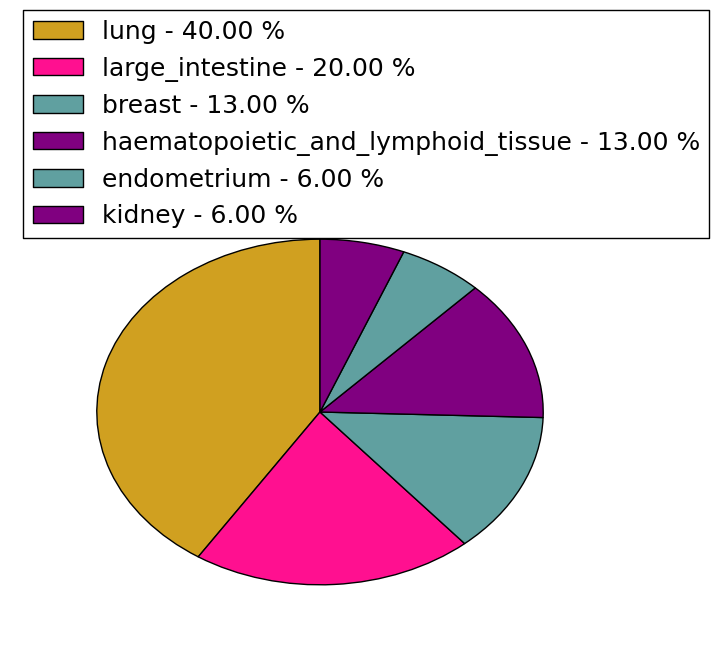 |
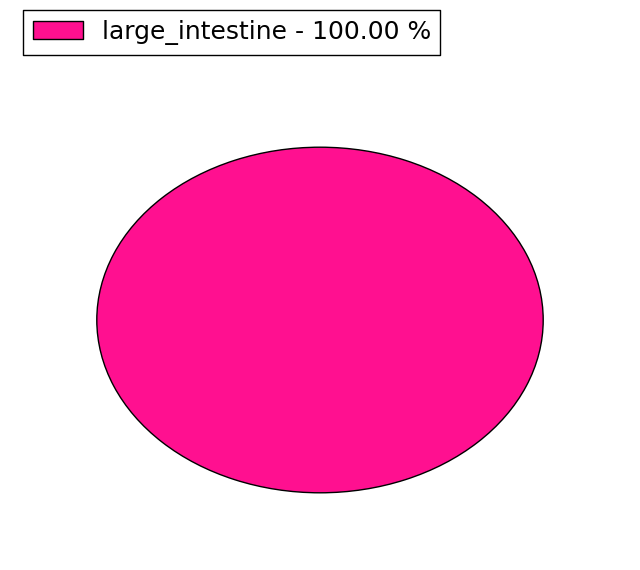
(# total SNVs=2) | (# total SNVs=1) |
 |  |
| Top |
| * When you move the cursor on each content, you can see more deailed mutation information on the Tooltip. Those are primary_site,primary_histology,mutation(aa),pubmedID. |
| GRCh37 position | Mutation(aa) | Unique sampleID count |
| chr4:69817217-69817217 | p.E88K | 3 |
| chr4:69817080-69817080 | p.T133T | 3 |
| chr4:69795746-69795746 | p.R457* | 3 |
| chr4:69817092-69817092 | p.I129I | 3 |
| chr4:69811101-69811101 | p.E263K | 2 |
| chr4:69795685-69795685 | p.A477V | 2 |
| chr4:69796900-69796900 | p.D353H | 2 |
| chr4:69816848-69816848 | p.N211D | 2 |
| chr4:69795577-69795577 | p.S513F | 2 |
| chr4:69795715-69795715 | p.R467H | 2 |
| Top |
|
 |
| Point Mutation/ Tissue ID | 1 | 2 | 3 | 4 | 5 | 6 | 7 | 8 | 9 | 10 | 11 | 12 | 13 | 14 | 15 | 16 | 17 | 18 | 19 | 20 |
| # sample | 3 | 1 | 13 | 5 | 4 | 5 | 10 | 7 | 3 | 19 | 5 | 5 | ||||||||
| # mutation | 3 | 1 | 12 | 5 | 4 | 5 | 12 | 8 | 3 | 23 | 5 | 6 | ||||||||
| nonsynonymous SNV | 3 | 1 | 11 | 5 | 4 | 4 | 10 | 6 | 3 | 18 | 3 | 5 | ||||||||
| synonymous SNV | 1 | 1 | 2 | 2 | 5 | 2 | 1 |
| cf) Tissue ID; Tissue type (1; BLCA[Bladder Urothelial Carcinoma], 2; BRCA[Breast invasive carcinoma], 3; CESC[Cervical squamous cell carcinoma and endocervical adenocarcinoma], 4; COAD[Colon adenocarcinoma], 5; GBM[Glioblastoma multiforme], 6; Glioma Low Grade, 7; HNSC[Head and Neck squamous cell carcinoma], 8; KICH[Kidney Chromophobe], 9; KIRC[Kidney renal clear cell carcinoma], 10; KIRP[Kidney renal papillary cell carcinoma], 11; LAML[Acute Myeloid Leukemia], 12; LUAD[Lung adenocarcinoma], 13; LUSC[Lung squamous cell carcinoma], 14; OV[Ovarian serous cystadenocarcinoma ], 15; PAAD[Pancreatic adenocarcinoma], 16; PRAD[Prostate adenocarcinoma], 17; SKCM[Skin Cutaneous Melanoma], 18:STAD[Stomach adenocarcinoma], 19:THCA[Thyroid carcinoma], 20:UCEC[Uterine Corpus Endometrial Carcinoma]) |
| Top |
| * We represented just top 10 SNVs. When you move the cursor on each content, you can see more deailed mutation information on the Tooltip. Those are primary_site, primary_histology, mutation(aa), pubmedID. |
| Genomic Position | Mutation(aa) | Unique sampleID count |
| chr4:69817092 | p.I129I | 3 |
| chr4:69795577 | p.R428T | 2 |
| chr4:69795617 | p.E263Q | 2 |
| chr4:69817093 | p.S513F | 2 |
| chr4:69796285 | p.A500T | 2 |
| chr4:69811101 | p.I129T | 2 |
| chr4:69795685 | p.S215L | 2 |
| chr4:69817217 | p.A477V | 2 |
| chr4:69796941 | p.E88K | 2 |
| chr4:69816835 | p.G339E | 2 |
| * Copy number data were extracted from TCGA using R package TCGA-Assembler. The URLs of all public data files on TCGA DCC data server were gathered on Jan-05-2015. Function ProcessCNAData in TCGA-Assembler package was used to obtain gene-level copy number value which is calculated as the average copy number of the genomic region of a gene. |
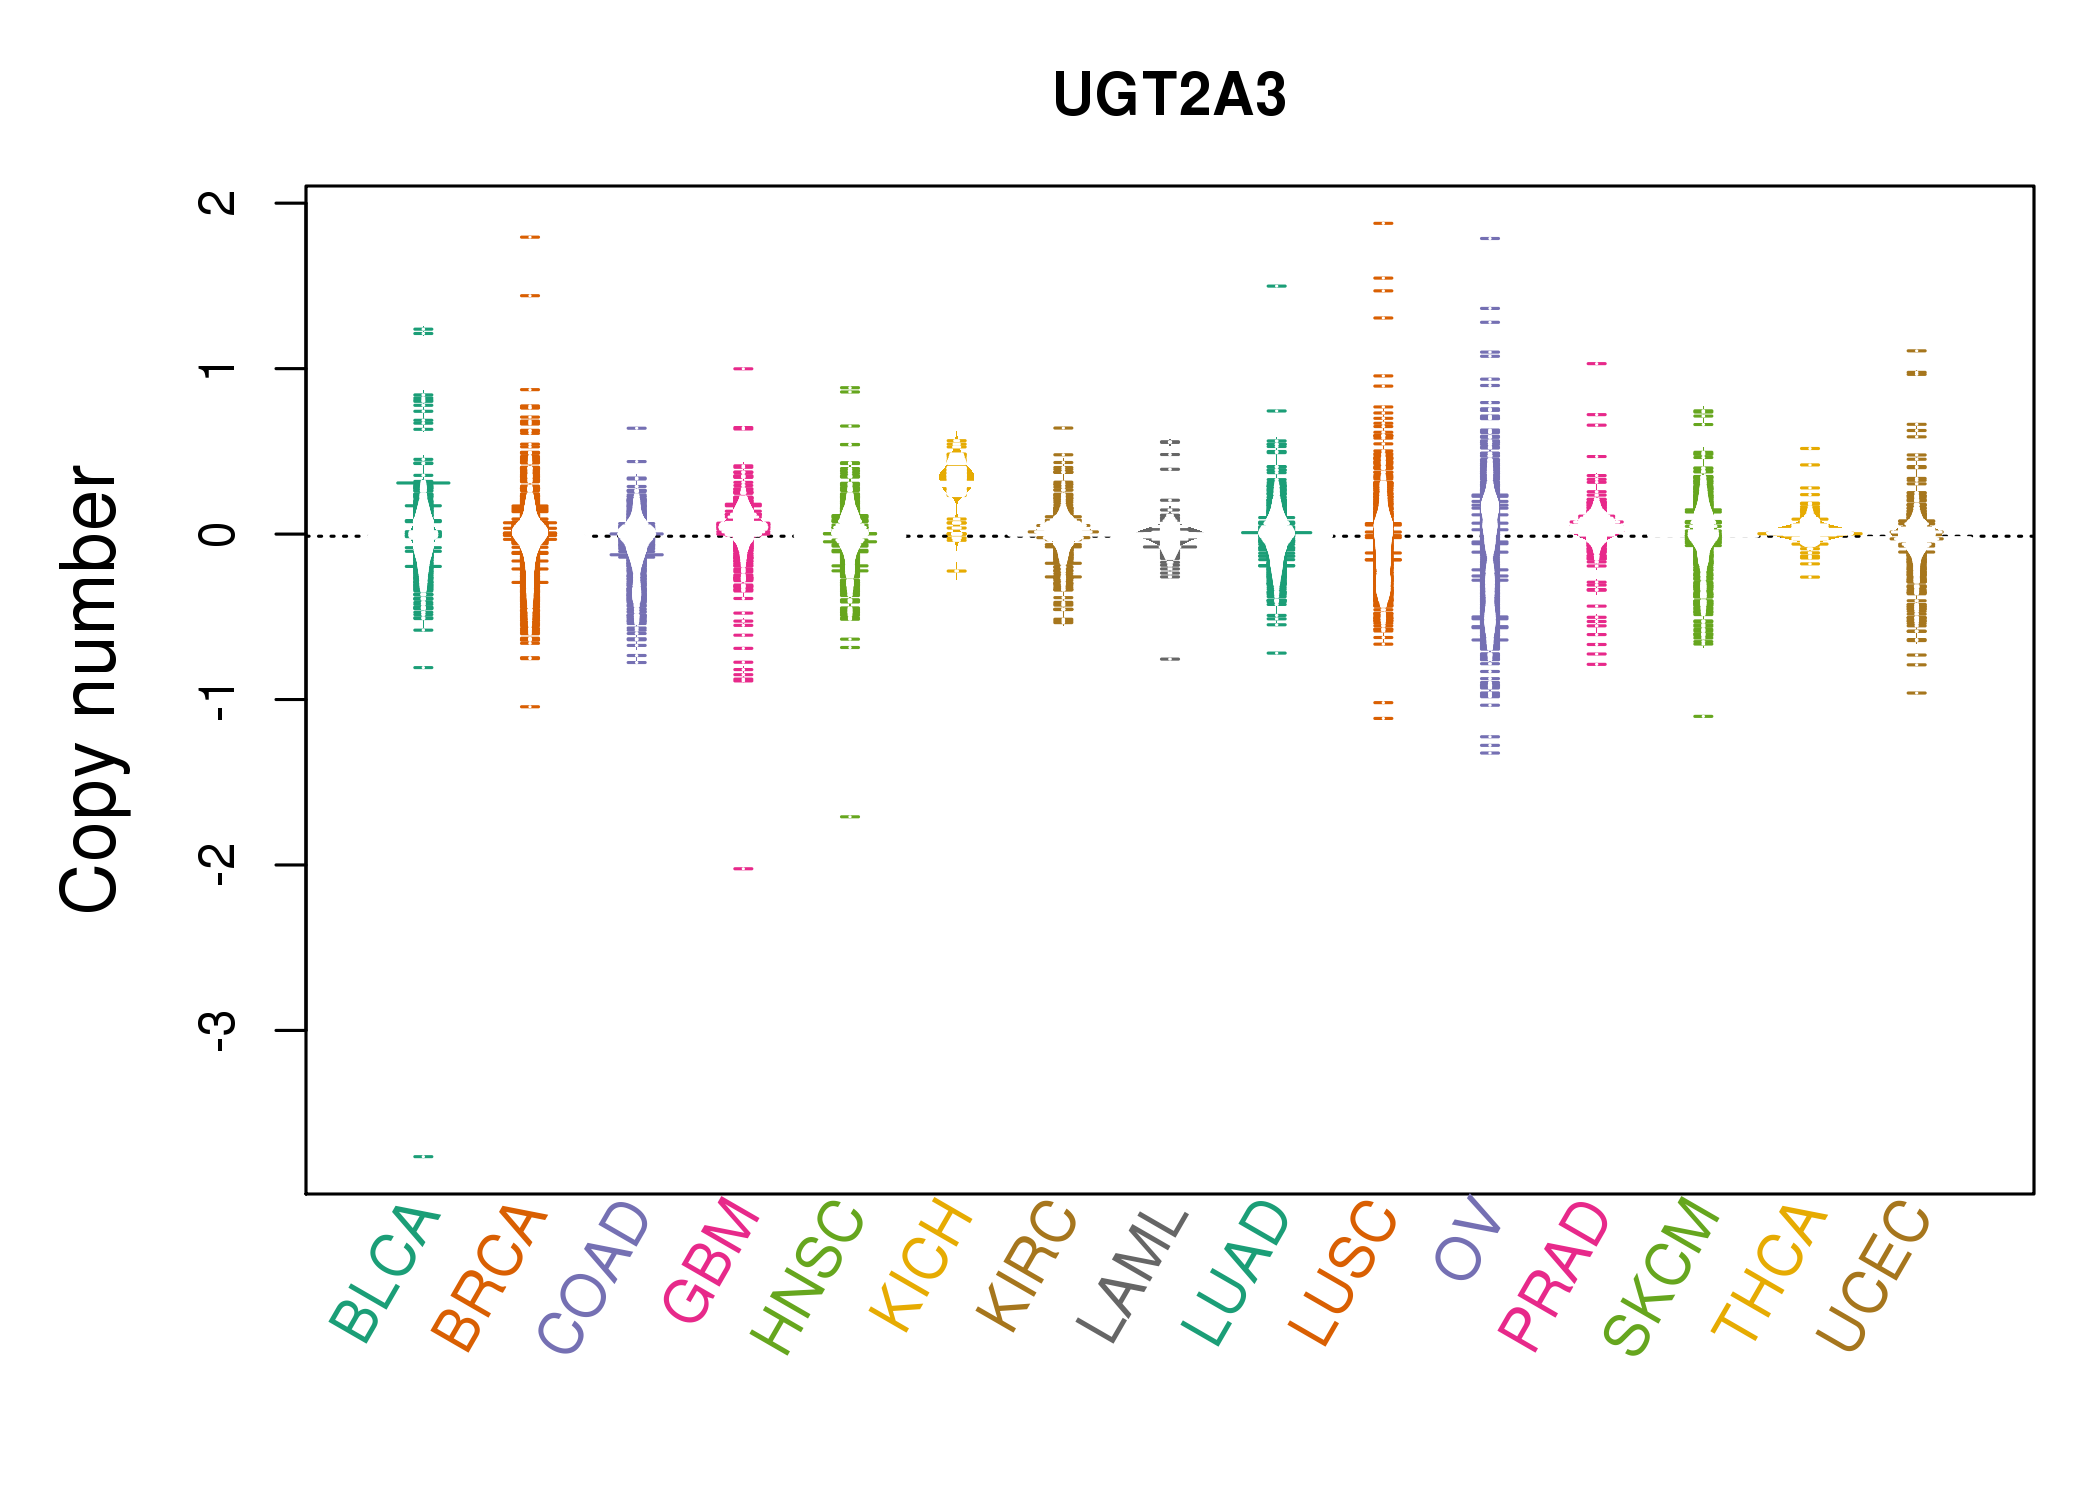 |
| cf) Tissue ID[Tissue type]: BLCA[Bladder Urothelial Carcinoma], BRCA[Breast invasive carcinoma], CESC[Cervical squamous cell carcinoma and endocervical adenocarcinoma], COAD[Colon adenocarcinoma], GBM[Glioblastoma multiforme], Glioma Low Grade, HNSC[Head and Neck squamous cell carcinoma], KICH[Kidney Chromophobe], KIRC[Kidney renal clear cell carcinoma], KIRP[Kidney renal papillary cell carcinoma], LAML[Acute Myeloid Leukemia], LUAD[Lung adenocarcinoma], LUSC[Lung squamous cell carcinoma], OV[Ovarian serous cystadenocarcinoma ], PAAD[Pancreatic adenocarcinoma], PRAD[Prostate adenocarcinoma], SKCM[Skin Cutaneous Melanoma], STAD[Stomach adenocarcinoma], THCA[Thyroid carcinoma], UCEC[Uterine Corpus Endometrial Carcinoma] |
| Top |
| Gene Expression for UGT2A3 |
| * CCLE gene expression data were extracted from CCLE_Expression_Entrez_2012-10-18.res: Gene-centric RMA-normalized mRNA expression data. |
 |
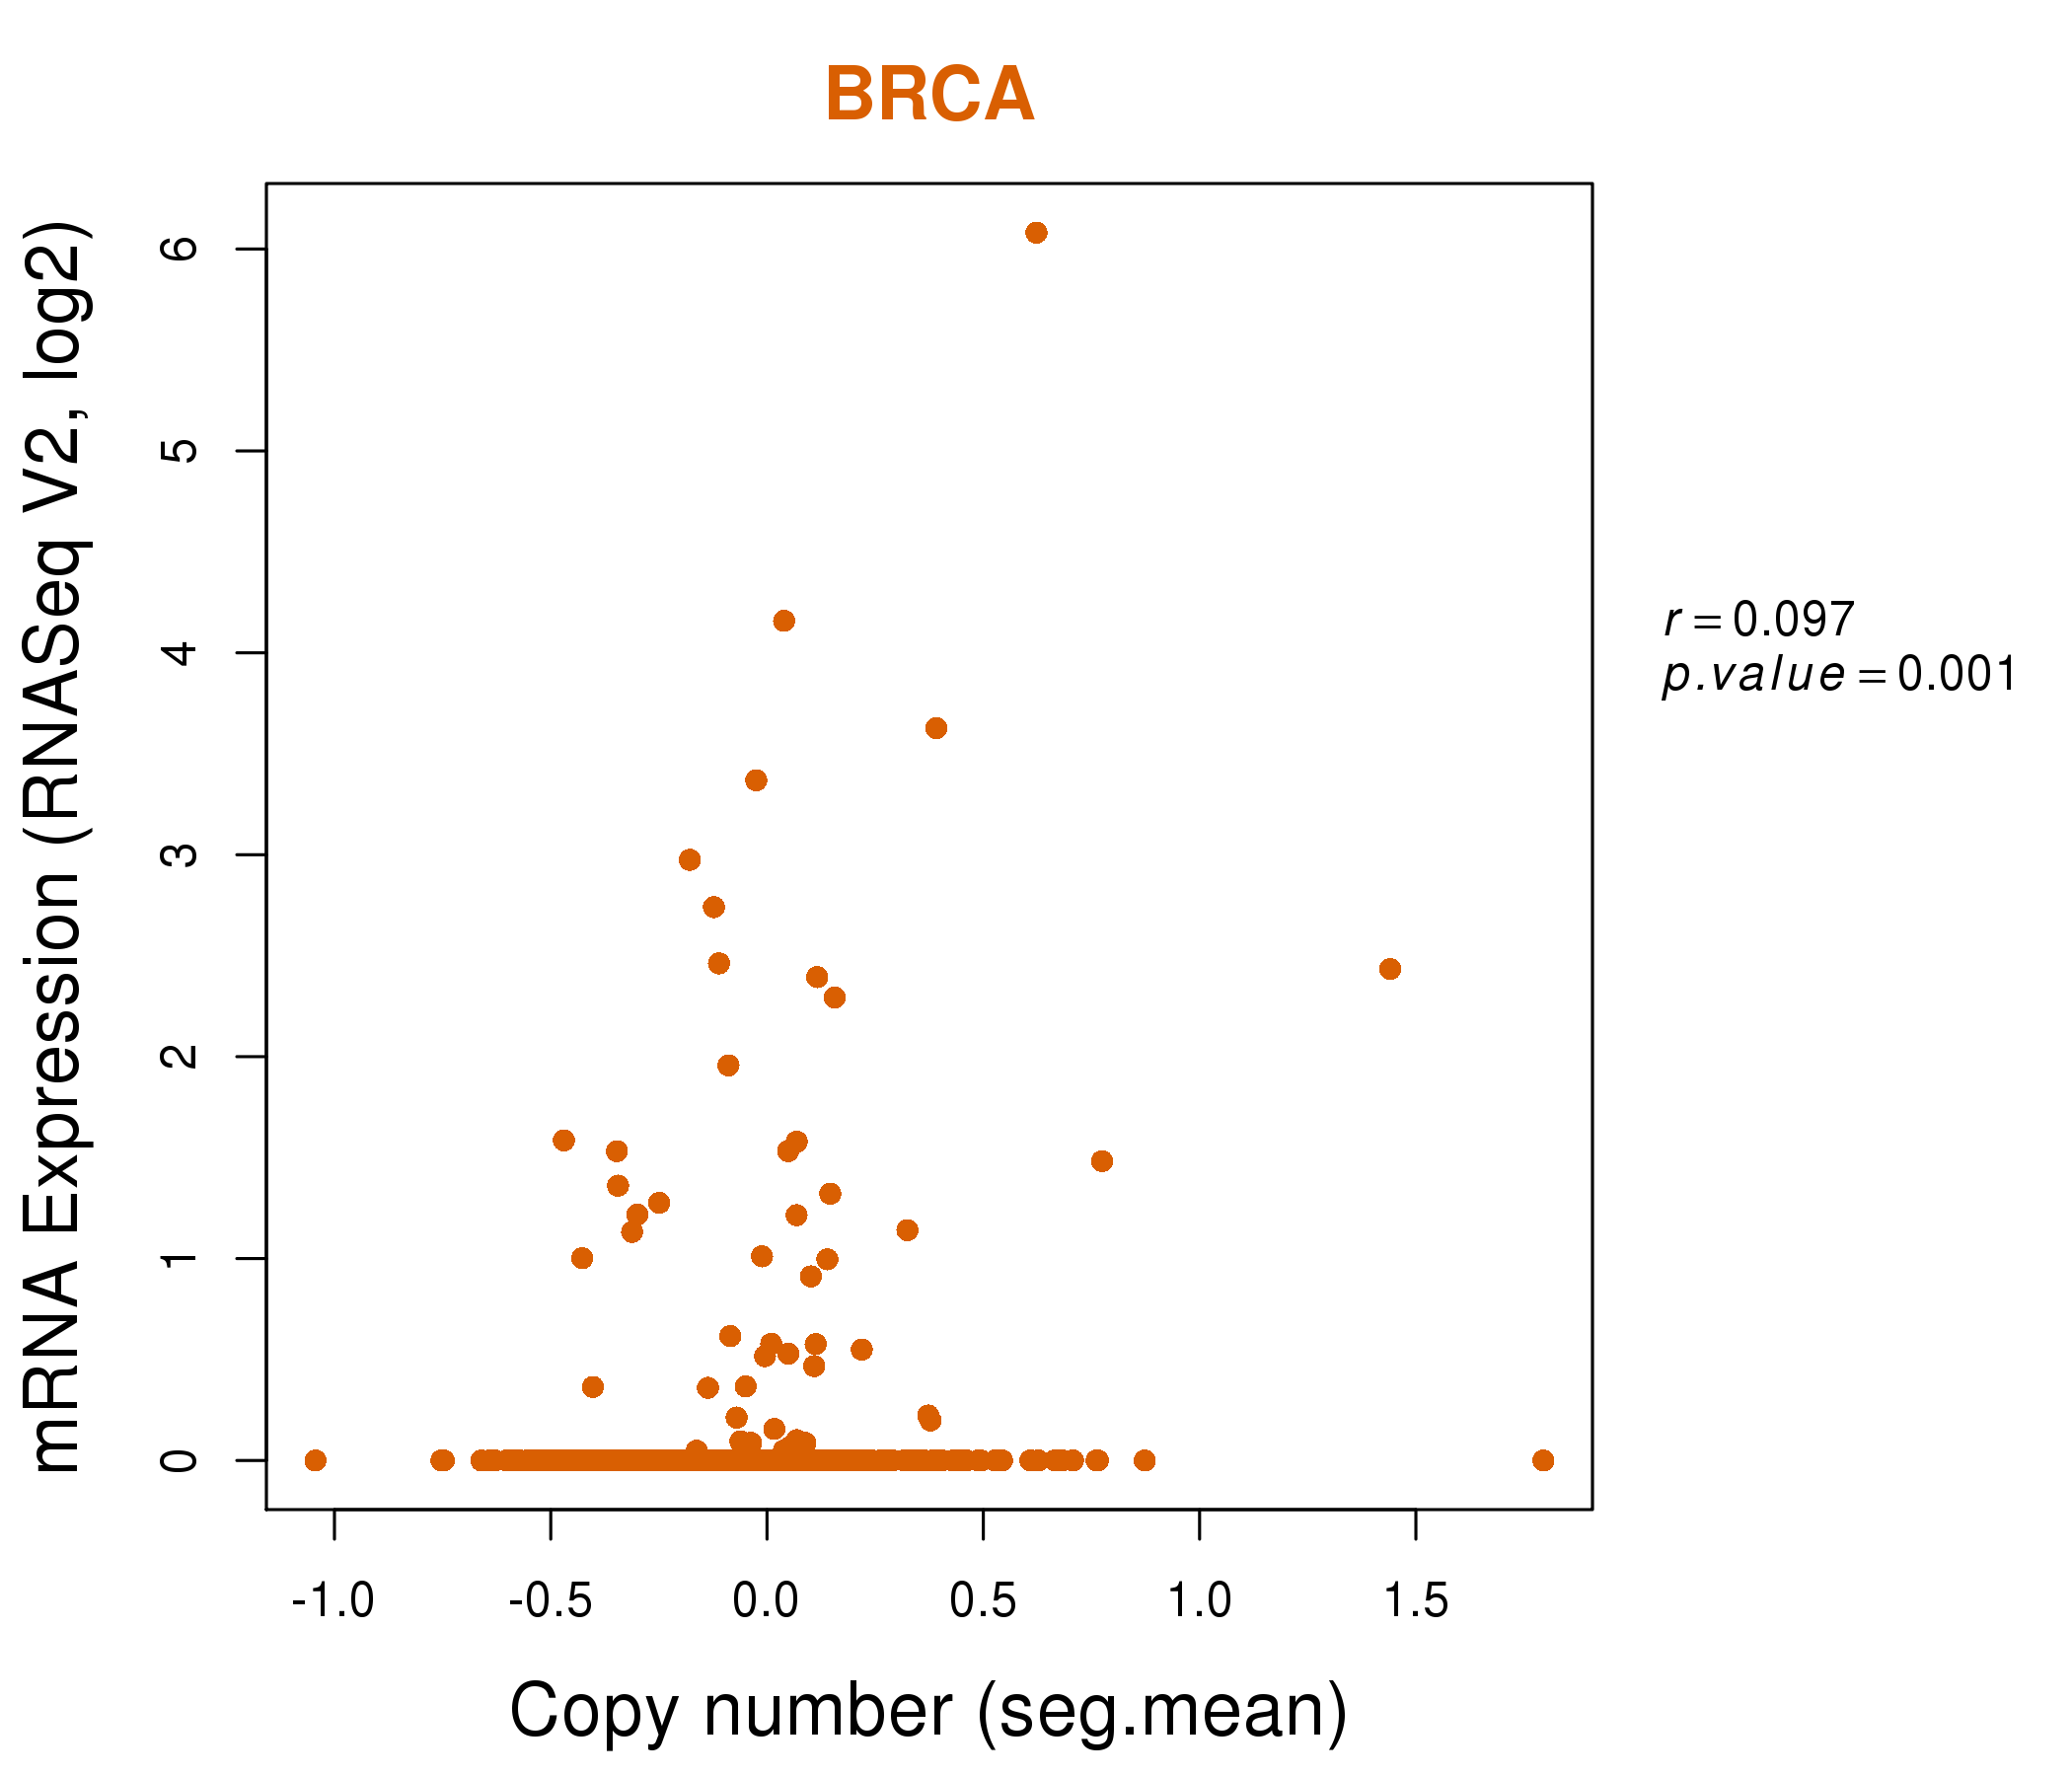
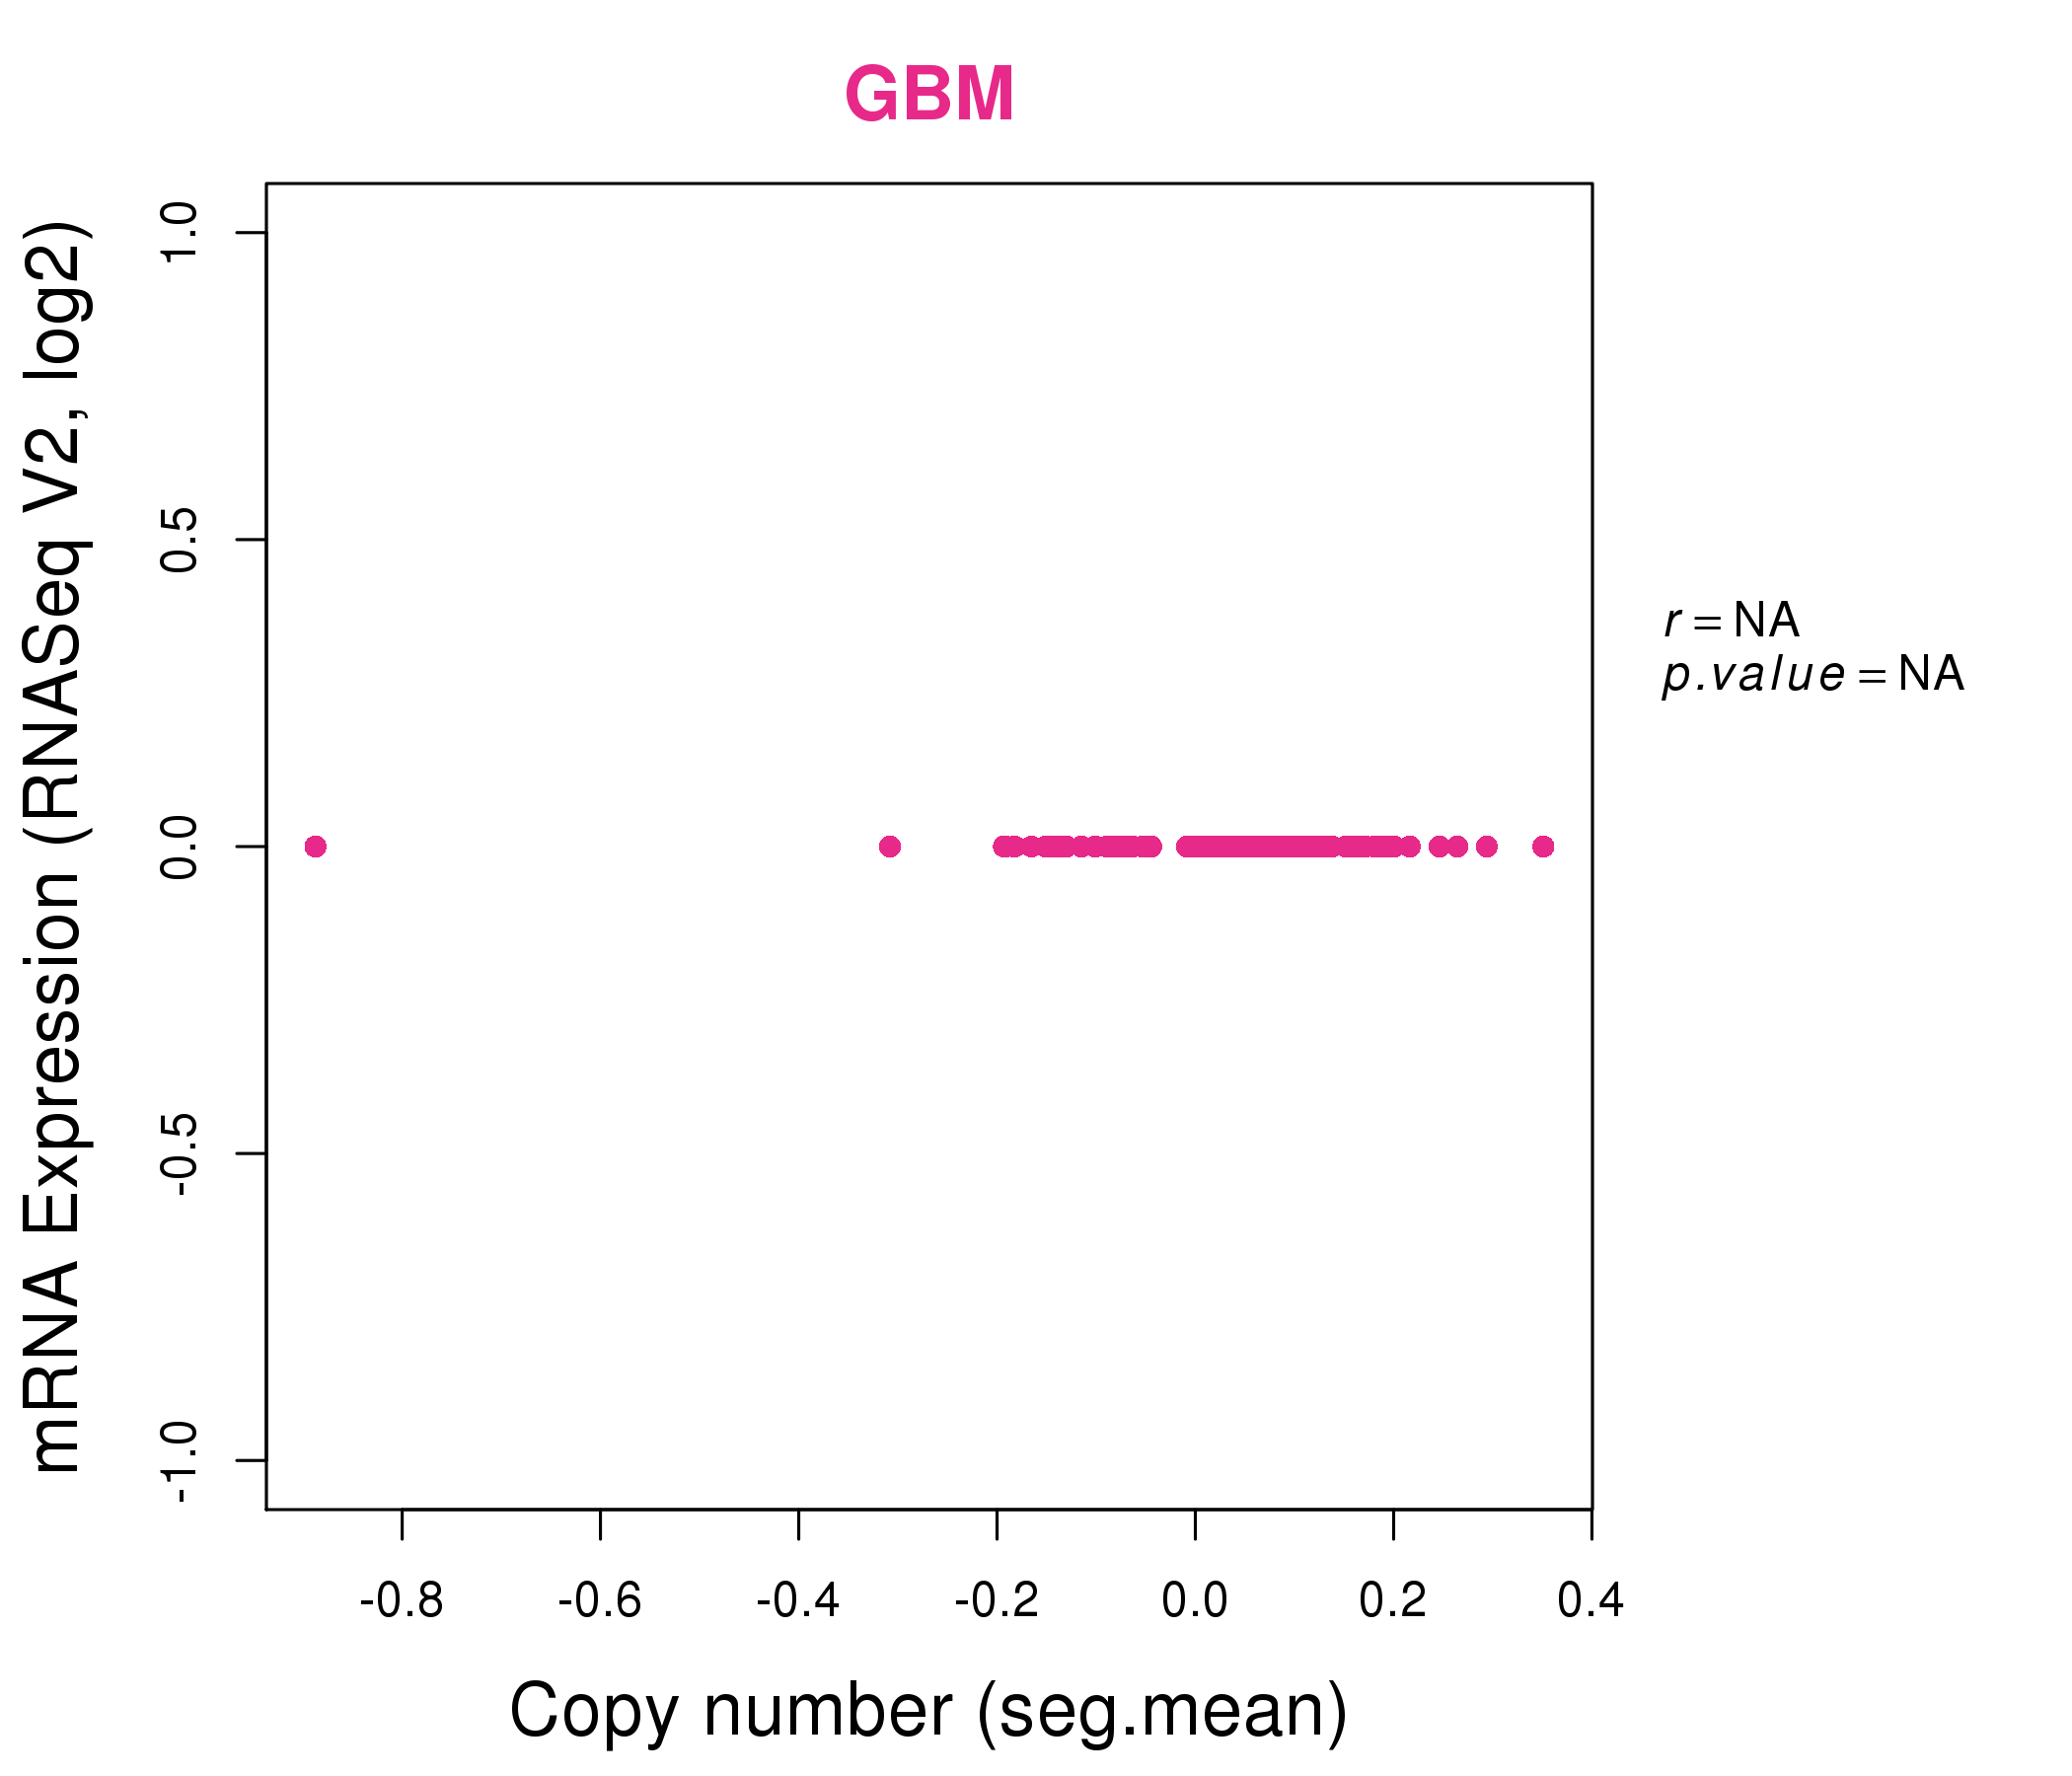
| * Normalized gene expression data of RNASeqV2 was extracted from TCGA using R package TCGA-Assembler. The URLs of all public data files on TCGA DCC data server were gathered at Jan-05-2015. Only eight cancer types have enough normal control samples for differential expression analysis. (t test, adjusted p<0.05 (using Benjamini-Hochberg FDR)) |
 |
| Top |
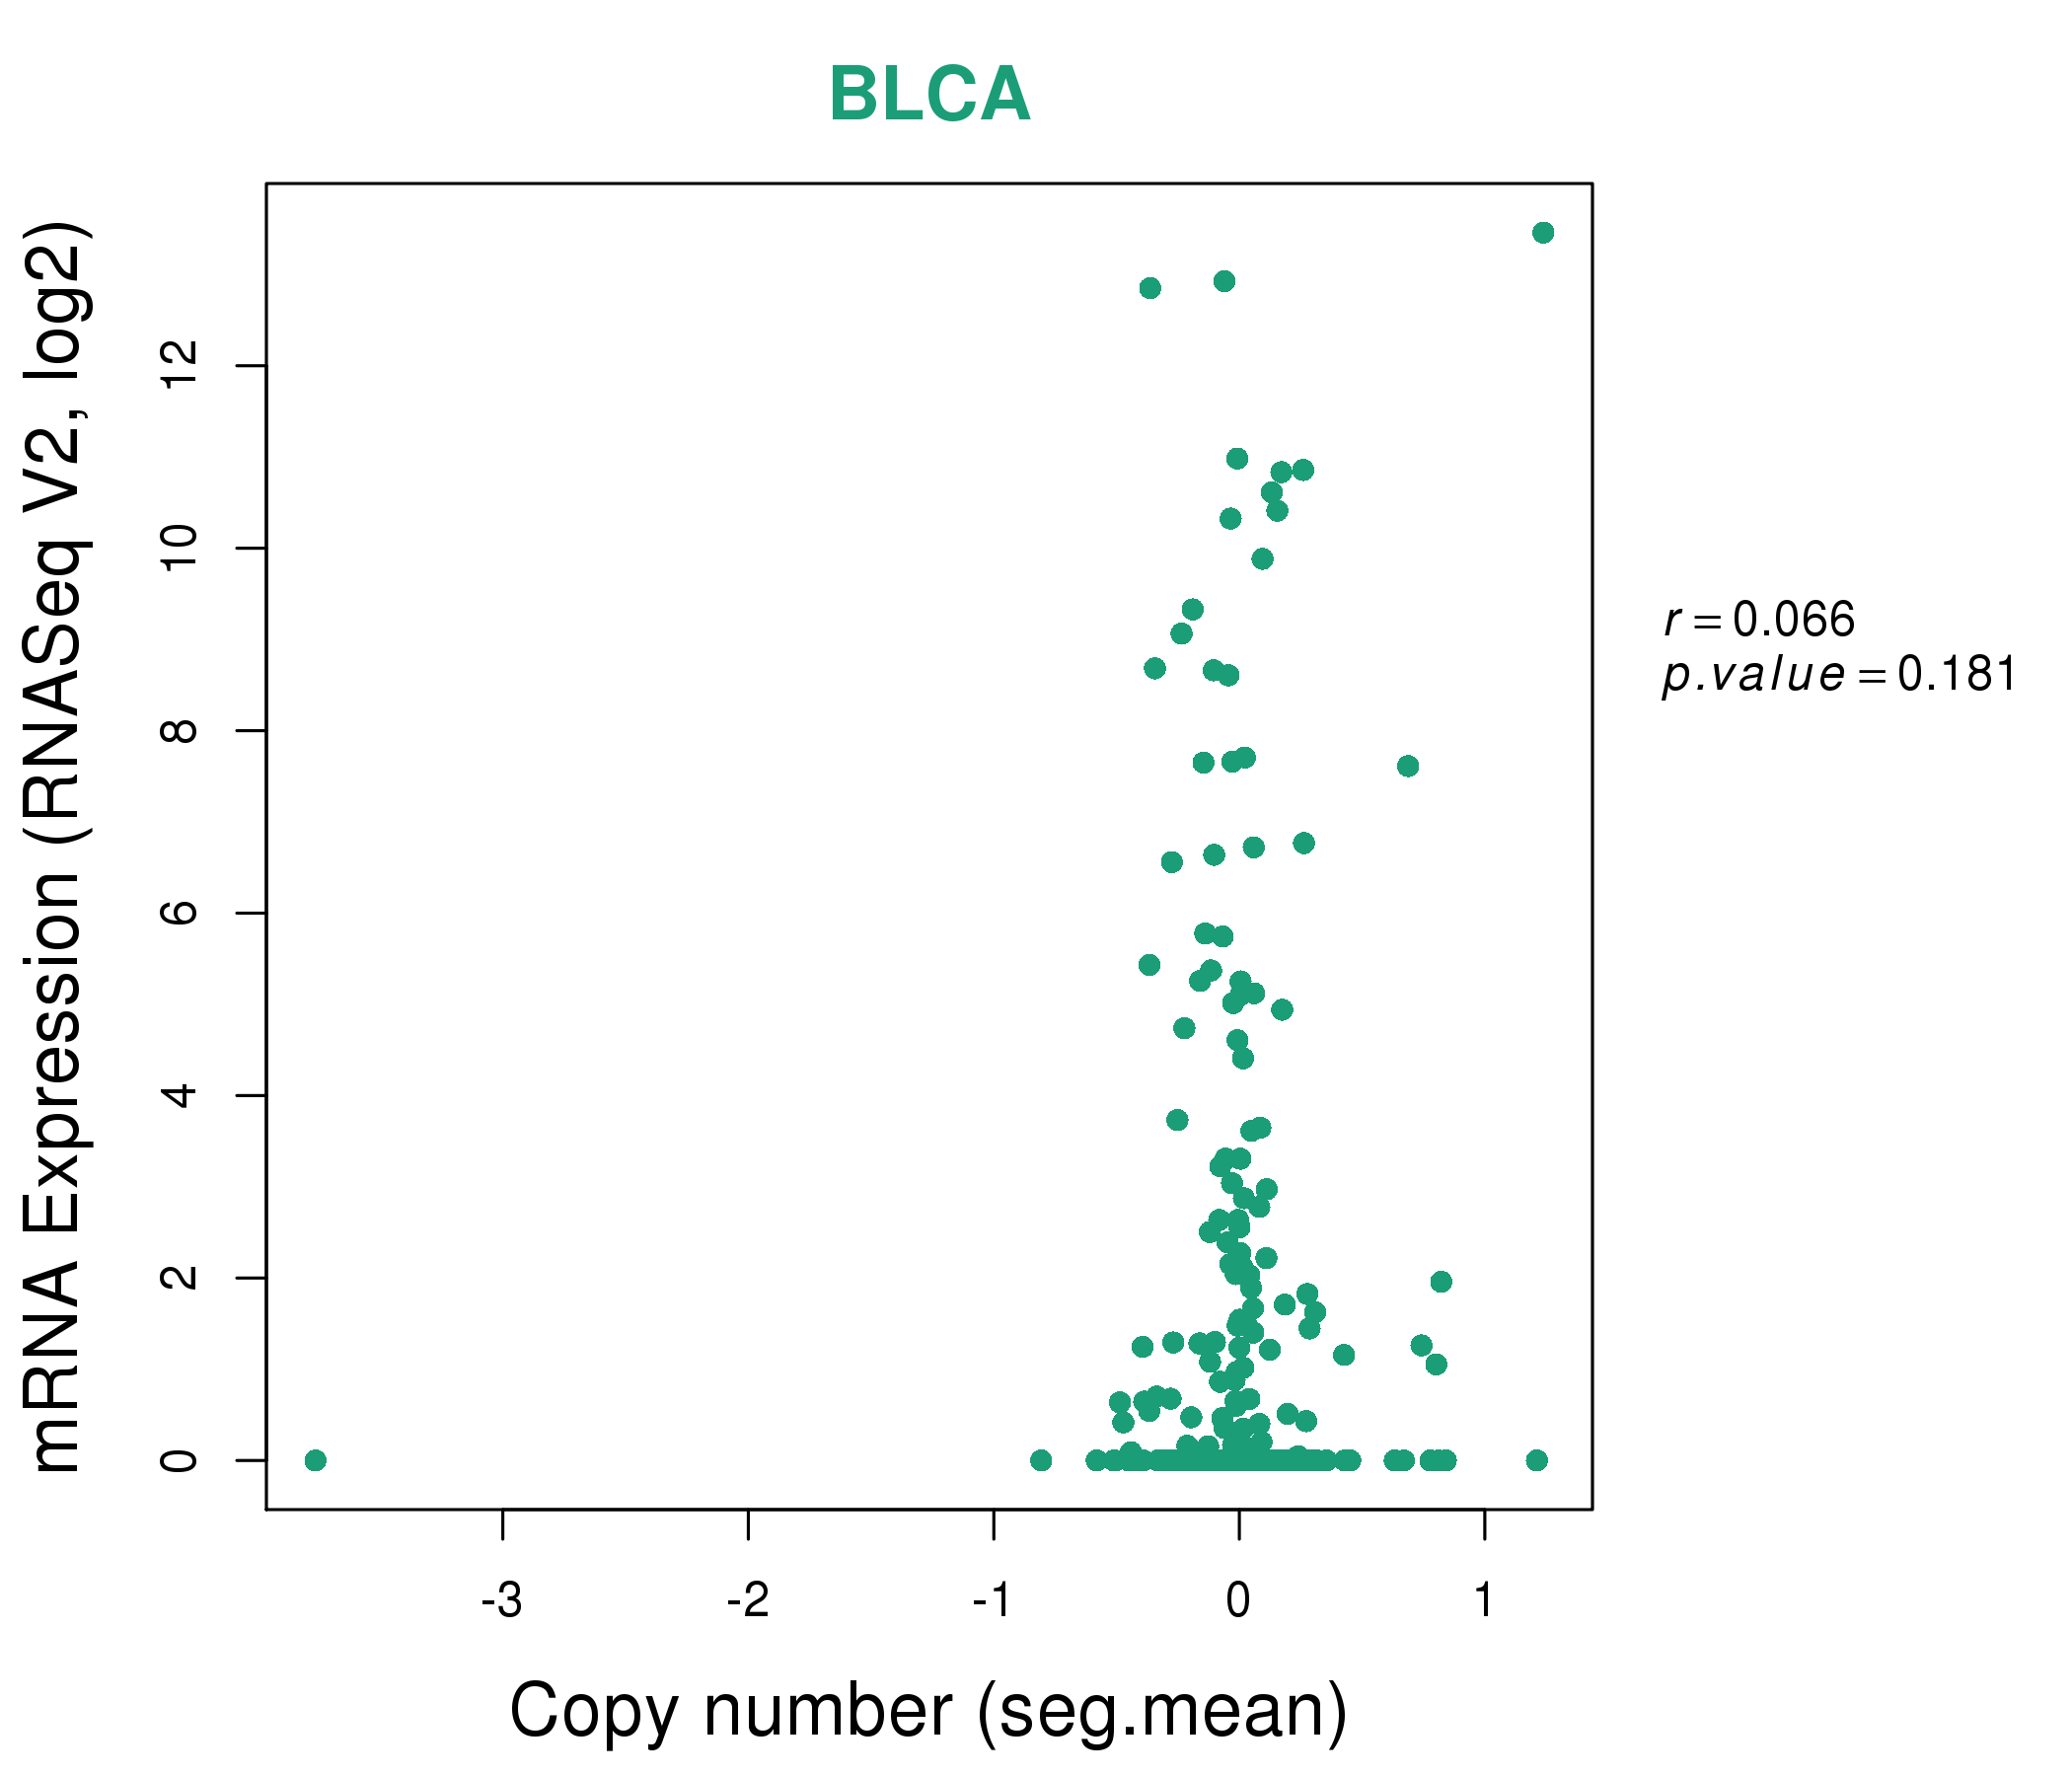
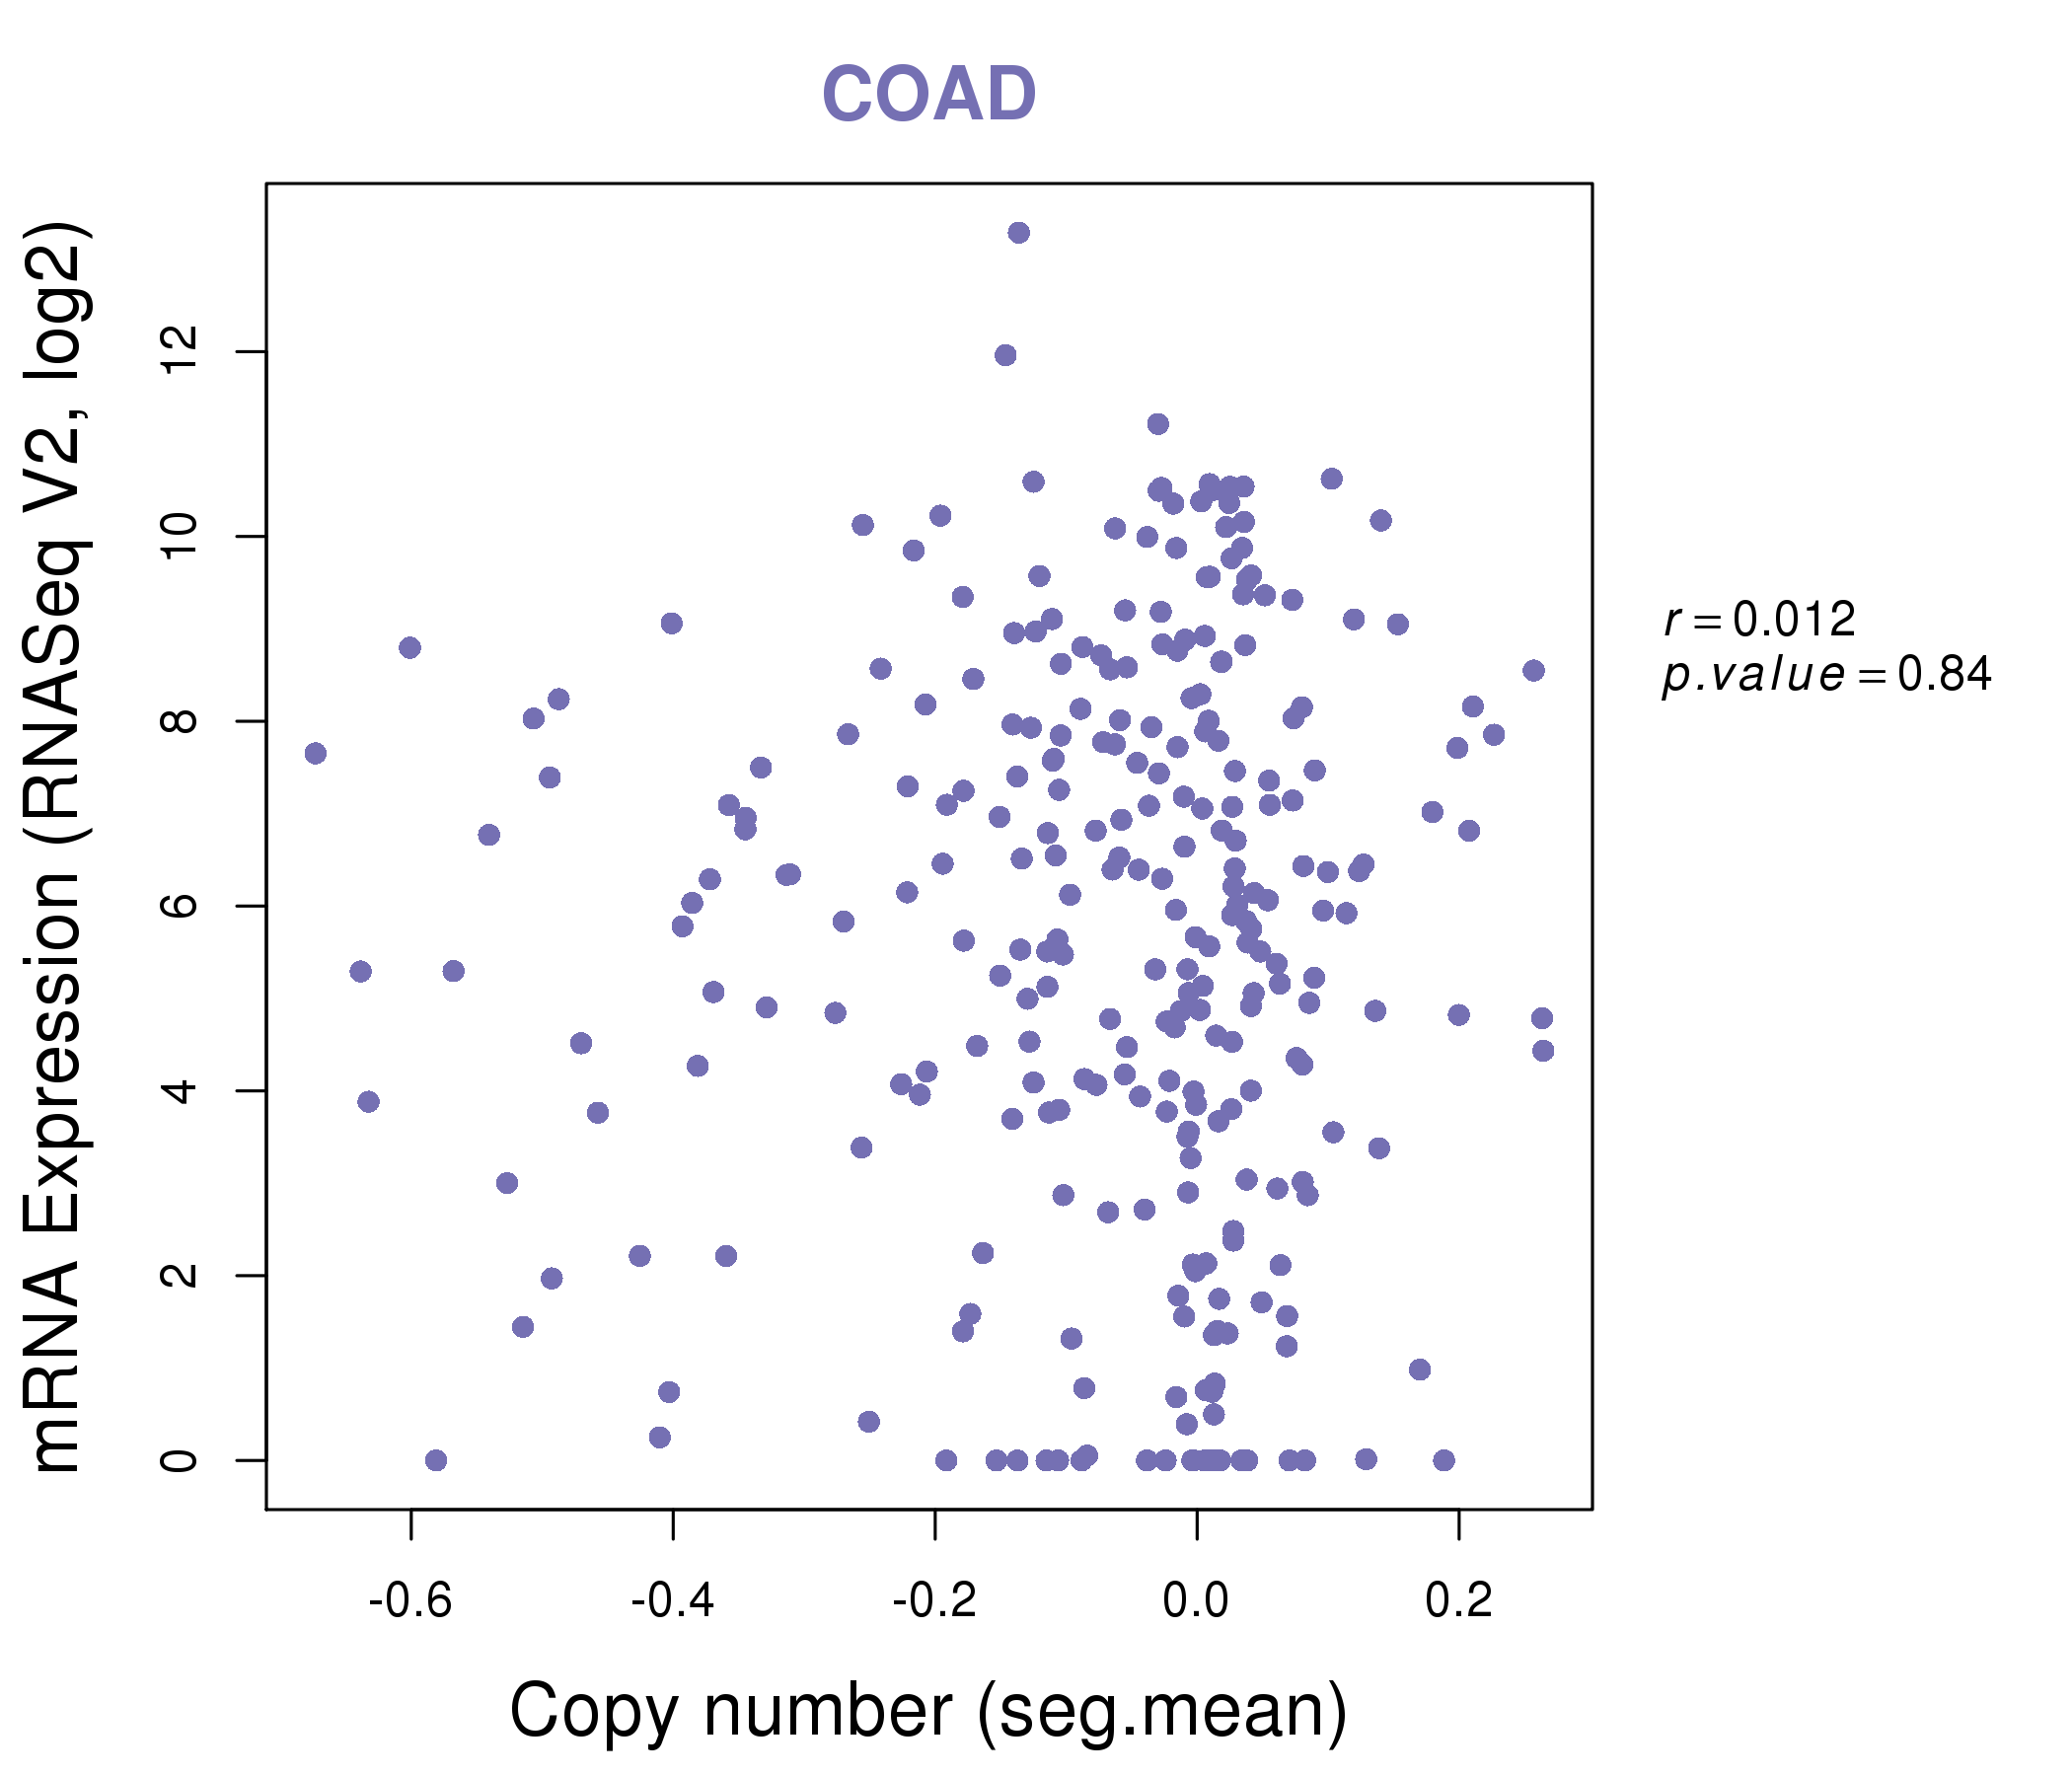
| * This plots show the correlation between CNV and gene expression. |
: Open all plots for all cancer types
 |
|
 |
|
| Top |
| Gene-Gene Network Information |
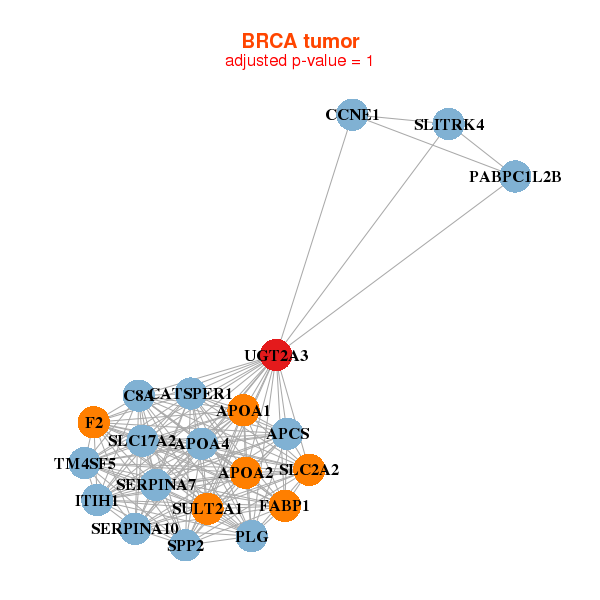
| * Co-Expression network figures were drawn using R package igraph. Only the top 20 genes with the highest correlations were shown. Red circle: input gene, orange circle: cell metabolism gene, sky circle: other gene |
: Open all plots for all cancer types
 |
|
| APCS,APOA1,APOA2,APOA4,C8A,CATSPER1,CCNE1, F2,FABP1,ITIH1,PABPC1L2B,PLG,SERPINA10,SERPINA7, SLC17A2,SLC2A2,SLITRK4,SPP2,SULT2A1,TM4SF5,UGT2A3 | AGXT2,CCR6,CGB2,DEFB125,GH2,HDGFL1,HELT, HOXC12,LHX9,MAGEB1,OR10J5,OR2M3,PSG8,RAET1L, SLC17A3,SLC6A19,TCAM1P,TP53TG5,TPI1P3,UGT2A3,WFDC8 |
 |
|
| CHRNA2,DLX6AS,GDF10,GPR83,GPR98,KCTD16,KNG1, KRT36,KRT37,KRT38,LCN10,MYL3,NAV2,NIPAL4, OR10G9,OR10S1,TGM5,TMPRSS6,UGT2A3,UGT2B7,UNC13C | ABHD14B,ACBD5,ADD3,AMT,ARHGAP18,AUH,BPHL, MPC2,SMIM19,CENPV,CMBL,CYP2R1,ECI1,FGGY, GLOD4,GPR160,PGAP2,RARS2,SUCLG1,TOM1L1,UGT2A3 |
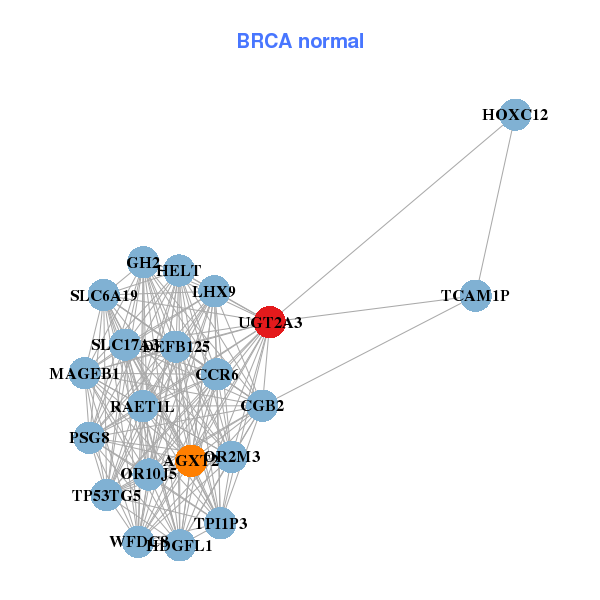
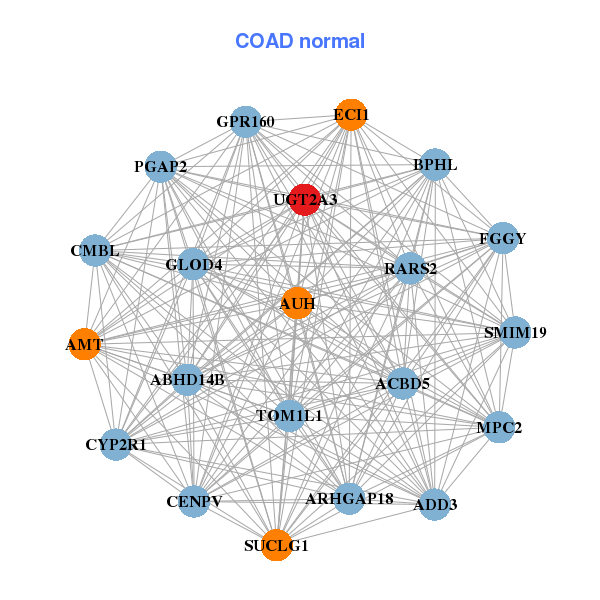
| * Co-Expression network figures were drawn using R package igraph. Only the top 20 genes with the highest correlations were shown. Red circle: input gene, orange circle: cell metabolism gene, sky circle: other gene |
: Open all plots for all cancer types
| Top |
: Open all interacting genes' information including KEGG pathway for all interacting genes from DAVID
| Top |
| Pharmacological Information for UGT2A3 |
| There's no related Drug. |
| Top |
| Cross referenced IDs for UGT2A3 |
| * We obtained these cross-references from Uniprot database. It covers 150 different DBs, 18 categories. http://www.uniprot.org/help/cross_references_section |
: Open all cross reference information
|
Copyright © 2016-Present - The Univsersity of Texas Health Science Center at Houston @ |