|
||||||||||||||||||||||||||||||||||||||||||||||||||||||||||||||||||||||||||||||||||||||||||||||||||||||||||||||||||||||||||||||||||||||||||||||||||||||||||||||||||||||||||||||||||||||||||||||||||||||||||||||||||||||||||||||||||||||||||||||||||||||||||||||||||||||||||||||||||||||||||||||||||||||||||||||||||||||||||
| |
| Phenotypic Information (metabolism pathway, cancer, disease, phenome) |
| |
| |
| Gene-Gene Network Information: Co-Expression Network, Interacting Genes & KEGG |
| |
|


| Gene Summary for LPCAT1 |
| Basic gene info. | Gene symbol | LPCAT1 |
| Gene name | lysophosphatidylcholine acyltransferase 1 | |
| Synonyms | AYTL2|PFAAP3|lpcat | |
| Cytomap | UCSC genome browser: 5p15.33 | |
| Genomic location | chr5 :1461541-1524076 | |
| Type of gene | protein-coding | |
| RefGenes | NM_024830.3, | |
| Ensembl id | ENSG00000153395 | |
| Description | 1-acylglycerophosphocholine O-acyltransferase1-alkylglycerophosphocholine O-acetyltransferaseLPC acyltransferase 1LPCAT-1acetyl-CoA:lyso-PAF acetyltransferaseacetyl-CoA:lyso-platelet-activating factor acetyltransferaseacyl-CoA:lysophosphatidylcholin | |
| Modification date | 20141207 | |
| dbXrefs | MIM : 610472 | |
| HGNC : HGNC | ||
| Ensembl : ENSG00000153395 | ||
| HPRD : 08572 | ||
| Vega : OTTHUMG00000131017 | ||
| Protein | UniProt: go to UniProt's Cross Reference DB Table | |
| Expression | CleanEX: HS_LPCAT1 | |
| BioGPS: 79888 | ||
| Gene Expression Atlas: ENSG00000153395 | ||
| The Human Protein Atlas: ENSG00000153395 | ||
| Pathway | NCI Pathway Interaction Database: LPCAT1 | |
| KEGG: LPCAT1 | ||
| REACTOME: LPCAT1 | ||
| ConsensusPathDB | ||
| Pathway Commons: LPCAT1 | ||
| Metabolism | MetaCyc: LPCAT1 | |
| HUMANCyc: LPCAT1 | ||
| Regulation | Ensembl's Regulation: ENSG00000153395 | |
| miRBase: chr5 :1,461,541-1,524,076 | ||
| TargetScan: NM_024830 | ||
| cisRED: ENSG00000153395 | ||
| Context | iHOP: LPCAT1 | |
| cancer metabolism search in PubMed: LPCAT1 | ||
| UCL Cancer Institute: LPCAT1 | ||
| Assigned class in ccmGDB | C | |
| Top |
| Phenotypic Information for LPCAT1(metabolism pathway, cancer, disease, phenome) |
| Cancer | CGAP: LPCAT1 |
| Familial Cancer Database: LPCAT1 | |
| * This gene is included in those cancer gene databases. |
|
|
|
|
|
|
| ||||||||||||||||||||||||||||||||||||||||||||||||||||||||||||||||||||||||||||||||||||||||||||||||||||||||||||||||||||||||||||||||||||||||||||||||||||||||||||||||||||||||||||||||||||||||||||||||||||||||||||||||||||||||||||||||||||||||||||||||||||||||||||||||||||||||||||||||||||||||||||||||||||||||||||||||||||
Oncogene 1 | Significant driver gene in | |||||||||||||||||||||||||||||||||||||||||||||||||||||||||||||||||||||||||||||||||||||||||||||||||||||||||||||||||||||||||||||||||||||||||||||||||||||||||||||||||||||||||||||||||||||||||||||||||||||||||||||||||||||||||||||||||||||||||||||||||||||||||||||||||||||||||||||||||||||||||||||||||||||||||||||||||||||||||
| cf) number; DB name 1 Oncogene; http://nar.oxfordjournals.org/content/35/suppl_1/D721.long, 2 Tumor Suppressor gene; https://bioinfo.uth.edu/TSGene/, 3 Cancer Gene Census; http://www.nature.com/nrc/journal/v4/n3/abs/nrc1299.html, 4 CancerGenes; http://nar.oxfordjournals.org/content/35/suppl_1/D721.long, 5 Network of Cancer Gene; http://ncg.kcl.ac.uk/index.php, 1Therapeutic Vulnerabilities in Cancer; http://cbio.mskcc.org/cancergenomics/statius/ |
| KEGG_GLYCEROPHOSPHOLIPID_METABOLISM REACTOME_PHOSPHOLIPID_METABOLISM REACTOME_METABOLISM_OF_LIPIDS_AND_LIPOPROTEINS | |
| OMIM | |
| Orphanet | |
| Disease | KEGG Disease: LPCAT1 |
| MedGen: LPCAT1 (Human Medical Genetics with Condition) | |
| ClinVar: LPCAT1 | |
| Phenotype | MGI: LPCAT1 (International Mouse Phenotyping Consortium) |
| PhenomicDB: LPCAT1 | |
| Mutations for LPCAT1 |
| * Under tables are showing count per each tissue to give us broad intuition about tissue specific mutation patterns.You can go to the detailed page for each mutation database's web site. |
| There's no structural variation information in COSMIC data for this gene. |
| * From mRNA Sanger sequences, Chitars2.0 arranged chimeric transcripts. This table shows LPCAT1 related fusion information. |
| ID | Head Gene | Tail Gene | Accession | Gene_a | qStart_a | qEnd_a | Chromosome_a | tStart_a | tEnd_a | Gene_a | qStart_a | qEnd_a | Chromosome_a | tStart_a | tEnd_a |
| AV731790 | LPCAT1 | 9 | 133 | 5 | 1465752 | 1465876 | SYT1 | 134 | 585 | 12 | 79845330 | 79845786 | |
| AV729999 | LPCAT1 | 6 | 129 | 5 | 1465749 | 1465876 | SYT1 | 130 | 423 | 12 | 79845330 | 79845628 | |
| BG003119 | TRIM25 | 14 | 238 | 17 | 54972334 | 54972559 | LPCAT1 | 235 | 579 | 5 | 1476829 | 1477175 | |
| DB311369 | LPCAT1 | 1 | 56 | 5 | 1461544 | 1461599 | ENTPD7 | 52 | 317 | 10 | 101468342 | 101468607 | |
| BM693256 | AP1S2 | 19 | 292 | X | 15845010 | 15845283 | LPCAT1 | 283 | 449 | 5 | 1461785 | 1461951 | |
| AK123516 | ENTPD7 | 1 | 1766 | 10 | 101466842 | 101468607 | LPCAT1 | 1762 | 1817 | 5 | 1461544 | 1461599 | |
| Top |
| Mutation type/ Tissue ID | brca | cns | cerv | endome | haematopo | kidn | Lintest | liver | lung | ns | ovary | pancre | prost | skin | stoma | thyro | urina | |||
| Total # sample | 1 | 1 | 1 | 1 | 1 | |||||||||||||||
| GAIN (# sample) | 1 | 1 | 1 | 1 | ||||||||||||||||
| LOSS (# sample) | 1 |
| cf) Tissue ID; Tissue type (1; Breast, 2; Central_nervous_system, 3; Cervix, 4; Endometrium, 5; Haematopoietic_and_lymphoid_tissue, 6; Kidney, 7; Large_intestine, 8; Liver, 9; Lung, 10; NS, 11; Ovary, 12; Pancreas, 13; Prostate, 14; Skin, 15; Stomach, 16; Thyroid, 17; Urinary_tract) |
| Top |
|
 |
| Top |
| Stat. for Non-Synonymous SNVs (# total SNVs=47) | (# total SNVs=25) |
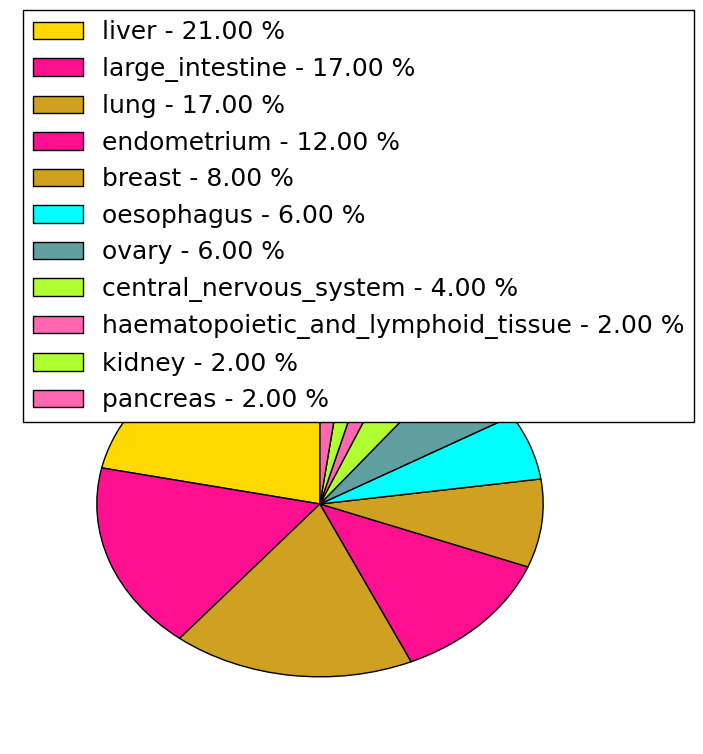 | 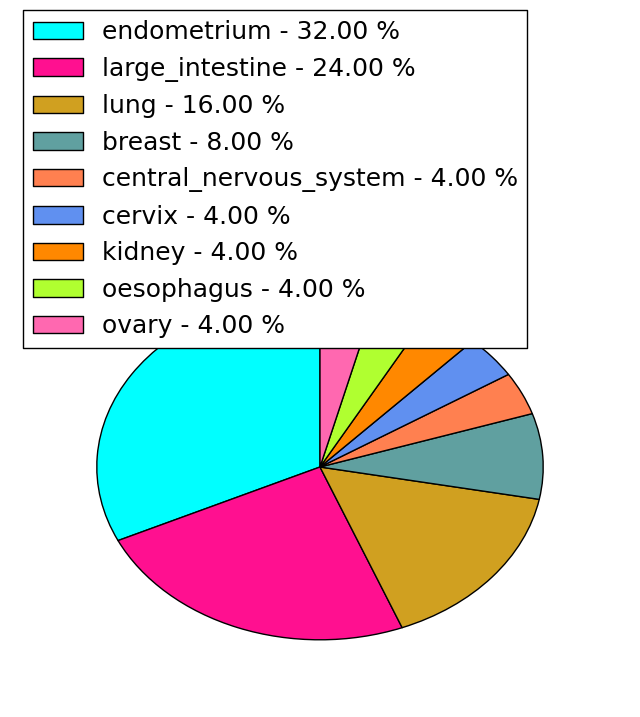 |
(# total SNVs=1) | (# total SNVs=2) |
 | 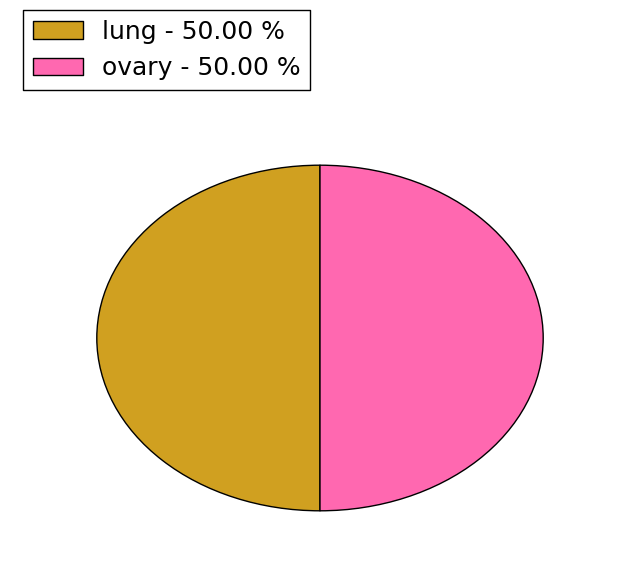 |
| Top |
| * When you move the cursor on each content, you can see more deailed mutation information on the Tooltip. Those are primary_site,primary_histology,mutation(aa),pubmedID. |
| GRCh37 position | Mutation(aa) | Unique sampleID count |
| chr5:1501684-1501684 | p.R57Q | 3 |
| chr5:1494910-1494910 | p.A133V | 3 |
| chr5:1489959-1489959 | p.I170V | 2 |
| chr5:1466983-1466983 | p.G434D | 2 |
| chr5:1467001-1467001 | p.Y428C | 2 |
| chr5:1463838-1463838 | p.N511N | 2 |
| chr5:1494882-1494882 | p.I142I | 2 |
| chr5:1474684-1474684 | p.R339Q | 2 |
| chr5:1466919-1466919 | p.T455T | 2 |
| chr5:1494891-1494891 | p.F139F | 2 |
| Top |
|
 |
| Point Mutation/ Tissue ID | 1 | 2 | 3 | 4 | 5 | 6 | 7 | 8 | 9 | 10 | 11 | 12 | 13 | 14 | 15 | 16 | 17 | 18 | 19 | 20 |
| # sample | 1 | 2 | 1 | 9 | 1 | 2 | 1 | 1 | 11 | 3 | 4 | 1 | 9 | 6 | 11 | |||||
| # mutation | 1 | 2 | 1 | 9 | 1 | 2 | 1 | 1 | 11 | 3 | 4 | 1 | 9 | 6 | 14 | |||||
| nonsynonymous SNV | 1 | 2 | 5 | 1 | 9 | 3 | 4 | 5 | 6 | |||||||||||
| synonymous SNV | 1 | 4 | 1 | 2 | 1 | 2 | 3 | 1 | 1 | 5 | 1 | 8 |
| cf) Tissue ID; Tissue type (1; BLCA[Bladder Urothelial Carcinoma], 2; BRCA[Breast invasive carcinoma], 3; CESC[Cervical squamous cell carcinoma and endocervical adenocarcinoma], 4; COAD[Colon adenocarcinoma], 5; GBM[Glioblastoma multiforme], 6; Glioma Low Grade, 7; HNSC[Head and Neck squamous cell carcinoma], 8; KICH[Kidney Chromophobe], 9; KIRC[Kidney renal clear cell carcinoma], 10; KIRP[Kidney renal papillary cell carcinoma], 11; LAML[Acute Myeloid Leukemia], 12; LUAD[Lung adenocarcinoma], 13; LUSC[Lung squamous cell carcinoma], 14; OV[Ovarian serous cystadenocarcinoma ], 15; PAAD[Pancreatic adenocarcinoma], 16; PRAD[Prostate adenocarcinoma], 17; SKCM[Skin Cutaneous Melanoma], 18:STAD[Stomach adenocarcinoma], 19:THCA[Thyroid carcinoma], 20:UCEC[Uterine Corpus Endometrial Carcinoma]) |
| Top |
| * We represented just top 10 SNVs. When you move the cursor on each content, you can see more deailed mutation information on the Tooltip. Those are primary_site, primary_histology, mutation(aa), pubmedID. |
| Genomic Position | Mutation(aa) | Unique sampleID count |
| chr5:1489938 | p.I142I | 2 |
| chr5:1474683 | p.F139F | 2 |
| chr5:1488543 | p.T210T | 2 |
| chr5:1463838 | p.N511N | 2 |
| chr5:1494882 | p.R339R | 2 |
| chr5:1494891 | p.R193Q | 2 |
| chr5:1489889 | p.R177R | 2 |
| chr5:1483565 | p.A47T | 1 |
| chr5:1463930 | p.R461L | 1 |
| chr5:1494950 | p.I257I | 1 |
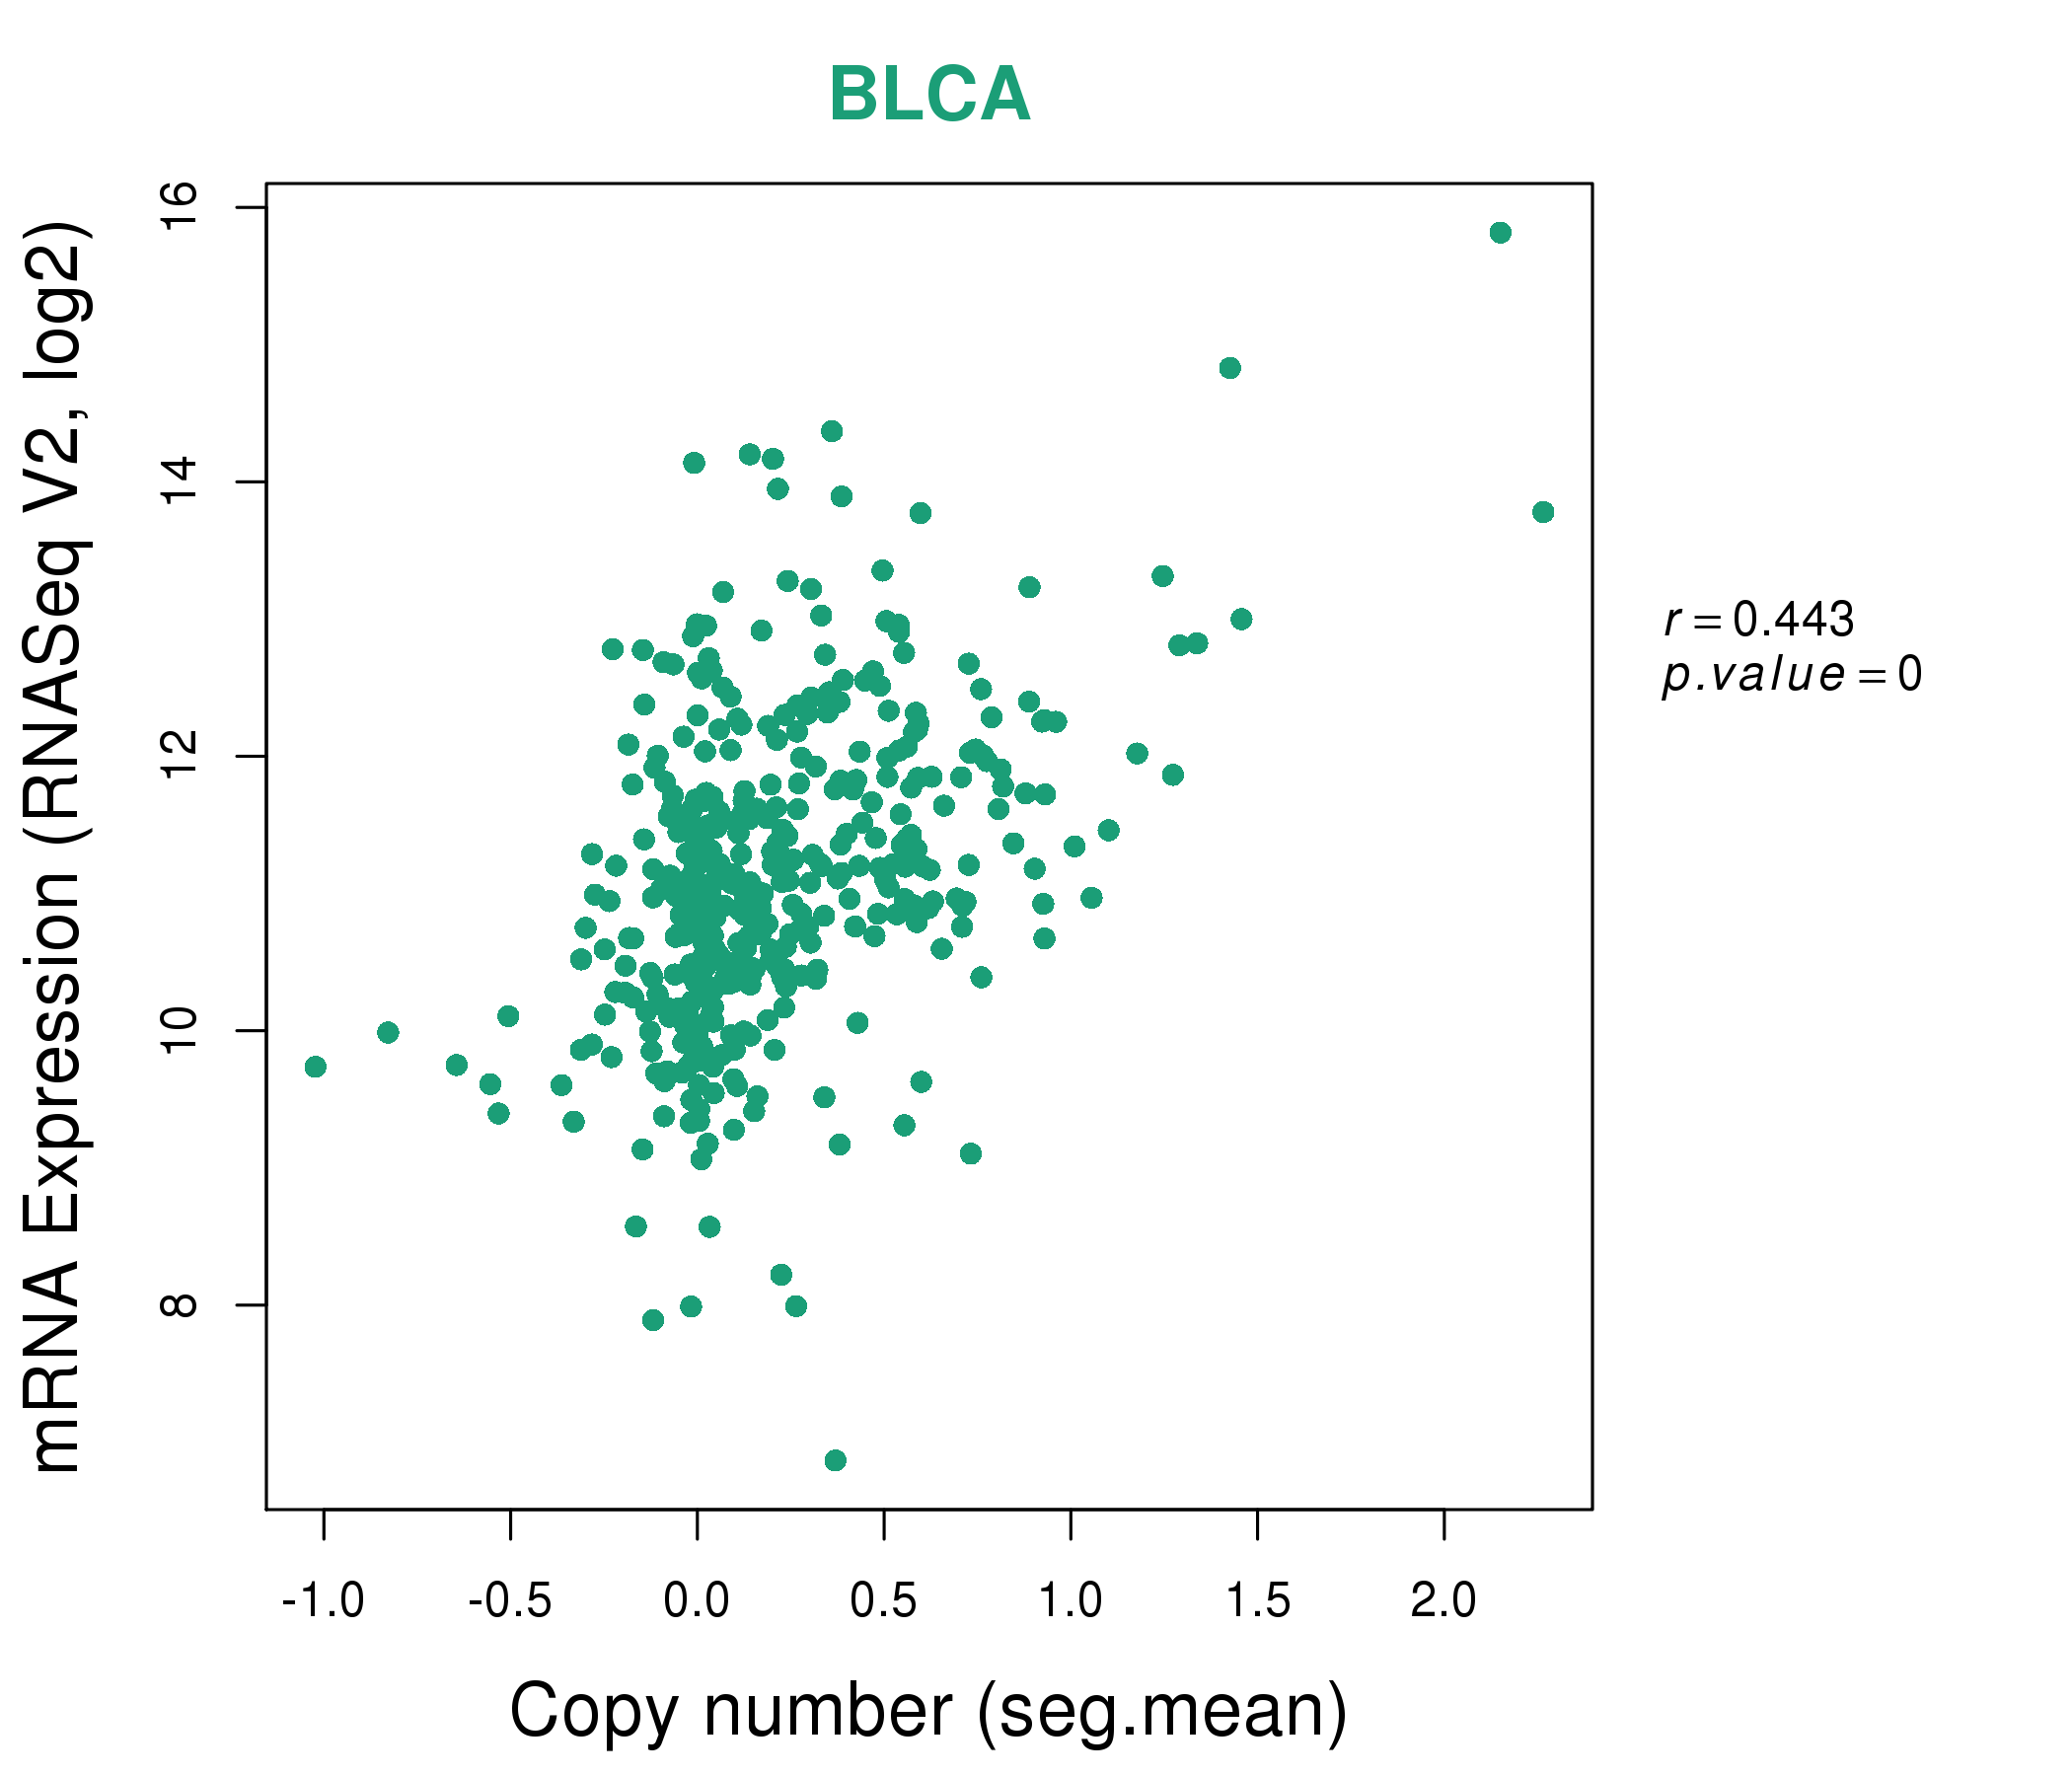
| * Copy number data were extracted from TCGA using R package TCGA-Assembler. The URLs of all public data files on TCGA DCC data server were gathered on Jan-05-2015. Function ProcessCNAData in TCGA-Assembler package was used to obtain gene-level copy number value which is calculated as the average copy number of the genomic region of a gene. |
 |
| cf) Tissue ID[Tissue type]: BLCA[Bladder Urothelial Carcinoma], BRCA[Breast invasive carcinoma], CESC[Cervical squamous cell carcinoma and endocervical adenocarcinoma], COAD[Colon adenocarcinoma], GBM[Glioblastoma multiforme], Glioma Low Grade, HNSC[Head and Neck squamous cell carcinoma], KICH[Kidney Chromophobe], KIRC[Kidney renal clear cell carcinoma], KIRP[Kidney renal papillary cell carcinoma], LAML[Acute Myeloid Leukemia], LUAD[Lung adenocarcinoma], LUSC[Lung squamous cell carcinoma], OV[Ovarian serous cystadenocarcinoma ], PAAD[Pancreatic adenocarcinoma], PRAD[Prostate adenocarcinoma], SKCM[Skin Cutaneous Melanoma], STAD[Stomach adenocarcinoma], THCA[Thyroid carcinoma], UCEC[Uterine Corpus Endometrial Carcinoma] |
| Top |
| Gene Expression for LPCAT1 |
| * CCLE gene expression data were extracted from CCLE_Expression_Entrez_2012-10-18.res: Gene-centric RMA-normalized mRNA expression data. |
 |
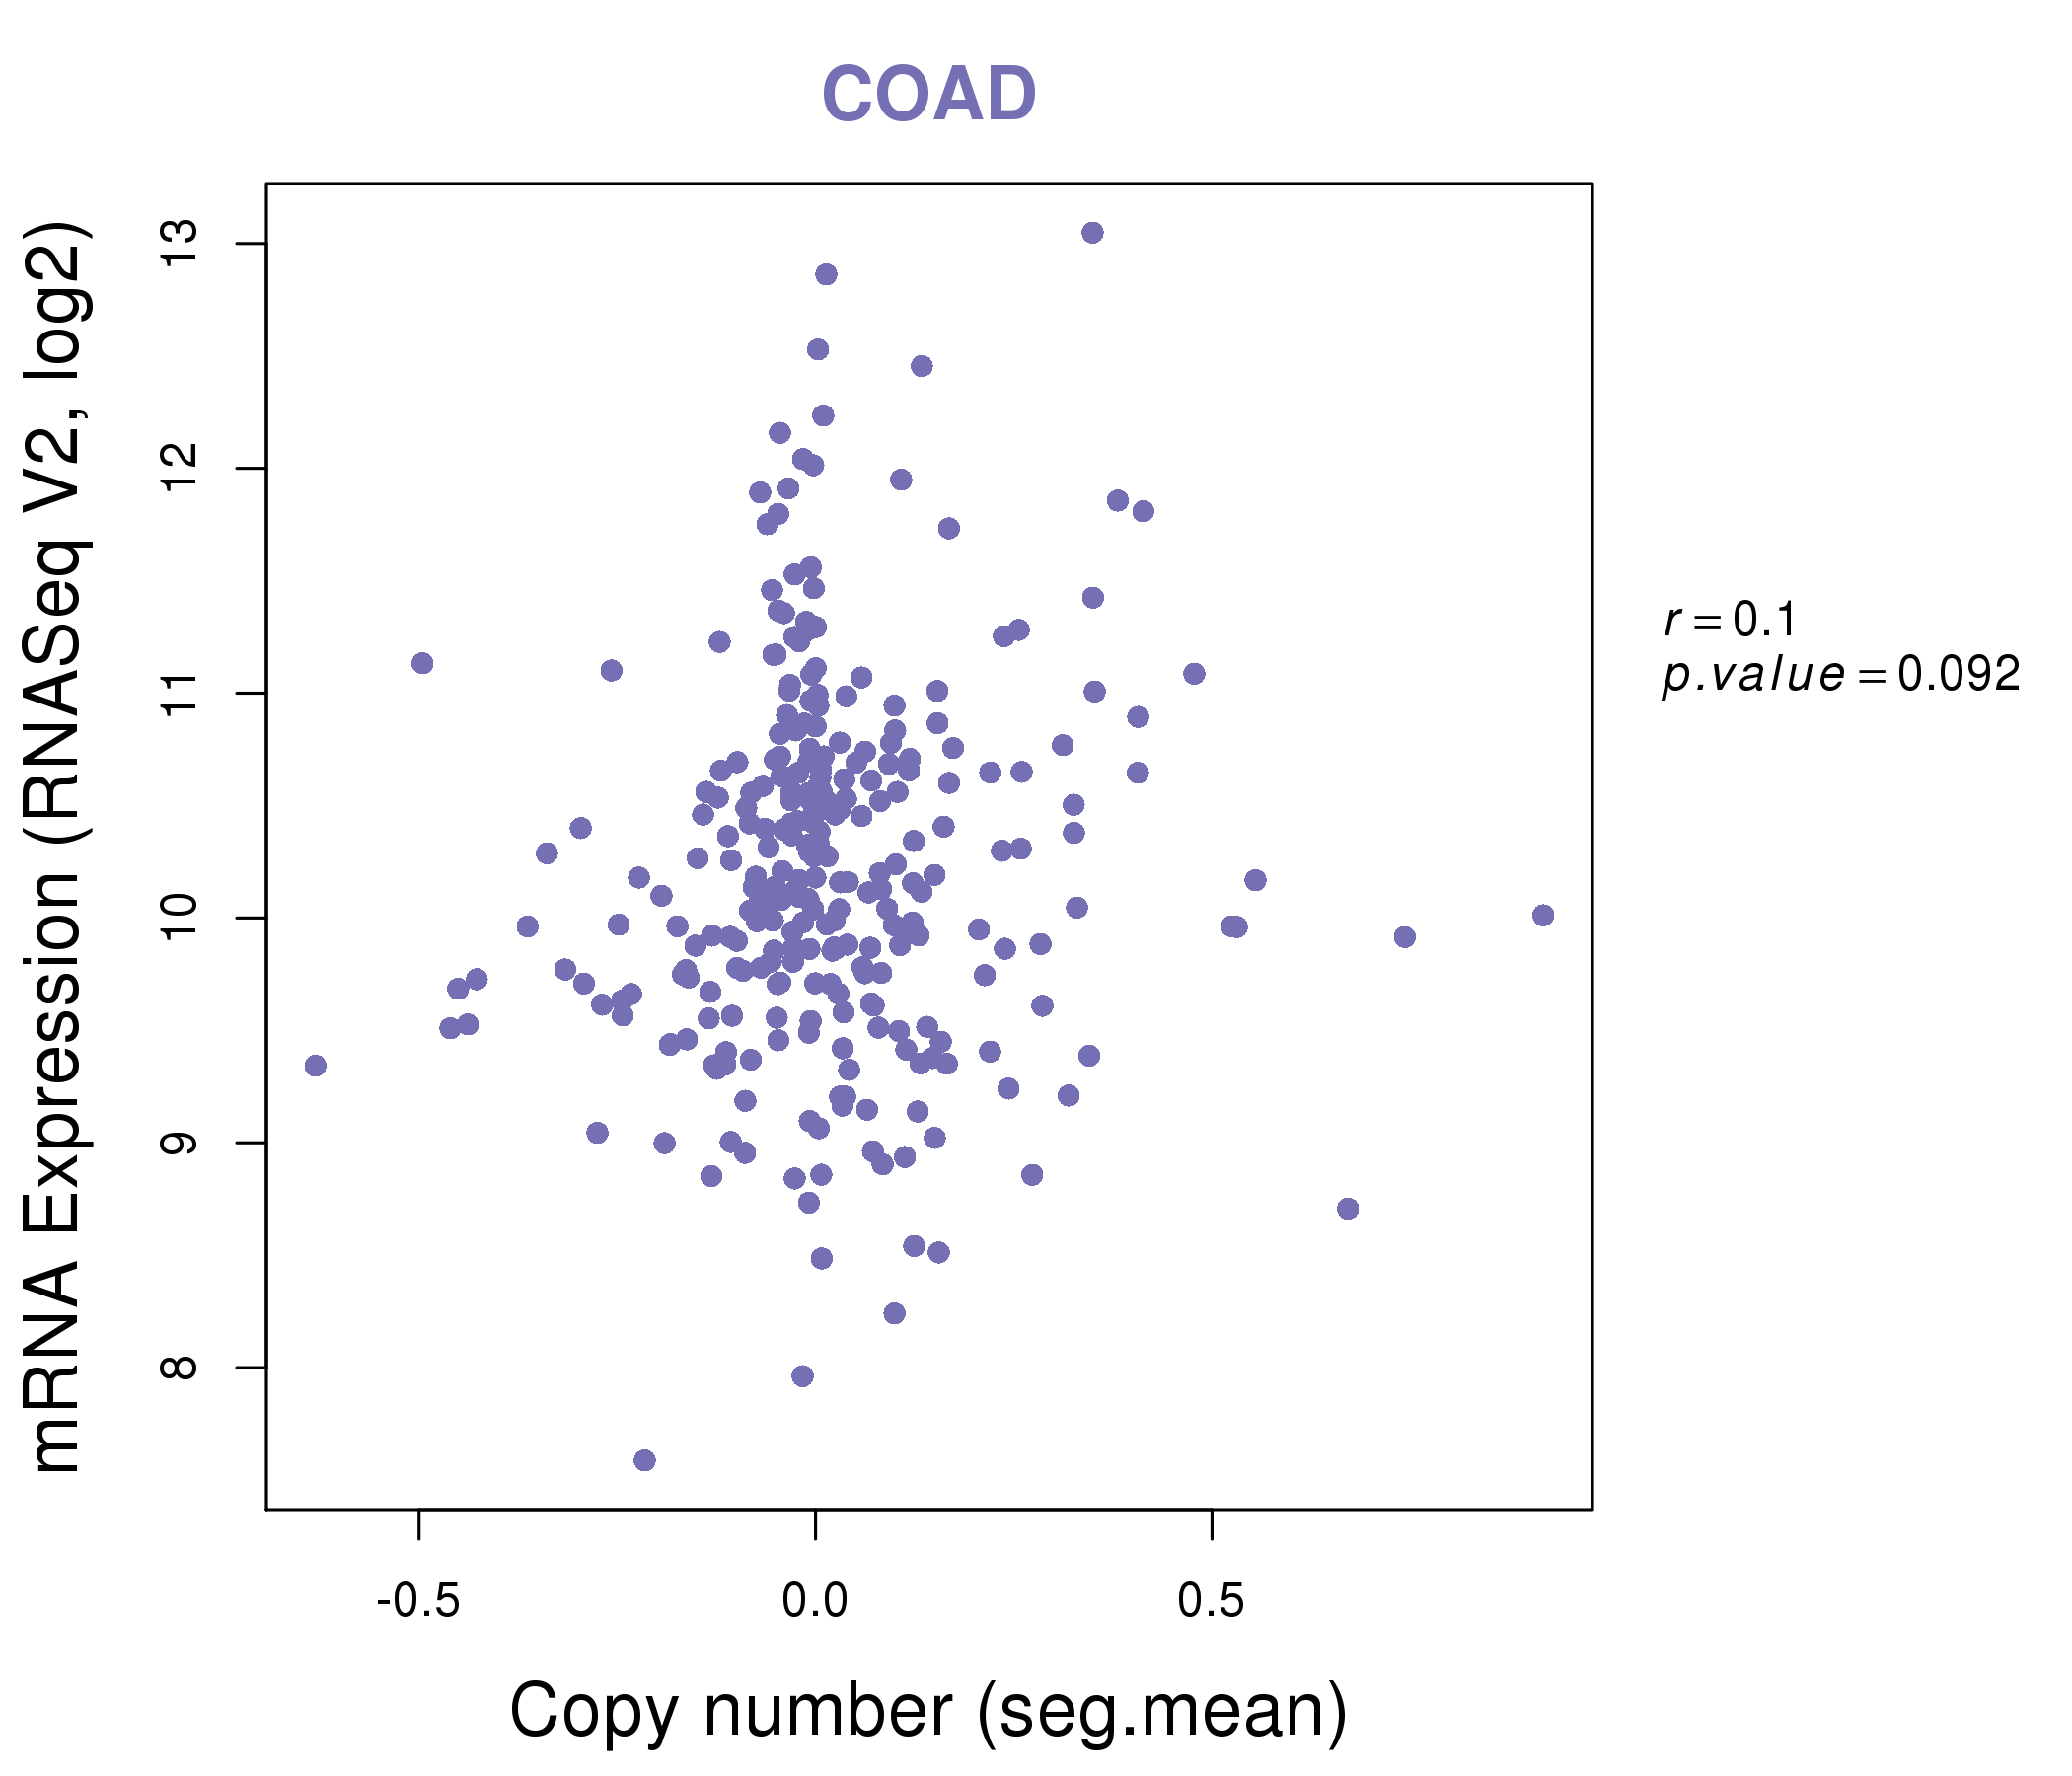
| * Normalized gene expression data of RNASeqV2 was extracted from TCGA using R package TCGA-Assembler. The URLs of all public data files on TCGA DCC data server were gathered at Jan-05-2015. Only eight cancer types have enough normal control samples for differential expression analysis. (t test, adjusted p<0.05 (using Benjamini-Hochberg FDR)) |
 |
| Top |
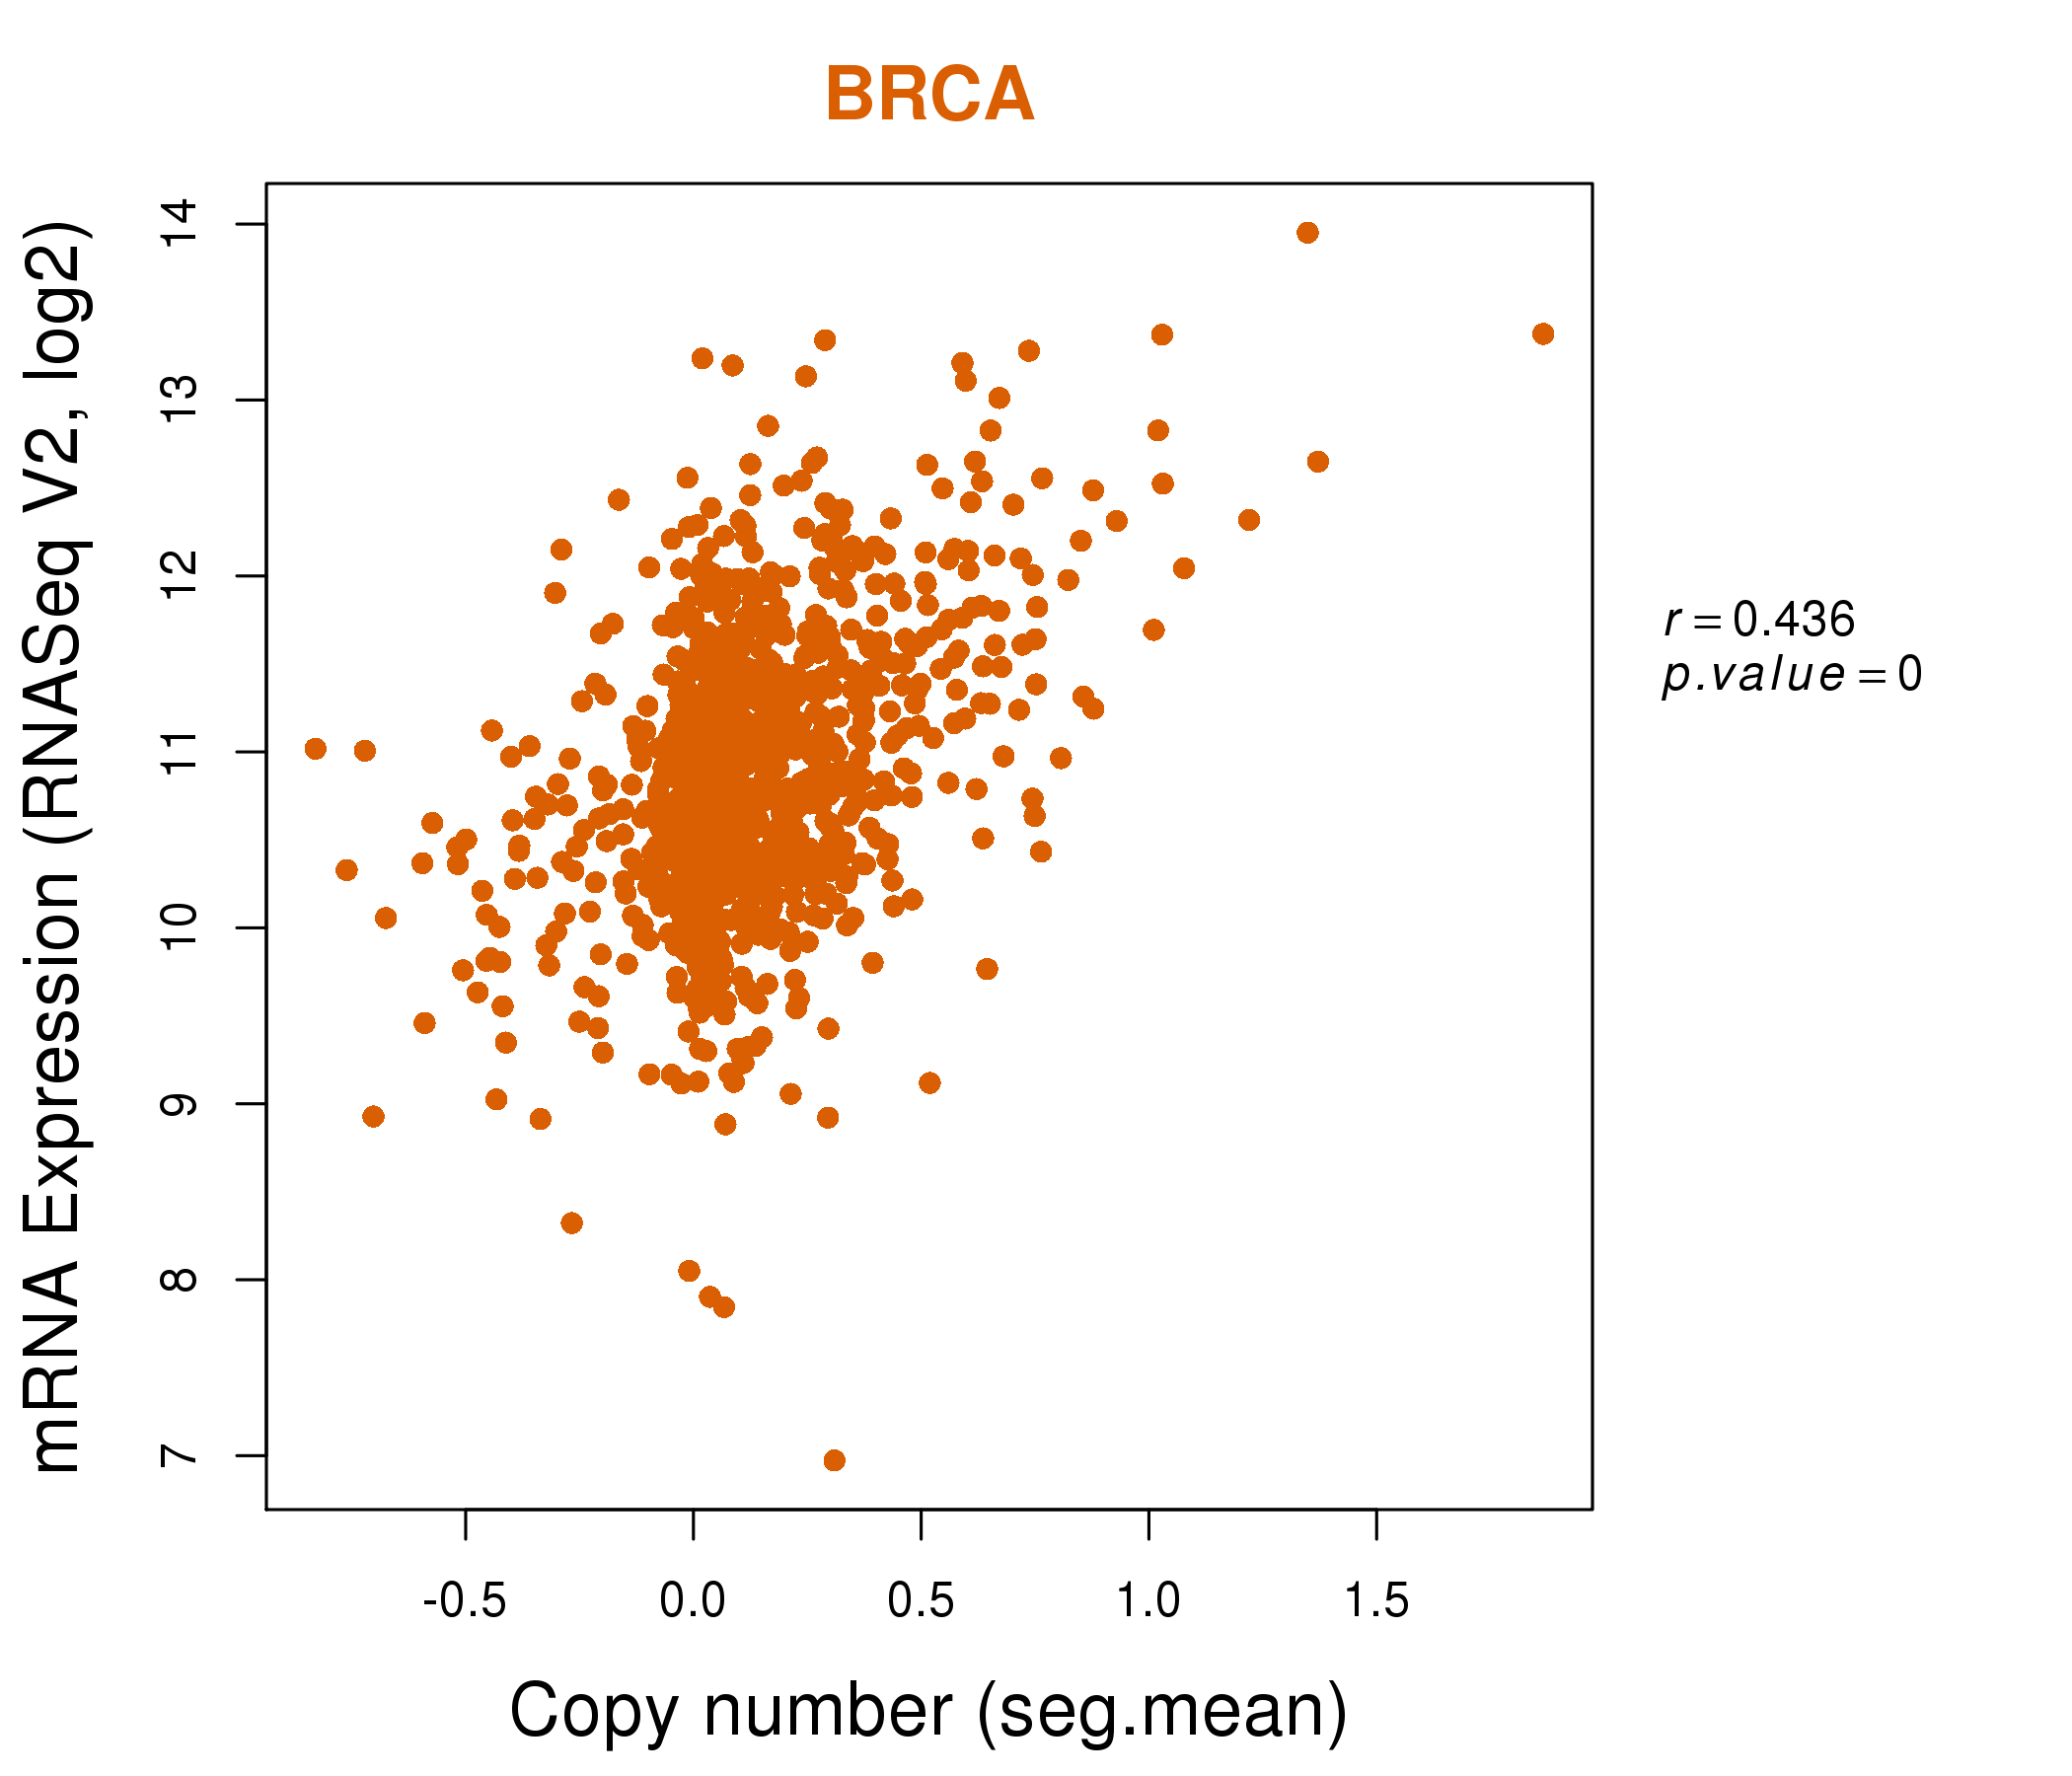
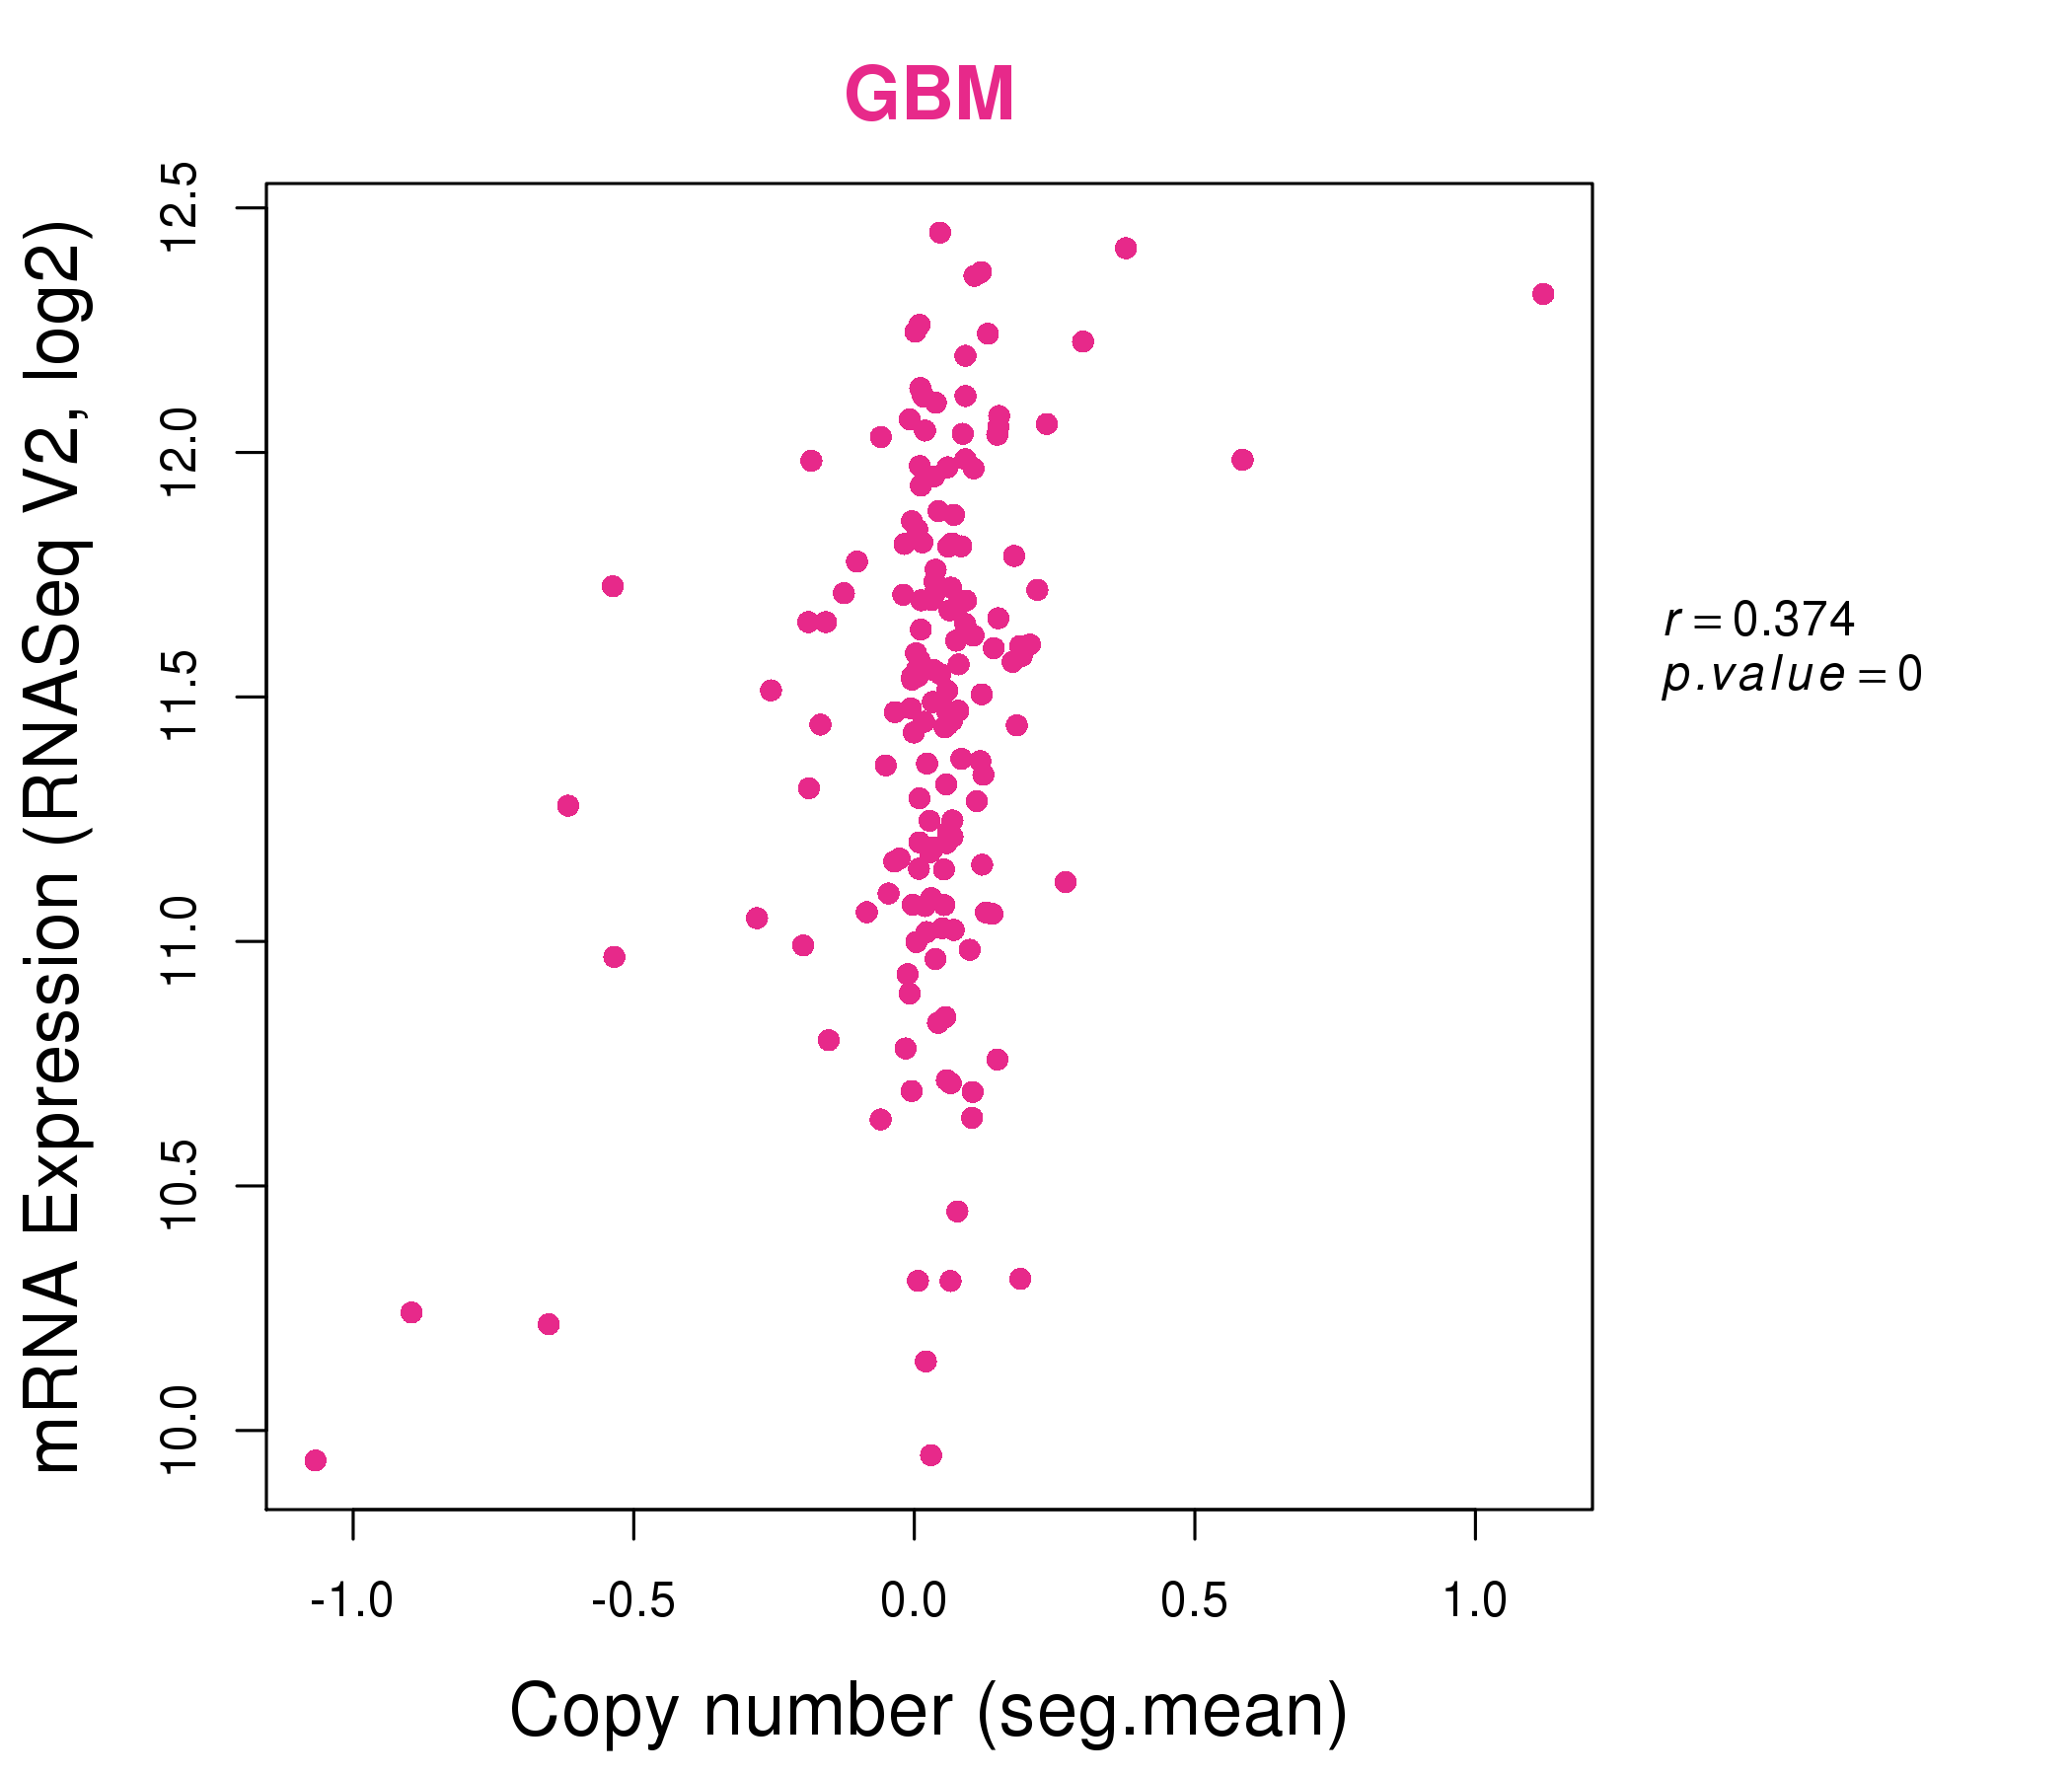
| * This plots show the correlation between CNV and gene expression. |
: Open all plots for all cancer types
 |
|
 |
|
| Top |
| Gene-Gene Network Information |
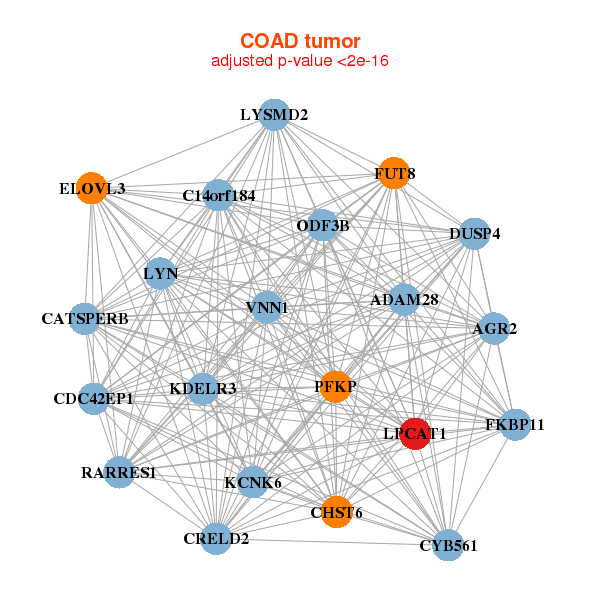
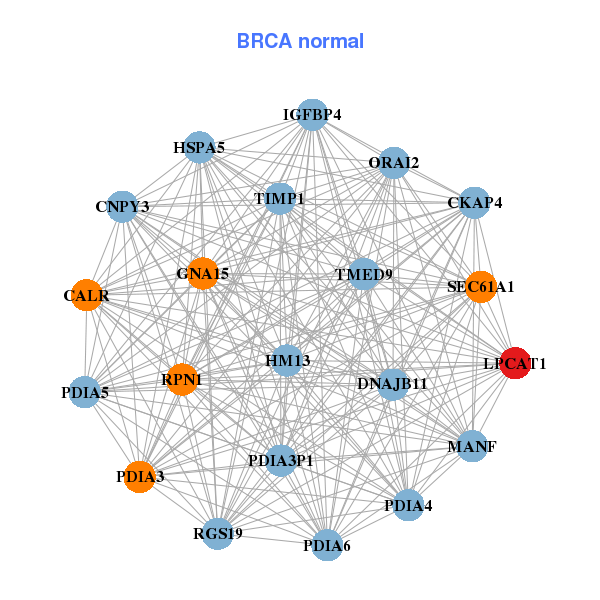
| * Co-Expression network figures were drawn using R package igraph. Only the top 20 genes with the highest correlations were shown. Red circle: input gene, orange circle: cell metabolism gene, sky circle: other gene |
: Open all plots for all cancer types
 |
|
| BRD9,CCDC127,CCT5,CEP72,CLPTM1L,DAP,EXOC3, LOC25845,LPCAT1,MED10,MRPL36,MYBL2,NDUFS6,NSUN2, PAPD7,PDCD6,PDIA4,POLR2D,SDHA,SLC12A7,TRIP13 | CALR,CKAP4,CNPY3,DNAJB11,GNA15,HM13,HSPA5, IGFBP4,LPCAT1,MANF,ORAI2,PDIA3,PDIA3P1,PDIA4, PDIA5,PDIA6,RGS19,RPN1,SEC61A1,TIMP1,TMED9 |
 |
|
| ADAM28,AGR2,C14orf184,CATSPERB,CDC42EP1,CHST6,CRELD2, CYB561,DUSP4,ELOVL3,FKBP11,FUT8,KCNK6,KDELR3, LPCAT1,LYN,LYSMD2,ODF3B,PFKP,RARRES1,VNN1 | ATP10D,C1orf162,C1S,C2CD4A,CDH3,FAM167B,HAMP, IFI16,LILRA6,LPCAT1,NRROS,MAPK11,MYO3B,RAMP3, RILPL2,SLC43A3,SLFN11,ST3GAL5,TMEM106A,TNFAIP2,UPP2 |
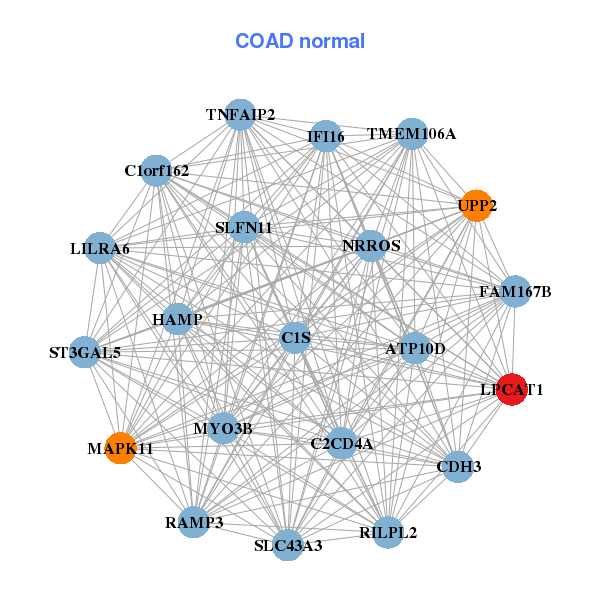
| * Co-Expression network figures were drawn using R package igraph. Only the top 20 genes with the highest correlations were shown. Red circle: input gene, orange circle: cell metabolism gene, sky circle: other gene |
: Open all plots for all cancer types
| Top |
: Open all interacting genes' information including KEGG pathway for all interacting genes from DAVID
| Top |
| Pharmacological Information for LPCAT1 |
| There's no related Drug. |
| Top |
| Cross referenced IDs for LPCAT1 |
| * We obtained these cross-references from Uniprot database. It covers 150 different DBs, 18 categories. http://www.uniprot.org/help/cross_references_section |
: Open all cross reference information
|
Copyright © 2016-Present - The Univsersity of Texas Health Science Center at Houston @ |