|
||||||||||||||||||||||||||||||||||||||||||||||||||||||||||||||||||||||||||||||||||||||||||||||||||||||||||||||||||||||||||||||||||||||||||||||||||||||||||||||||||||||||||||||||||||||||||||||||||||||||||||||||||||||||||||||||||||||||||||||||||||||||||||||||||||||||||||||||||||||||||||||||||||||||||||||||||||||||||
| |
| Phenotypic Information (metabolism pathway, cancer, disease, phenome) |
| |
| |
| Gene-Gene Network Information: Co-Expression Network, Interacting Genes & KEGG |
| |
|


| Gene Summary for NUP85 |
| Top |
| Phenotypic Information for NUP85(metabolism pathway, cancer, disease, phenome) |
| Cancer | CGAP: NUP85 |
| Familial Cancer Database: NUP85 | |
| * This gene is included in those cancer gene databases. |
|
|
|
|
|
| . | ||||||||||||||||||||||||||||||||||||||||||||||||||||||||||||||||||||||||||||||||||||||||||||||||||||||||||||||||||||||||||||||||||||||||||||||||||||||||||||||||||||||||||||||||||||||||||||||||||||||||||||||||||||||||||||||||||||||||||||||||||||||||||||||||||||||||||||||||||||||||||||||||||||||||||||||||||||
Oncogene 1 | Significant driver gene in | |||||||||||||||||||||||||||||||||||||||||||||||||||||||||||||||||||||||||||||||||||||||||||||||||||||||||||||||||||||||||||||||||||||||||||||||||||||||||||||||||||||||||||||||||||||||||||||||||||||||||||||||||||||||||||||||||||||||||||||||||||||||||||||||||||||||||||||||||||||||||||||||||||||||||||||||||||||||||
| cf) number; DB name 1 Oncogene; http://nar.oxfordjournals.org/content/35/suppl_1/D721.long, 2 Tumor Suppressor gene; https://bioinfo.uth.edu/TSGene/, 3 Cancer Gene Census; http://www.nature.com/nrc/journal/v4/n3/abs/nrc1299.html, 4 CancerGenes; http://nar.oxfordjournals.org/content/35/suppl_1/D721.long, 5 Network of Cancer Gene; http://ncg.kcl.ac.uk/index.php, 1Therapeutic Vulnerabilities in Cancer; http://cbio.mskcc.org/cancergenomics/statius/ |
| REACTOME_METABOLISM_OF_NON_CODING_RNA REACTOME_METABOLISM_OF_RNA REACTOME_METABOLISM_OF_CARBOHYDRATES | |
| OMIM | |
| Orphanet | |
| Disease | KEGG Disease: NUP85 |
| MedGen: NUP85 (Human Medical Genetics with Condition) | |
| ClinVar: NUP85 | |
| Phenotype | MGI: NUP85 (International Mouse Phenotyping Consortium) |
| PhenomicDB: NUP85 | |
| Mutations for NUP85 |
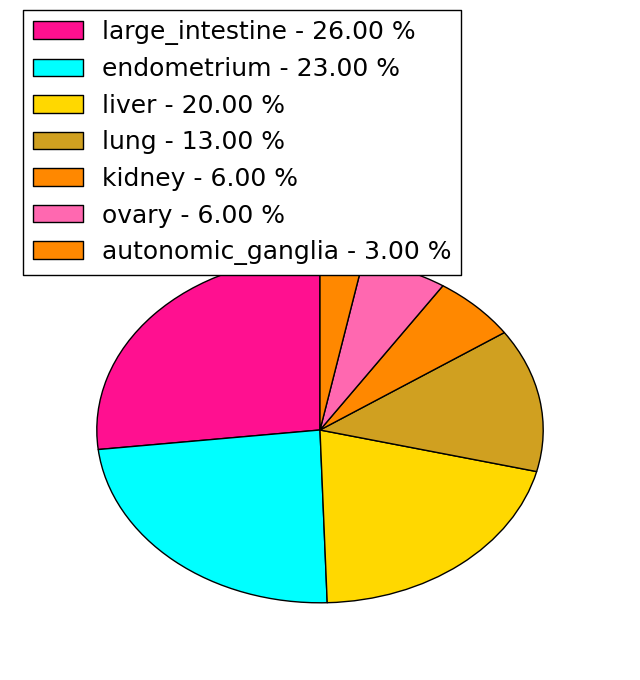
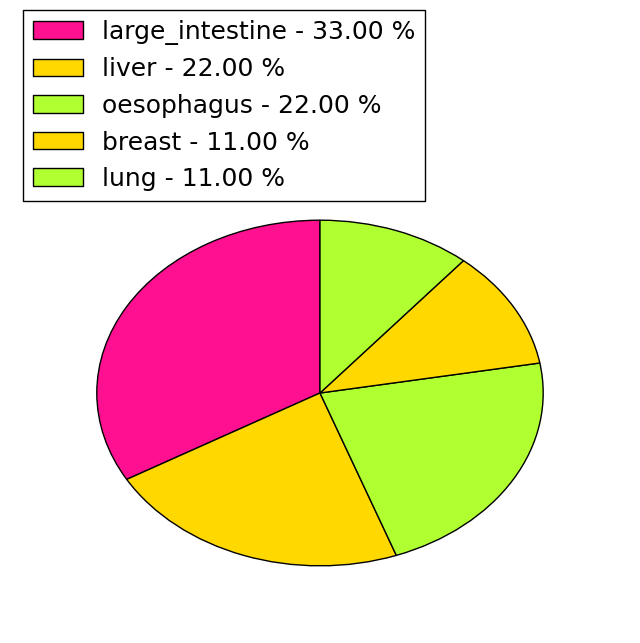
| * Under tables are showing count per each tissue to give us broad intuition about tissue specific mutation patterns.You can go to the detailed page for each mutation database's web site. |
| There's no structural variation information in COSMIC data for this gene. |
| * From mRNA Sanger sequences, Chitars2.0 arranged chimeric transcripts. This table shows NUP85 related fusion information. |
| ID | Head Gene | Tail Gene | Accession | Gene_a | qStart_a | qEnd_a | Chromosome_a | tStart_a | tEnd_a | Gene_a | qStart_a | qEnd_a | Chromosome_a | tStart_a | tEnd_a |
| DB001249 | WBP2 | 3 | 204 | 17 | 73847647 | 73851410 | NUP85 | 194 | 564 | 17 | 73211843 | 73221471 | |
| DA567594 | ZNF77 | 1 | 418 | 19 | 2936522 | 2944945 | NUP85 | 417 | 535 | 17 | 73208085 | 73209216 | |
| CA313471 | NUP85 | 18 | 123 | 17 | 73231748 | 73231853 | NUP85 | 111 | 190 | 17 | 73231707 | 73231786 | |
| CB243613 | NUP85 | 18 | 123 | 17 | 73231748 | 73231853 | NUP85 | 111 | 190 | 17 | 73231707 | 73231786 | |
| AA593414 | NUP85 | 1 | 235 | 17 | 73227200 | 73227434 | NUP85 | 226 | 349 | 17 | 73229033 | 73229156 | |
| Top |
| Mutation type/ Tissue ID | brca | cns | cerv | endome | haematopo | kidn | Lintest | liver | lung | ns | ovary | pancre | prost | skin | stoma | thyro | urina | |||
| Total # sample | 1 | |||||||||||||||||||
| GAIN (# sample) | 1 | |||||||||||||||||||
| LOSS (# sample) |
| cf) Tissue ID; Tissue type (1; Breast, 2; Central_nervous_system, 3; Cervix, 4; Endometrium, 5; Haematopoietic_and_lymphoid_tissue, 6; Kidney, 7; Large_intestine, 8; Liver, 9; Lung, 10; NS, 11; Ovary, 12; Pancreas, 13; Prostate, 14; Skin, 15; Stomach, 16; Thyroid, 17; Urinary_tract) |
| Top |
|
 |
| Top |
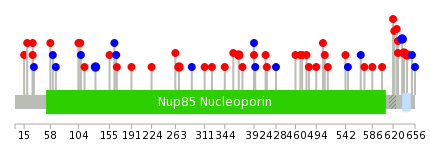
| Stat. for Non-Synonymous SNVs (# total SNVs=30) | (# total SNVs=9) |
 |  |
(# total SNVs=0) | (# total SNVs=0) |
| Top |
| * When you move the cursor on each content, you can see more deailed mutation information on the Tooltip. Those are primary_site,primary_histology,mutation(aa),pubmedID. |
| GRCh37 position | Mutation(aa) | Unique sampleID count |
| chr17:73231708-73231708 | p.L635L | 2 |
| chr17:73231715-73231715 | p.S638P | 2 |
| chr17:73222233-73222233 | p.Q359* | 2 |
| chr17:73231731-73231731 | p.L643H | 2 |
| chr17:73227439-73227439 | p.A367T | 2 |
| chr17:73221509-73221509 | p.L269I | 2 |
| chr17:73209205-73209205 | p.F132F | 2 |
| chr17:73221904-73221904 | p.D323N | 1 |
| chr17:73231686-73231686 | p.E628G | 1 |
| chr17:73204717-73204717 | p.? | 1 |
| Top |
|
 |
| Point Mutation/ Tissue ID | 1 | 2 | 3 | 4 | 5 | 6 | 7 | 8 | 9 | 10 | 11 | 12 | 13 | 14 | 15 | 16 | 17 | 18 | 19 | 20 |
| # sample | 6 | 9 | 2 | 1 | 5 | 1 | 2 | 7 | 7 | 6 | ||||||||||
| # mutation | 6 | 7 | 2 | 1 | 5 | 2 | 2 | 7 | 7 | 7 | ||||||||||
| nonsynonymous SNV | 4 | 5 | 1 | 1 | 4 | 1 | 2 | 4 | 6 | 7 | ||||||||||
| synonymous SNV | 2 | 2 | 1 | 1 | 1 | 3 | 1 |
| cf) Tissue ID; Tissue type (1; BLCA[Bladder Urothelial Carcinoma], 2; BRCA[Breast invasive carcinoma], 3; CESC[Cervical squamous cell carcinoma and endocervical adenocarcinoma], 4; COAD[Colon adenocarcinoma], 5; GBM[Glioblastoma multiforme], 6; Glioma Low Grade, 7; HNSC[Head and Neck squamous cell carcinoma], 8; KICH[Kidney Chromophobe], 9; KIRC[Kidney renal clear cell carcinoma], 10; KIRP[Kidney renal papillary cell carcinoma], 11; LAML[Acute Myeloid Leukemia], 12; LUAD[Lung adenocarcinoma], 13; LUSC[Lung squamous cell carcinoma], 14; OV[Ovarian serous cystadenocarcinoma ], 15; PAAD[Pancreatic adenocarcinoma], 16; PRAD[Prostate adenocarcinoma], 17; SKCM[Skin Cutaneous Melanoma], 18:STAD[Stomach adenocarcinoma], 19:THCA[Thyroid carcinoma], 20:UCEC[Uterine Corpus Endometrial Carcinoma]) |
| Top |
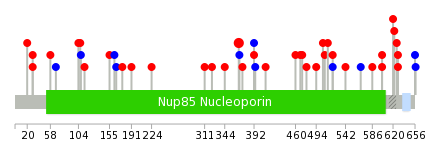
| * We represented just top 10 SNVs. When you move the cursor on each content, you can see more deailed mutation information on the Tooltip. Those are primary_site, primary_histology, mutation(aa), pubmedID. |
| Genomic Position | Mutation(aa) | Unique sampleID count |
| chr17:73227439 | p.A367T | 3 |
| chr17:73228951 | p.E114D | 1 |
| chr17:73208107 | p.F411L | 1 |
| chr17:73230872 | p.E620K | 1 |
| chr17:73221904 | p.E155D | 1 |
| chr17:73228962 | p.R460L | 1 |
| chr17:73208116 | p.L622F | 1 |
| chr17:73231231 | p.L163L | 1 |
| chr17:73222188 | p.S468G | 1 |
| chr17:73228981 | p.D626N | 1 |
| * Copy number data were extracted from TCGA using R package TCGA-Assembler. The URLs of all public data files on TCGA DCC data server were gathered on Jan-05-2015. Function ProcessCNAData in TCGA-Assembler package was used to obtain gene-level copy number value which is calculated as the average copy number of the genomic region of a gene. |
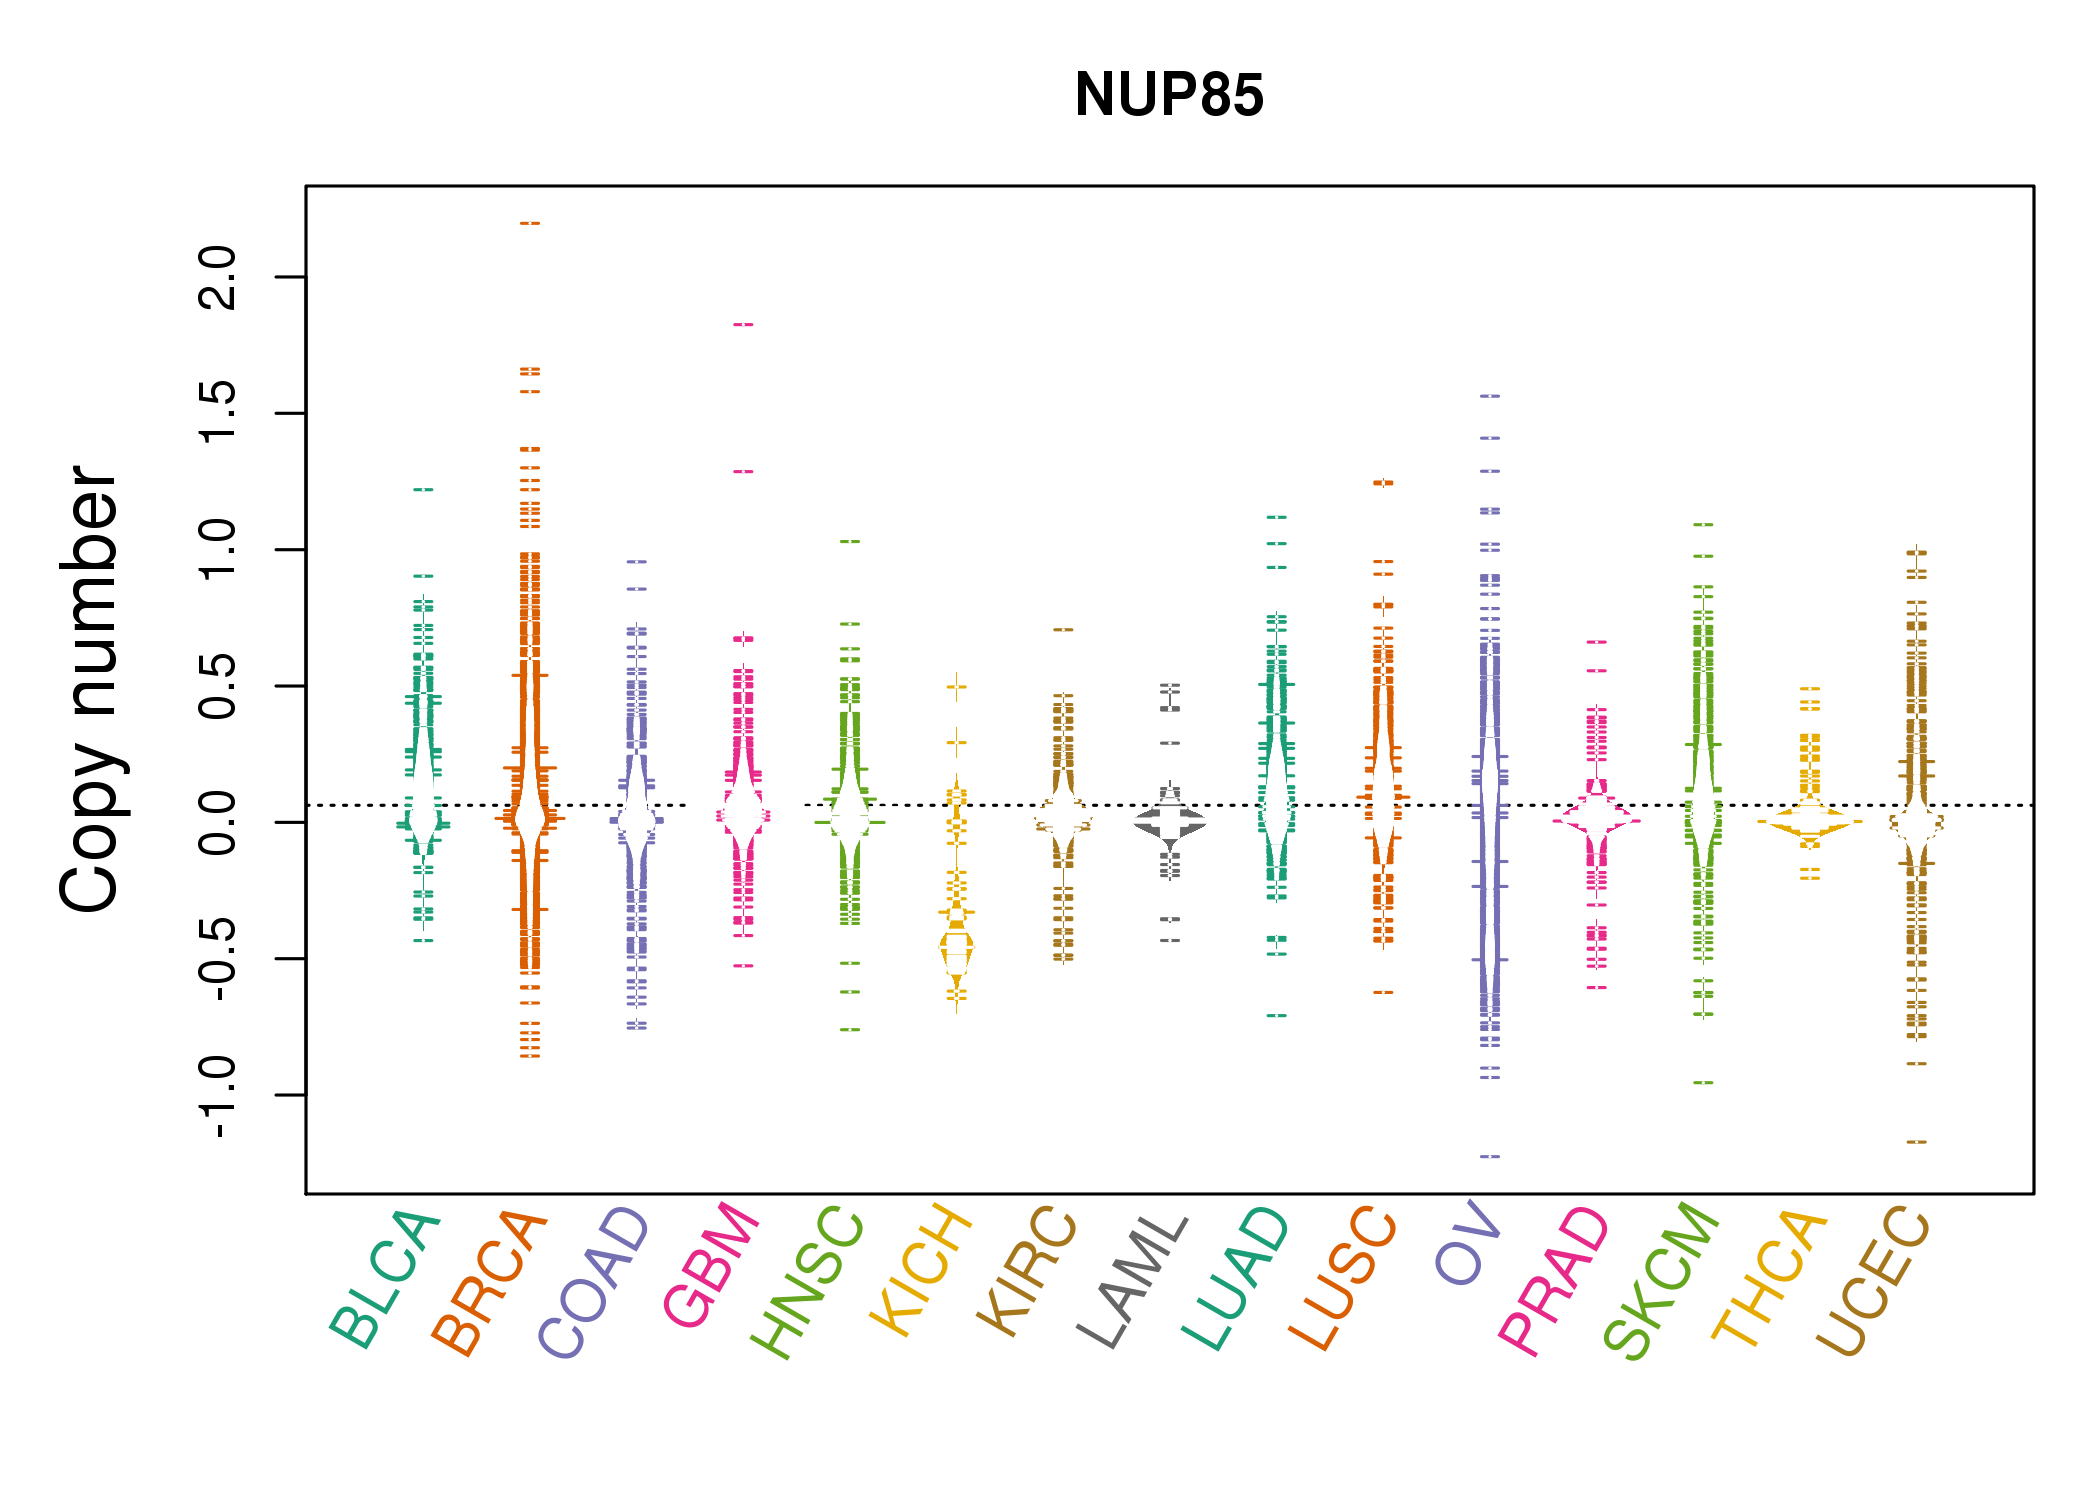 |
| cf) Tissue ID[Tissue type]: BLCA[Bladder Urothelial Carcinoma], BRCA[Breast invasive carcinoma], CESC[Cervical squamous cell carcinoma and endocervical adenocarcinoma], COAD[Colon adenocarcinoma], GBM[Glioblastoma multiforme], Glioma Low Grade, HNSC[Head and Neck squamous cell carcinoma], KICH[Kidney Chromophobe], KIRC[Kidney renal clear cell carcinoma], KIRP[Kidney renal papillary cell carcinoma], LAML[Acute Myeloid Leukemia], LUAD[Lung adenocarcinoma], LUSC[Lung squamous cell carcinoma], OV[Ovarian serous cystadenocarcinoma ], PAAD[Pancreatic adenocarcinoma], PRAD[Prostate adenocarcinoma], SKCM[Skin Cutaneous Melanoma], STAD[Stomach adenocarcinoma], THCA[Thyroid carcinoma], UCEC[Uterine Corpus Endometrial Carcinoma] |
| Top |
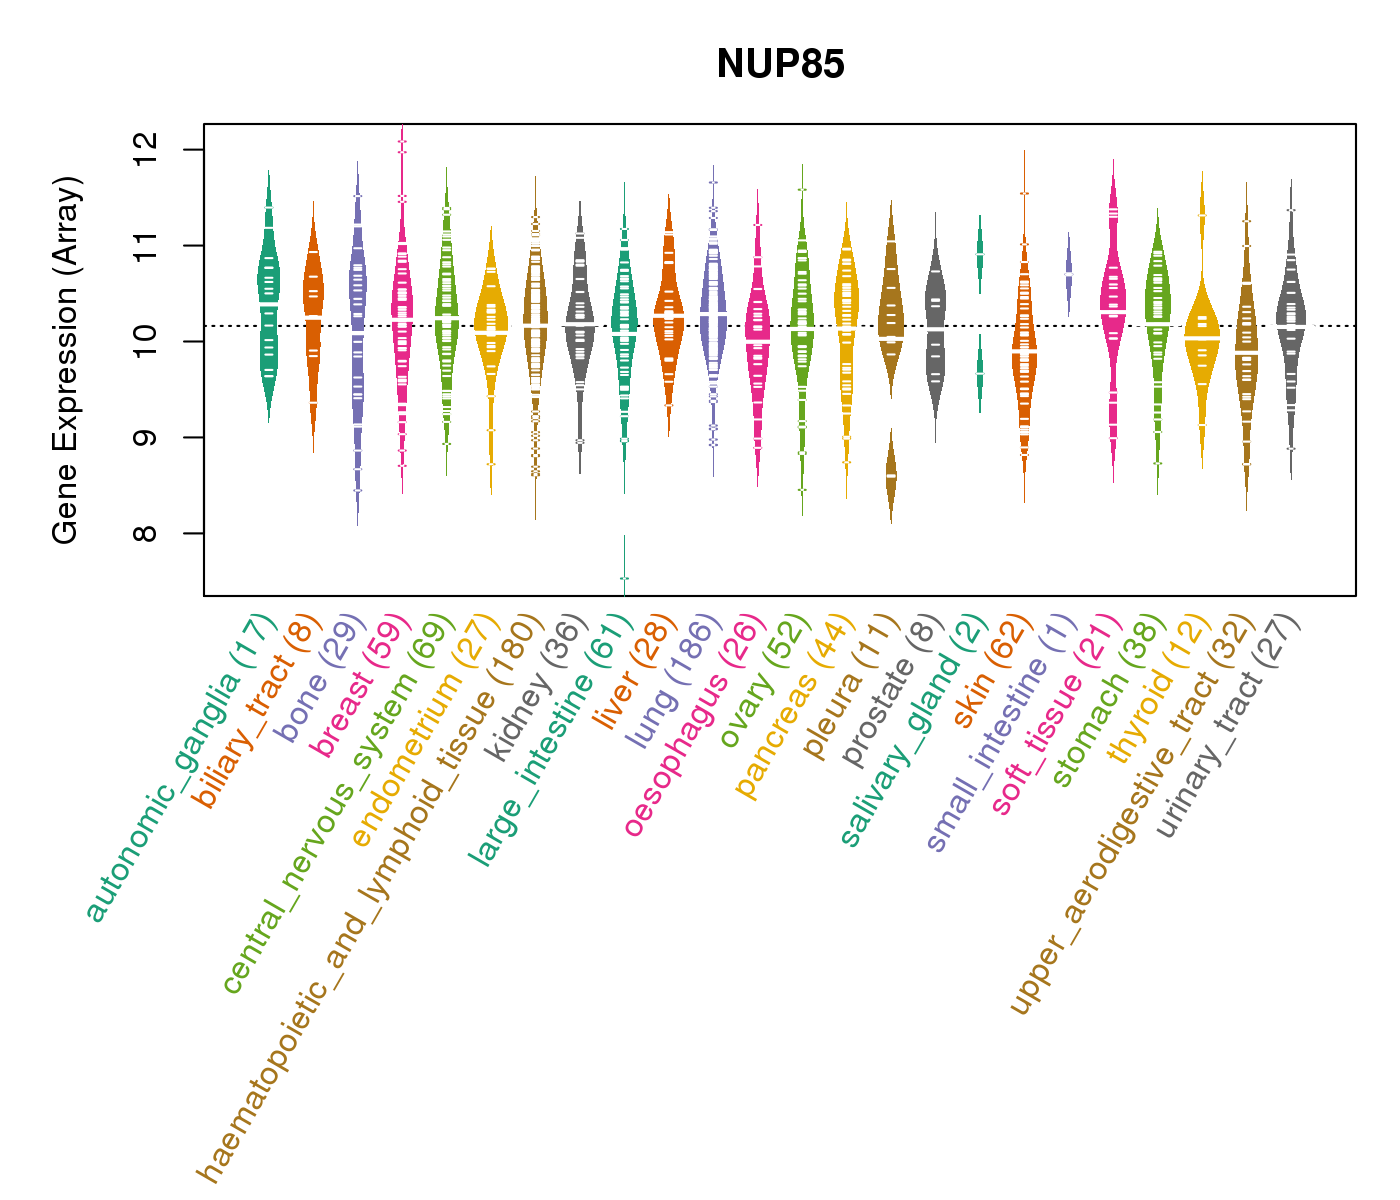
| Gene Expression for NUP85 |
| * CCLE gene expression data were extracted from CCLE_Expression_Entrez_2012-10-18.res: Gene-centric RMA-normalized mRNA expression data. |
 |
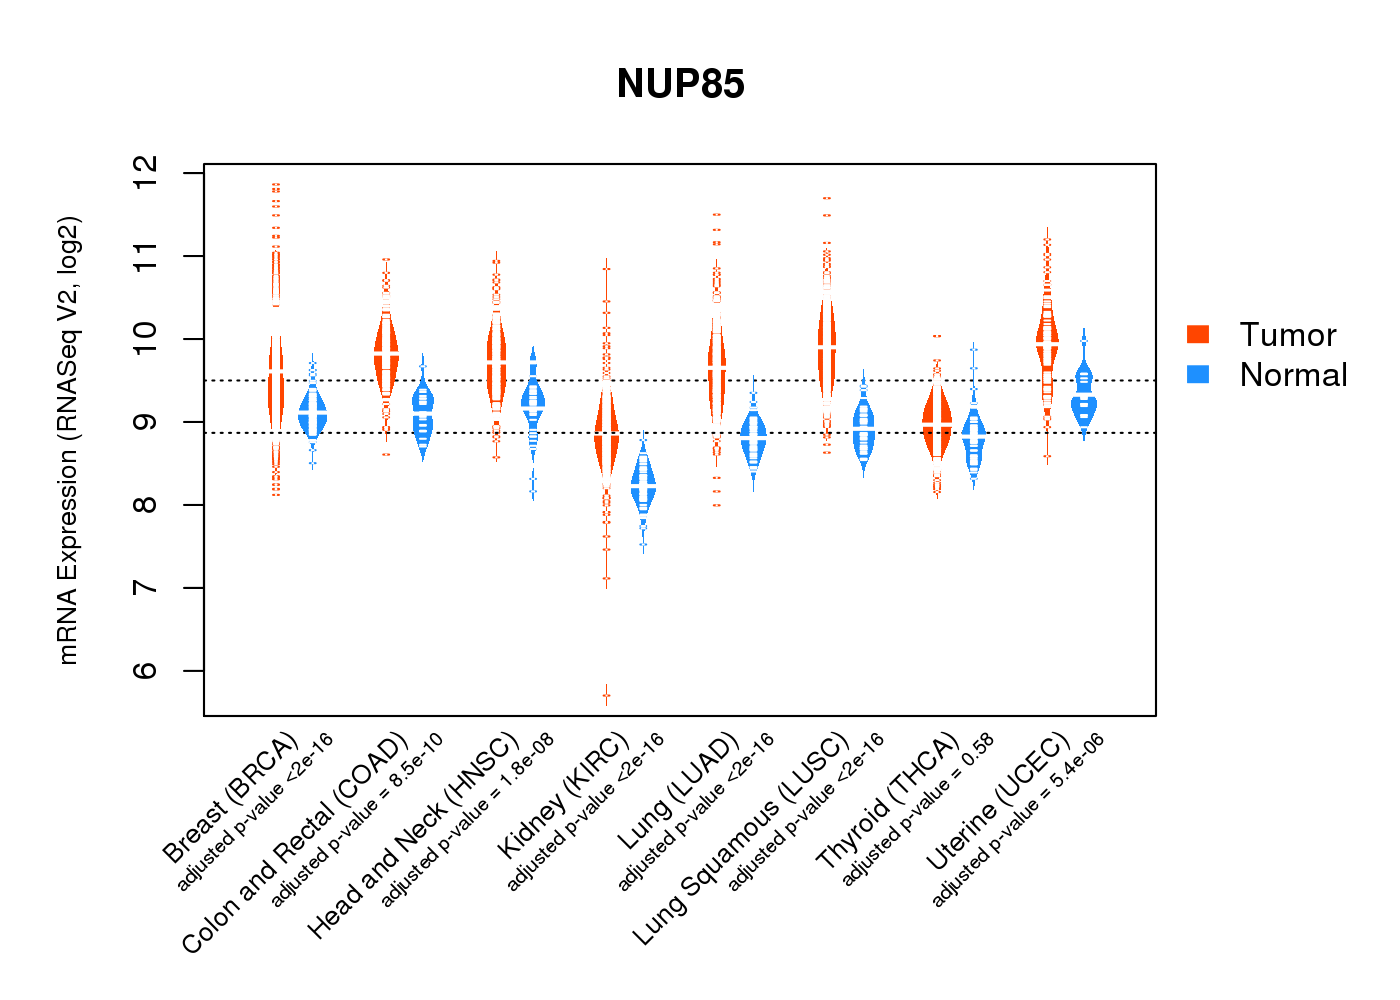
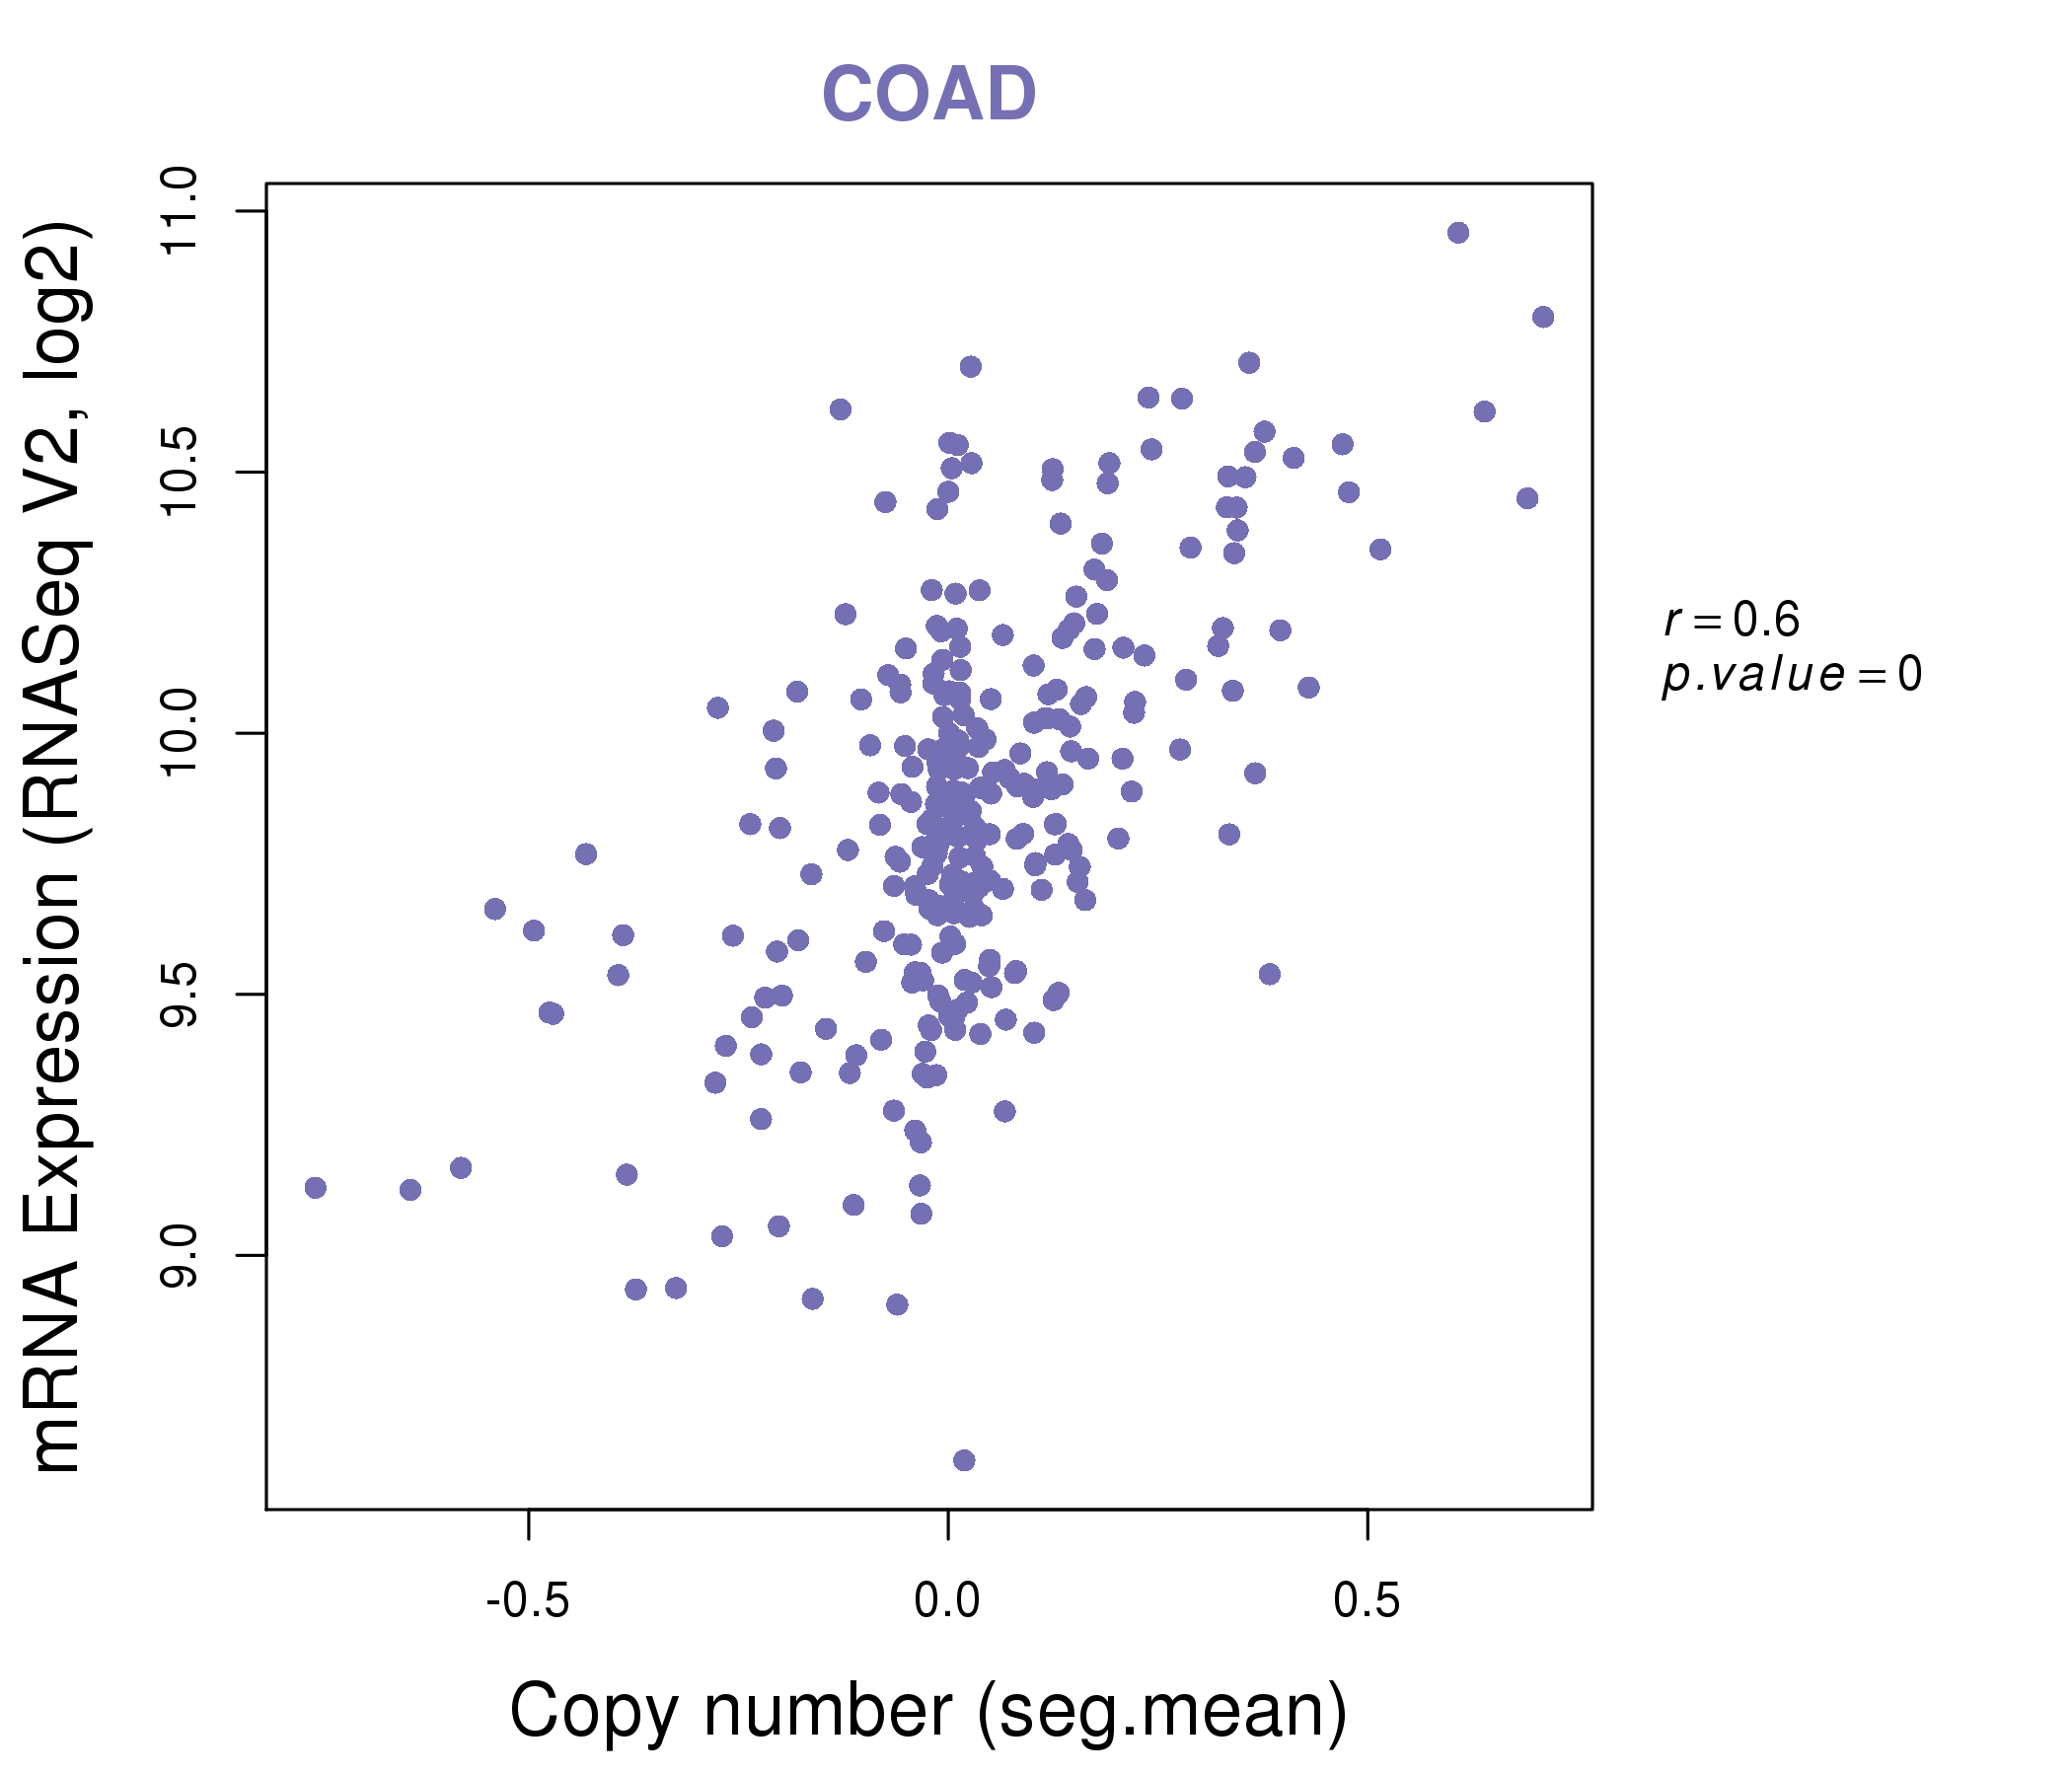
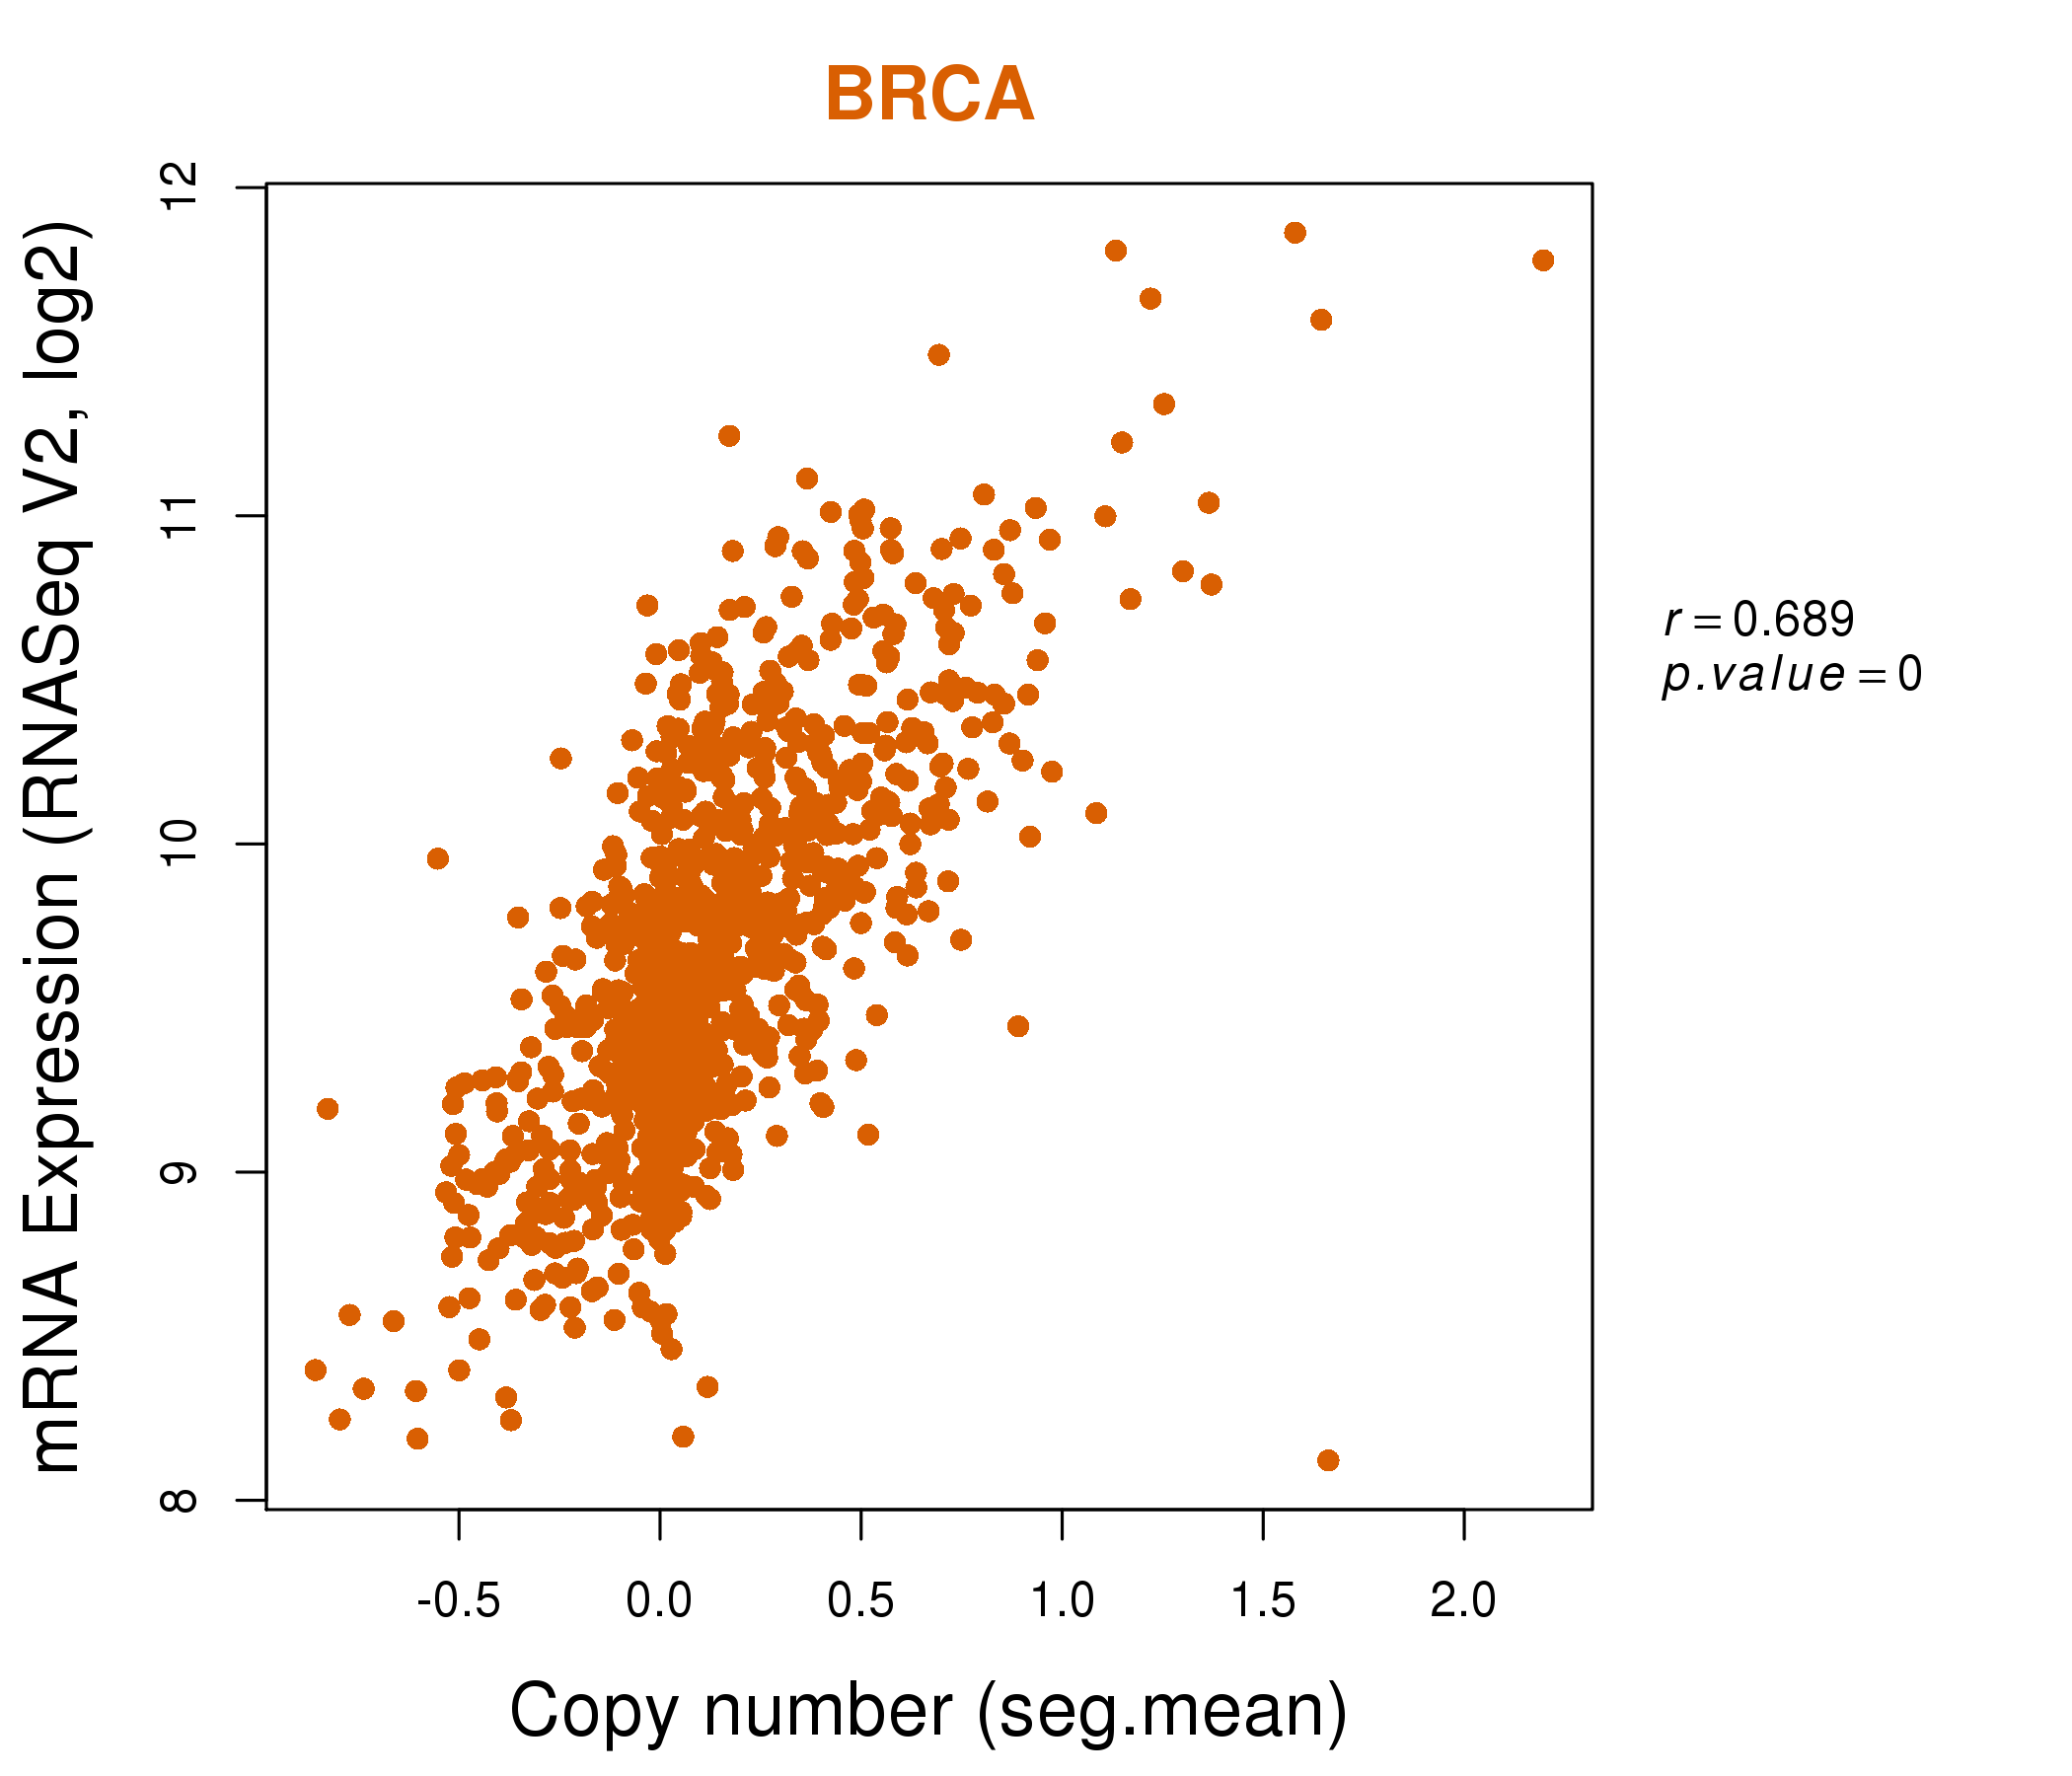
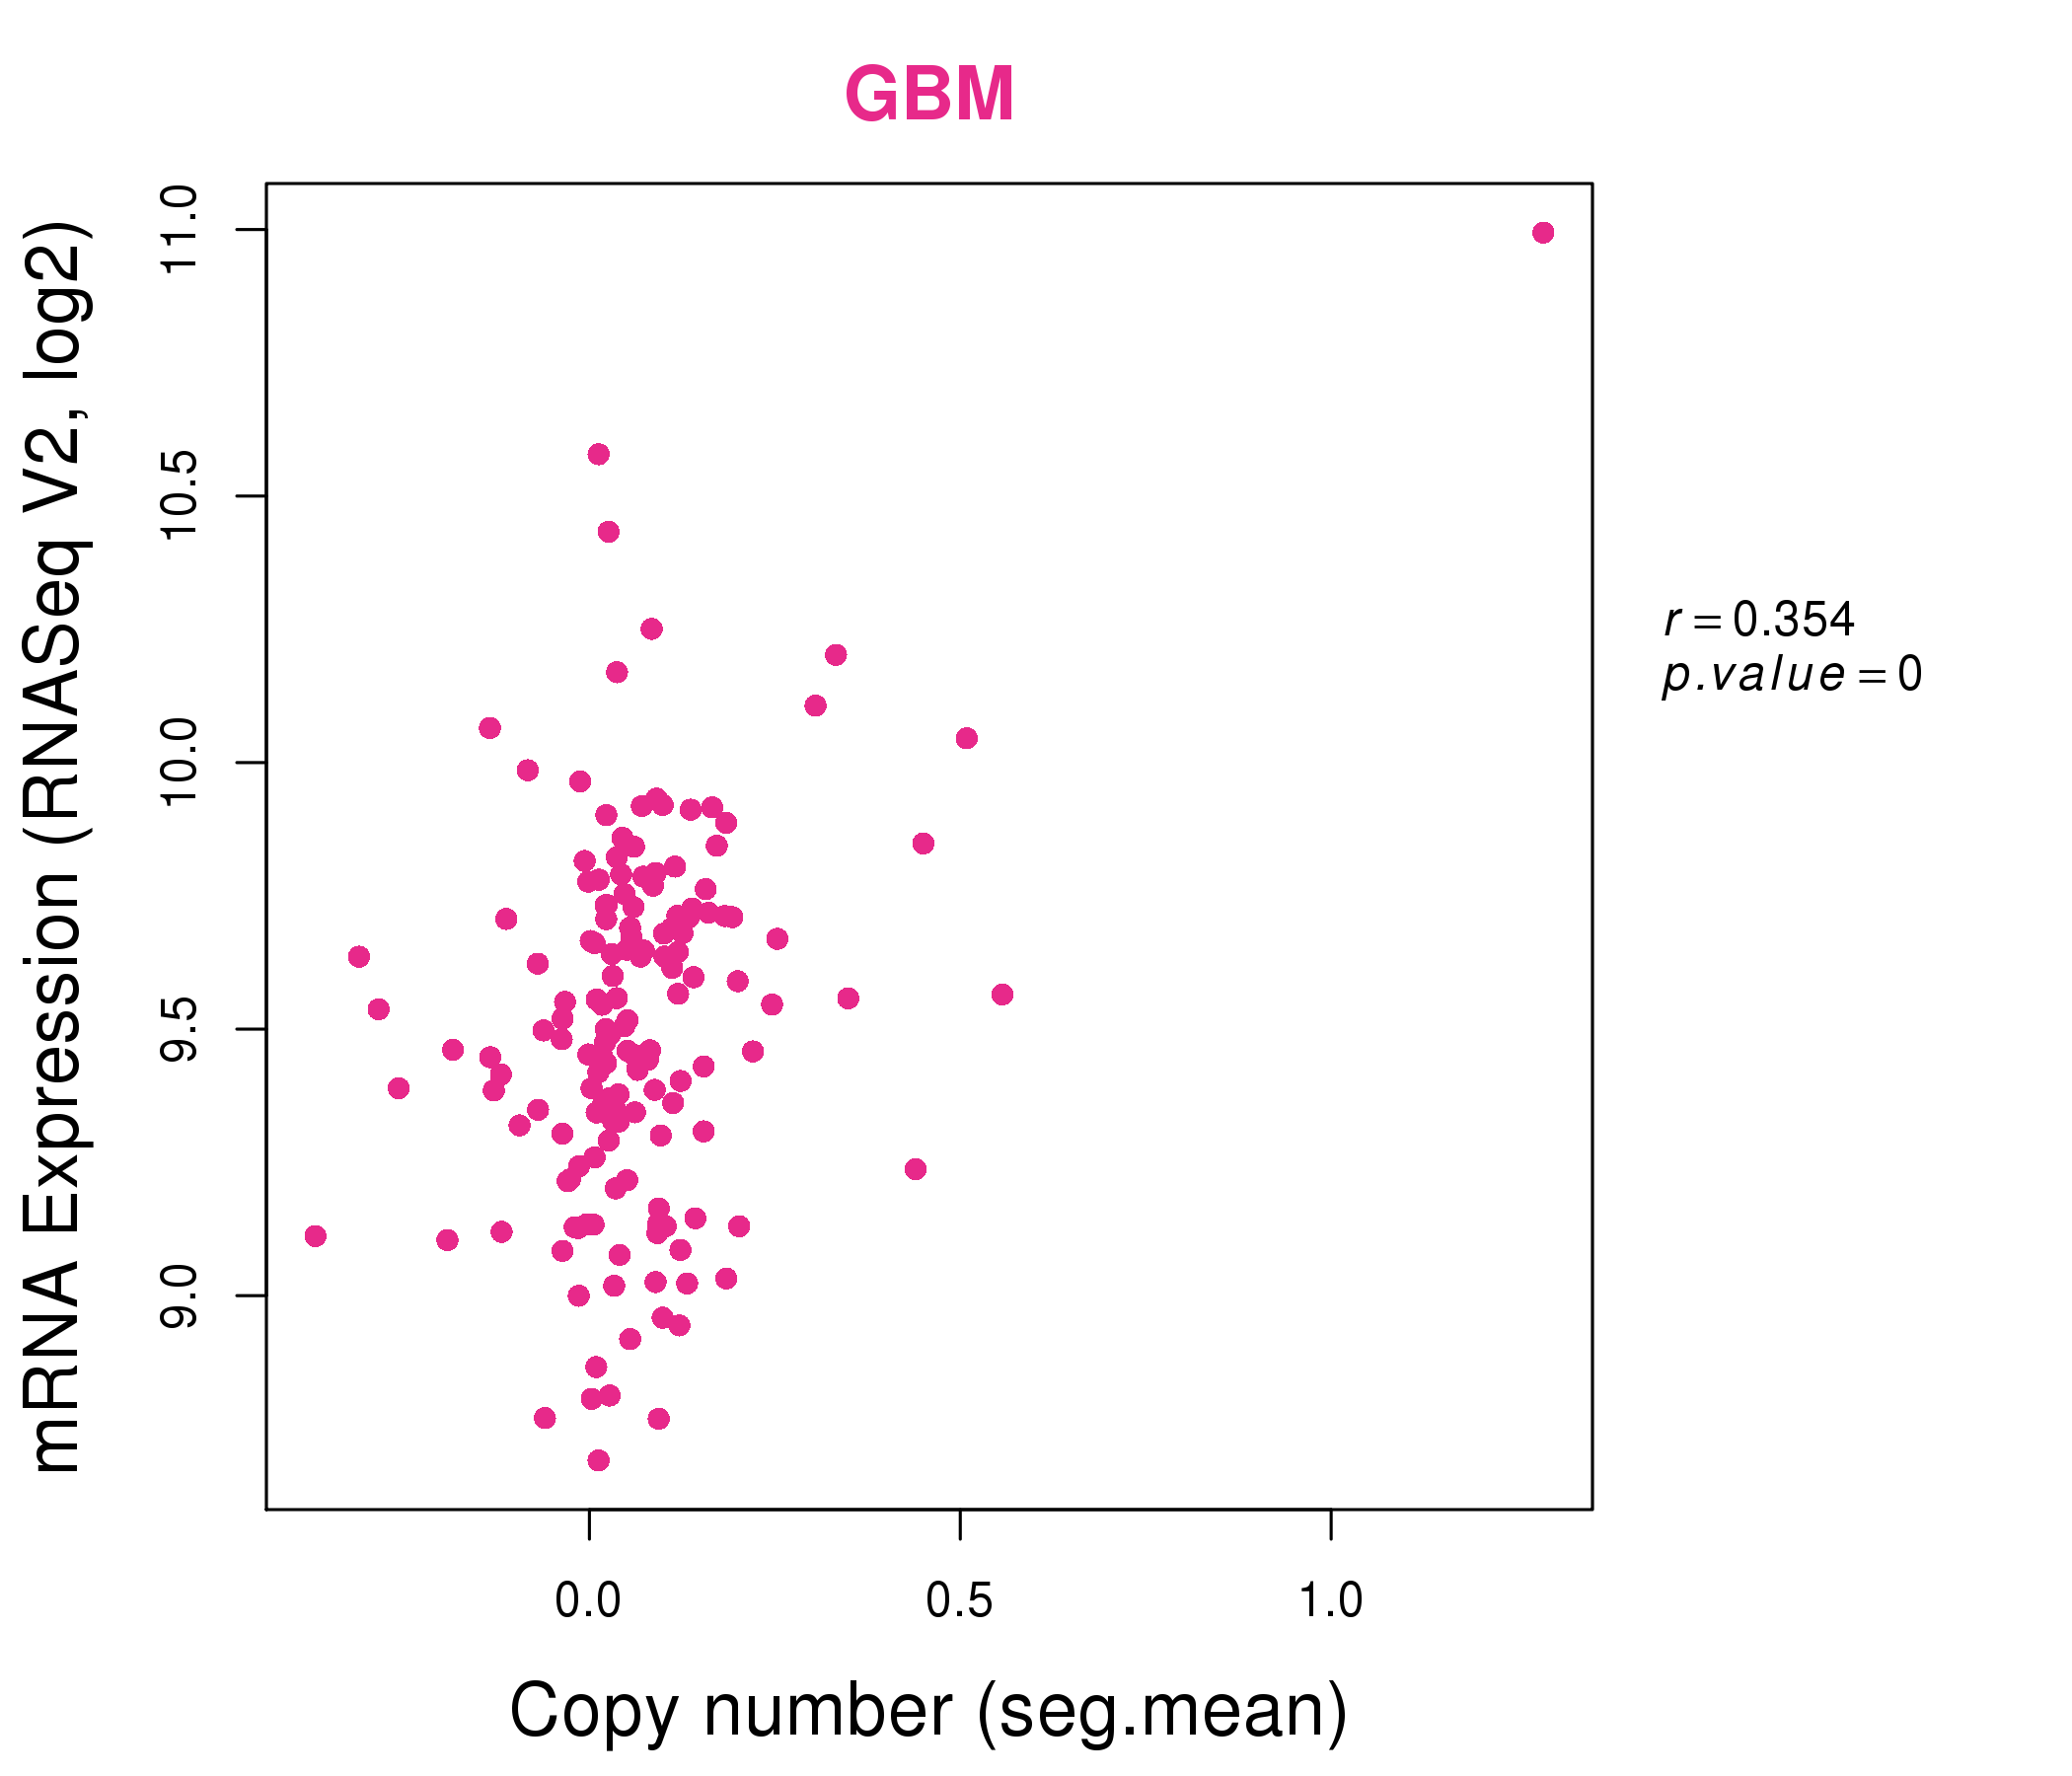
| * Normalized gene expression data of RNASeqV2 was extracted from TCGA using R package TCGA-Assembler. The URLs of all public data files on TCGA DCC data server were gathered at Jan-05-2015. Only eight cancer types have enough normal control samples for differential expression analysis. (t test, adjusted p<0.05 (using Benjamini-Hochberg FDR)) |
 |
| Top |
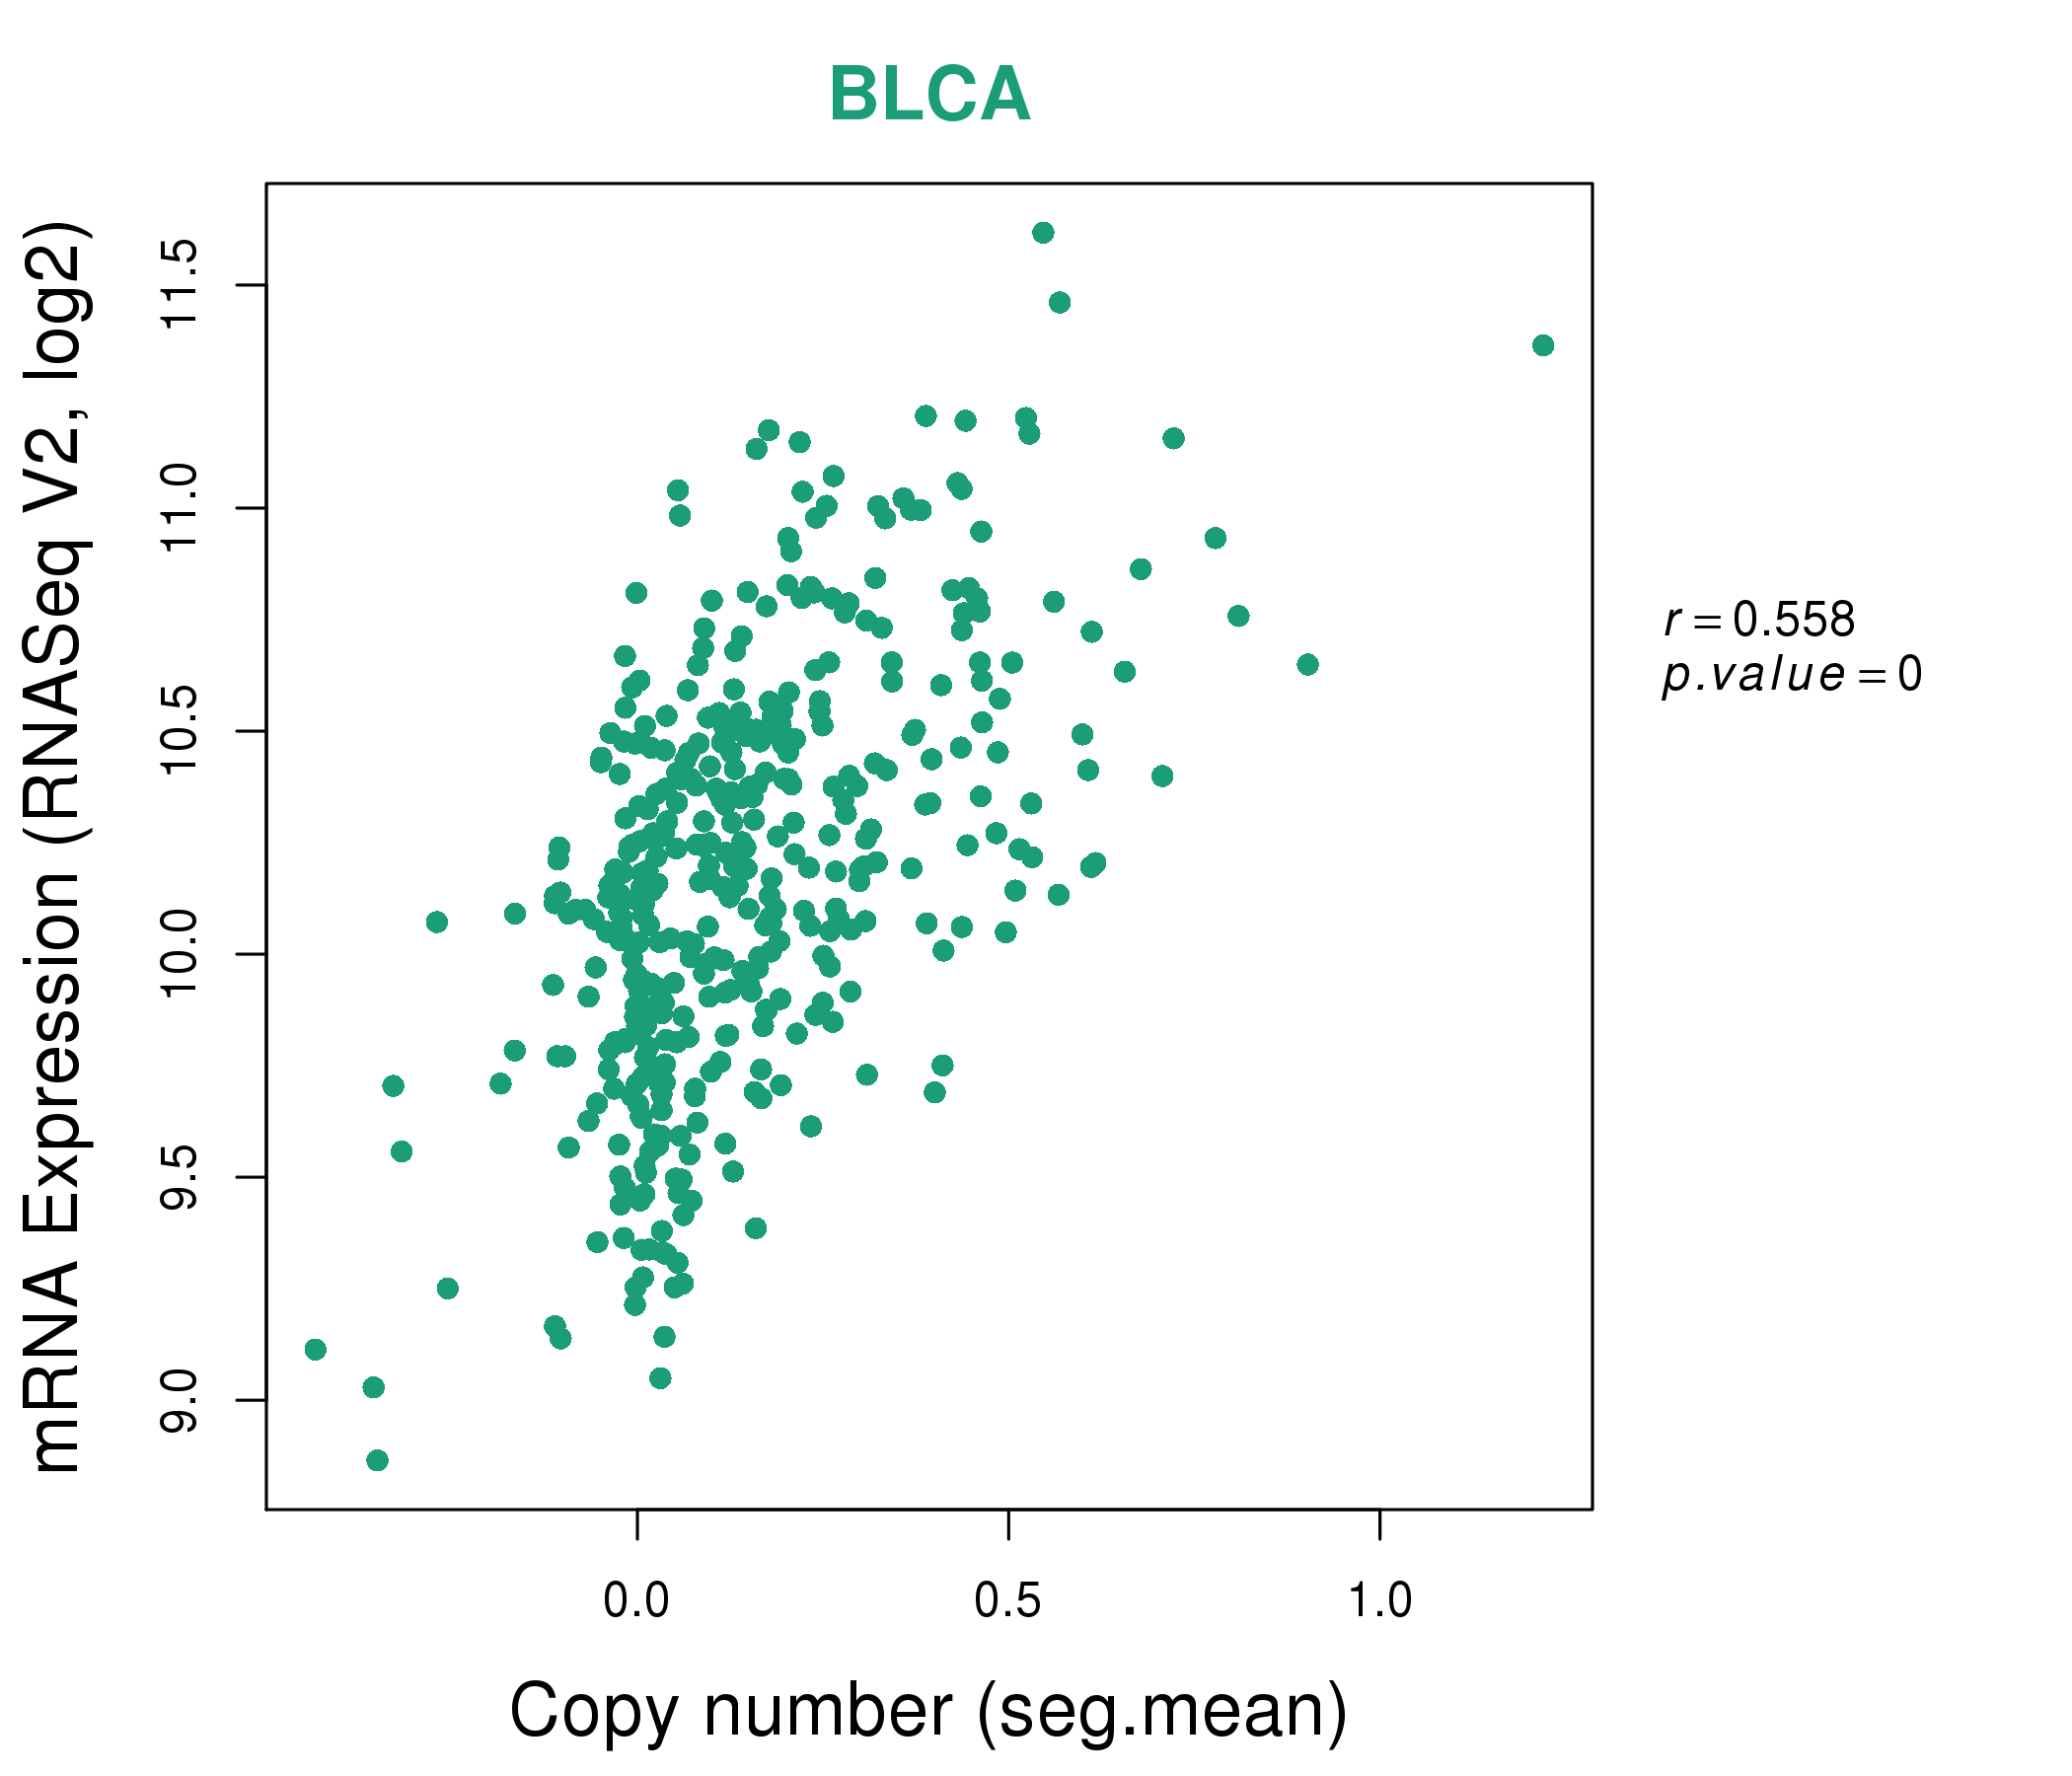
| * This plots show the correlation between CNV and gene expression. |
: Open all plots for all cancer types
 |
|
 |
|
| Top |
| Gene-Gene Network Information |
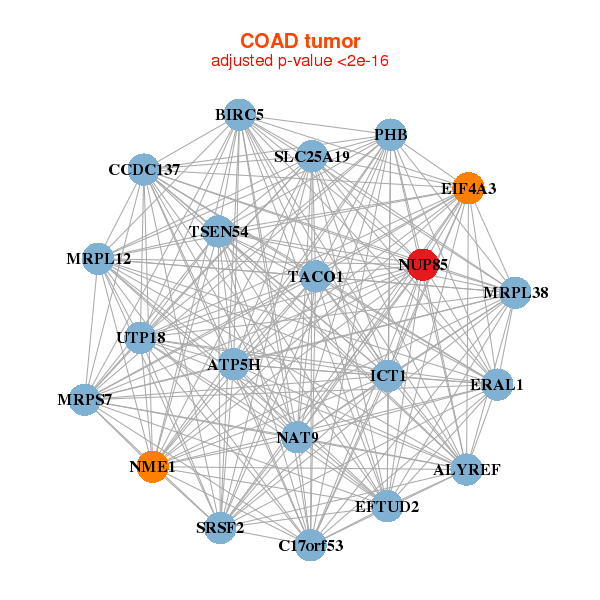
| * Co-Expression network figures were drawn using R package igraph. Only the top 20 genes with the highest correlations were shown. Red circle: input gene, orange circle: cell metabolism gene, sky circle: other gene |
: Open all plots for all cancer types
 |
|
| ATP5H,BIRC5,METTL23,GGA3,HN1,ICT1,JMJD6, LLGL2,MRPL38,MRPS7,NAT9,NUP85,RECQL5,SAP30BP, SRSF2,SLC25A19,SUMO2,ALYREF,TMEM104,TSEN54,UBE2O | ACD,TMEM234,CCDC84,DDX39A,DEF6,EGFL8,LAT, LUC7L,NFKBIE,NUP85,PABPN1,PBX4,POLR2H,PRR14, RHBDF2,SDCCAG3,SNHG12,TMEM86B,TNFRSF14,TOR2A,ZGLP1 |
 |
|
| ATP5H,BIRC5,C17orf53,CCDC137,EFTUD2,EIF4A3,ERAL1, ICT1,MRPL12,MRPL38,MRPS7,NAT9,NME1,NUP85, PHB,SRSF2,SLC25A19,TACO1,ALYREF,TSEN54,UTP18 | BIRC5,DDIAS,CDCA4,CDK1,CHEK2,DBF4,DNAJC9, DSN1,DTYMK,GINS1,GINS2,KIAA0101,NUP85,ORC6, PCNA,POLE2,PYCR1,RAD51AP1,RANBP1,UBE2T,UTP6 |


| * Co-Expression network figures were drawn using R package igraph. Only the top 20 genes with the highest correlations were shown. Red circle: input gene, orange circle: cell metabolism gene, sky circle: other gene |
: Open all plots for all cancer types
| Top |
: Open all interacting genes' information including KEGG pathway for all interacting genes from DAVID
| Top |
| Pharmacological Information for NUP85 |
| There's no related Drug. |
| Top |
| Cross referenced IDs for NUP85 |
| * We obtained these cross-references from Uniprot database. It covers 150 different DBs, 18 categories. http://www.uniprot.org/help/cross_references_section |
: Open all cross reference information
|
Copyright © 2016-Present - The Univsersity of Texas Health Science Center at Houston @ |