|
||||||||||||||||||||||||||||||||||||||||||||||||||||||||||||||||||||||||||||||||||||||||||||||||||||||||||||||||||||||||||||||||||||||||||||||||||||||||||||||||||||||||||||||||||||||||||||||||||||||||||||||||||||||||||||||||||||||||||||||||||||||||||||||||||||||||||||||||||||||||||||||||||||||||||||||||||||||||||
| |
| Phenotypic Information (metabolism pathway, cancer, disease, phenome) |
| |
| |
| Gene-Gene Network Information: Co-Expression Network, Interacting Genes & KEGG |
| |
|


| Gene Summary for TUSC3 |
| Basic gene info. | Gene symbol | TUSC3 |
| Gene name | tumor suppressor candidate 3 | |
| Synonyms | D8S1992|M33|MRT22|MRT7|N33|OST3A | |
| Cytomap | UCSC genome browser: 8p22 | |
| Genomic location | chr8 :15397595-15624158 | |
| Type of gene | protein-coding | |
| RefGenes | NM_006765.3, NM_178234.2, | |
| Ensembl id | ENSG00000104723 | |
| Description | Putative prostate cancer tumor suppressormagnesium uptake/transporter TUSC3oligosaccharyltransferase 3 homolog A | |
| Modification date | 20141219 | |
| dbXrefs | MIM : 601385 | |
| HGNC : HGNC | ||
| Ensembl : ENSG00000104723 | ||
| HPRD : 03228 | ||
| Vega : OTTHUMG00000094803 | ||
| Protein | UniProt: Q13454 go to UniProt's Cross Reference DB Table | |
| Expression | CleanEX: HS_TUSC3 | |
| BioGPS: 7991 | ||
| Gene Expression Atlas: ENSG00000104723 | ||
| The Human Protein Atlas: ENSG00000104723 | ||
| Pathway | NCI Pathway Interaction Database: TUSC3 | |
| KEGG: TUSC3 | ||
| REACTOME: TUSC3 | ||
| ConsensusPathDB | ||
| Pathway Commons: TUSC3 | ||
| Metabolism | MetaCyc: TUSC3 | |
| HUMANCyc: TUSC3 | ||
| Regulation | Ensembl's Regulation: ENSG00000104723 | |
| miRBase: chr8 :15,397,595-15,624,158 | ||
| TargetScan: NM_006765 | ||
| cisRED: ENSG00000104723 | ||
| Context | iHOP: TUSC3 | |
| cancer metabolism search in PubMed: TUSC3 | ||
| UCL Cancer Institute: TUSC3 | ||
| Assigned class in ccmGDB | B - This gene belongs to cancer gene. | |
| Top |
| Phenotypic Information for TUSC3(metabolism pathway, cancer, disease, phenome) |
| Cancer | CGAP: TUSC3 |
| Familial Cancer Database: TUSC3 | |
| * This gene is included in those cancer gene databases. |
|
|
|
|
|
| . | ||||||||||||||||||||||||||||||||||||||||||||||||||||||||||||||||||||||||||||||||||||||||||||||||||||||||||||||||||||||||||||||||||||||||||||||||||||||||||||||||||||||||||||||||||||||||||||||||||||||||||||||||||||||||||||||||||||||||||||||||||||||||||||||||||||||||||||||||||||||||||||||||||||||||||||||||||||
Oncogene 1 | Significant driver gene in | |||||||||||||||||||||||||||||||||||||||||||||||||||||||||||||||||||||||||||||||||||||||||||||||||||||||||||||||||||||||||||||||||||||||||||||||||||||||||||||||||||||||||||||||||||||||||||||||||||||||||||||||||||||||||||||||||||||||||||||||||||||||||||||||||||||||||||||||||||||||||||||||||||||||||||||||||||||||||
| cf) number; DB name 1 Oncogene; http://nar.oxfordjournals.org/content/35/suppl_1/D721.long, 2 Tumor Suppressor gene; https://bioinfo.uth.edu/TSGene/, 3 Cancer Gene Census; http://www.nature.com/nrc/journal/v4/n3/abs/nrc1299.html, 4 CancerGenes; http://nar.oxfordjournals.org/content/35/suppl_1/D721.long, 5 Network of Cancer Gene; http://ncg.kcl.ac.uk/index.php, 1Therapeutic Vulnerabilities in Cancer; http://cbio.mskcc.org/cancergenomics/statius/ |
| REACTOME_METABOLISM_OF_PROTEINS | |
| OMIM | 601385; gene. 611093; phenotype. |
| Orphanet | 88616; Autosomal recessive non-syndromic intellectual disability. |
| Disease | KEGG Disease: TUSC3 |
| MedGen: TUSC3 (Human Medical Genetics with Condition) | |
| ClinVar: TUSC3 | |
| Phenotype | MGI: TUSC3 (International Mouse Phenotyping Consortium) |
| PhenomicDB: TUSC3 | |
| Mutations for TUSC3 |
| * Under tables are showing count per each tissue to give us broad intuition about tissue specific mutation patterns.You can go to the detailed page for each mutation database's web site. |
| - Statistics for Tissue and Mutation type | Top |
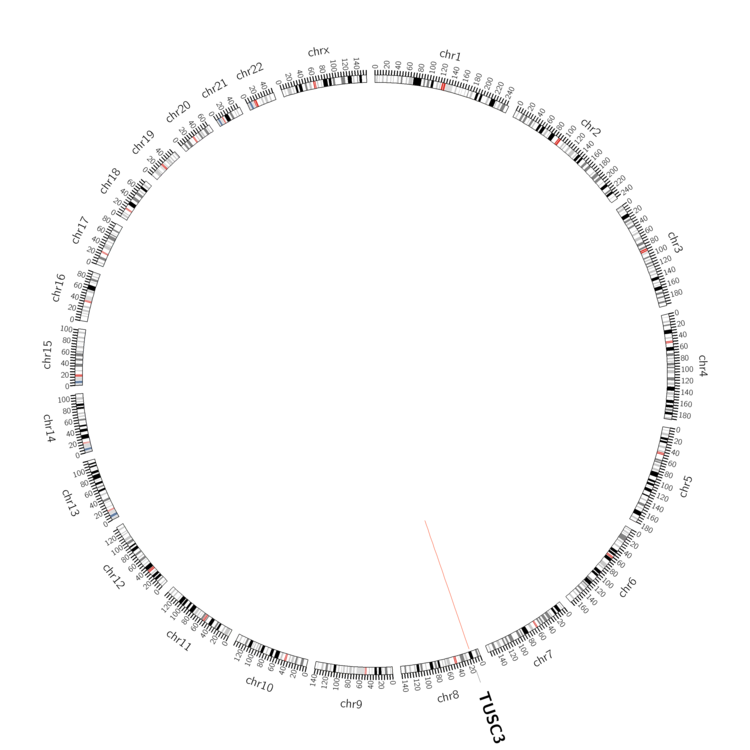 |
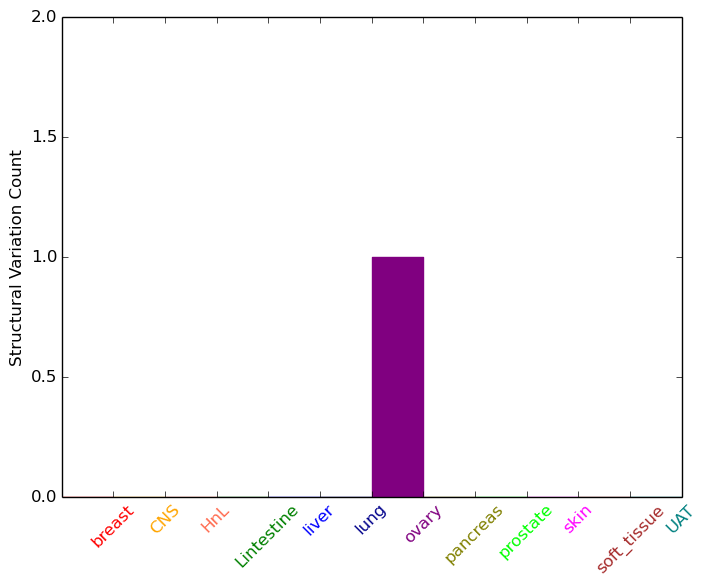
| - For Inter-chromosomal Variations |
| There's no inter-chromosomal structural variation. |
| - For Intra-chromosomal Variations |
| * Intra-chromosomal variantions includes 'intrachromosomal amplicon to amplicon', 'intrachromosomal amplicon to non-amplified dna', 'intrachromosomal deletion', 'intrachromosomal fold-back inversion', 'intrachromosomal inversion', 'intrachromosomal tandem duplication', 'Intrachromosomal unknown type', 'intrachromosomal with inverted orientation', 'intrachromosomal with non-inverted orientation'. |
 |
| Sample | Symbol_a | Chr_a | Start_a | End_a | Symbol_b | Chr_b | Start_b | End_b |
| ovary | TUSC3 | chr8 | 15441626 | 15441646 | TUSC3 | chr8 | 15441800 | 15441820 |
| cf) Tissue number; Tissue name (1;Breast, 2;Central_nervous_system, 3;Haematopoietic_and_lymphoid_tissue, 4;Large_intestine, 5;Liver, 6;Lung, 7;Ovary, 8;Pancreas, 9;Prostate, 10;Skin, 11;Soft_tissue, 12;Upper_aerodigestive_tract) |
| * From mRNA Sanger sequences, Chitars2.0 arranged chimeric transcripts. This table shows TUSC3 related fusion information. |
| ID | Head Gene | Tail Gene | Accession | Gene_a | qStart_a | qEnd_a | Chromosome_a | tStart_a | tEnd_a | Gene_a | qStart_a | qEnd_a | Chromosome_a | tStart_a | tEnd_a |
| BF990912 | ARHGEF7 | 35 | 371 | 13 | 111955946 | 111956281 | TUSC3 | 365 | 622 | 8 | 15397987 | 15480755 | |
| Top |
| Mutation type/ Tissue ID | brca | cns | cerv | endome | haematopo | kidn | Lintest | liver | lung | ns | ovary | pancre | prost | skin | stoma | thyro | urina | |||
| Total # sample | 2 | 1 | 1 | 2 | 1 | 3 | ||||||||||||||
| GAIN (# sample) | 1 | 3 | ||||||||||||||||||
| LOSS (# sample) | 2 | 1 | 2 | 1 |
| cf) Tissue ID; Tissue type (1; Breast, 2; Central_nervous_system, 3; Cervix, 4; Endometrium, 5; Haematopoietic_and_lymphoid_tissue, 6; Kidney, 7; Large_intestine, 8; Liver, 9; Lung, 10; NS, 11; Ovary, 12; Pancreas, 13; Prostate, 14; Skin, 15; Stomach, 16; Thyroid, 17; Urinary_tract) |
| Top |
|
 |
| Top |
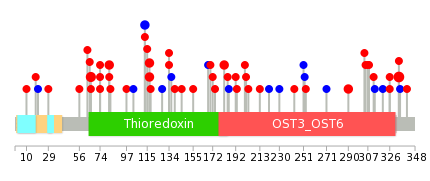
| Stat. for Non-Synonymous SNVs (# total SNVs=59) | (# total SNVs=14) |
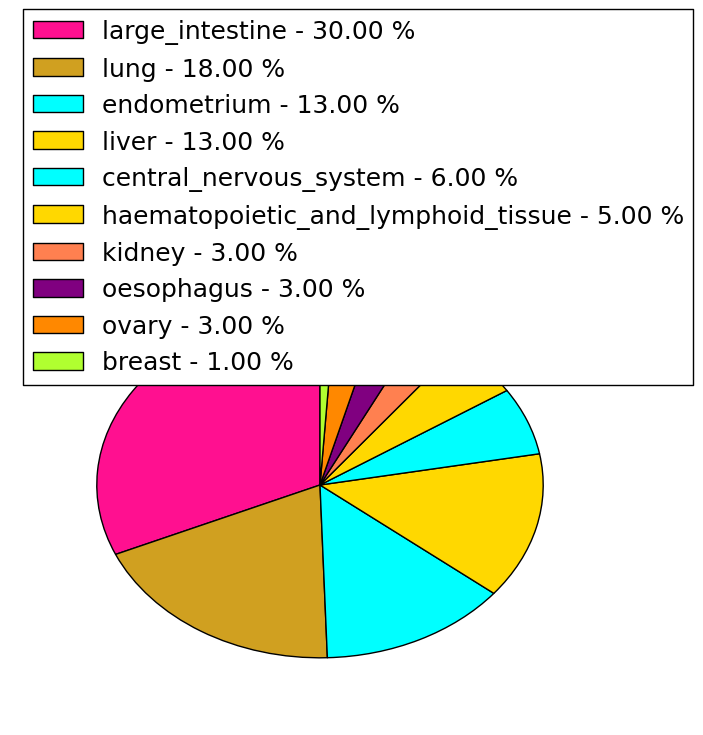 | 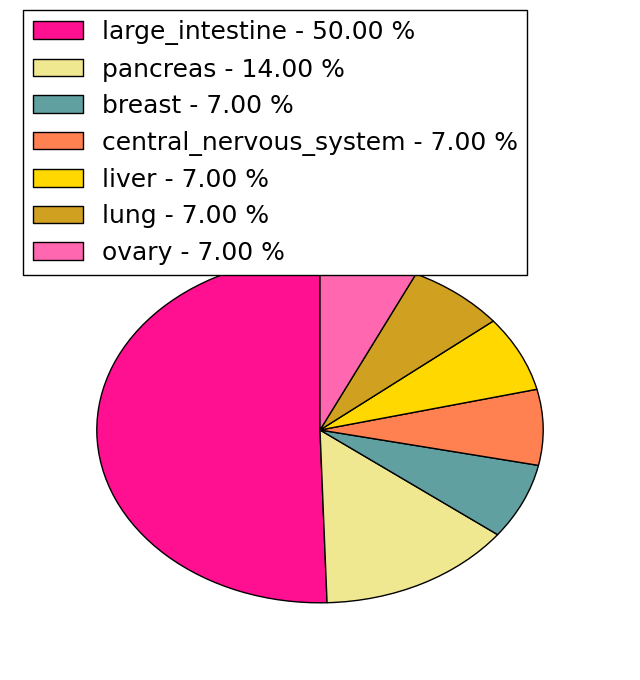 |
(# total SNVs=0) | (# total SNVs=0) |
| Top |
| * When you move the cursor on each content, you can see more deailed mutation information on the Tooltip. Those are primary_site,primary_histology,mutation(aa),pubmedID. |
| GRCh37 position | Mutation(aa) | Unique sampleID count |
| chr8:15605946-15605946 | p.R334C | 6 |
| chr8:15480695-15480695 | p.R82L | 4 |
| chr8:15480646-15480646 | p.F66I | 3 |
| chr8:15605922-15605922 | p.F326L | 2 |
| chr8:15480717-15480717 | p.M89I | 2 |
| chr8:15397952-15397952 | p.G5S | 2 |
| chr8:15517163-15517163 | p.? | 2 |
| chr8:15480637-15480637 | p.R63C | 2 |
| chr8:15519674-15519674 | p.F193L | 2 |
| chr8:15517083-15517083 | p.T165I | 2 |
| Top |
|
 |
| Point Mutation/ Tissue ID | 1 | 2 | 3 | 4 | 5 | 6 | 7 | 8 | 9 | 10 | 11 | 12 | 13 | 14 | 15 | 16 | 17 | 18 | 19 | 20 |
| # sample | 14 | 4 | 3 | 2 | 1 | 1 | 9 | 3 | 1 | 1 | 10 | 15 | 6 | |||||||
| # mutation | 15 | 4 | 3 | 2 | 1 | 1 | 8 | 3 | 1 | 1 | 9 | 14 | 6 | |||||||
| nonsynonymous SNV | 9 | 3 | 3 | 1 | 1 | 1 | 6 | 2 | 1 | 1 | 6 | 13 | 6 | |||||||
| synonymous SNV | 6 | 1 | 1 | 2 | 1 | 3 | 1 |
| cf) Tissue ID; Tissue type (1; BLCA[Bladder Urothelial Carcinoma], 2; BRCA[Breast invasive carcinoma], 3; CESC[Cervical squamous cell carcinoma and endocervical adenocarcinoma], 4; COAD[Colon adenocarcinoma], 5; GBM[Glioblastoma multiforme], 6; Glioma Low Grade, 7; HNSC[Head and Neck squamous cell carcinoma], 8; KICH[Kidney Chromophobe], 9; KIRC[Kidney renal clear cell carcinoma], 10; KIRP[Kidney renal papillary cell carcinoma], 11; LAML[Acute Myeloid Leukemia], 12; LUAD[Lung adenocarcinoma], 13; LUSC[Lung squamous cell carcinoma], 14; OV[Ovarian serous cystadenocarcinoma ], 15; PAAD[Pancreatic adenocarcinoma], 16; PRAD[Prostate adenocarcinoma], 17; SKCM[Skin Cutaneous Melanoma], 18:STAD[Stomach adenocarcinoma], 19:THCA[Thyroid carcinoma], 20:UCEC[Uterine Corpus Endometrial Carcinoma]) |
| Top |
| * We represented just top 10 SNVs. When you move the cursor on each content, you can see more deailed mutation information on the Tooltip. Those are primary_site, primary_histology, mutation(aa), pubmedID. |
| Genomic Position | Mutation(aa) | Unique sampleID count |
| chr8:15605946 | p.F66V,TUSC3 | 4 |
| chr8:15480646 | p.R334C,TUSC3 | 4 |
| chr8:15480671 | p.R74L,TUSC3 | 3 |
| chr8:15480695 | p.R82Q,TUSC3 | 3 |
| chr8:15605922 | p.A113A,TUSC3 | 2 |
| chr8:15508236 | p.I182T,TUSC3 | 2 |
| chr8:15601052 | p.A290T,TUSC3 | 2 |
| chr8:15508246 | p.R117C,TUSC3 | 2 |
| chr8:15508247 | p.R117H,TUSC3 | 2 |
| chr8:15517134 | p.F326V,TUSC3 | 2 |
| * Copy number data were extracted from TCGA using R package TCGA-Assembler. The URLs of all public data files on TCGA DCC data server were gathered on Jan-05-2015. Function ProcessCNAData in TCGA-Assembler package was used to obtain gene-level copy number value which is calculated as the average copy number of the genomic region of a gene. |
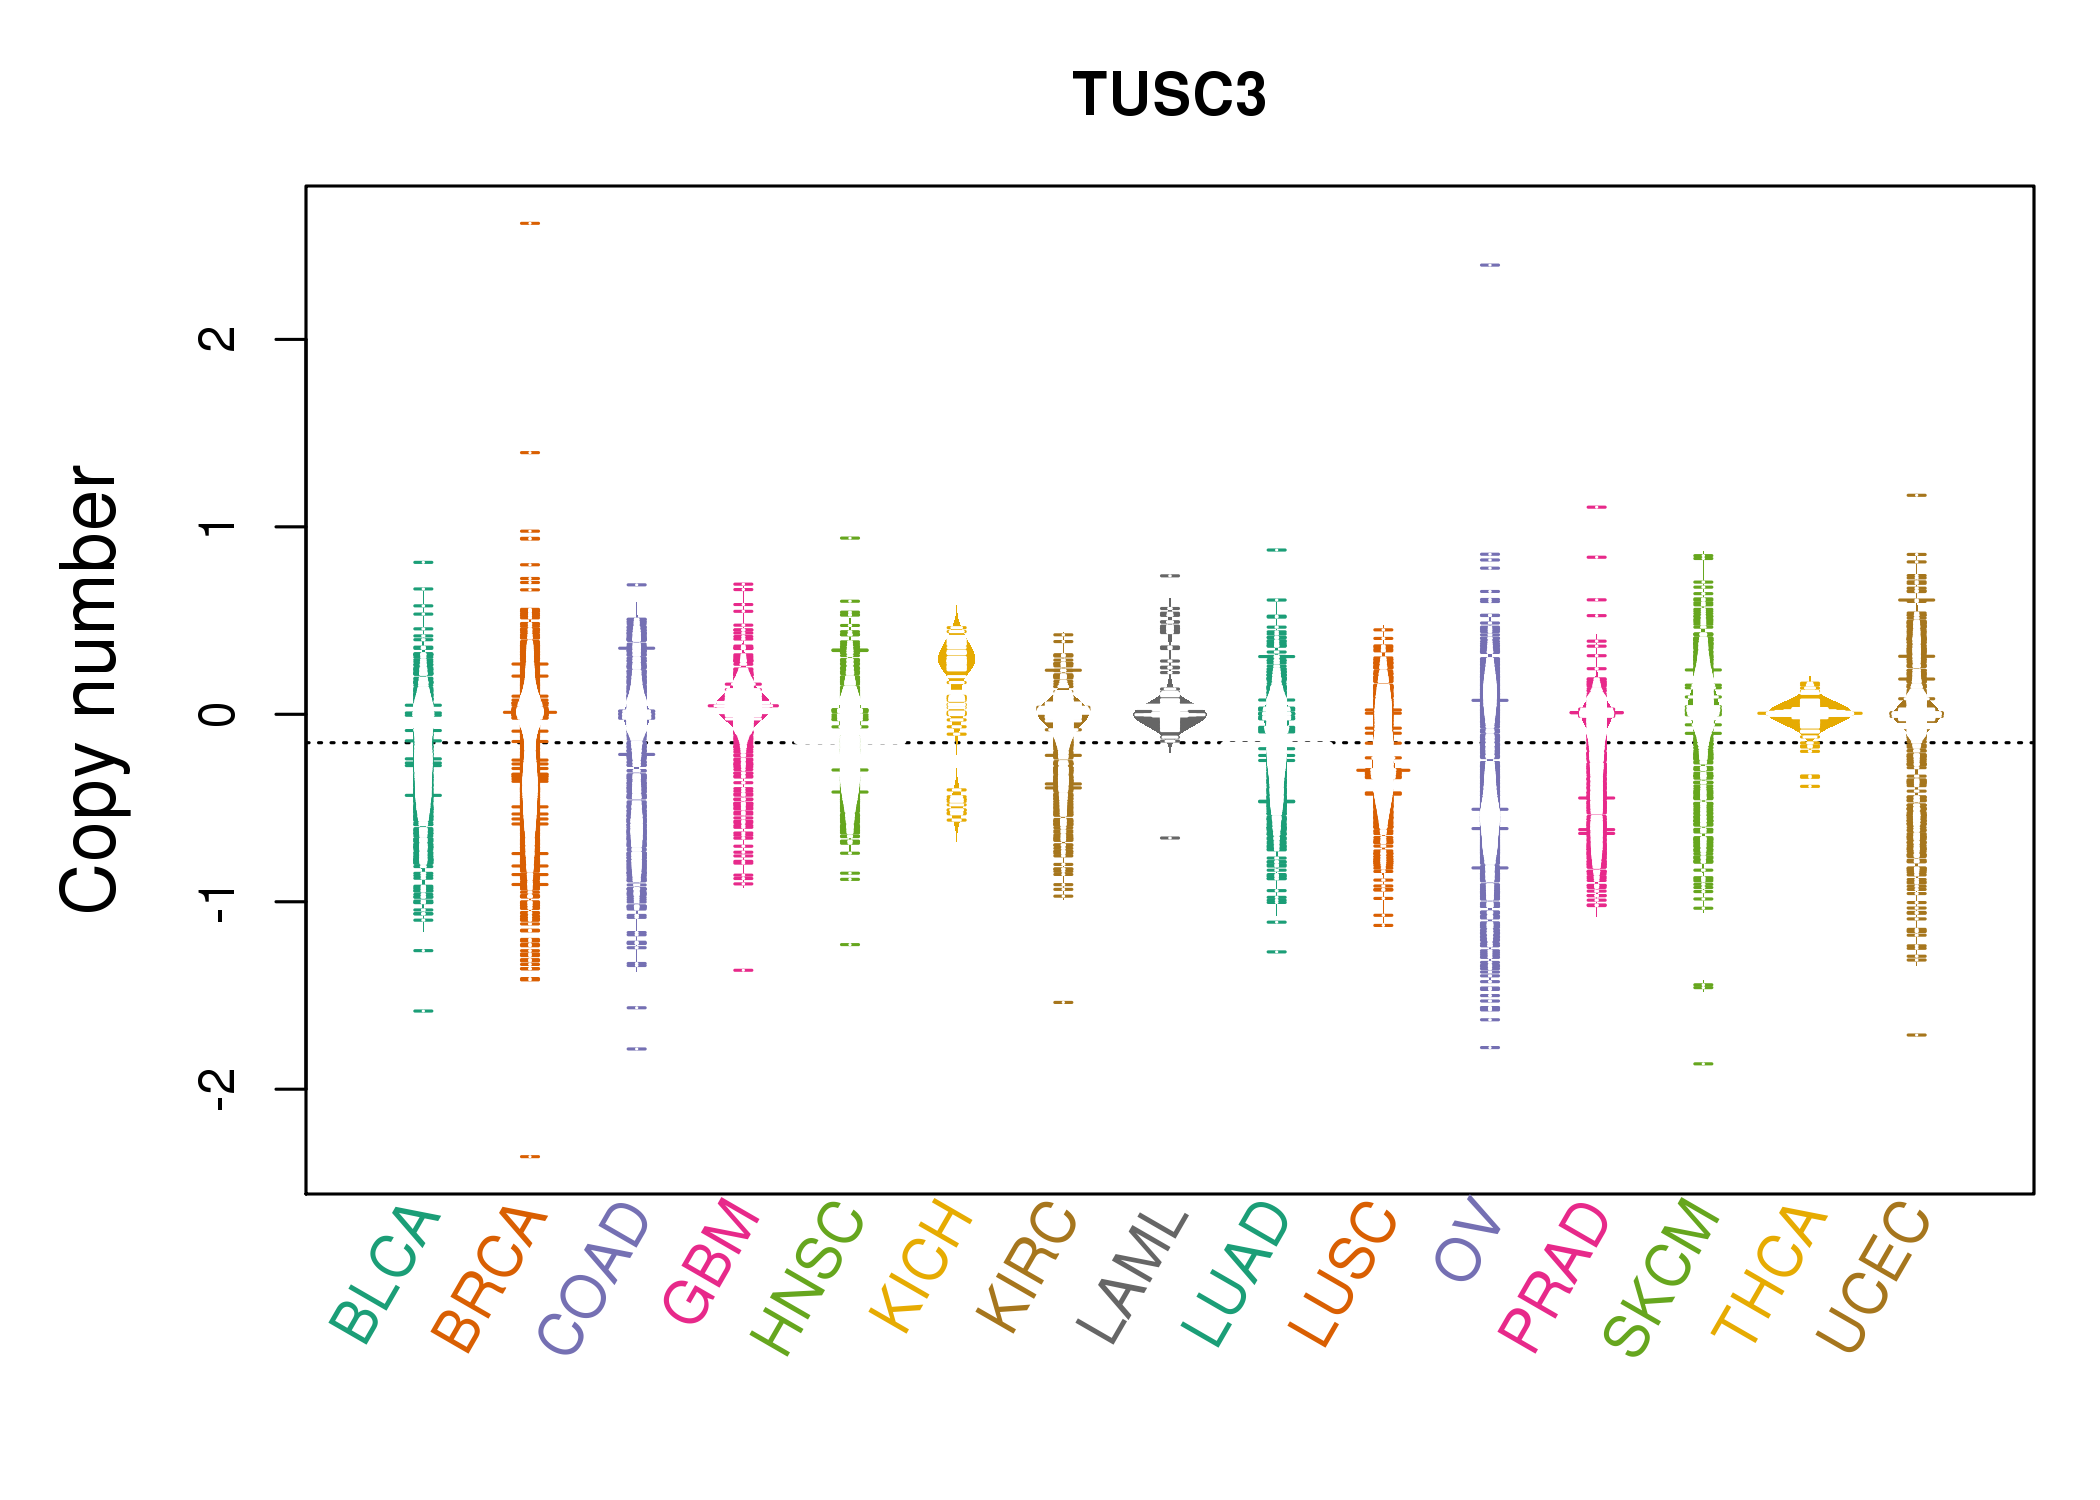 |
| cf) Tissue ID[Tissue type]: BLCA[Bladder Urothelial Carcinoma], BRCA[Breast invasive carcinoma], CESC[Cervical squamous cell carcinoma and endocervical adenocarcinoma], COAD[Colon adenocarcinoma], GBM[Glioblastoma multiforme], Glioma Low Grade, HNSC[Head and Neck squamous cell carcinoma], KICH[Kidney Chromophobe], KIRC[Kidney renal clear cell carcinoma], KIRP[Kidney renal papillary cell carcinoma], LAML[Acute Myeloid Leukemia], LUAD[Lung adenocarcinoma], LUSC[Lung squamous cell carcinoma], OV[Ovarian serous cystadenocarcinoma ], PAAD[Pancreatic adenocarcinoma], PRAD[Prostate adenocarcinoma], SKCM[Skin Cutaneous Melanoma], STAD[Stomach adenocarcinoma], THCA[Thyroid carcinoma], UCEC[Uterine Corpus Endometrial Carcinoma] |
| Top |
| Gene Expression for TUSC3 |
| * CCLE gene expression data were extracted from CCLE_Expression_Entrez_2012-10-18.res: Gene-centric RMA-normalized mRNA expression data. |
 |
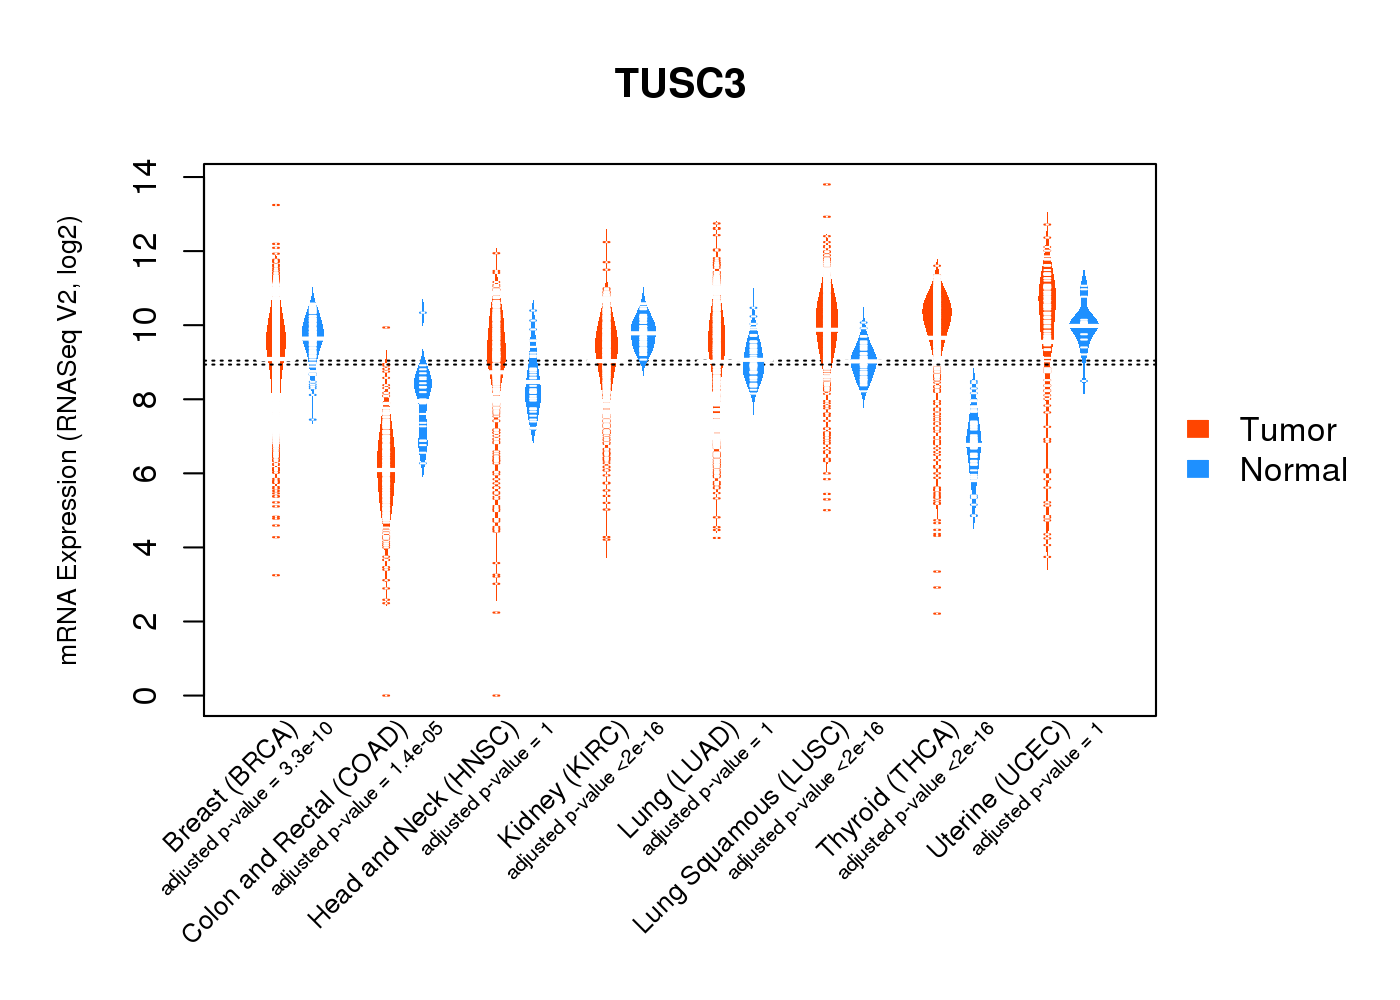
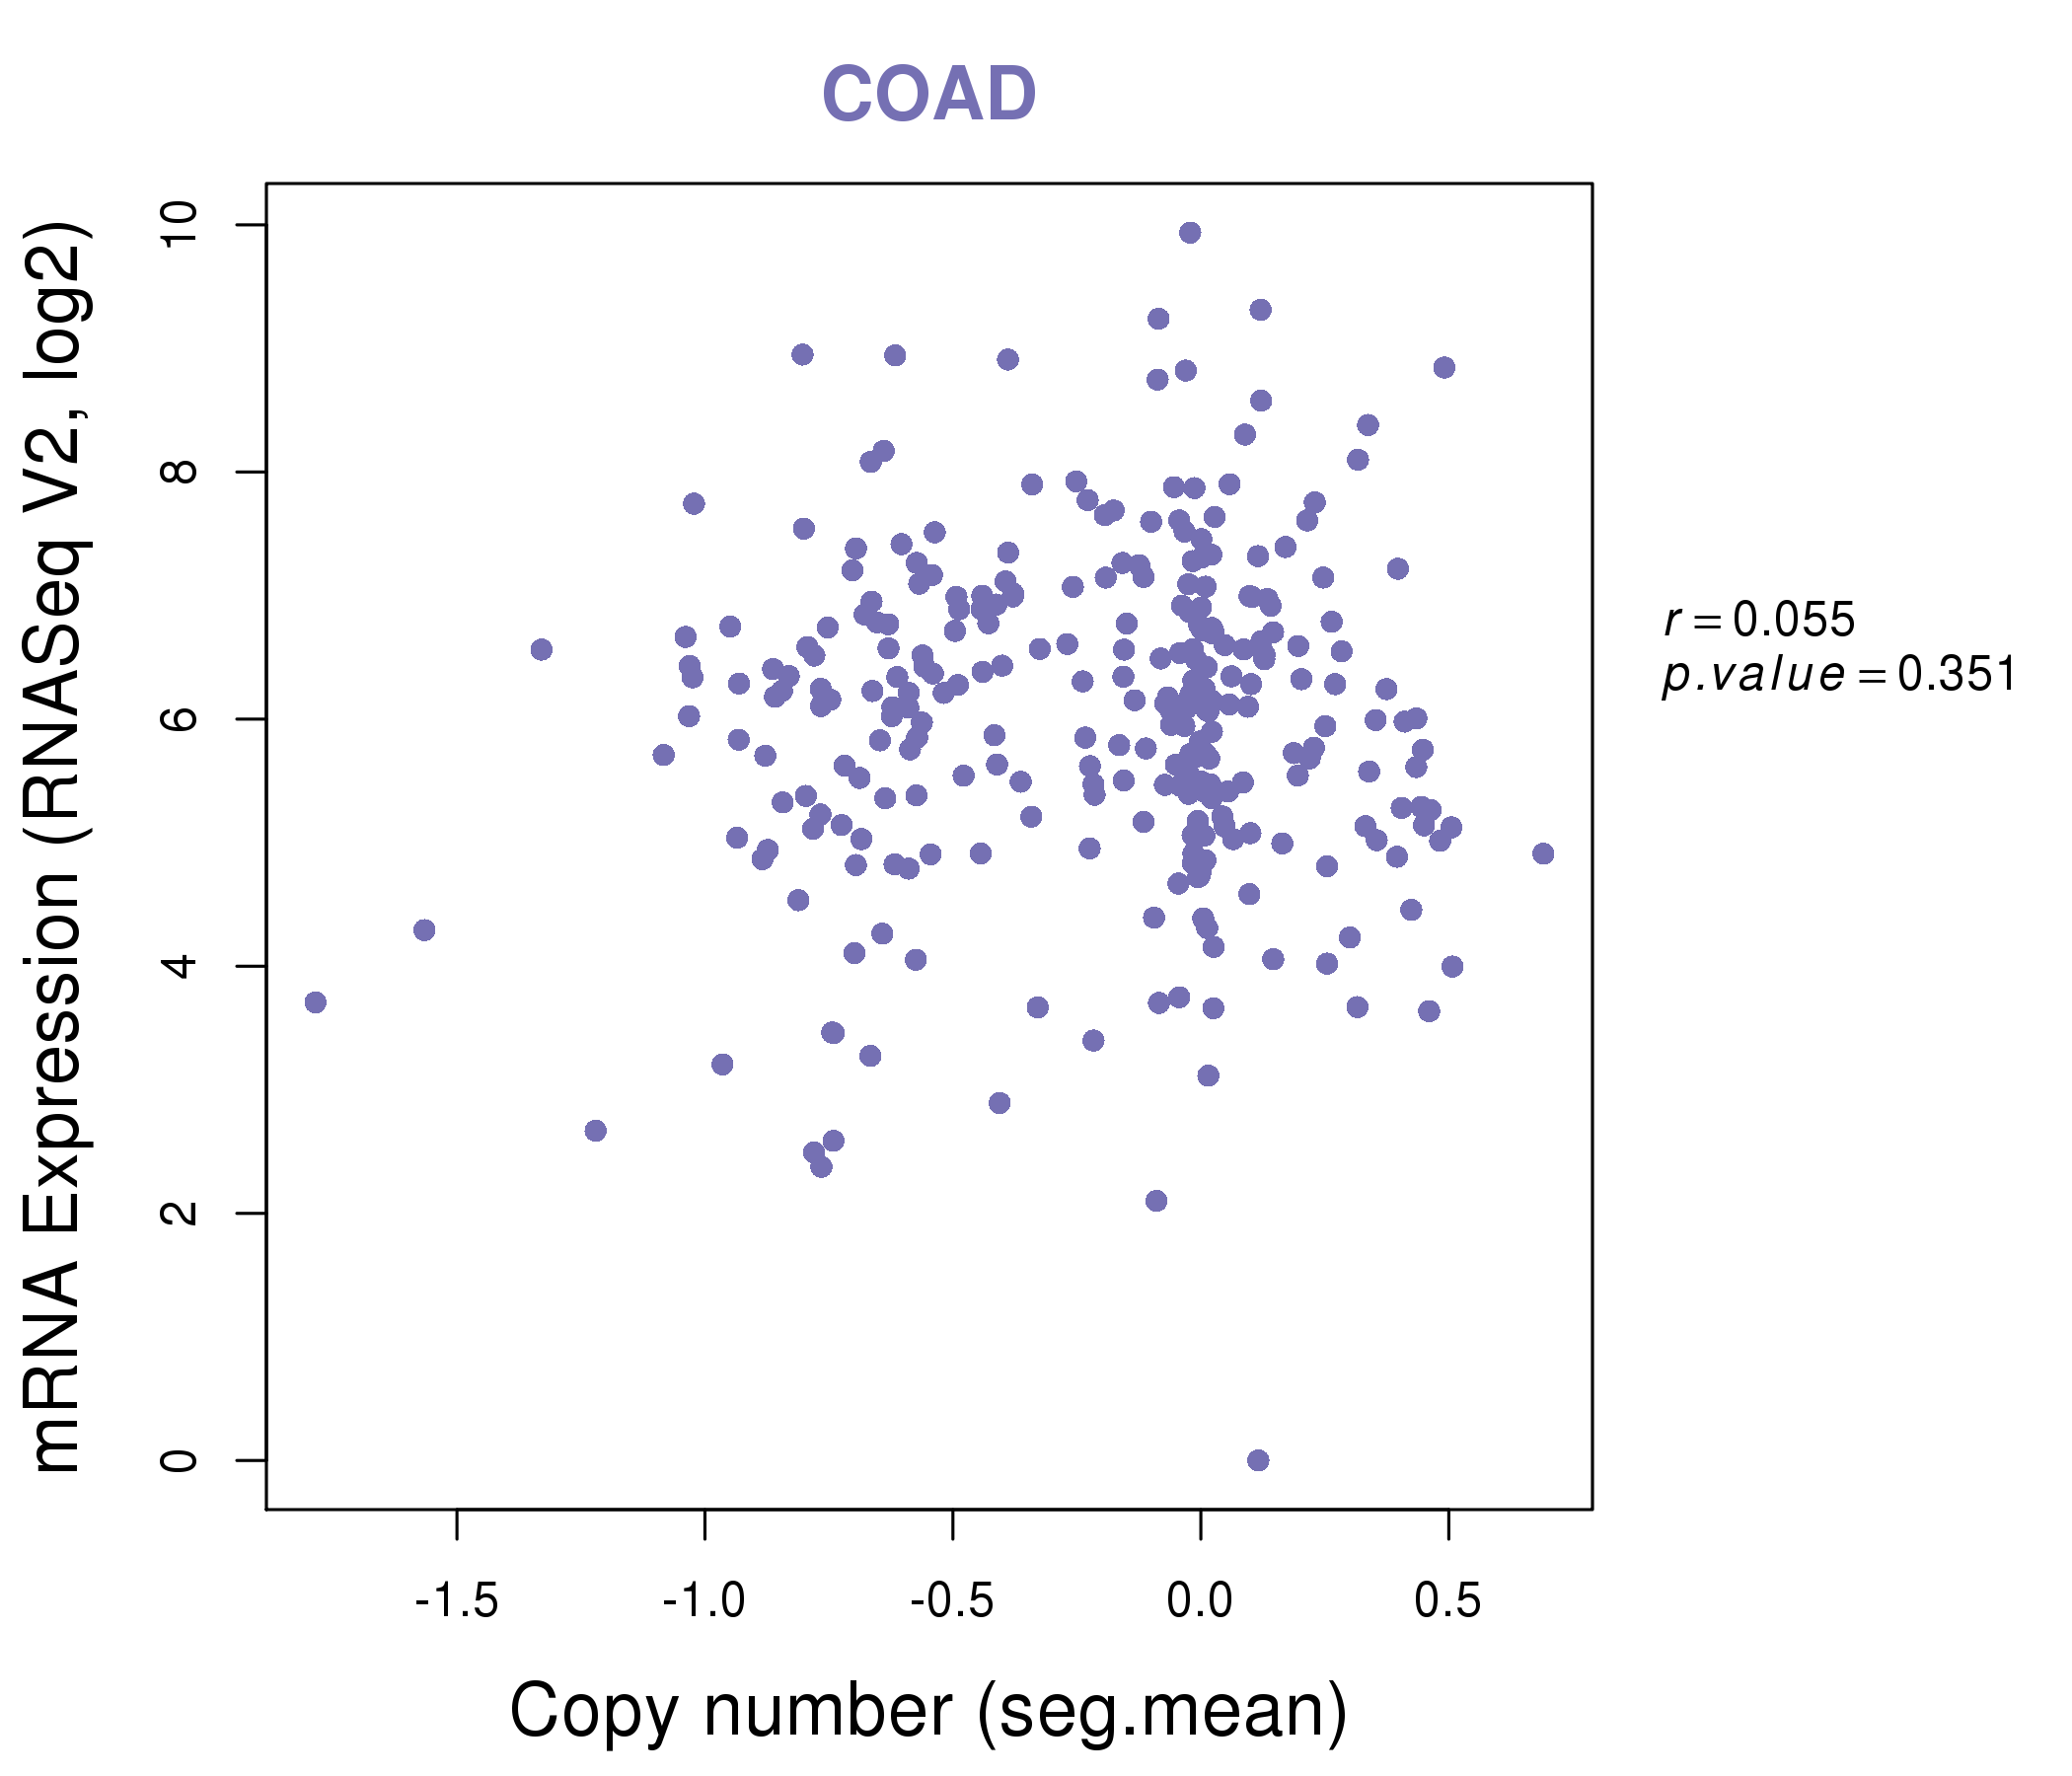
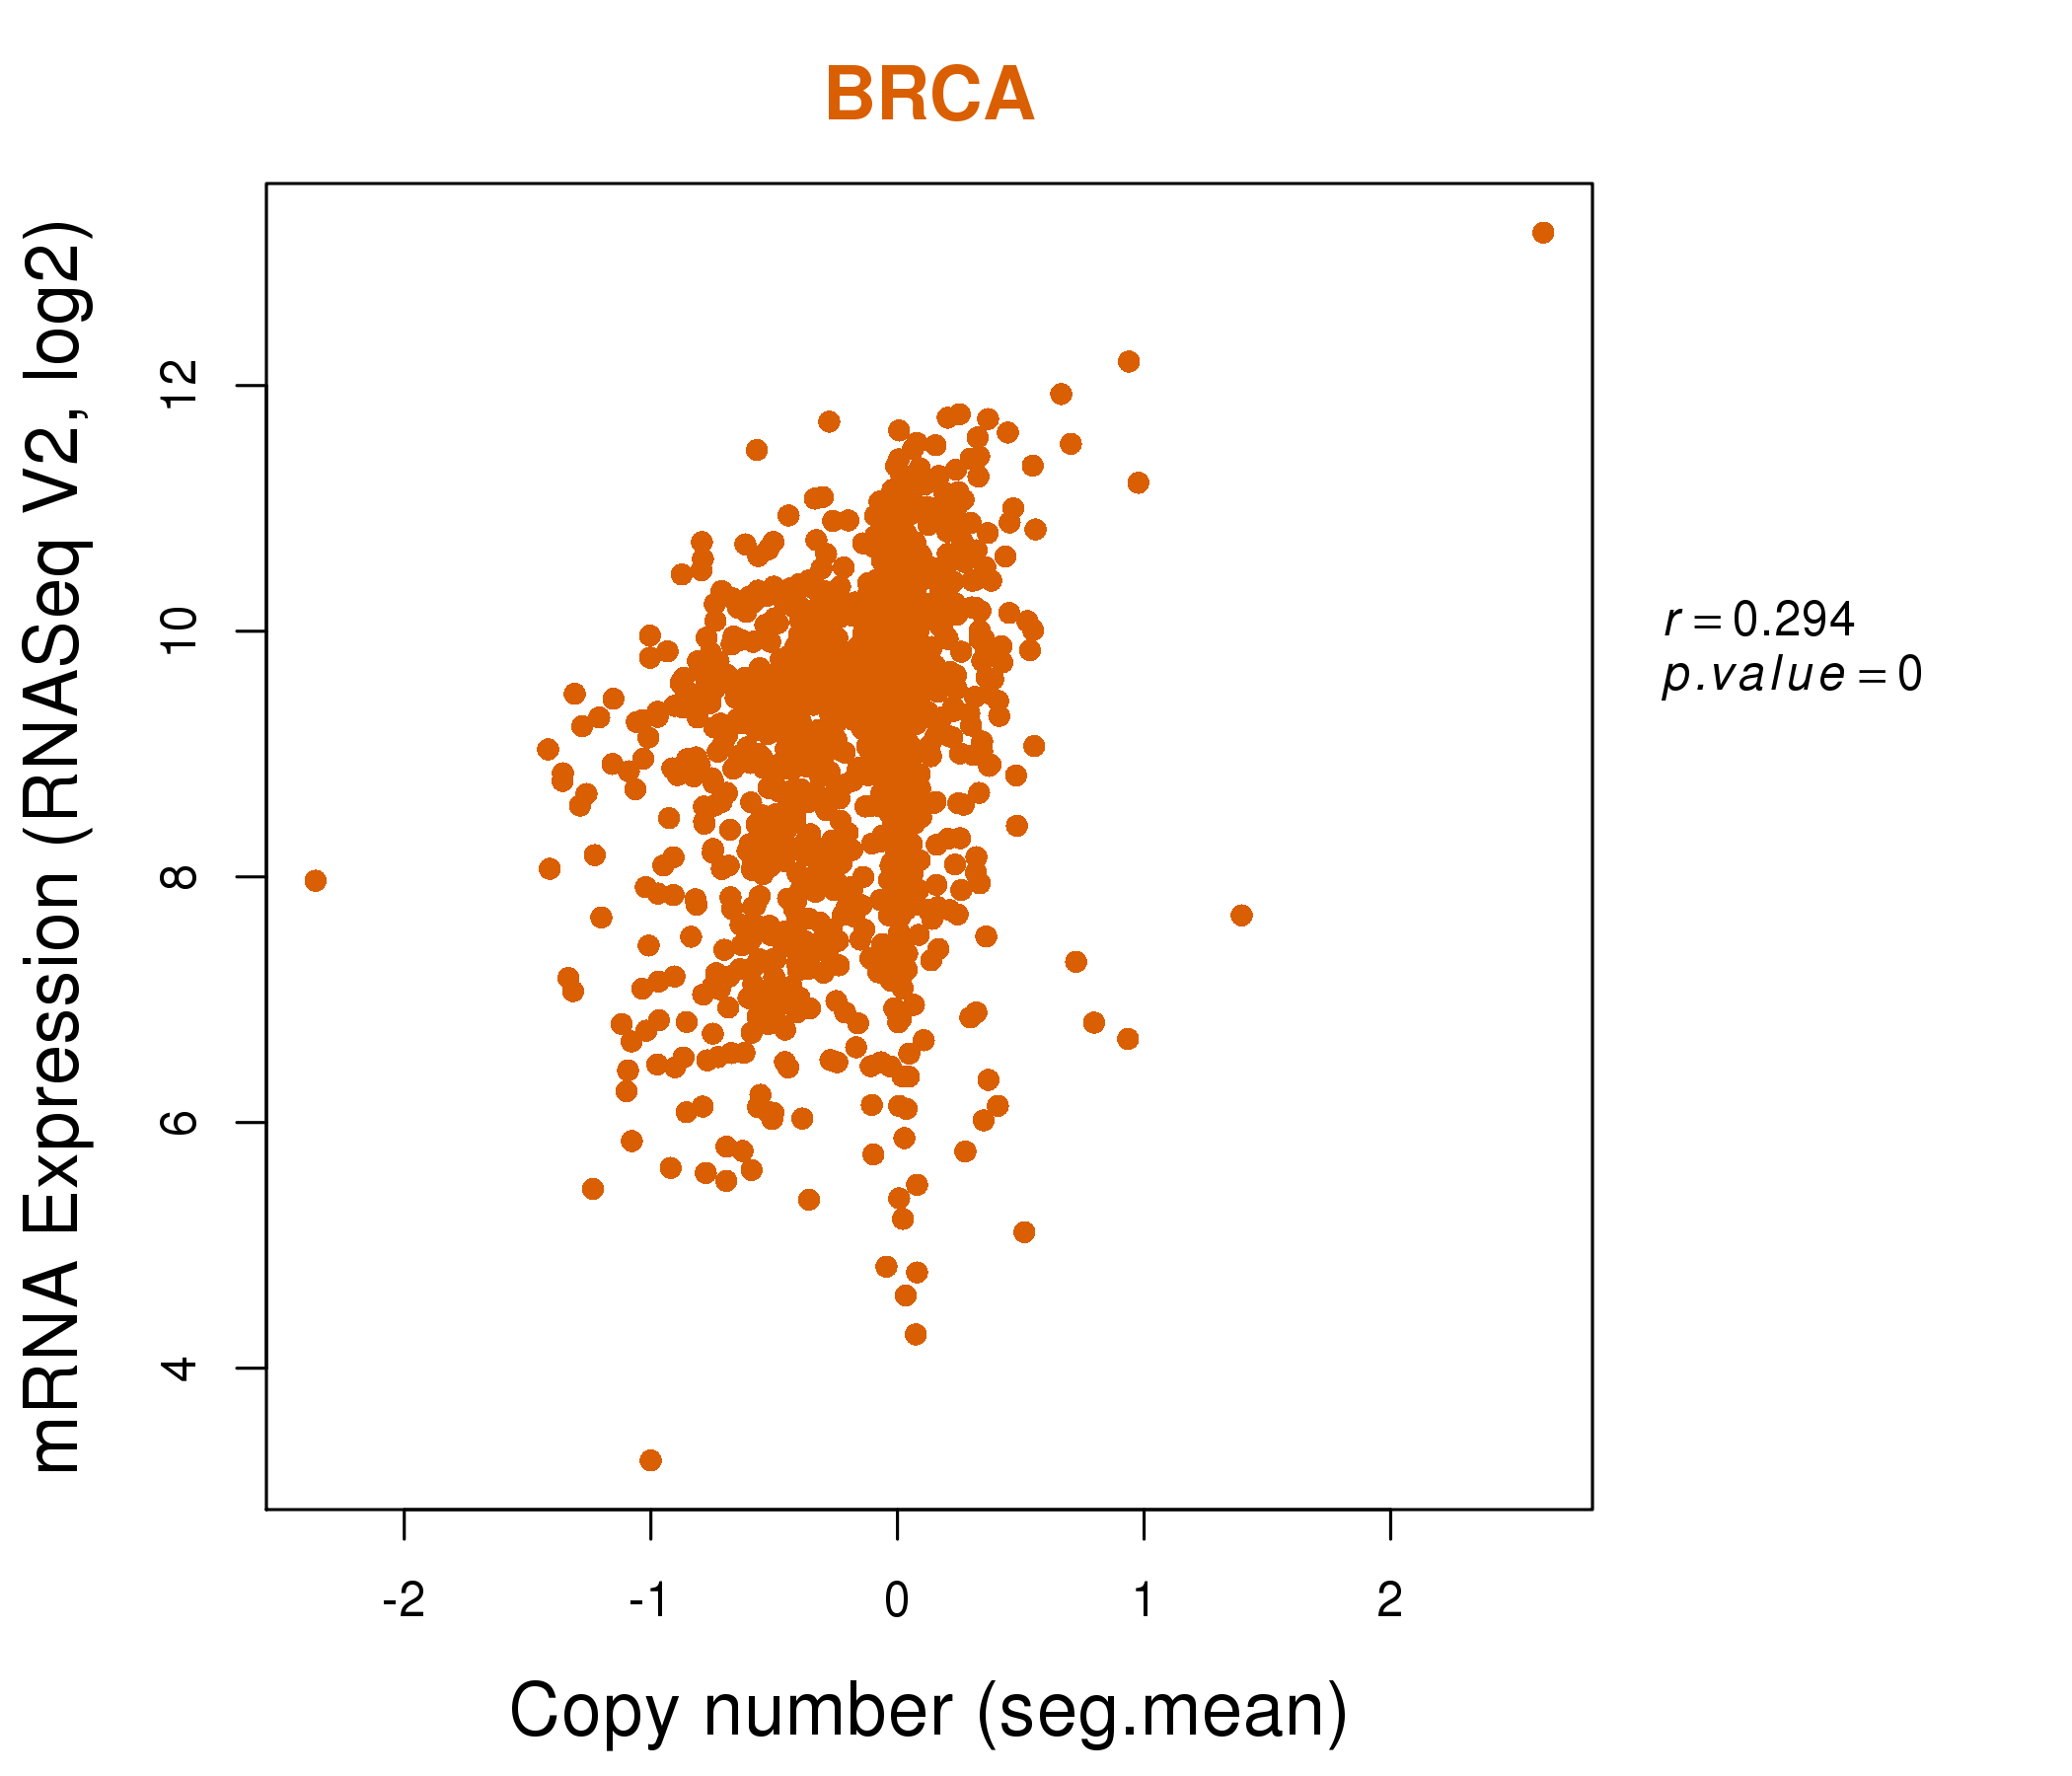
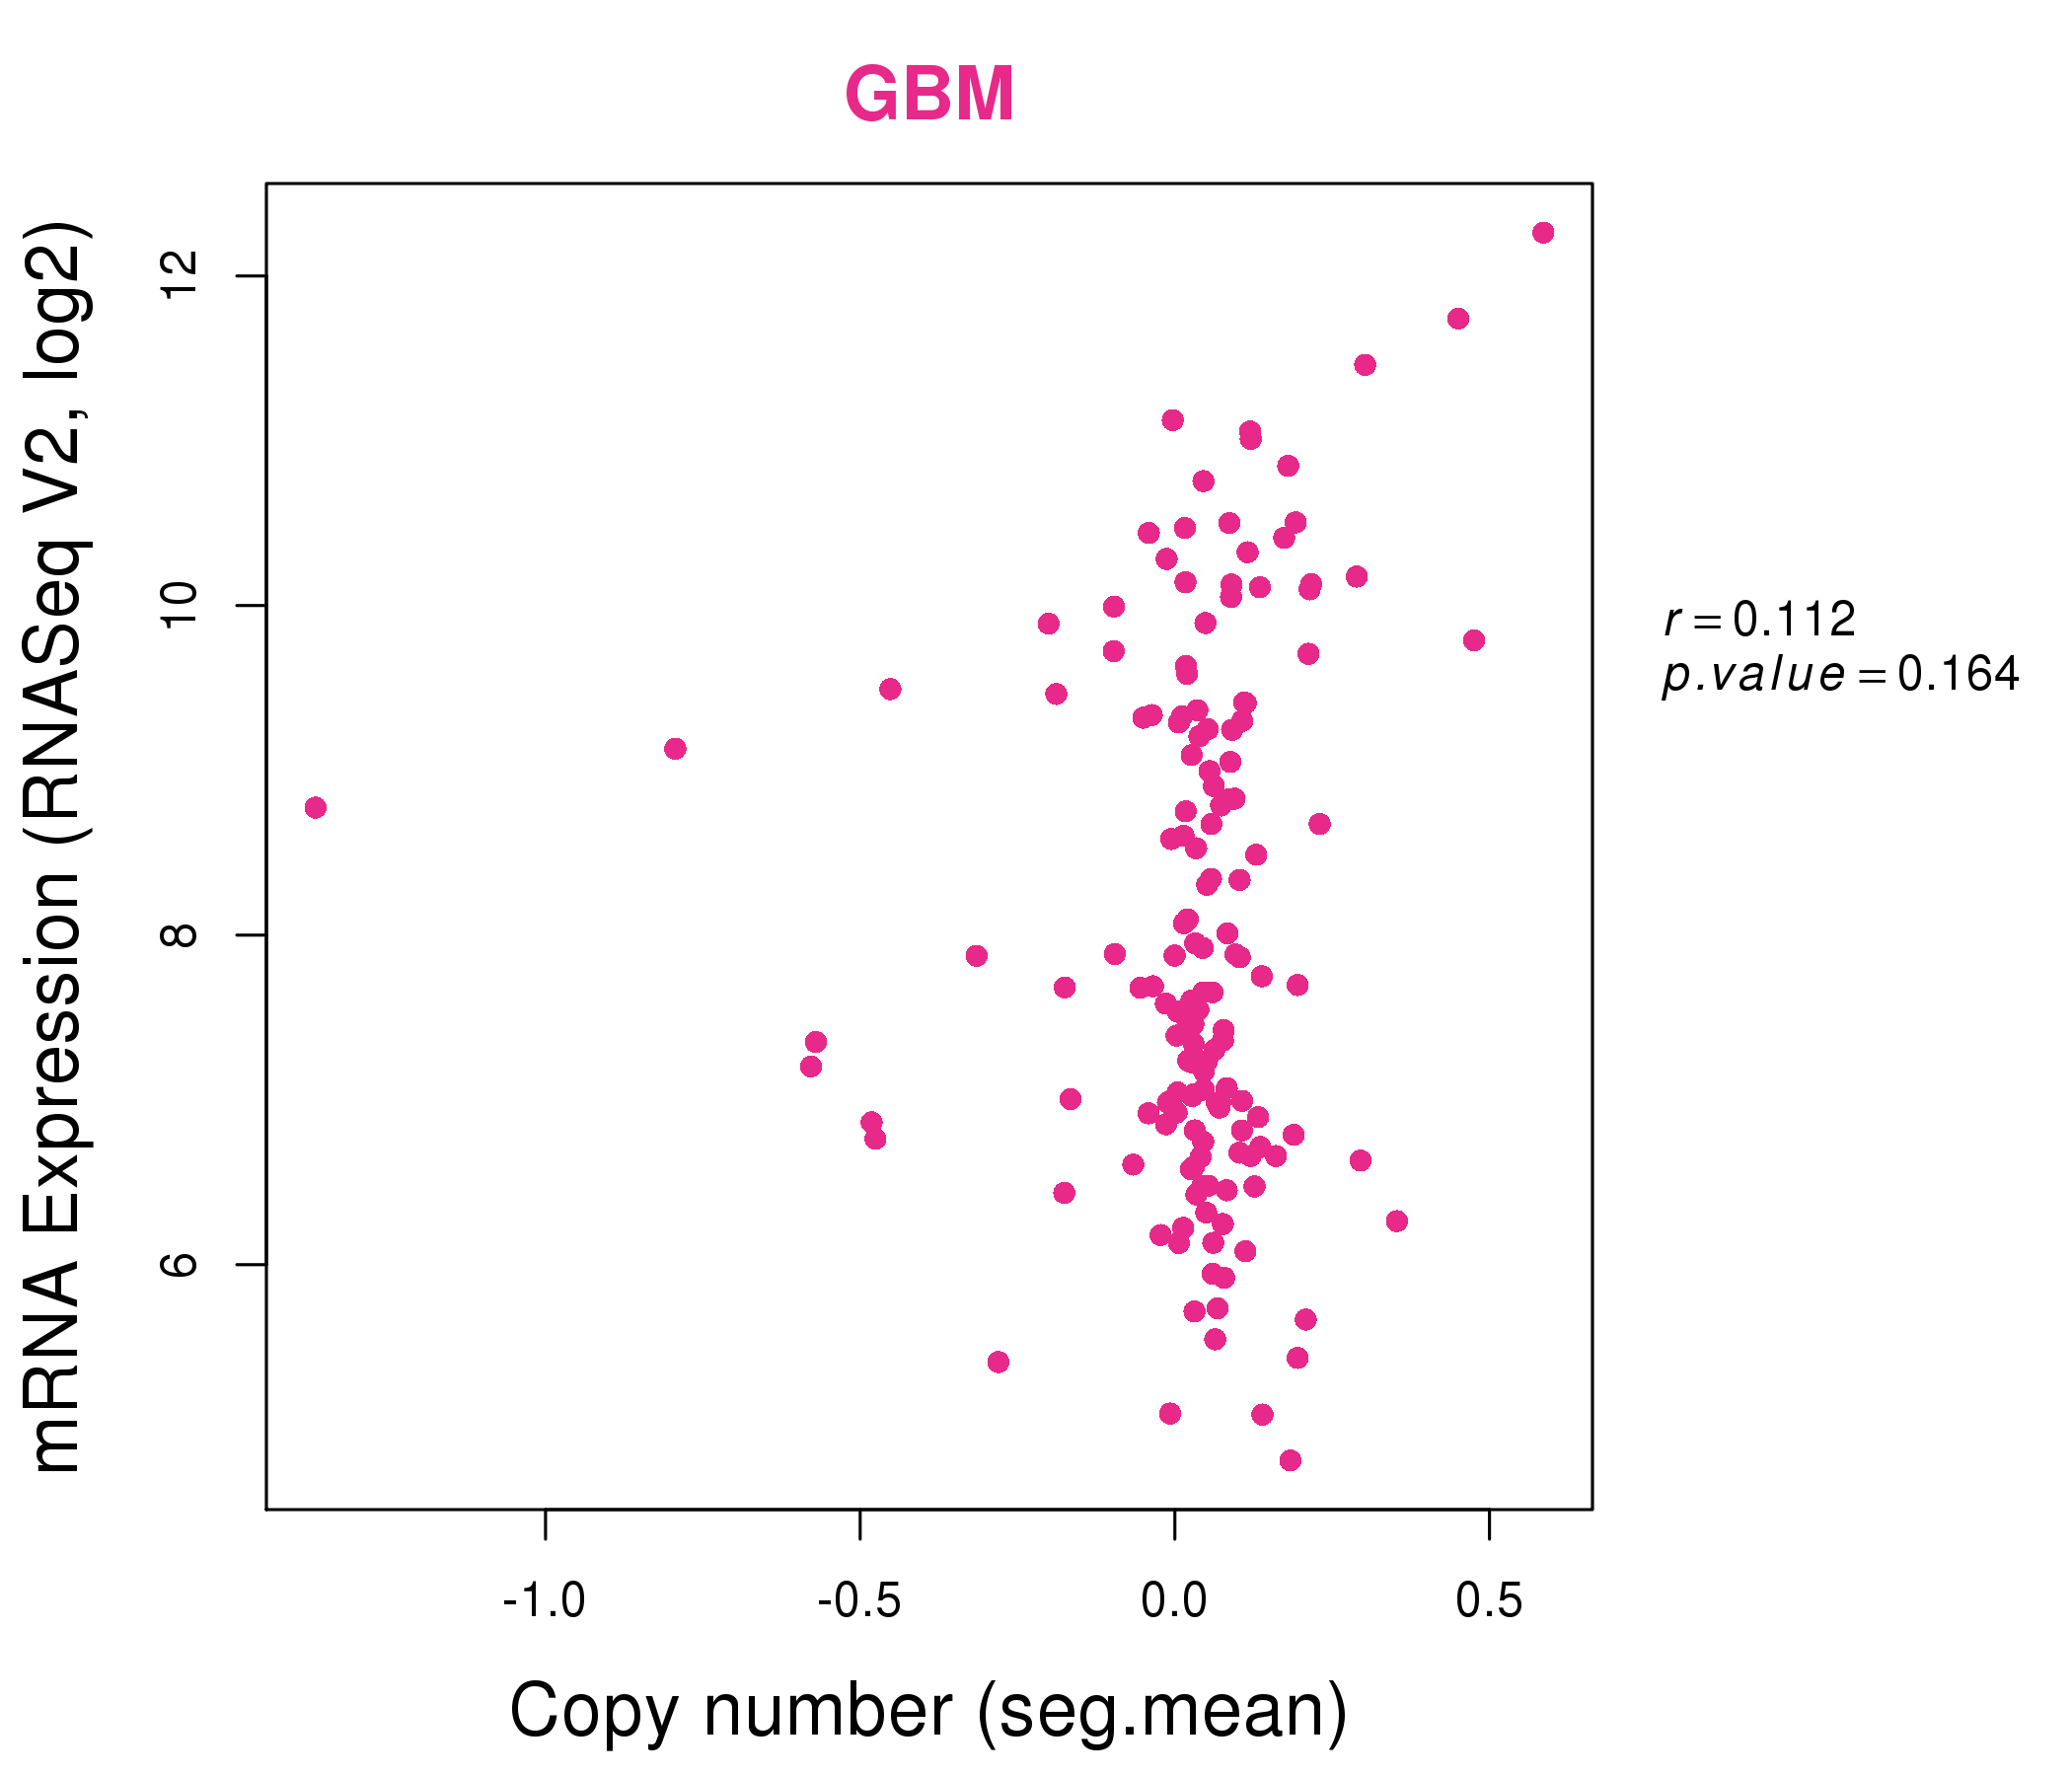
| * Normalized gene expression data of RNASeqV2 was extracted from TCGA using R package TCGA-Assembler. The URLs of all public data files on TCGA DCC data server were gathered at Jan-05-2015. Only eight cancer types have enough normal control samples for differential expression analysis. (t test, adjusted p<0.05 (using Benjamini-Hochberg FDR)) |
 |
| Top |
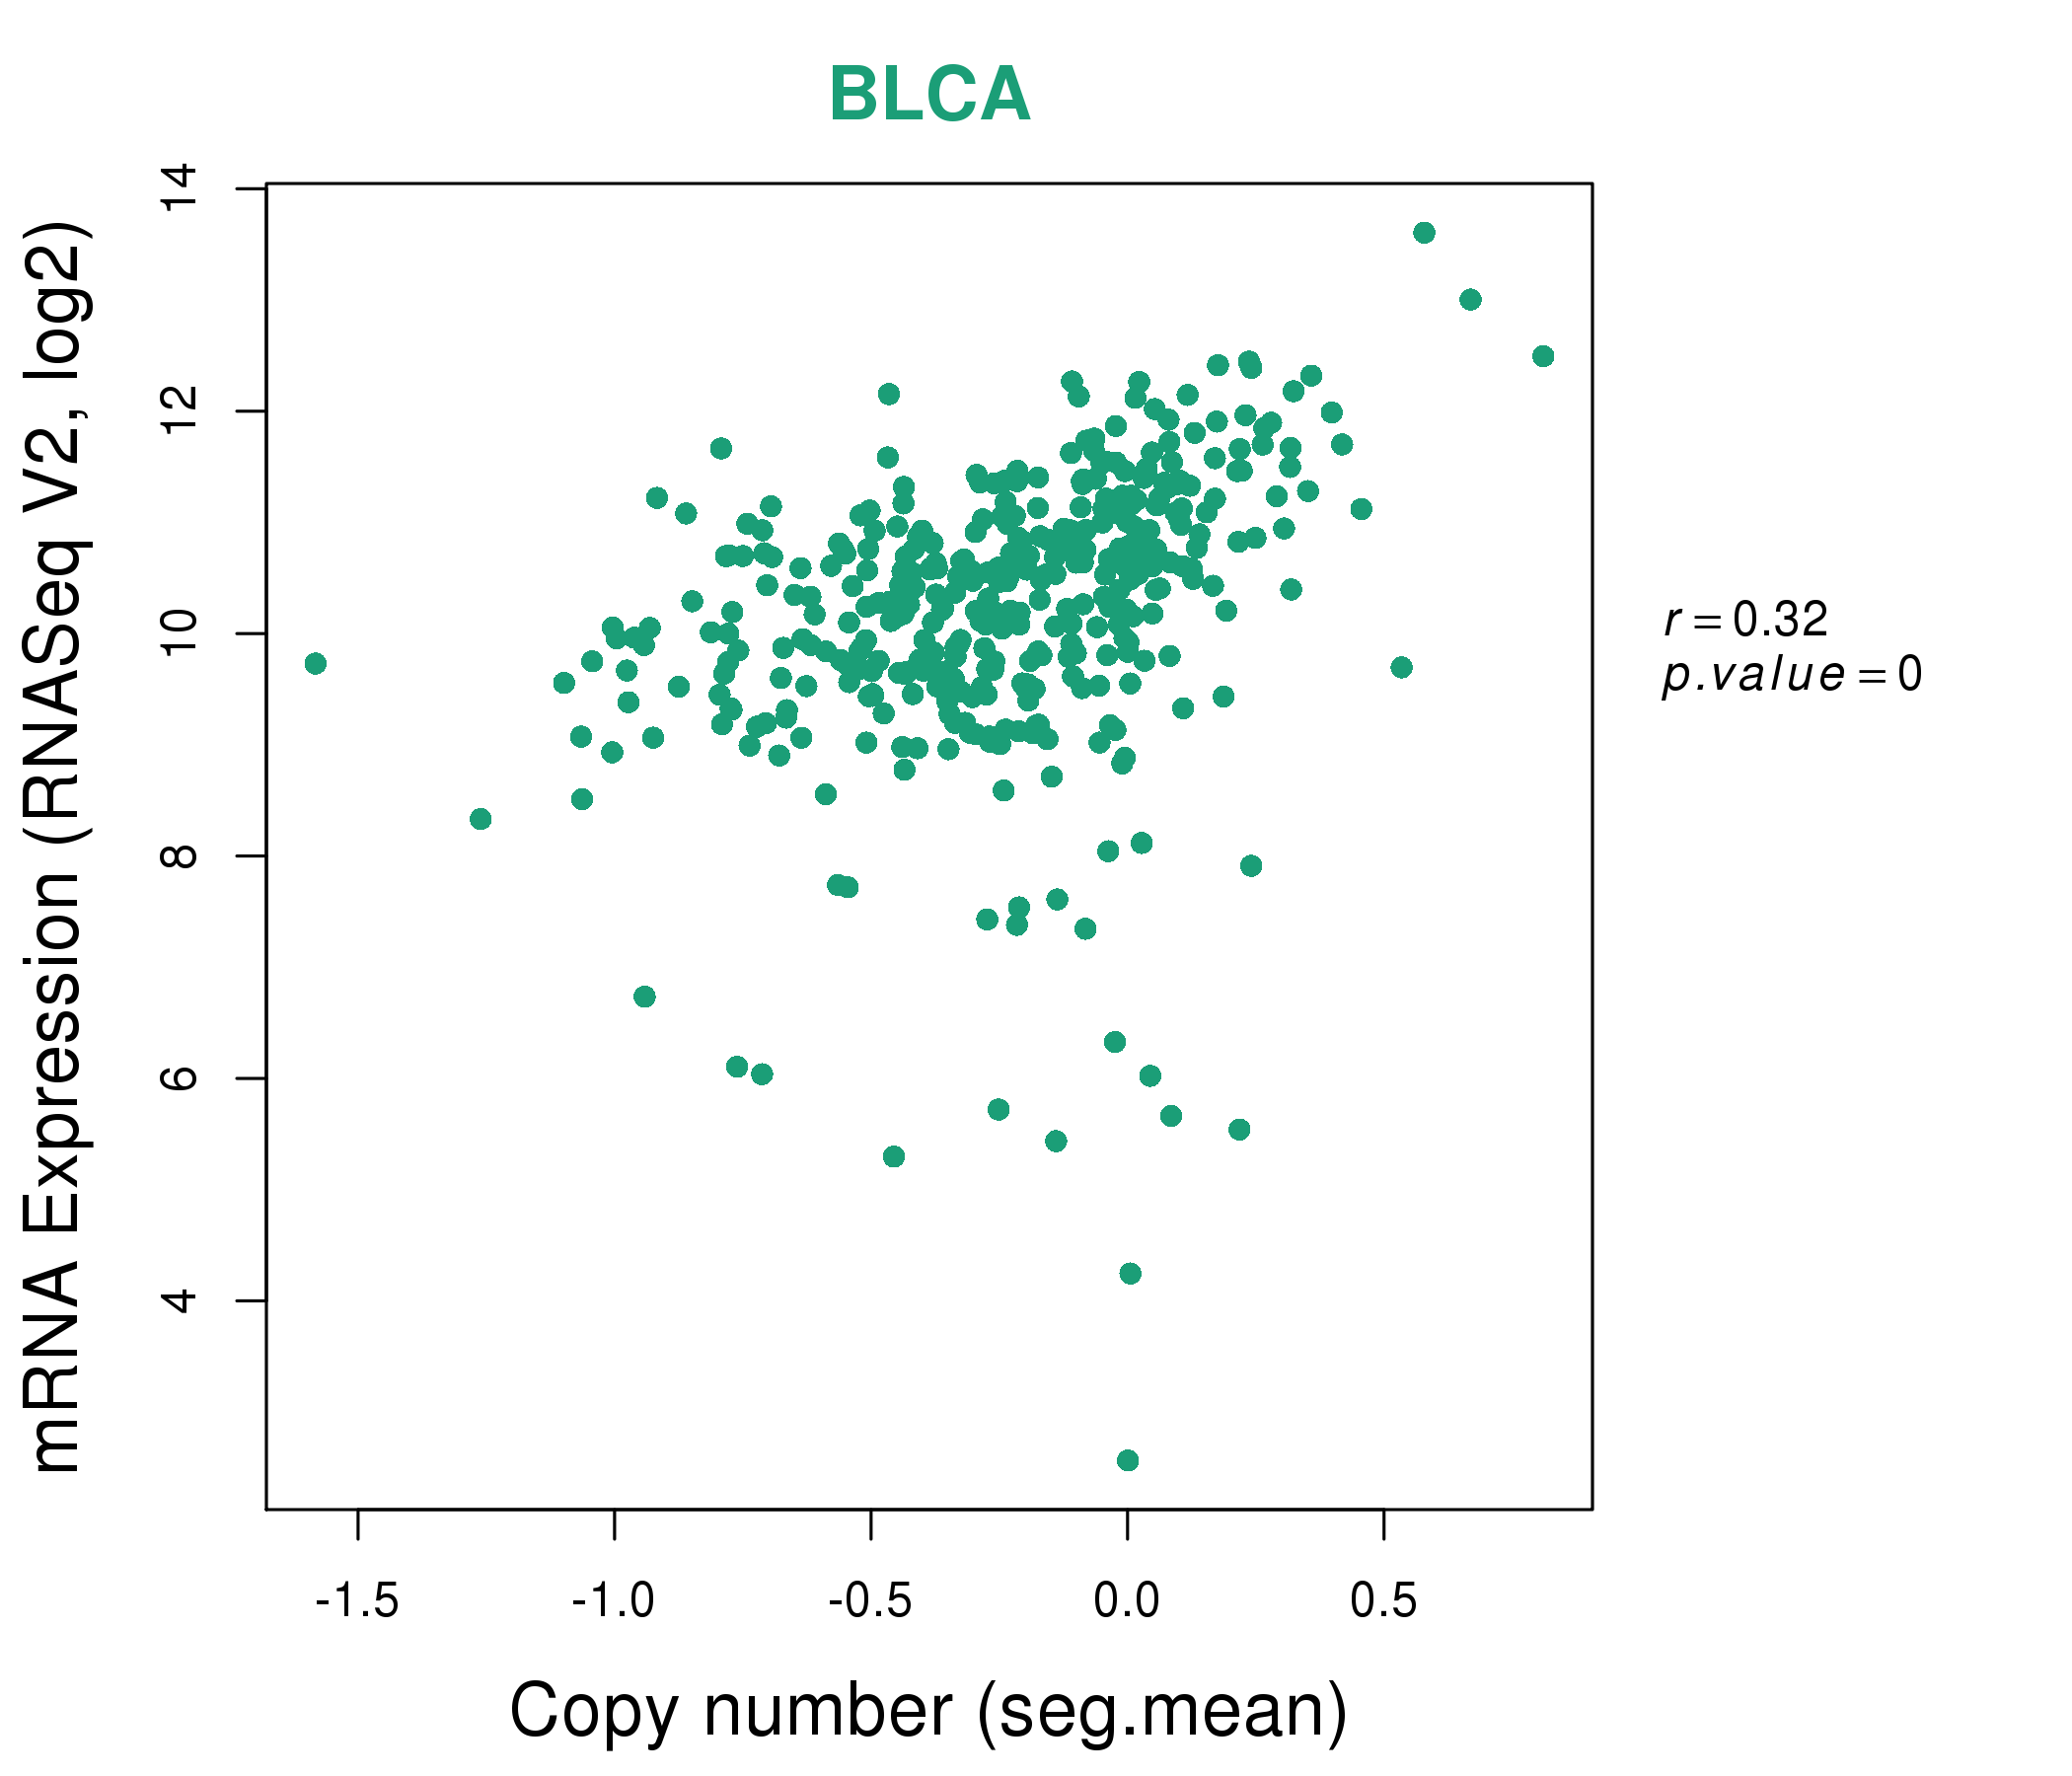
| * This plots show the correlation between CNV and gene expression. |
: Open all plots for all cancer types
 |
|
 |
|
| Top |
| Gene-Gene Network Information |
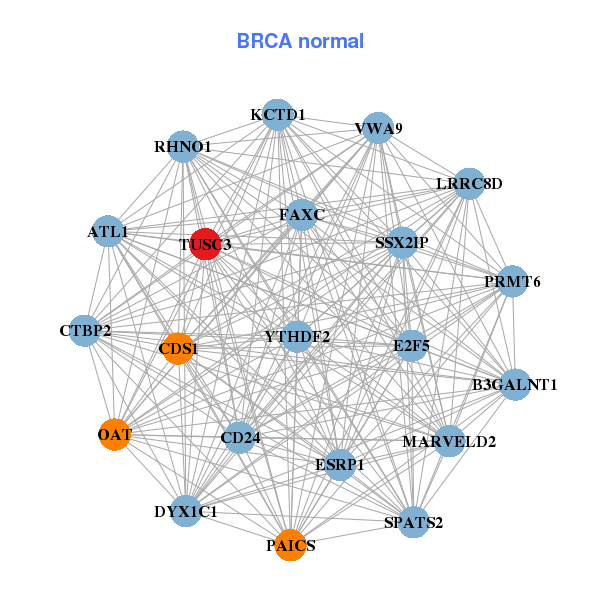
| * Co-Expression network figures were drawn using R package igraph. Only the top 20 genes with the highest correlations were shown. Red circle: input gene, orange circle: cell metabolism gene, sky circle: other gene |
: Open all plots for all cancer types
 |
|
| AGPAT5,C8orf48,C9orf72,CNOT7,EXTL3,INTS10,KCTD9, LONRF1,PBK,PLAA,POLR3D,RAVER2,RRAGA,SCGB1D4, SRSF12,SLC39A14,TUSC3,UGT2A1,VPS37A,XPO7,ZDHHC2 | ATL1,B3GALNT1,RHNO1,VWA9,FAXC,CD24,CDS1, CTBP2,DYX1C1,E2F5,ESRP1,KCTD1,LRRC8D,MARVELD2, OAT,PAICS,PRMT6,SPATS2,SSX2IP,TUSC3,YTHDF2 |
 |
|
| BCL6B,CLEC1A,CNRIP1,DSEL,DZIP1,ECSCR,EFS, ELOVL4,FAM101B,FAM110B,FBXL7,FSTL1,GUCY1B3,KIAA1462, LAMA4,LDB2,LPHN2,THBD,THY1,TRPV2,TUSC3 | AVPR1B,CCDC85A,CFC1B,CPB1,CRH,CYP2W1,FMOD, GABRA6,GPR12,HOXD12,INSL5,KCNK15,LOC440925,PCSK1, RIMS4,SCG5,SLC26A4,TBX4,TNNC1,TPH1,TUSC3 |
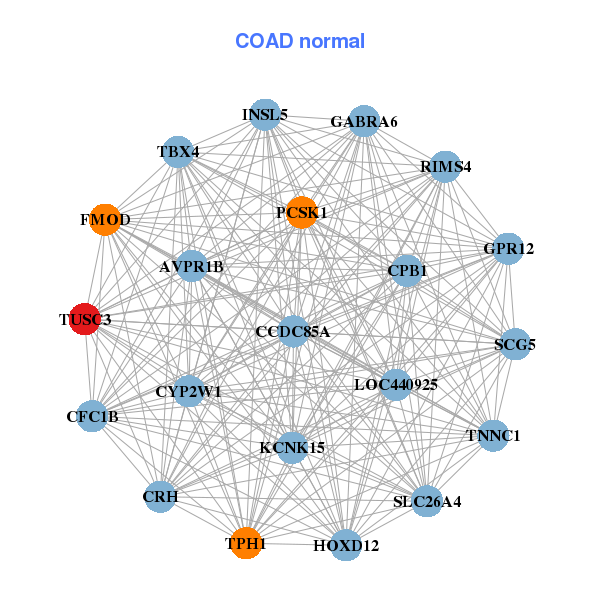
| * Co-Expression network figures were drawn using R package igraph. Only the top 20 genes with the highest correlations were shown. Red circle: input gene, orange circle: cell metabolism gene, sky circle: other gene |
: Open all plots for all cancer types
| Top |
: Open all interacting genes' information including KEGG pathway for all interacting genes from DAVID
| Top |
| Pharmacological Information for TUSC3 |
| There's no related Drug. |
| Top |
| Cross referenced IDs for TUSC3 |
| * We obtained these cross-references from Uniprot database. It covers 150 different DBs, 18 categories. http://www.uniprot.org/help/cross_references_section |
: Open all cross reference information
|
Copyright © 2016-Present - The Univsersity of Texas Health Science Center at Houston @ |