|
||||||||||||||||||||||||||||||||||||||||||||||||||||||||||||||||||||||||||||||||||||||||||||||||||||||||||||||||||||||||||||||||||||||||||||||||||||||||||||||||||||||||||||||||||||||||||||||||||||||||||||||||||||||||||||||||||||||||||||||||||||||||||||||||||||||||||||||||||||||||||||||||||||||||||||||||||||||||||
| |
| Phenotypic Information (metabolism pathway, cancer, disease, phenome) |
| |
| |
| Gene-Gene Network Information: Co-Expression Network, Interacting Genes & KEGG |
| |
|


| Gene Summary for L2HGDH |
| Basic gene info. | Gene symbol | L2HGDH |
| Gene name | L-2-hydroxyglutarate dehydrogenase | |
| Synonyms | C14orf160 | |
| Cytomap | UCSC genome browser: 14q21.3 | |
| Genomic location | chr14 :50709151-50778947 | |
| Type of gene | protein-coding | |
| RefGenes | NM_024884.2, | |
| Ensembl id | ENSG00000087299 | |
| Description | 2-hydroxyglutarate dehydrogenaseL-2-hydroxyglutarate dehydrogenase, mitochondrialL-alpha-hydroxyglutarate dehydrogenasealpha-hydroxyglutarate oxidoreductasealpha-ketoglutarate reductaseduranin | |
| Modification date | 20141207 | |
| dbXrefs | MIM : 609584 | |
| HGNC : HGNC | ||
| Ensembl : ENSG00000087299 | ||
| HPRD : 12640 | ||
| Vega : OTTHUMG00000140289 | ||
| Protein | UniProt: go to UniProt's Cross Reference DB Table | |
| Expression | CleanEX: HS_L2HGDH | |
| BioGPS: 79944 | ||
| Gene Expression Atlas: ENSG00000087299 | ||
| The Human Protein Atlas: ENSG00000087299 | ||
| Pathway | NCI Pathway Interaction Database: L2HGDH | |
| KEGG: L2HGDH | ||
| REACTOME: L2HGDH | ||
| ConsensusPathDB | ||
| Pathway Commons: L2HGDH | ||
| Metabolism | MetaCyc: L2HGDH | |
| HUMANCyc: L2HGDH | ||
| Regulation | Ensembl's Regulation: ENSG00000087299 | |
| miRBase: chr14 :50,709,151-50,778,947 | ||
| TargetScan: NM_024884 | ||
| cisRED: ENSG00000087299 | ||
| Context | iHOP: L2HGDH | |
| cancer metabolism search in PubMed: L2HGDH | ||
| UCL Cancer Institute: L2HGDH | ||
| Assigned class in ccmGDB | C | |
| Top |
| Phenotypic Information for L2HGDH(metabolism pathway, cancer, disease, phenome) |
| Cancer | CGAP: L2HGDH |
| Familial Cancer Database: L2HGDH | |
| * This gene is included in those cancer gene databases. |
|
|
|
|
|
| . | ||||||||||||||||||||||||||||||||||||||||||||||||||||||||||||||||||||||||||||||||||||||||||||||||||||||||||||||||||||||||||||||||||||||||||||||||||||||||||||||||||||||||||||||||||||||||||||||||||||||||||||||||||||||||||||||||||||||||||||||||||||||||||||||||||||||||||||||||||||||||||||||||||||||||||||||||||||
Oncogene 1 | Significant driver gene in | |||||||||||||||||||||||||||||||||||||||||||||||||||||||||||||||||||||||||||||||||||||||||||||||||||||||||||||||||||||||||||||||||||||||||||||||||||||||||||||||||||||||||||||||||||||||||||||||||||||||||||||||||||||||||||||||||||||||||||||||||||||||||||||||||||||||||||||||||||||||||||||||||||||||||||||||||||||||||
| cf) number; DB name 1 Oncogene; http://nar.oxfordjournals.org/content/35/suppl_1/D721.long, 2 Tumor Suppressor gene; https://bioinfo.uth.edu/TSGene/, 3 Cancer Gene Census; http://www.nature.com/nrc/journal/v4/n3/abs/nrc1299.html, 4 CancerGenes; http://nar.oxfordjournals.org/content/35/suppl_1/D721.long, 5 Network of Cancer Gene; http://ncg.kcl.ac.uk/index.php, 1Therapeutic Vulnerabilities in Cancer; http://cbio.mskcc.org/cancergenomics/statius/ |
| KEGG_BUTANOATE_METABOLISM REACTOME_PYRUVATE_METABOLISM_AND_CITRIC_ACID_TCA_CYCLE | |
| OMIM | |
| Orphanet | |
| Disease | KEGG Disease: L2HGDH |
| MedGen: L2HGDH (Human Medical Genetics with Condition) | |
| ClinVar: L2HGDH | |
| Phenotype | MGI: L2HGDH (International Mouse Phenotyping Consortium) |
| PhenomicDB: L2HGDH | |
| Mutations for L2HGDH |
| * Under tables are showing count per each tissue to give us broad intuition about tissue specific mutation patterns.You can go to the detailed page for each mutation database's web site. |
| - Statistics for Tissue and Mutation type | Top |
 |
| - For Inter-chromosomal Variations |
| There's no inter-chromosomal structural variation. |
| - For Intra-chromosomal Variations |
| * Intra-chromosomal variantions includes 'intrachromosomal amplicon to amplicon', 'intrachromosomal amplicon to non-amplified dna', 'intrachromosomal deletion', 'intrachromosomal fold-back inversion', 'intrachromosomal inversion', 'intrachromosomal tandem duplication', 'Intrachromosomal unknown type', 'intrachromosomal with inverted orientation', 'intrachromosomal with non-inverted orientation'. |
 |
| Sample | Symbol_a | Chr_a | Start_a | End_a | Symbol_b | Chr_b | Start_b | End_b |
| ovary | L2HGDH | chr14 | 50718444 | 50718464 | L2HGDH | chr14 | 50719361 | 50719381 |
| ovary | L2HGDH | chr14 | 50718444 | 50718464 | L2HGDH | chr14 | 50719363 | 50719383 |
| ovary | L2HGDH | chr14 | 50770751 | 50770771 | L2HGDH | chr14 | 50762106 | 50762126 |
| cf) Tissue number; Tissue name (1;Breast, 2;Central_nervous_system, 3;Haematopoietic_and_lymphoid_tissue, 4;Large_intestine, 5;Liver, 6;Lung, 7;Ovary, 8;Pancreas, 9;Prostate, 10;Skin, 11;Soft_tissue, 12;Upper_aerodigestive_tract) |
| * From mRNA Sanger sequences, Chitars2.0 arranged chimeric transcripts. This table shows L2HGDH related fusion information. |
| ID | Head Gene | Tail Gene | Accession | Gene_a | qStart_a | qEnd_a | Chromosome_a | tStart_a | tEnd_a | Gene_a | qStart_a | qEnd_a | Chromosome_a | tStart_a | tEnd_a |
| BE908214 | L2HGDH | 1 | 315 | 14 | 50712522 | 50712835 | KRT19 | 309 | 362 | 17 | 39679869 | 39679922 | |
| DA137061 | L2HGDH | 1 | 68 | 14 | 50712199 | 50712266 | MBP | 68 | 519 | 18 | 74696800 | 74729012 | |
| AF335584 | L2HGDH | 1 | 100 | 14 | 50710170 | 50710269 | PDGFD | 99 | 1828 | 11 | 103779888 | 104034738 | |
| AW300486 | L2HGDH | 1 | 343 | 14 | 50712259 | 50712601 | KIAA1191 | 339 | 456 | 5 | 175774557 | 175774674 | |
| Top |
| Mutation type/ Tissue ID | brca | cns | cerv | endome | haematopo | kidn | Lintest | liver | lung | ns | ovary | pancre | prost | skin | stoma | thyro | urina | |||
| Total # sample | 1 | 1 | ||||||||||||||||||
| GAIN (# sample) | 1 | |||||||||||||||||||
| LOSS (# sample) | 1 |
| cf) Tissue ID; Tissue type (1; Breast, 2; Central_nervous_system, 3; Cervix, 4; Endometrium, 5; Haematopoietic_and_lymphoid_tissue, 6; Kidney, 7; Large_intestine, 8; Liver, 9; Lung, 10; NS, 11; Ovary, 12; Pancreas, 13; Prostate, 14; Skin, 15; Stomach, 16; Thyroid, 17; Urinary_tract) |
| Top |
|
 |
| Top |
| Stat. for Non-Synonymous SNVs (# total SNVs=32) | (# total SNVs=6) |
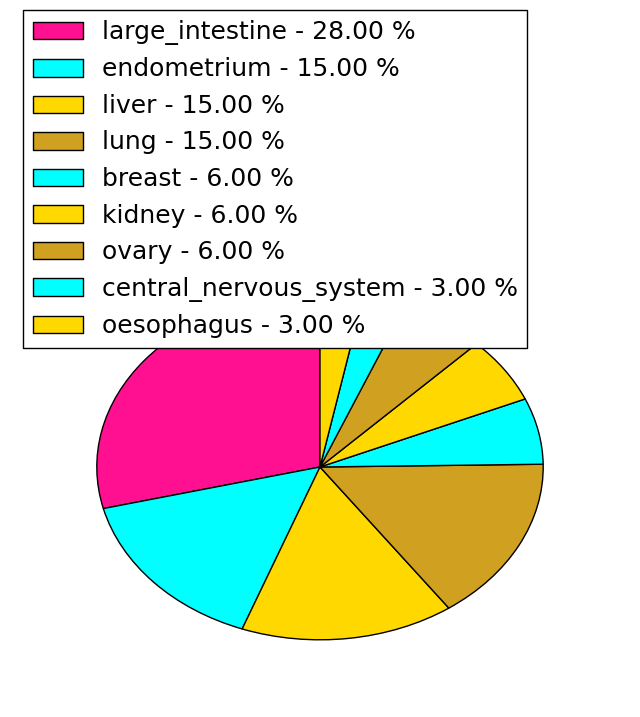 | 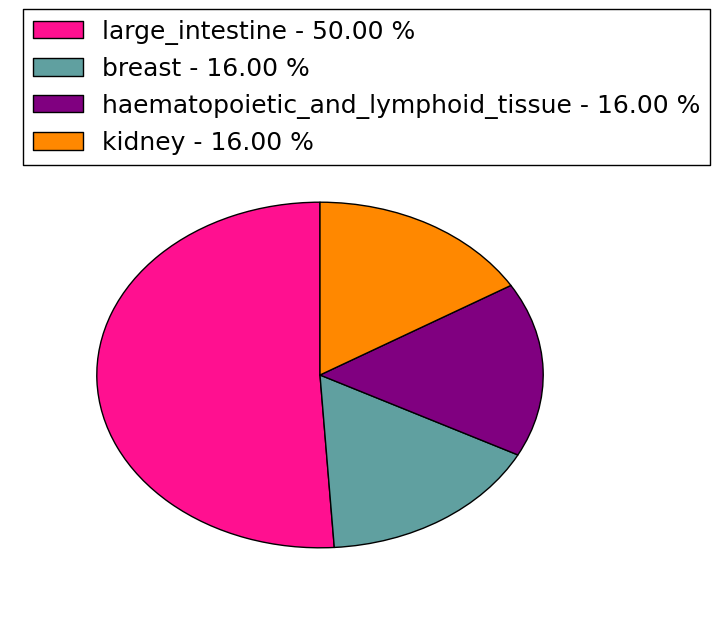 |
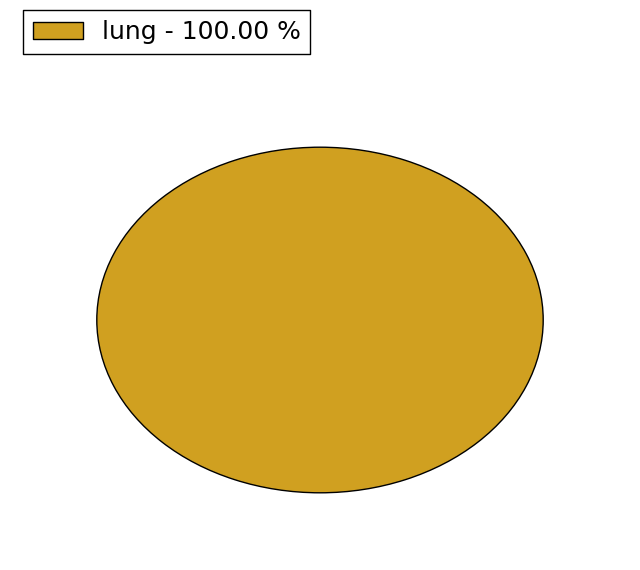
(# total SNVs=1) | (# total SNVs=0) |
 |
| Top |
| * When you move the cursor on each content, you can see more deailed mutation information on the Tooltip. Those are primary_site,primary_histology,mutation(aa),pubmedID. |
| GRCh37 position | Mutation(aa) | Unique sampleID count |
| chr14:50778816-50778816 | p.L18R | 5 |
| chr14:50750699-50750699 | p.V198G | 3 |
| chr14:50760867-50760867 | p.Q169L | 2 |
| chr14:50736035-50736035 | p.R251P | 2 |
| chr14:50713876-50713876 | p.R431H | 2 |
| chr14:50732175-50732175 | p.S366F | 2 |
| chr14:50734547-50734547 | p.V330I | 1 |
| chr14:50736014-50736014 | p.C258Y | 1 |
| chr14:50713819-50713819 | p.S450F | 1 |
| chr14:50778849-50778849 | p.Y7C | 1 |
| Top |
|
 |
| Point Mutation/ Tissue ID | 1 | 2 | 3 | 4 | 5 | 6 | 7 | 8 | 9 | 10 | 11 | 12 | 13 | 14 | 15 | 16 | 17 | 18 | 19 | 20 |
| # sample | 1 | 3 | 3 | 1 | 5 | 2 | 4 | 3 | 4 | |||||||||||
| # mutation | 1 | 3 | 3 | 1 | 5 | 2 | 4 | 3 | 4 | |||||||||||
| nonsynonymous SNV | 1 | 2 | 3 | 1 | 4 | 2 | 3 | 1 | 4 | |||||||||||
| synonymous SNV | 1 | 1 | 1 | 2 |
| cf) Tissue ID; Tissue type (1; BLCA[Bladder Urothelial Carcinoma], 2; BRCA[Breast invasive carcinoma], 3; CESC[Cervical squamous cell carcinoma and endocervical adenocarcinoma], 4; COAD[Colon adenocarcinoma], 5; GBM[Glioblastoma multiforme], 6; Glioma Low Grade, 7; HNSC[Head and Neck squamous cell carcinoma], 8; KICH[Kidney Chromophobe], 9; KIRC[Kidney renal clear cell carcinoma], 10; KIRP[Kidney renal papillary cell carcinoma], 11; LAML[Acute Myeloid Leukemia], 12; LUAD[Lung adenocarcinoma], 13; LUSC[Lung squamous cell carcinoma], 14; OV[Ovarian serous cystadenocarcinoma ], 15; PAAD[Pancreatic adenocarcinoma], 16; PRAD[Prostate adenocarcinoma], 17; SKCM[Skin Cutaneous Melanoma], 18:STAD[Stomach adenocarcinoma], 19:THCA[Thyroid carcinoma], 20:UCEC[Uterine Corpus Endometrial Carcinoma]) |
| Top |
| * We represented just top 10 SNVs. When you move the cursor on each content, you can see more deailed mutation information on the Tooltip. Those are primary_site, primary_histology, mutation(aa), pubmedID. |
| Genomic Position | Mutation(aa) | Unique sampleID count |
| chr14:50713876 | p.R251P | 2 |
| chr14:50736035 | p.R431H | 2 |
| chr14:50734574 | p.R265H | 1 |
| chr14:50760887 | p.X464X | 1 |
| chr14:50713777 | p.V255L | 1 |
| chr14:50734600 | p.S450F | 1 |
| chr14:50760895 | p.E223K | 1 |
| chr14:50713819 | p.E417K | 1 |
| chr14:50735964 | p.F206F | 1 |
| chr14:50769692 | p.Q169L | 1 |
| * Copy number data were extracted from TCGA using R package TCGA-Assembler. The URLs of all public data files on TCGA DCC data server were gathered on Jan-05-2015. Function ProcessCNAData in TCGA-Assembler package was used to obtain gene-level copy number value which is calculated as the average copy number of the genomic region of a gene. |
 |
| cf) Tissue ID[Tissue type]: BLCA[Bladder Urothelial Carcinoma], BRCA[Breast invasive carcinoma], CESC[Cervical squamous cell carcinoma and endocervical adenocarcinoma], COAD[Colon adenocarcinoma], GBM[Glioblastoma multiforme], Glioma Low Grade, HNSC[Head and Neck squamous cell carcinoma], KICH[Kidney Chromophobe], KIRC[Kidney renal clear cell carcinoma], KIRP[Kidney renal papillary cell carcinoma], LAML[Acute Myeloid Leukemia], LUAD[Lung adenocarcinoma], LUSC[Lung squamous cell carcinoma], OV[Ovarian serous cystadenocarcinoma ], PAAD[Pancreatic adenocarcinoma], PRAD[Prostate adenocarcinoma], SKCM[Skin Cutaneous Melanoma], STAD[Stomach adenocarcinoma], THCA[Thyroid carcinoma], UCEC[Uterine Corpus Endometrial Carcinoma] |
| Top |
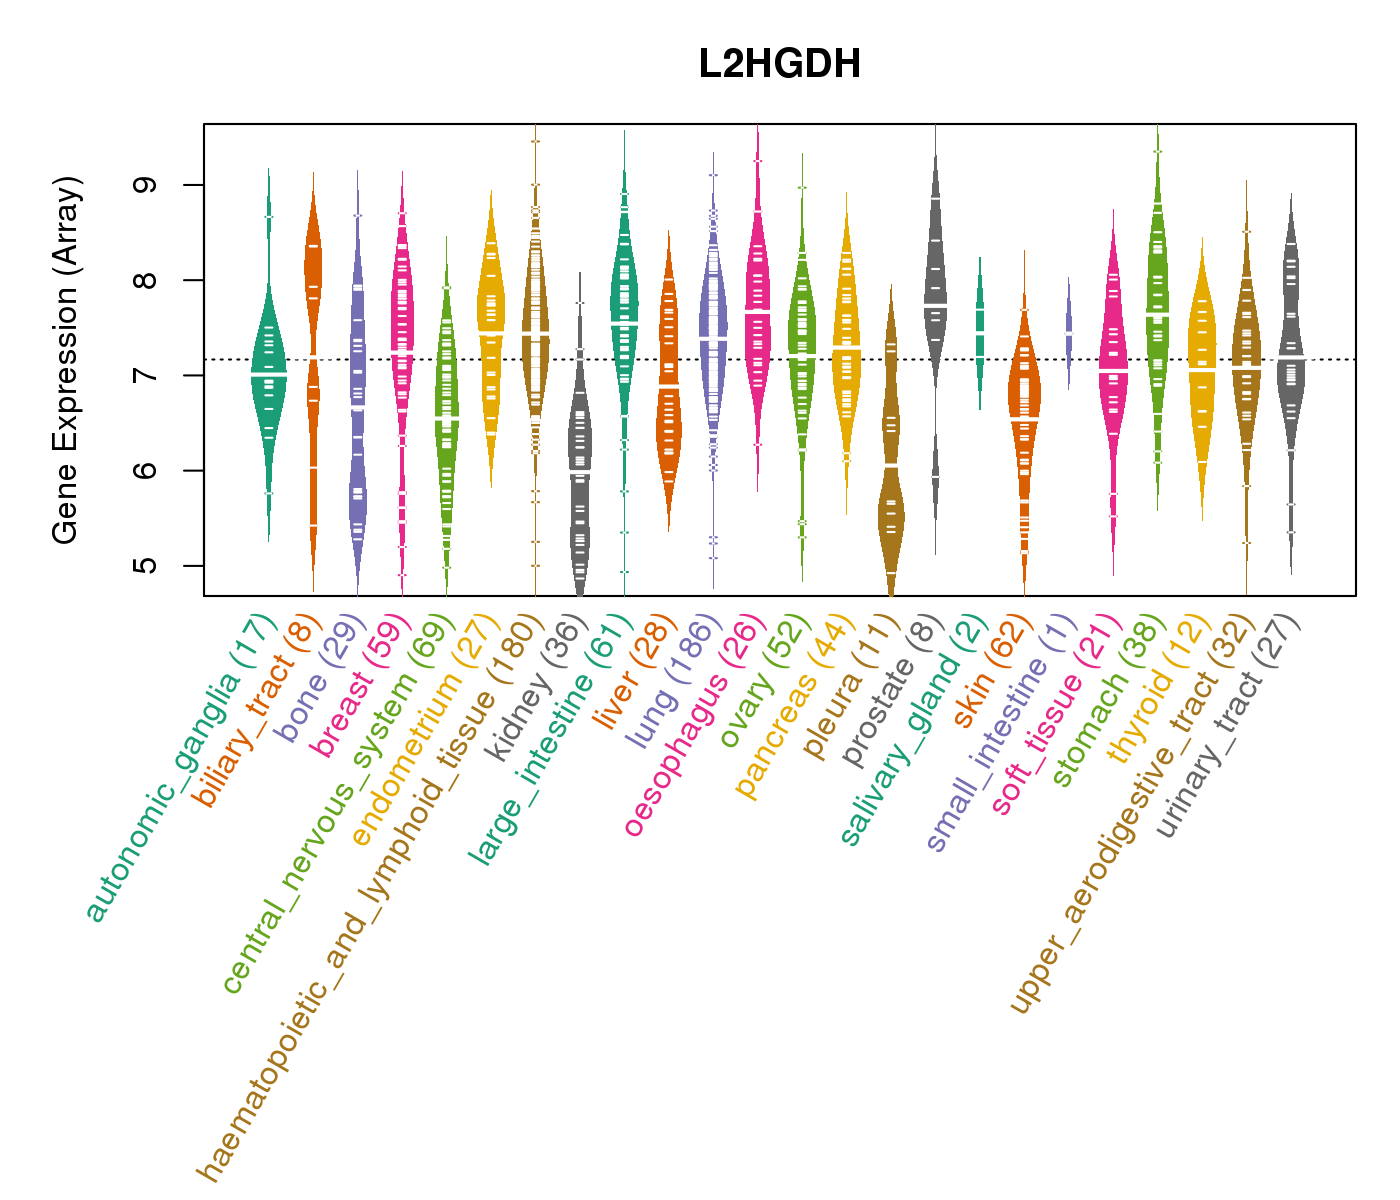
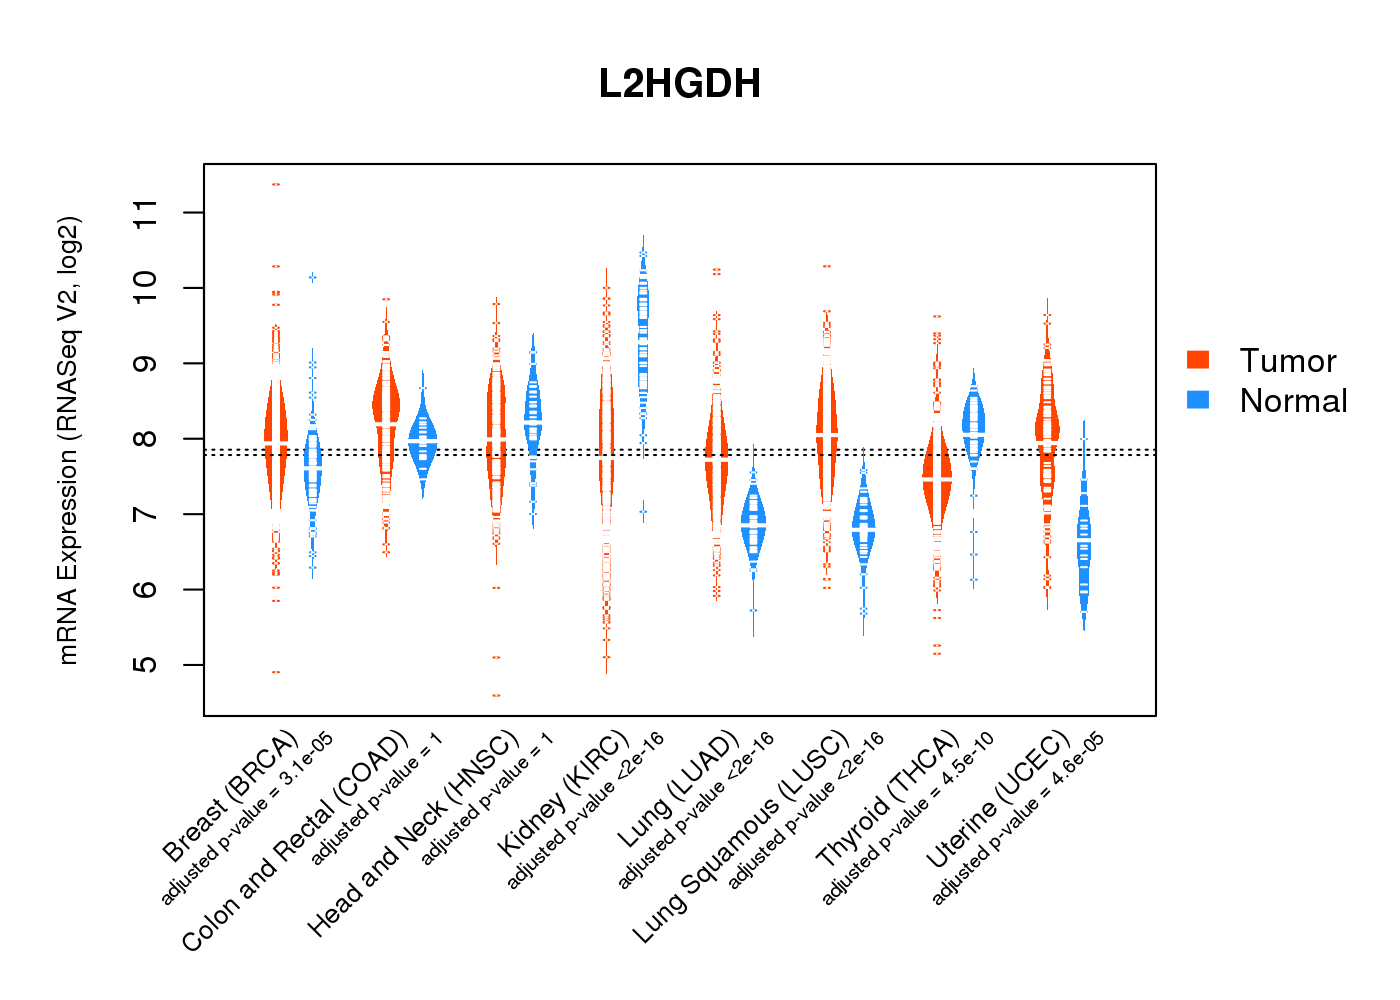
| Gene Expression for L2HGDH |
| * CCLE gene expression data were extracted from CCLE_Expression_Entrez_2012-10-18.res: Gene-centric RMA-normalized mRNA expression data. |
 |
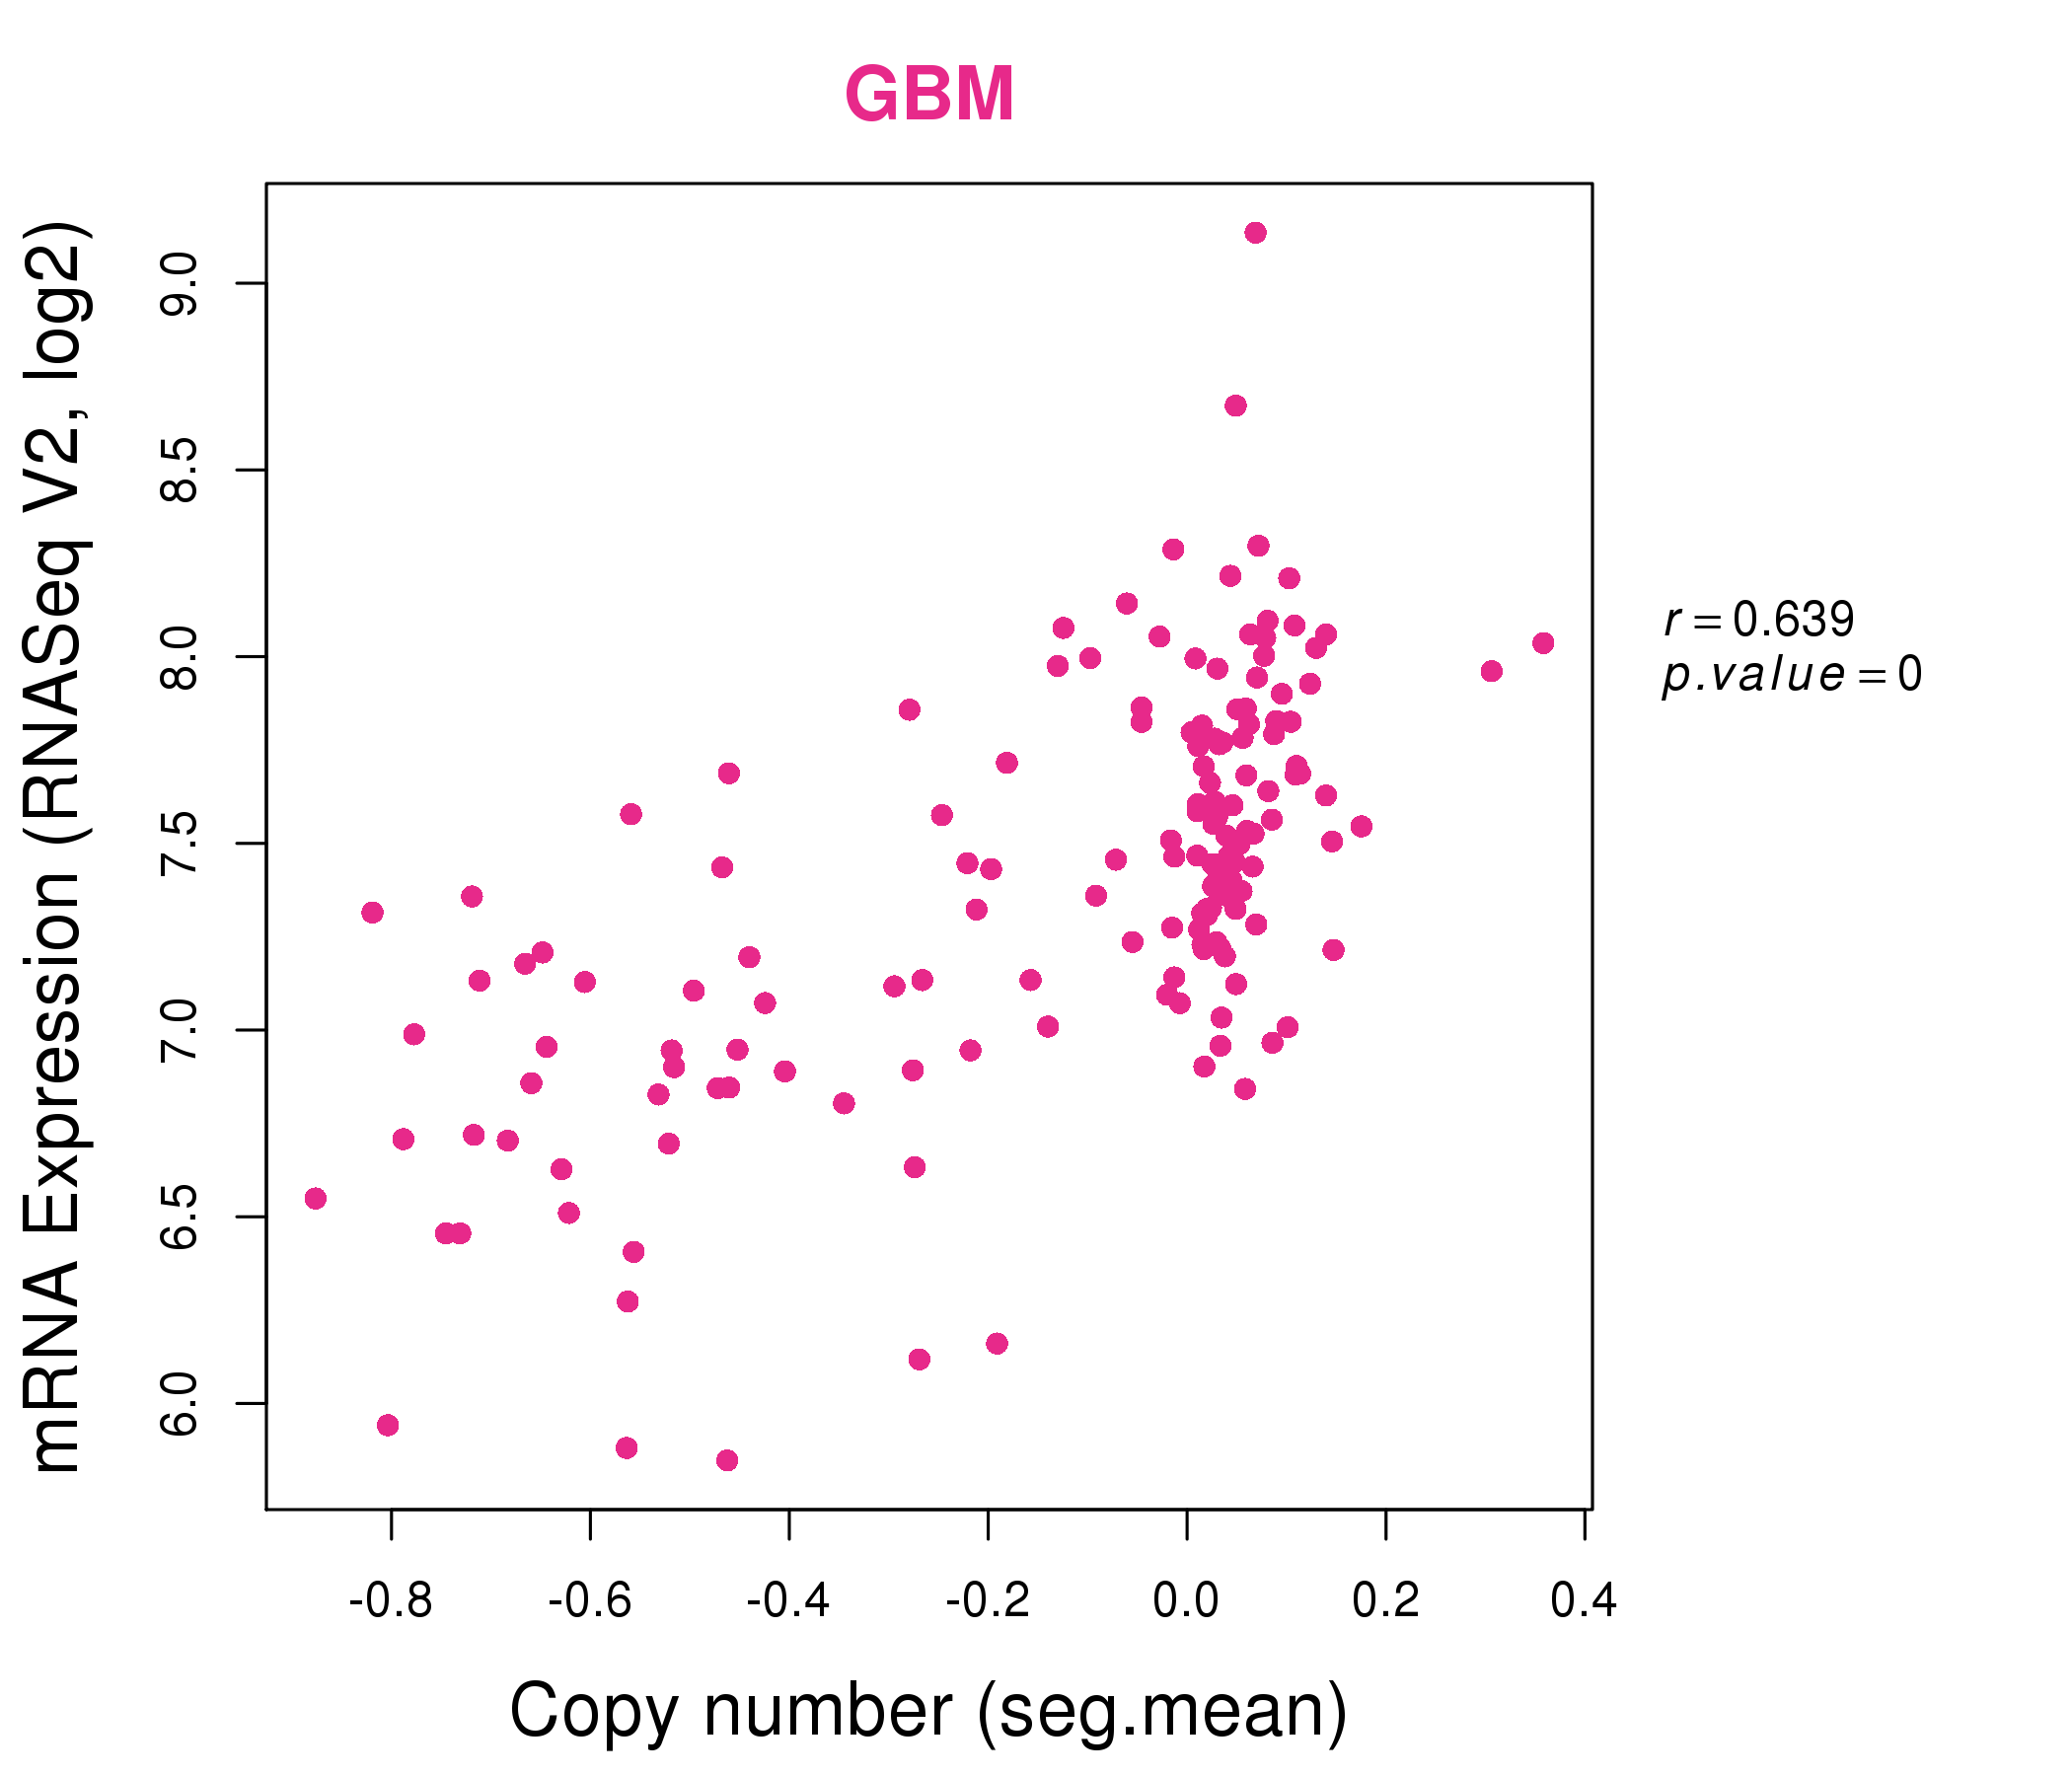
| * Normalized gene expression data of RNASeqV2 was extracted from TCGA using R package TCGA-Assembler. The URLs of all public data files on TCGA DCC data server were gathered at Jan-05-2015. Only eight cancer types have enough normal control samples for differential expression analysis. (t test, adjusted p<0.05 (using Benjamini-Hochberg FDR)) |
 |
| Top |
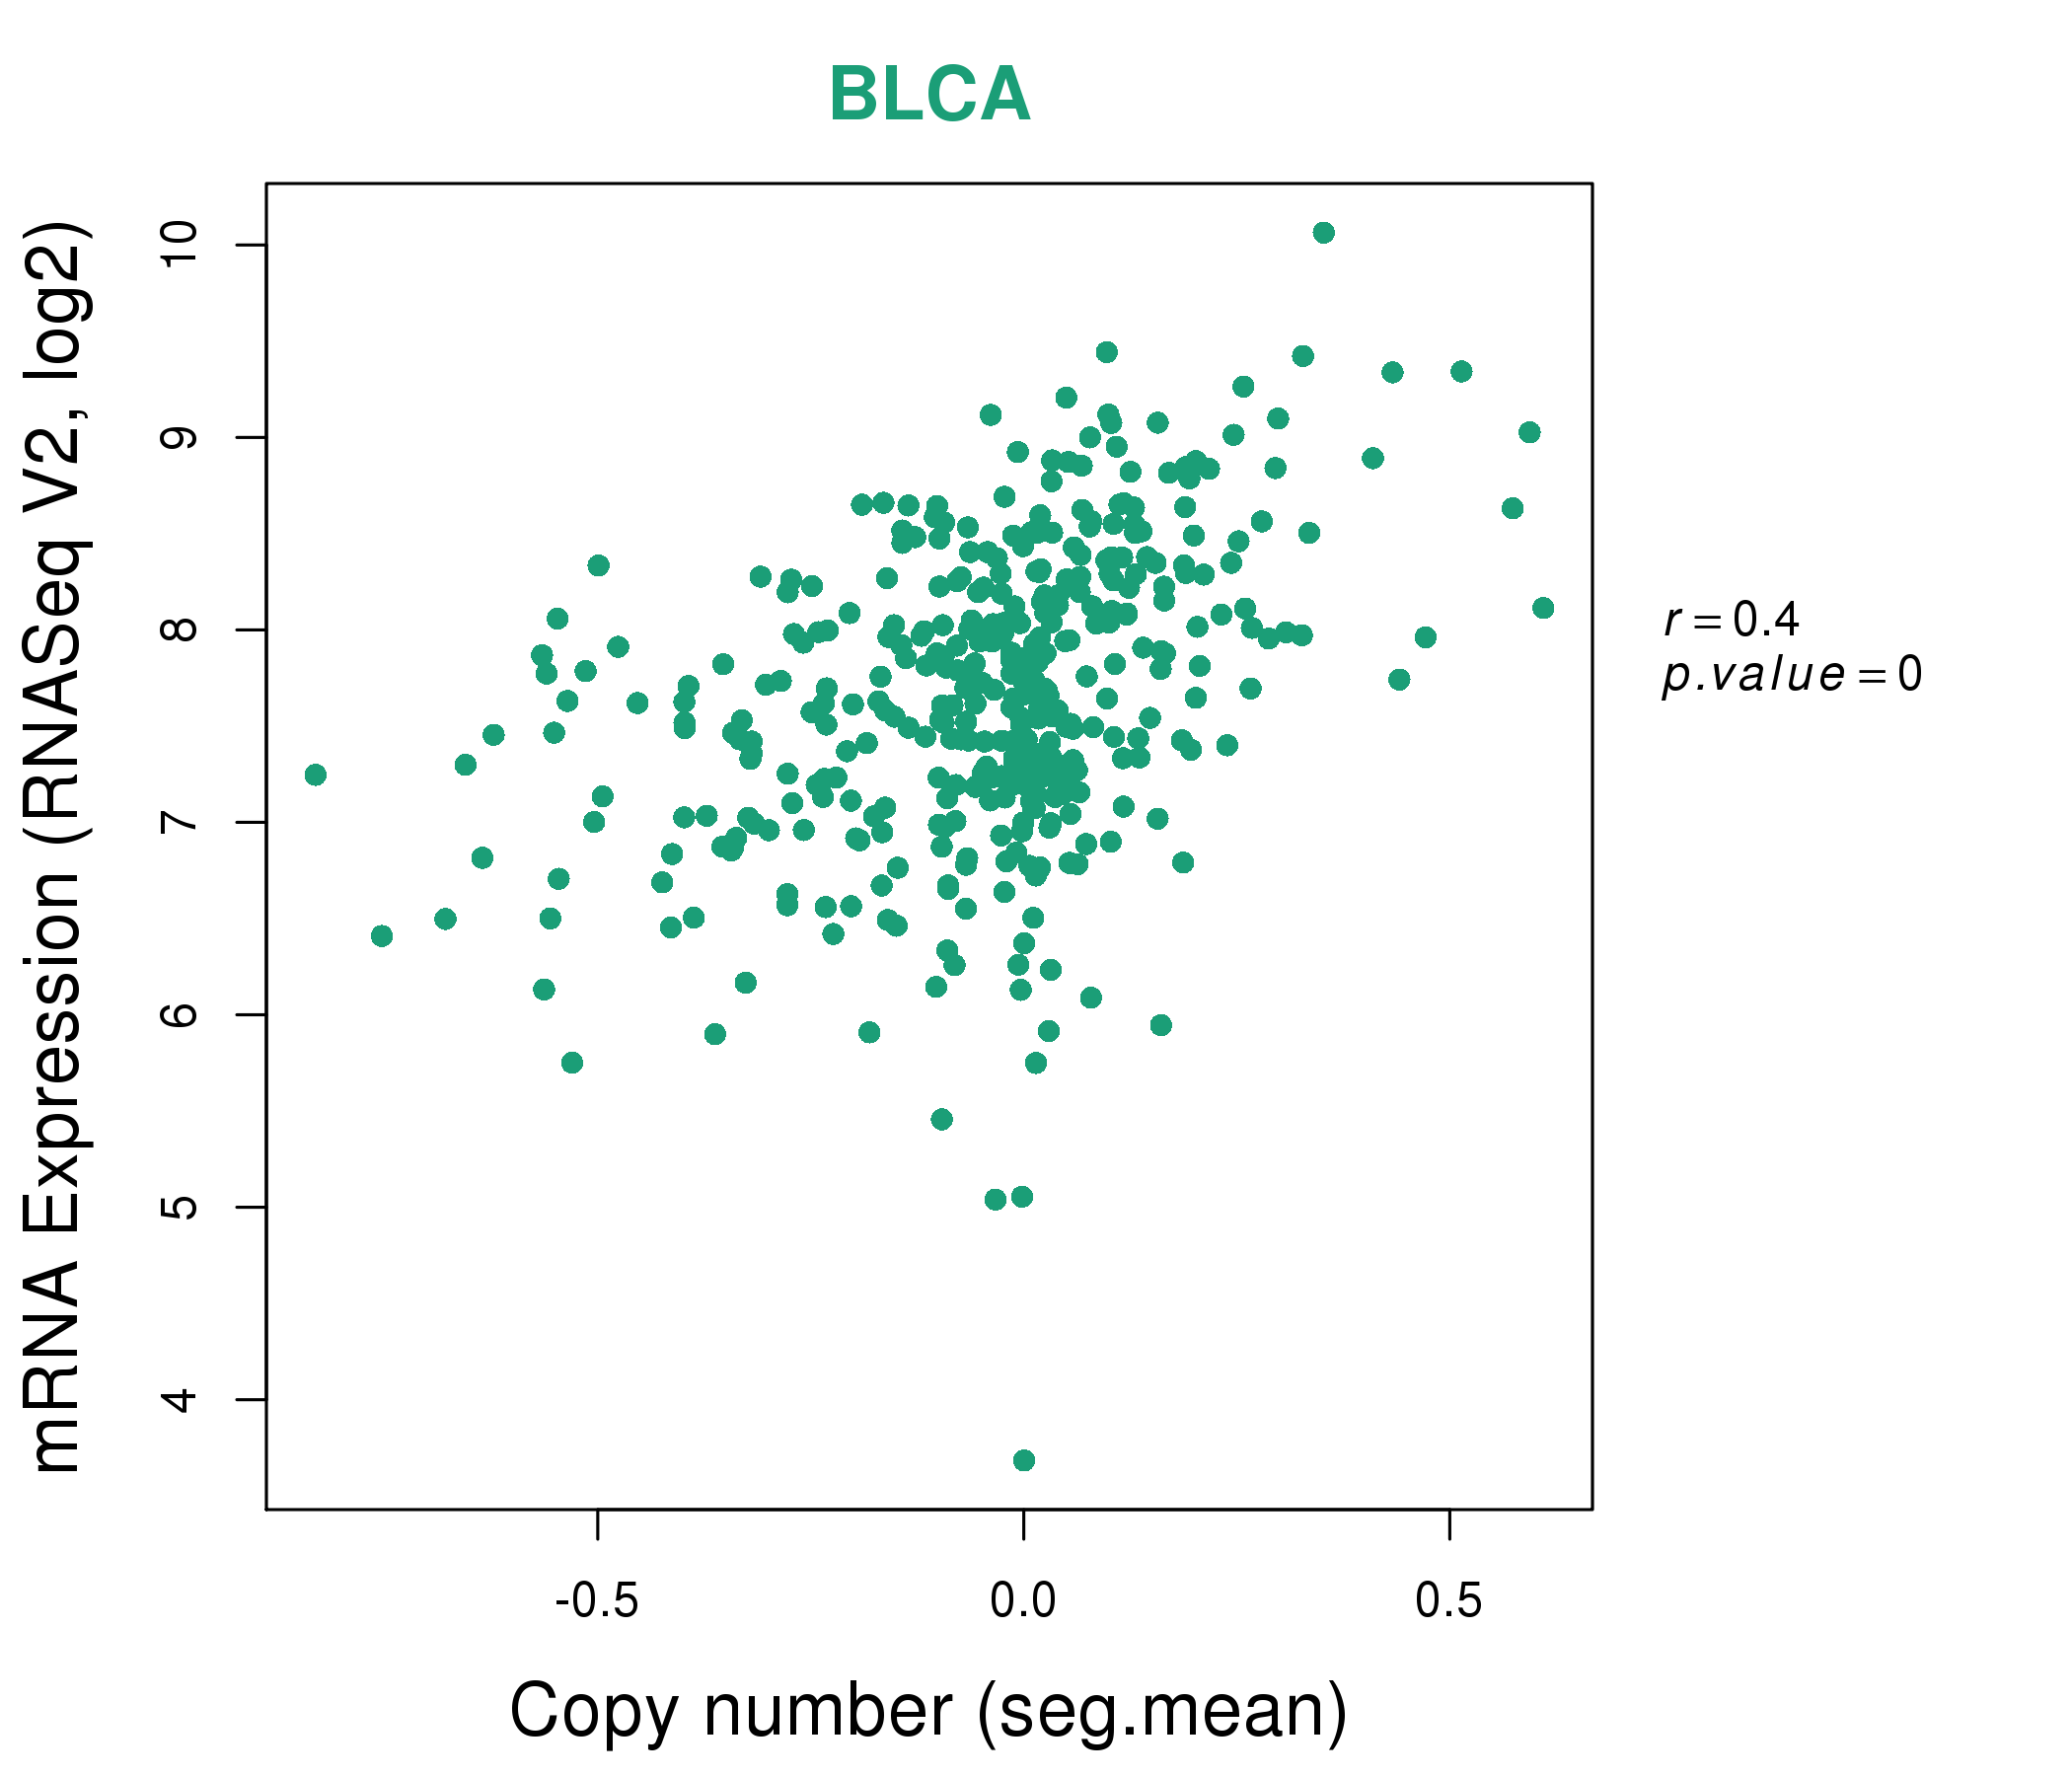
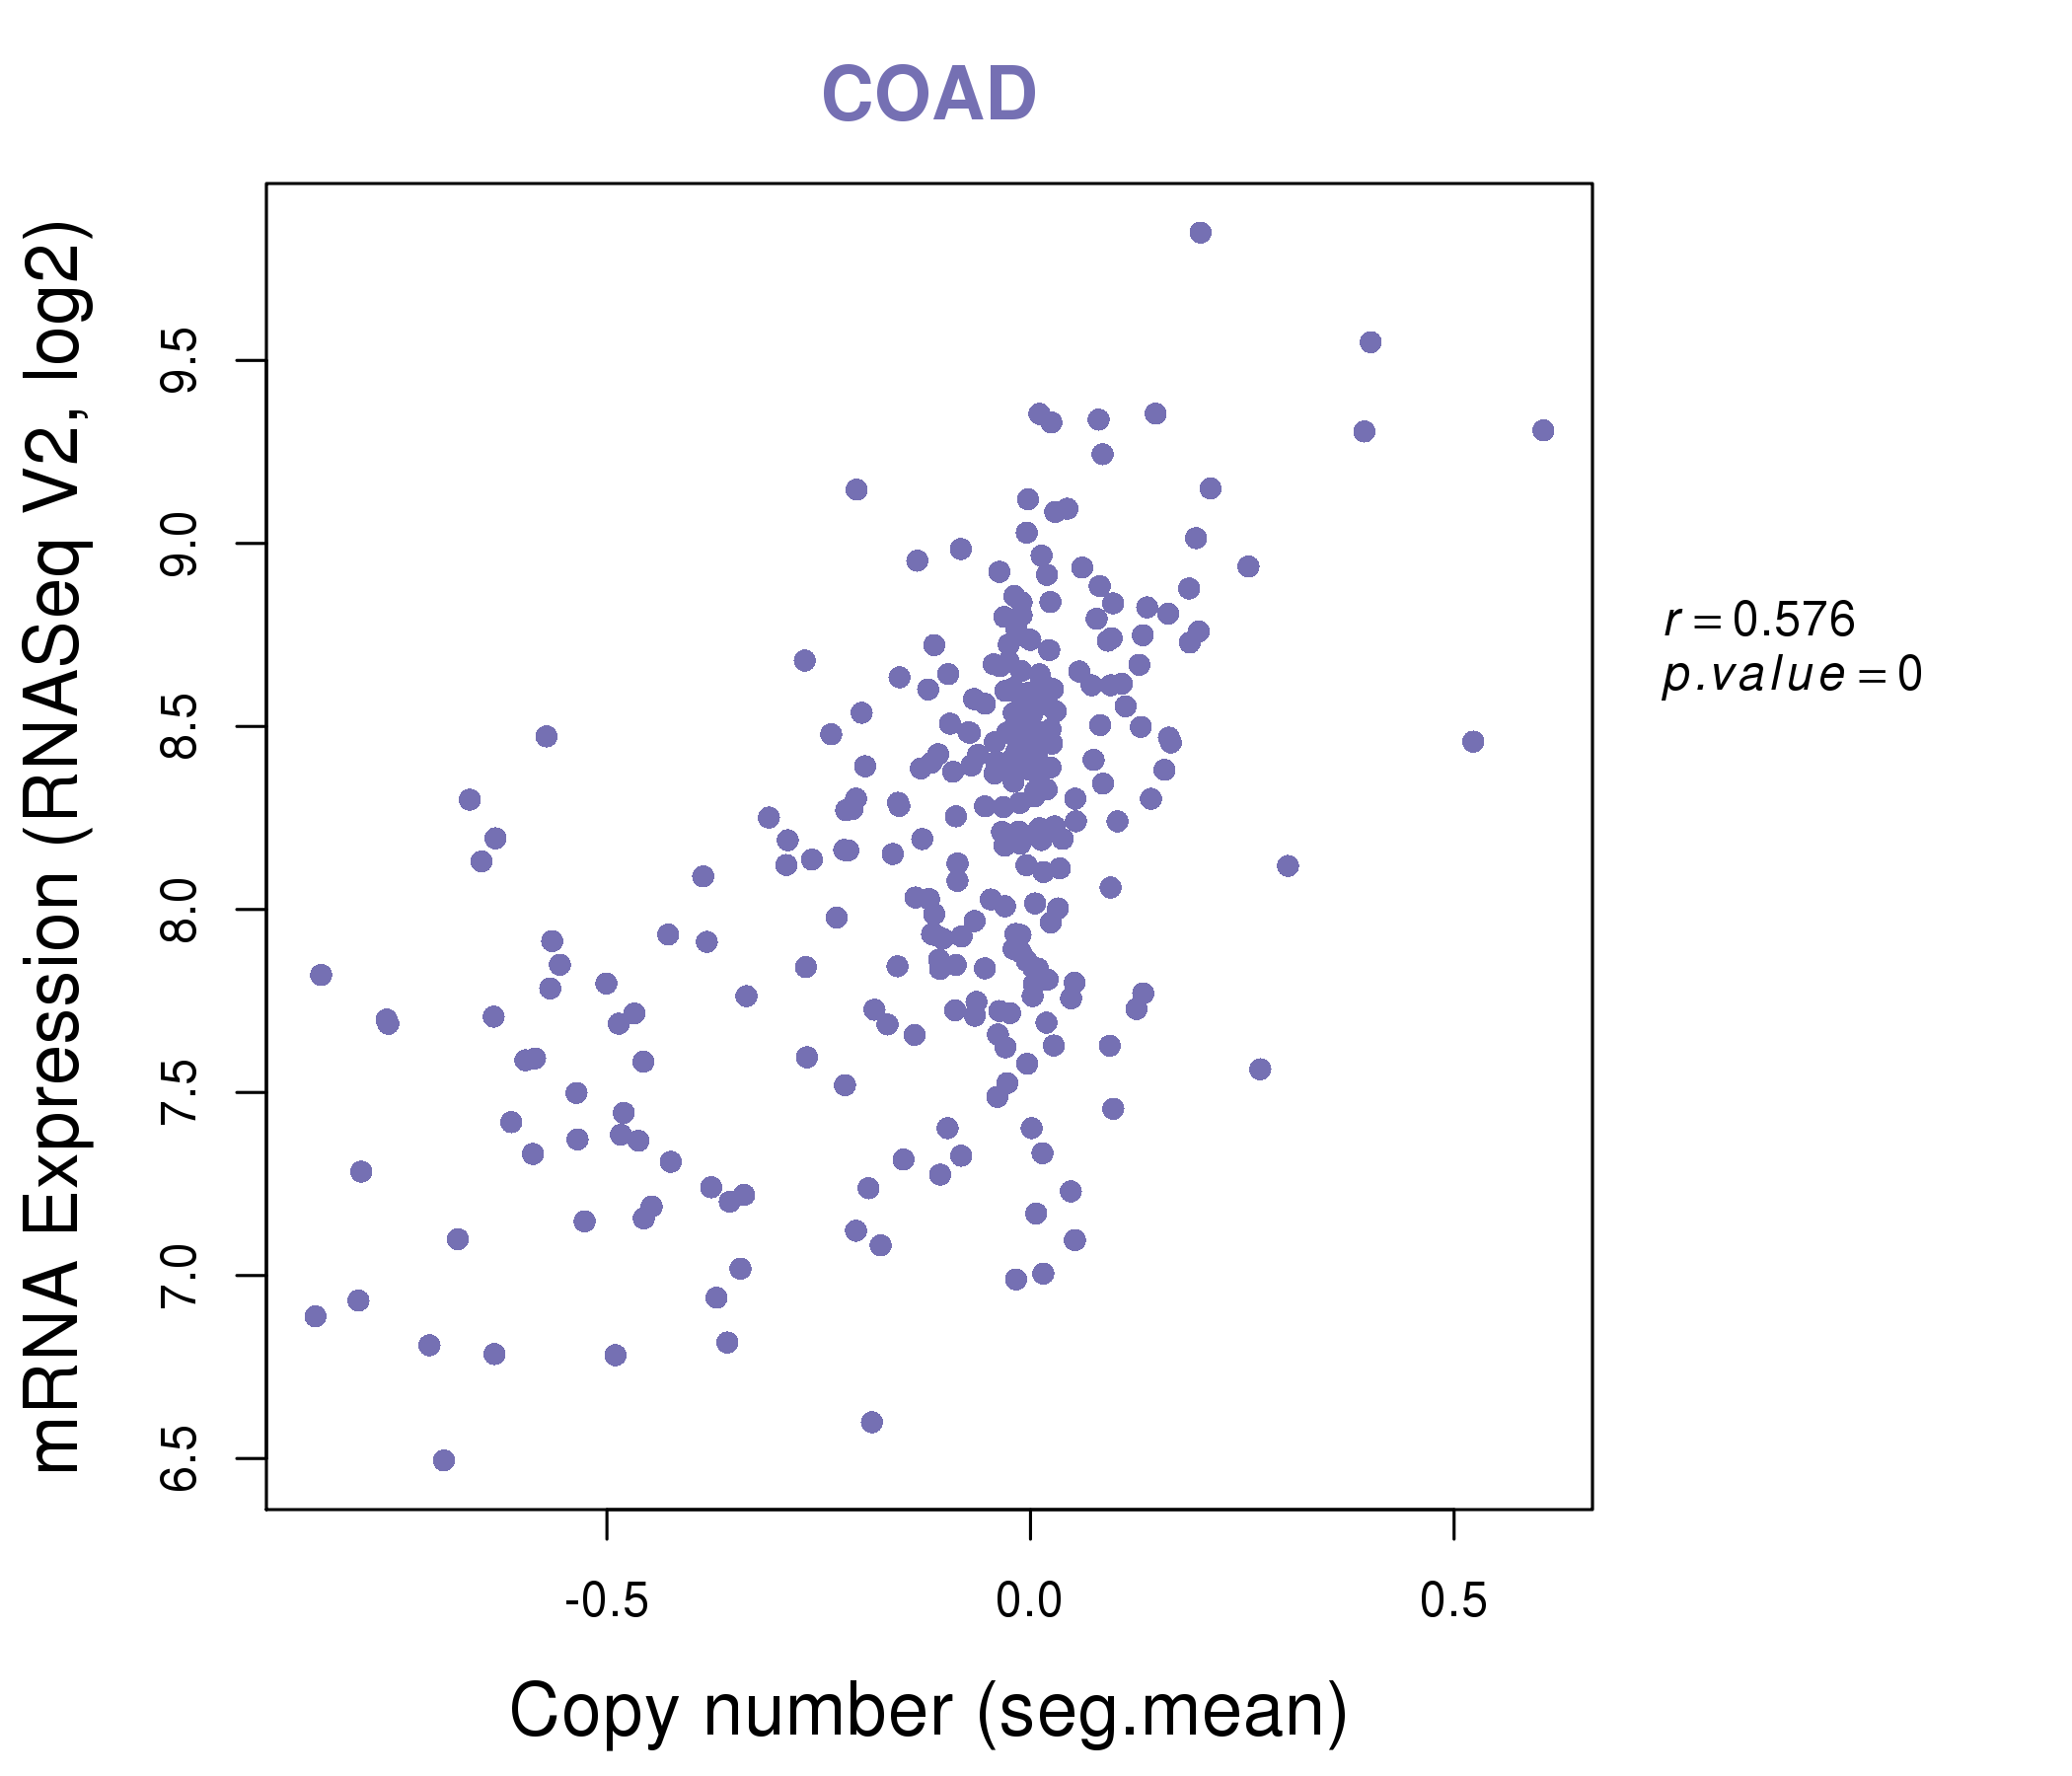
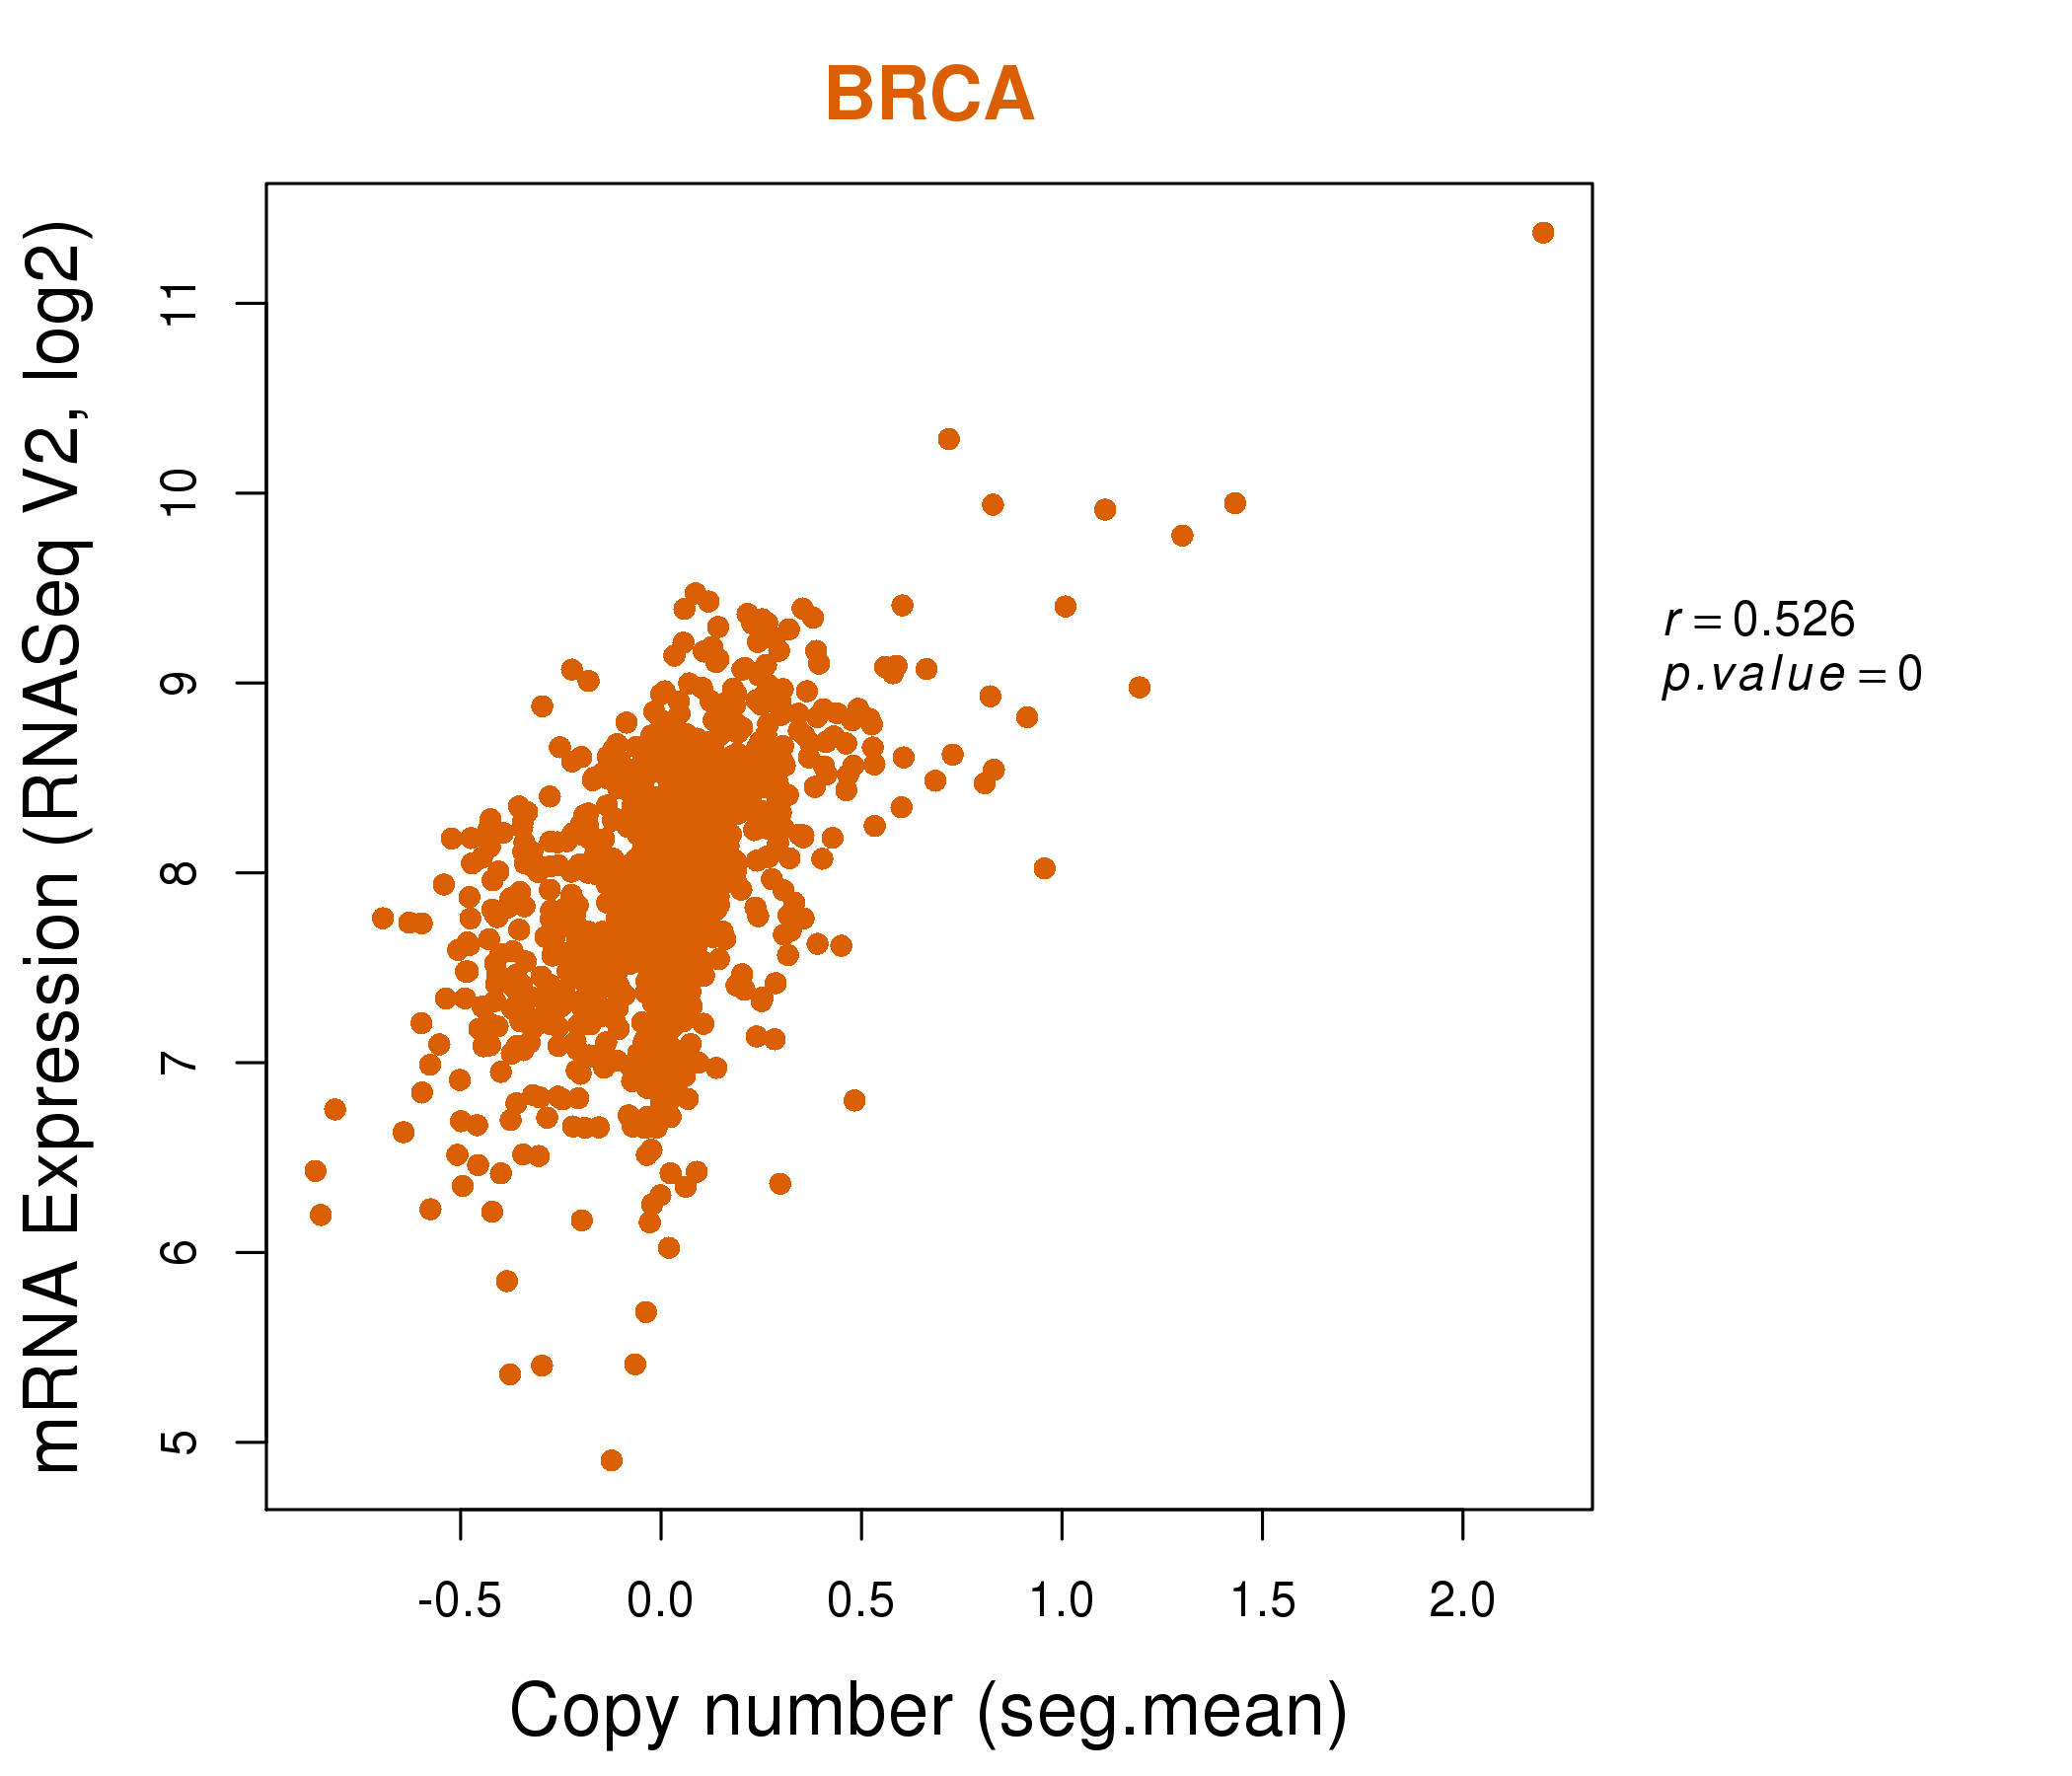
| * This plots show the correlation between CNV and gene expression. |
: Open all plots for all cancer types
 |
|
 |
|
| Top |
| Gene-Gene Network Information |
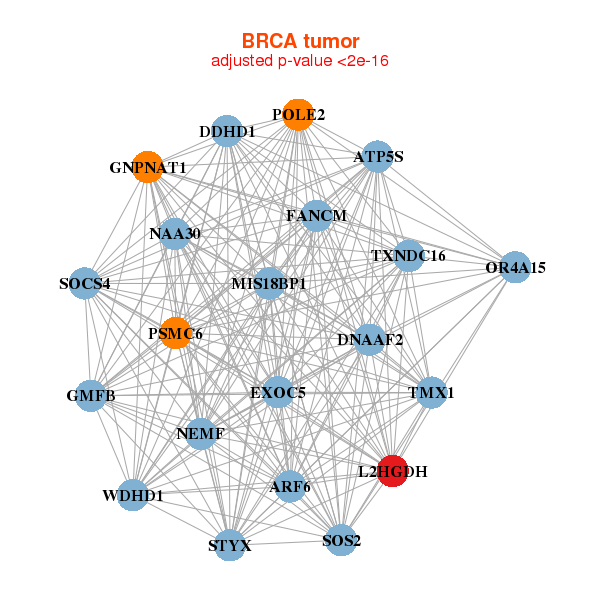
| * Co-Expression network figures were drawn using R package igraph. Only the top 20 genes with the highest correlations were shown. Red circle: input gene, orange circle: cell metabolism gene, sky circle: other gene |
: Open all plots for all cancer types
 |
|
| ARF6,ATP5S,DNAAF2,MIS18BP1,DDHD1,EXOC5,FANCM, GMFB,GNPNAT1,L2HGDH,NAA30,OR4A15,POLE2,PSMC6, NEMF,SOCS4,SOS2,STYX,TMX1,TXNDC16,WDHD1 | ALPK3,ATP5B,TCAIM,CECR2,COX10,HECTD1,VWA8, L2HGDH,LOC729082,LYRM7,NDUFS1,NPEPPS,OXNAD1,PAIP2B, PDHX,PPARA,PTCD3,SATB1,TARSL2,UQCRC2,ZYG11B |
 |
|
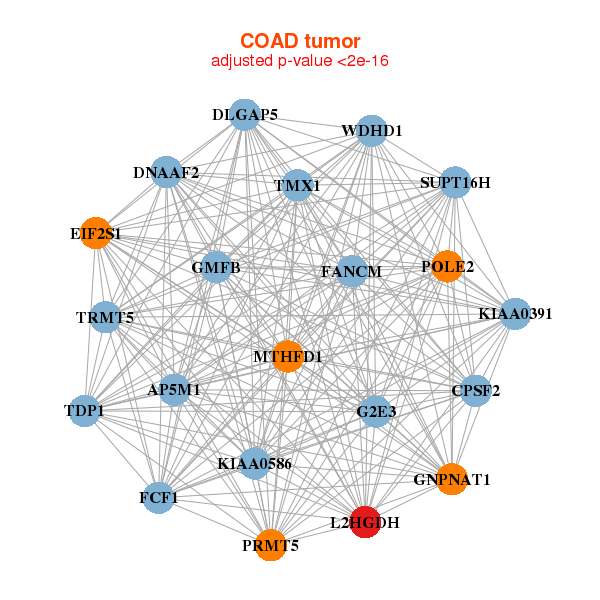
| DNAAF2,CPSF2,DLGAP5,EIF2S1,FANCM,FCF1,G2E3, GMFB,GNPNAT1,KIAA0391,KIAA0586,L2HGDH,MTHFD1,AP5M1, POLE2,PRMT5,SUPT16H,TDP1,TMX1,TRMT5,WDHD1 | ACTL6A,DCLRE1A,DNAJA3,G2E3,GMNN,HN1L,L2HGDH, MRPS35,NARS2,PRMT3,PTCD3,PUS7L,RBBP4,RPE, SHQ1,TBCCD1,TFAM,TFDP1,TMEM5,TRNT1,ZC3H8 |
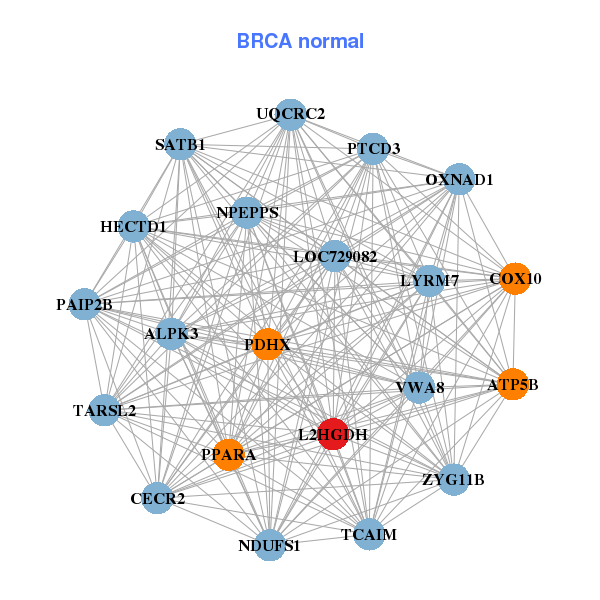
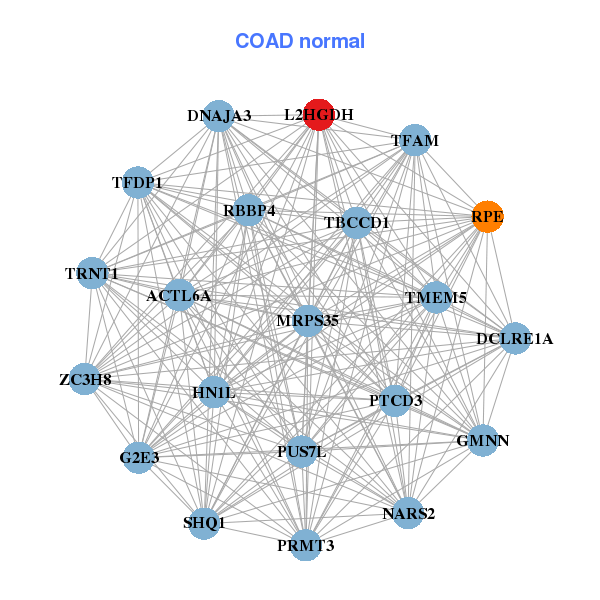
| * Co-Expression network figures were drawn using R package igraph. Only the top 20 genes with the highest correlations were shown. Red circle: input gene, orange circle: cell metabolism gene, sky circle: other gene |
: Open all plots for all cancer types
| Top |
: Open all interacting genes' information including KEGG pathway for all interacting genes from DAVID
| Top |
| Pharmacological Information for L2HGDH |
| There's no related Drug. |
| Top |
| Cross referenced IDs for L2HGDH |
| * We obtained these cross-references from Uniprot database. It covers 150 different DBs, 18 categories. http://www.uniprot.org/help/cross_references_section |
: Open all cross reference information
|
Copyright © 2016-Present - The Univsersity of Texas Health Science Center at Houston @ |