|
||||||||||||||||||||
| |
| Phenotypic Information (metabolism pathway, cancer, disease, phenome) |
| |
| |
| Gene-Gene Network Information: Co-Expression Network, Interacting Genes & KEGG |
| |
|


| Gene Summary for PTGES2 |
| Basic gene info. | Gene symbol | PTGES2 |
| Gene name | prostaglandin E synthase 2 | |
| Synonyms | C9orf15|GBF-1|GBF1|PGES2|mPGES-2 | |
| Cytomap | UCSC genome browser: 9q34.11 | |
| Genomic location | chr9 :130882971-130890741 | |
| Type of gene | protein-coding | |
| RefGenes | NM_001256335.1, NM_025072.6,NM_198938.2,NM_198939.1,NM_198940.1, NR_027812.1, | |
| Ensembl id | ENSG00000148334 | |
| Description | GATE-binding factor 1gamma-interferon-activated transcriptional element-binding factor 1mPGE synthase-2membrane-associated prostaglandin E synthase 2membrane-associated prostaglandin E synthase-2microsomal prostaglandin E synthase-2prostaglandin-H(2 | |
| Modification date | 20141207 | |
| dbXrefs | MIM : 608152 | |
| HGNC : HGNC | ||
| Ensembl : ENSG00000148334 | ||
| HPRD : 07458 | ||
| Vega : OTTHUMG00000020730 | ||
| Protein | UniProt: go to UniProt's Cross Reference DB Table | |
| Expression | CleanEX: HS_PTGES2 | |
| BioGPS: 80142 | ||
| Gene Expression Atlas: ENSG00000148334 | ||
| The Human Protein Atlas: ENSG00000148334 | ||
| Pathway | NCI Pathway Interaction Database: PTGES2 | |
| KEGG: PTGES2 | ||
| REACTOME: PTGES2 | ||
| ConsensusPathDB | ||
| Pathway Commons: PTGES2 | ||
| Metabolism | MetaCyc: PTGES2 | |
| HUMANCyc: PTGES2 | ||
| Regulation | Ensembl's Regulation: ENSG00000148334 | |
| miRBase: chr9 :130,882,971-130,890,741 | ||
| TargetScan: NM_001256335 | ||
| cisRED: ENSG00000148334 | ||
| Context | iHOP: PTGES2 | |
| cancer metabolism search in PubMed: PTGES2 | ||
| UCL Cancer Institute: PTGES2 | ||
| Assigned class in ccmGDB | C | |
| Top |
| Phenotypic Information for PTGES2(metabolism pathway, cancer, disease, phenome) |
| Cancer | CGAP: PTGES2 |
| Familial Cancer Database: PTGES2 | |
| * This gene is included in those cancer gene databases. |
|
|
|
|
|
|
| ||||||||||||||
Oncogene 1 | Significant driver gene in | |||||||||||||||||||
| cf) number; DB name 1 Oncogene; http://nar.oxfordjournals.org/content/35/suppl_1/D721.long, 2 Tumor Suppressor gene; https://bioinfo.uth.edu/TSGene/, 3 Cancer Gene Census; http://www.nature.com/nrc/journal/v4/n3/abs/nrc1299.html, 4 CancerGenes; http://nar.oxfordjournals.org/content/35/suppl_1/D721.long, 5 Network of Cancer Gene; http://ncg.kcl.ac.uk/index.php, 1Therapeutic Vulnerabilities in Cancer; http://cbio.mskcc.org/cancergenomics/statius/ |
| KEGG_ARACHIDONIC_ACID_METABOLISM | |
| OMIM | |
| Orphanet | |
| Disease | KEGG Disease: PTGES2 |
| MedGen: PTGES2 (Human Medical Genetics with Condition) | |
| ClinVar: PTGES2 | |
| Phenotype | MGI: PTGES2 (International Mouse Phenotyping Consortium) |
| PhenomicDB: PTGES2 | |
| Mutations for PTGES2 |
| * Under tables are showing count per each tissue to give us broad intuition about tissue specific mutation patterns.You can go to the detailed page for each mutation database's web site. |
| There's no structural variation information in COSMIC data for this gene. |
| * From mRNA Sanger sequences, Chitars2.0 arranged chimeric transcripts. This table shows PTGES2 related fusion information. |
| ID | Head Gene | Tail Gene | Accession | Gene_a | qStart_a | qEnd_a | Chromosome_a | tStart_a | tEnd_a | Gene_a | qStart_a | qEnd_a | Chromosome_a | tStart_a | tEnd_a |
| BG342124 | PTGES2 | 6 | 60 | 9 | 130889747 | 130889802 | PTGES2 | 59 | 729 | 9 | 130885212 | 130889772 | |
| Top |
| There's no copy number variation information in COSMIC data for this gene. |
| Top |
|
 |
| Top |
| Stat. for Non-Synonymous SNVs (# total SNVs=14) | (# total SNVs=5) |
 |  |
(# total SNVs=0) | (# total SNVs=1) |
 |
| Top |
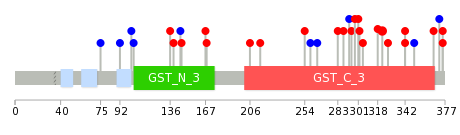
| * When you move the cursor on each content, you can see more deailed mutation information on the Tooltip. Those are primary_site,primary_histology,mutation(aa),pubmedID. |
| GRCh37 position | Mutation(aa) | Unique sampleID count |
| chr9:130884681-130884681 | p.R322Q | 2 |
| chr9:130885211-130885211 | p.? | 2 |
| chr9:130886805-130886805 | p.I168V | 1 |
| chr9:130883533-130883533 | p.R342L | 1 |
| chr9:130885216-130885216 | p.S295T | 1 |
| chr9:130886808-130886808 | p.V167I | 1 |
| chr9:130883534-130883534 | p.R342C | 1 |
| chr9:130885221-130885221 | p.L293L | 1 |
| chr9:130887564-130887564 | p.R146G | 1 |
| chr9:130884666-130884666 | p.G327D | 1 |
| Top |
|
 |
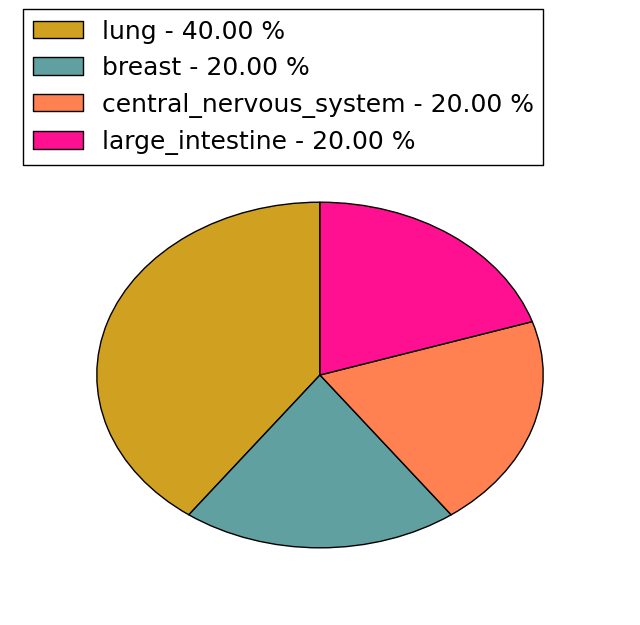
| Point Mutation/ Tissue ID | 1 | 2 | 3 | 4 | 5 | 6 | 7 | 8 | 9 | 10 | 11 | 12 | 13 | 14 | 15 | 16 | 17 | 18 | 19 | 20 |
| # sample | 2 | 3 | 1 | 2 | 1 | 3 | 4 | 1 | 3 | |||||||||||
| # mutation | 3 | 2 | 1 | 2 | 1 | 3 | 3 | 1 | 3 | |||||||||||
| nonsynonymous SNV | 2 | 1 | 1 | 1 | 1 | 2 | 1 | 3 | ||||||||||||
| synonymous SNV | 1 | 1 | 2 | 2 | 1 |
| cf) Tissue ID; Tissue type (1; BLCA[Bladder Urothelial Carcinoma], 2; BRCA[Breast invasive carcinoma], 3; CESC[Cervical squamous cell carcinoma and endocervical adenocarcinoma], 4; COAD[Colon adenocarcinoma], 5; GBM[Glioblastoma multiforme], 6; Glioma Low Grade, 7; HNSC[Head and Neck squamous cell carcinoma], 8; KICH[Kidney Chromophobe], 9; KIRC[Kidney renal clear cell carcinoma], 10; KIRP[Kidney renal papillary cell carcinoma], 11; LAML[Acute Myeloid Leukemia], 12; LUAD[Lung adenocarcinoma], 13; LUSC[Lung squamous cell carcinoma], 14; OV[Ovarian serous cystadenocarcinoma ], 15; PAAD[Pancreatic adenocarcinoma], 16; PRAD[Prostate adenocarcinoma], 17; SKCM[Skin Cutaneous Melanoma], 18:STAD[Stomach adenocarcinoma], 19:THCA[Thyroid carcinoma], 20:UCEC[Uterine Corpus Endometrial Carcinoma]) |
| Top |
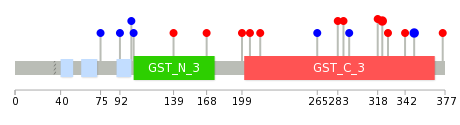
| * We represented just top 10 SNVs. When you move the cursor on each content, you can see more deailed mutation information on the Tooltip. Those are primary_site, primary_histology, mutation(aa), pubmedID. |
| Genomic Position | Mutation(aa) | Unique sampleID count |
| chr9:130883508 | p.F350F,PTGES2 | 2 |
| chr9:130884681 | p.R322Q,PTGES2 | 2 |
| chr9:130884693 | p.L288V,PTGES2 | 1 |
| chr9:130887694 | p.A283V,PTGES2 | 1 |
| chr9:130885221 | p.V265V,PTGES2 | 1 |
| chr9:130889721 | p.E215K,PTGES2 | 1 |
| chr9:130885238 | p.G206S,PTGES2 | 1 |
| chr9:130889772 | p.G199S,PTGES2 | 1 |
| chr9:130885252 | p.I168V | 1 |
| chr9:130885305 | p.E139Q | 1 |
| * Copy number data were extracted from TCGA using R package TCGA-Assembler. The URLs of all public data files on TCGA DCC data server were gathered on Jan-05-2015. Function ProcessCNAData in TCGA-Assembler package was used to obtain gene-level copy number value which is calculated as the average copy number of the genomic region of a gene. |
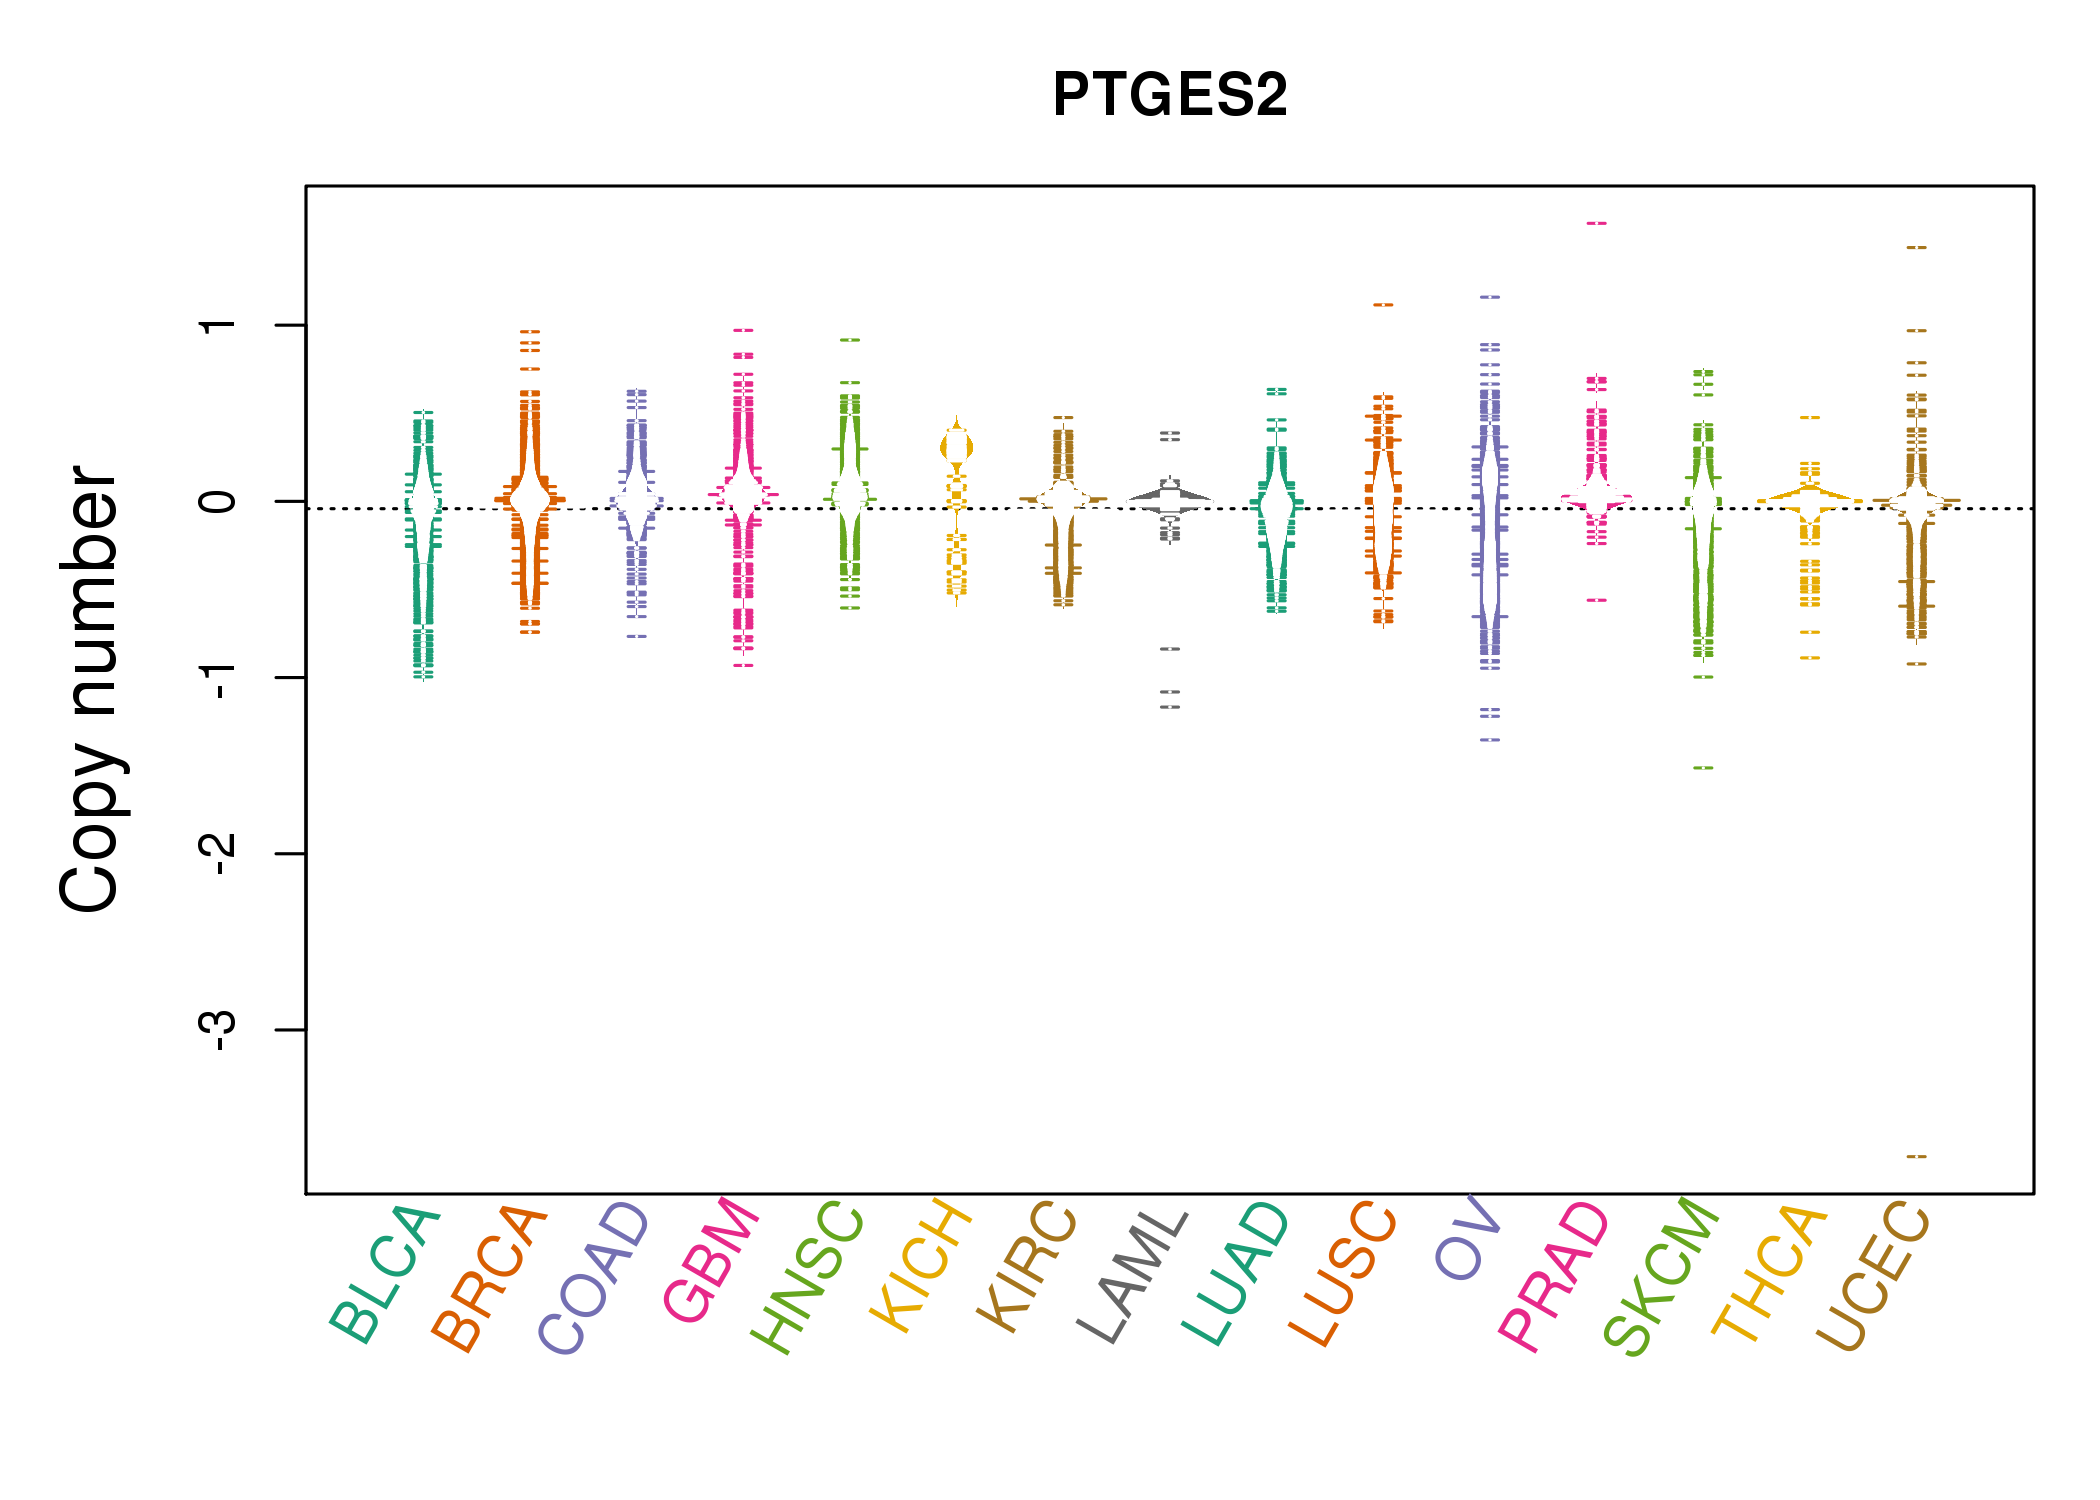 |
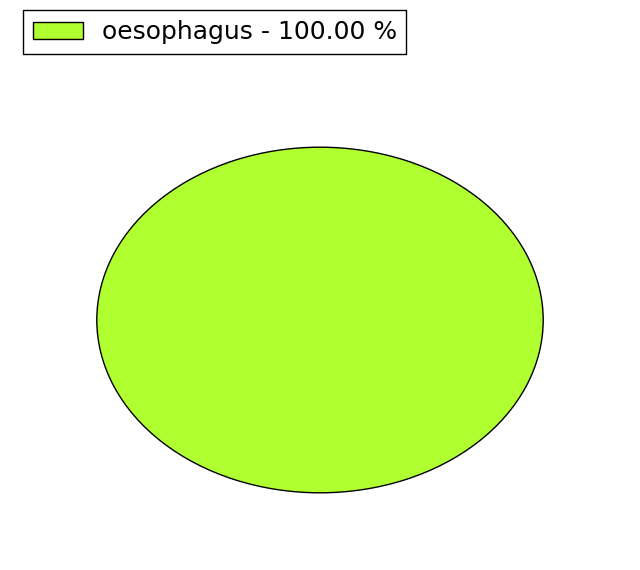
| cf) Tissue ID[Tissue type]: BLCA[Bladder Urothelial Carcinoma], BRCA[Breast invasive carcinoma], CESC[Cervical squamous cell carcinoma and endocervical adenocarcinoma], COAD[Colon adenocarcinoma], GBM[Glioblastoma multiforme], Glioma Low Grade, HNSC[Head and Neck squamous cell carcinoma], KICH[Kidney Chromophobe], KIRC[Kidney renal clear cell carcinoma], KIRP[Kidney renal papillary cell carcinoma], LAML[Acute Myeloid Leukemia], LUAD[Lung adenocarcinoma], LUSC[Lung squamous cell carcinoma], OV[Ovarian serous cystadenocarcinoma ], PAAD[Pancreatic adenocarcinoma], PRAD[Prostate adenocarcinoma], SKCM[Skin Cutaneous Melanoma], STAD[Stomach adenocarcinoma], THCA[Thyroid carcinoma], UCEC[Uterine Corpus Endometrial Carcinoma] |
| Top |
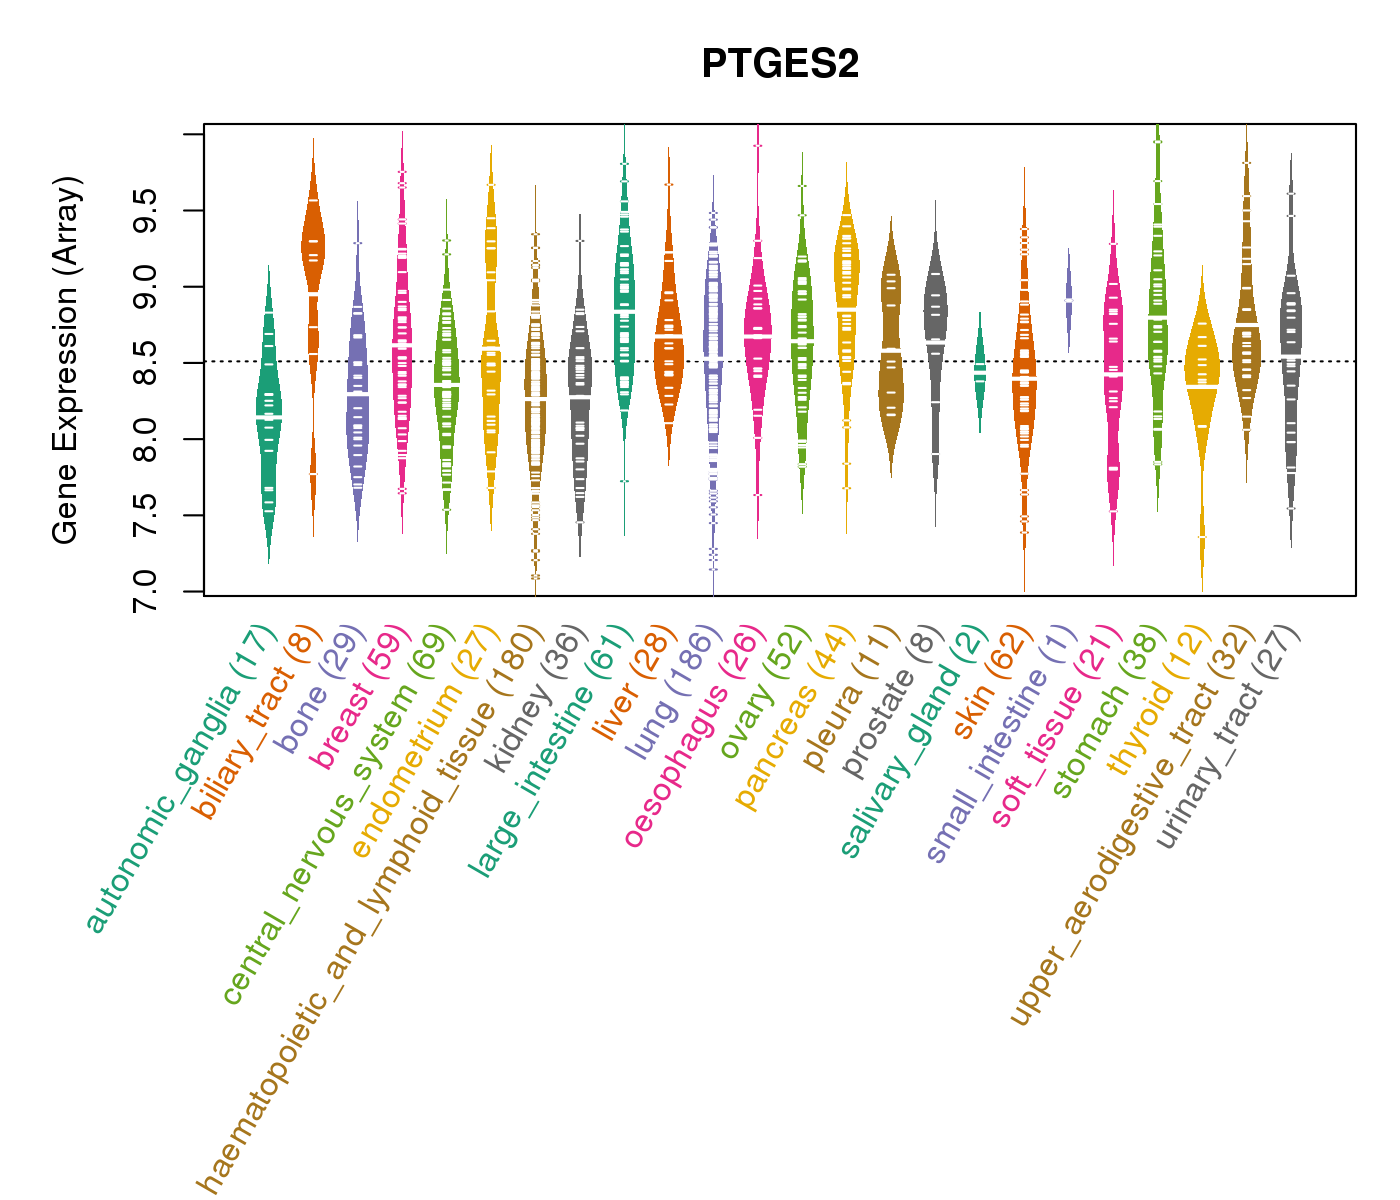
| Gene Expression for PTGES2 |
| * CCLE gene expression data were extracted from CCLE_Expression_Entrez_2012-10-18.res: Gene-centric RMA-normalized mRNA expression data. |
 |
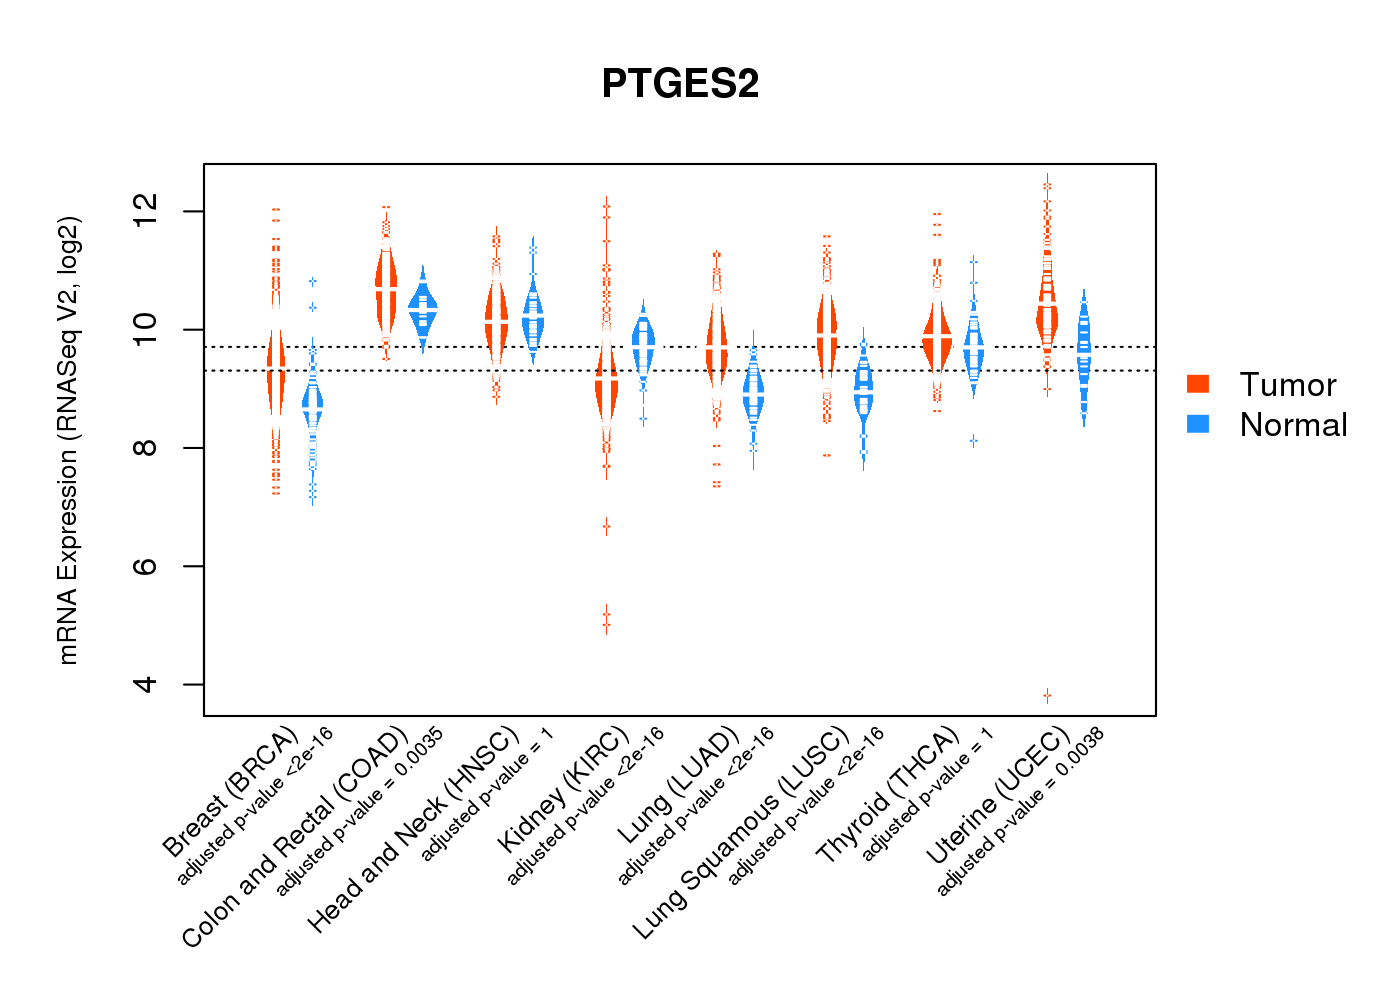
| * Normalized gene expression data of RNASeqV2 was extracted from TCGA using R package TCGA-Assembler. The URLs of all public data files on TCGA DCC data server were gathered at Jan-05-2015. Only eight cancer types have enough normal control samples for differential expression analysis. (t test, adjusted p<0.05 (using Benjamini-Hochberg FDR)) |
 |
| Top |
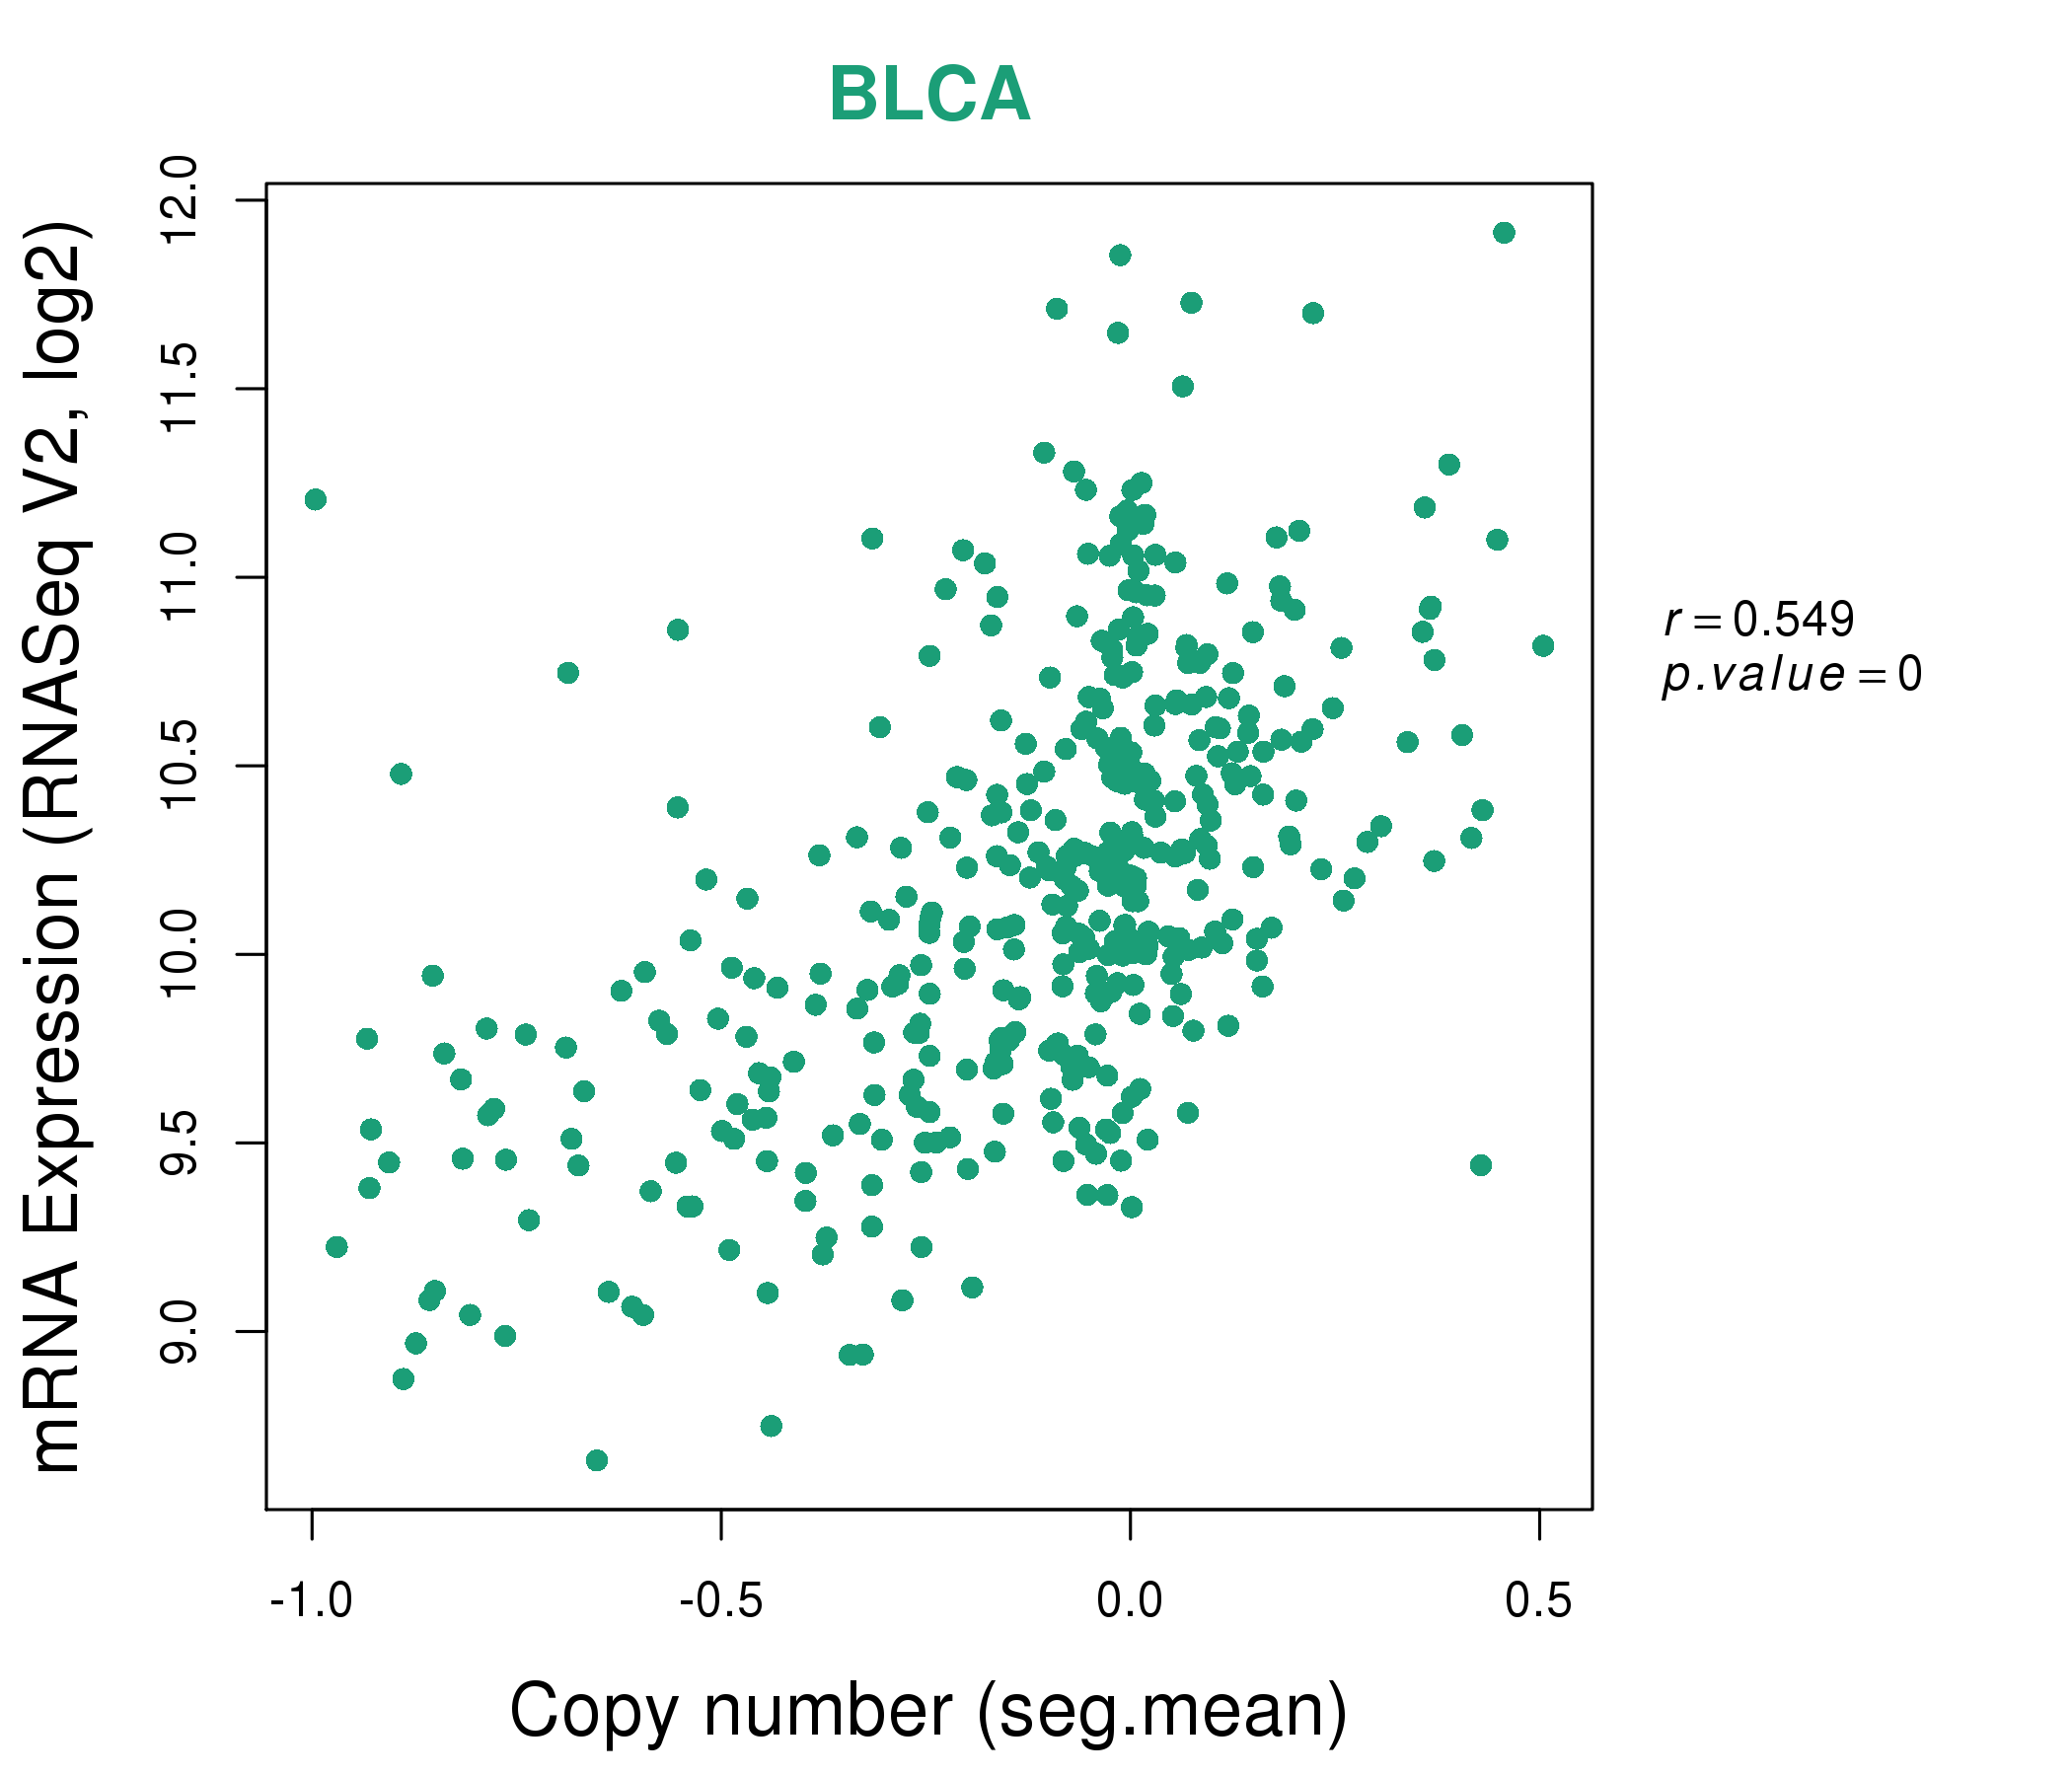
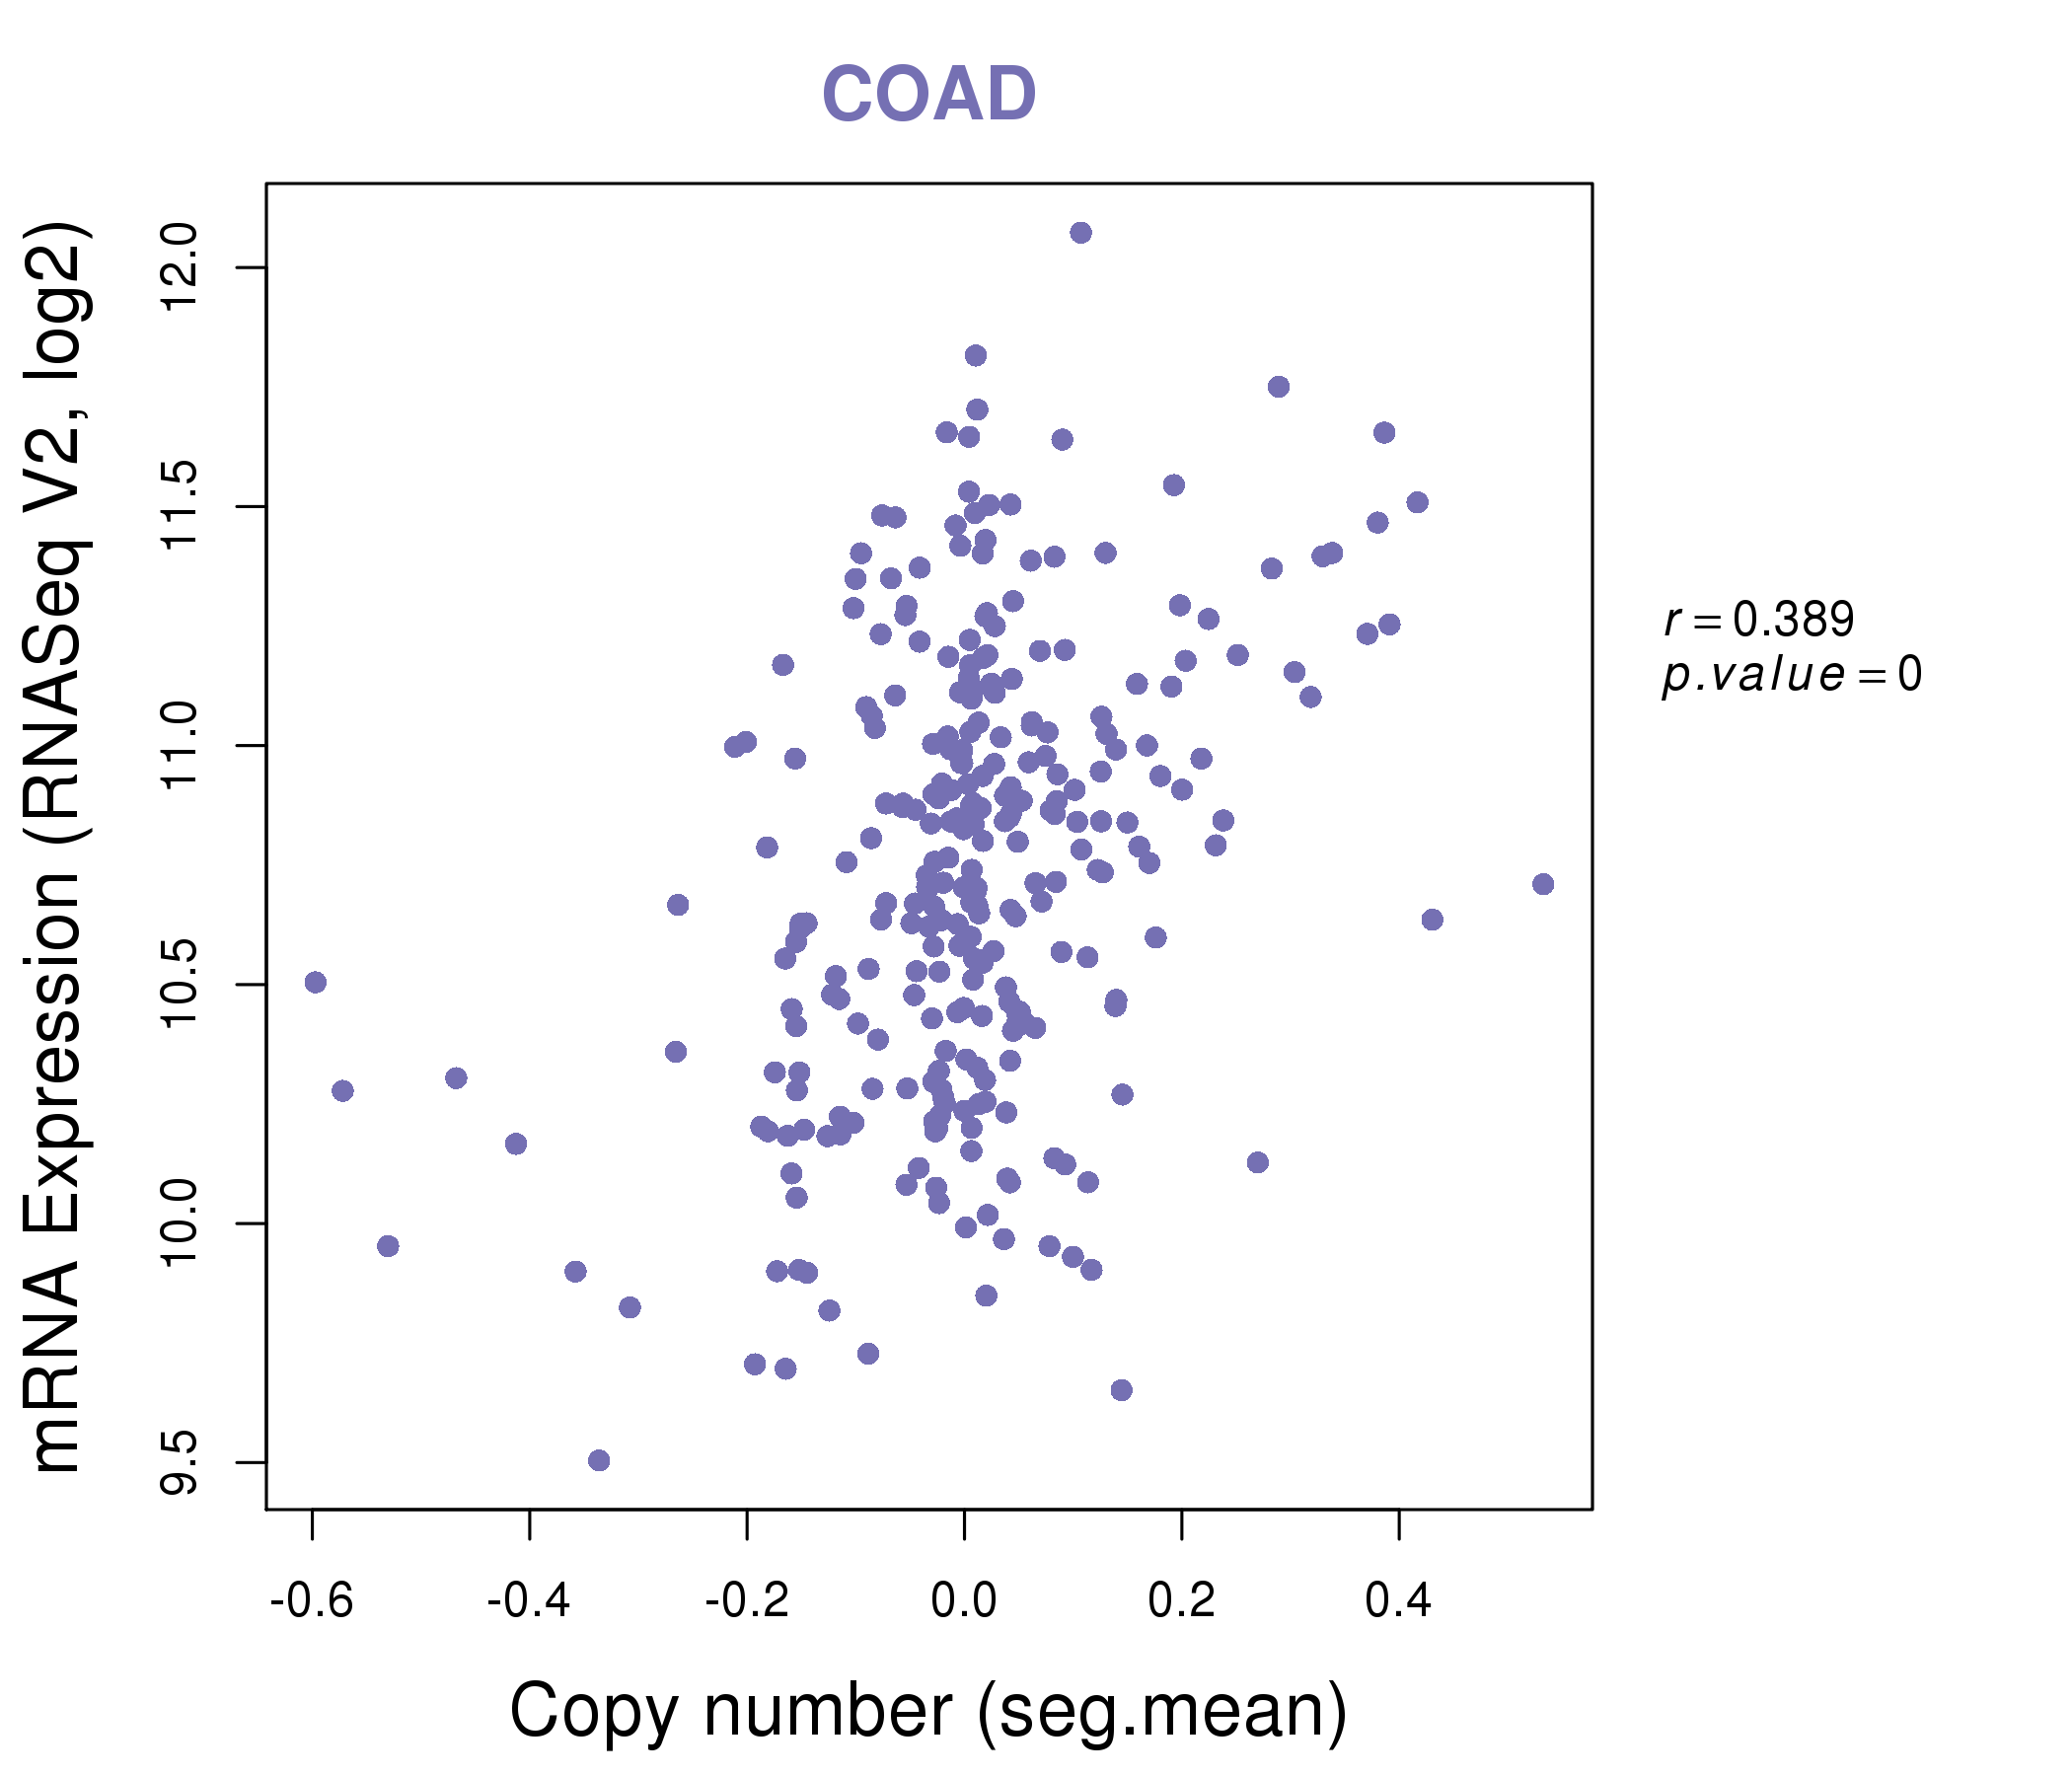
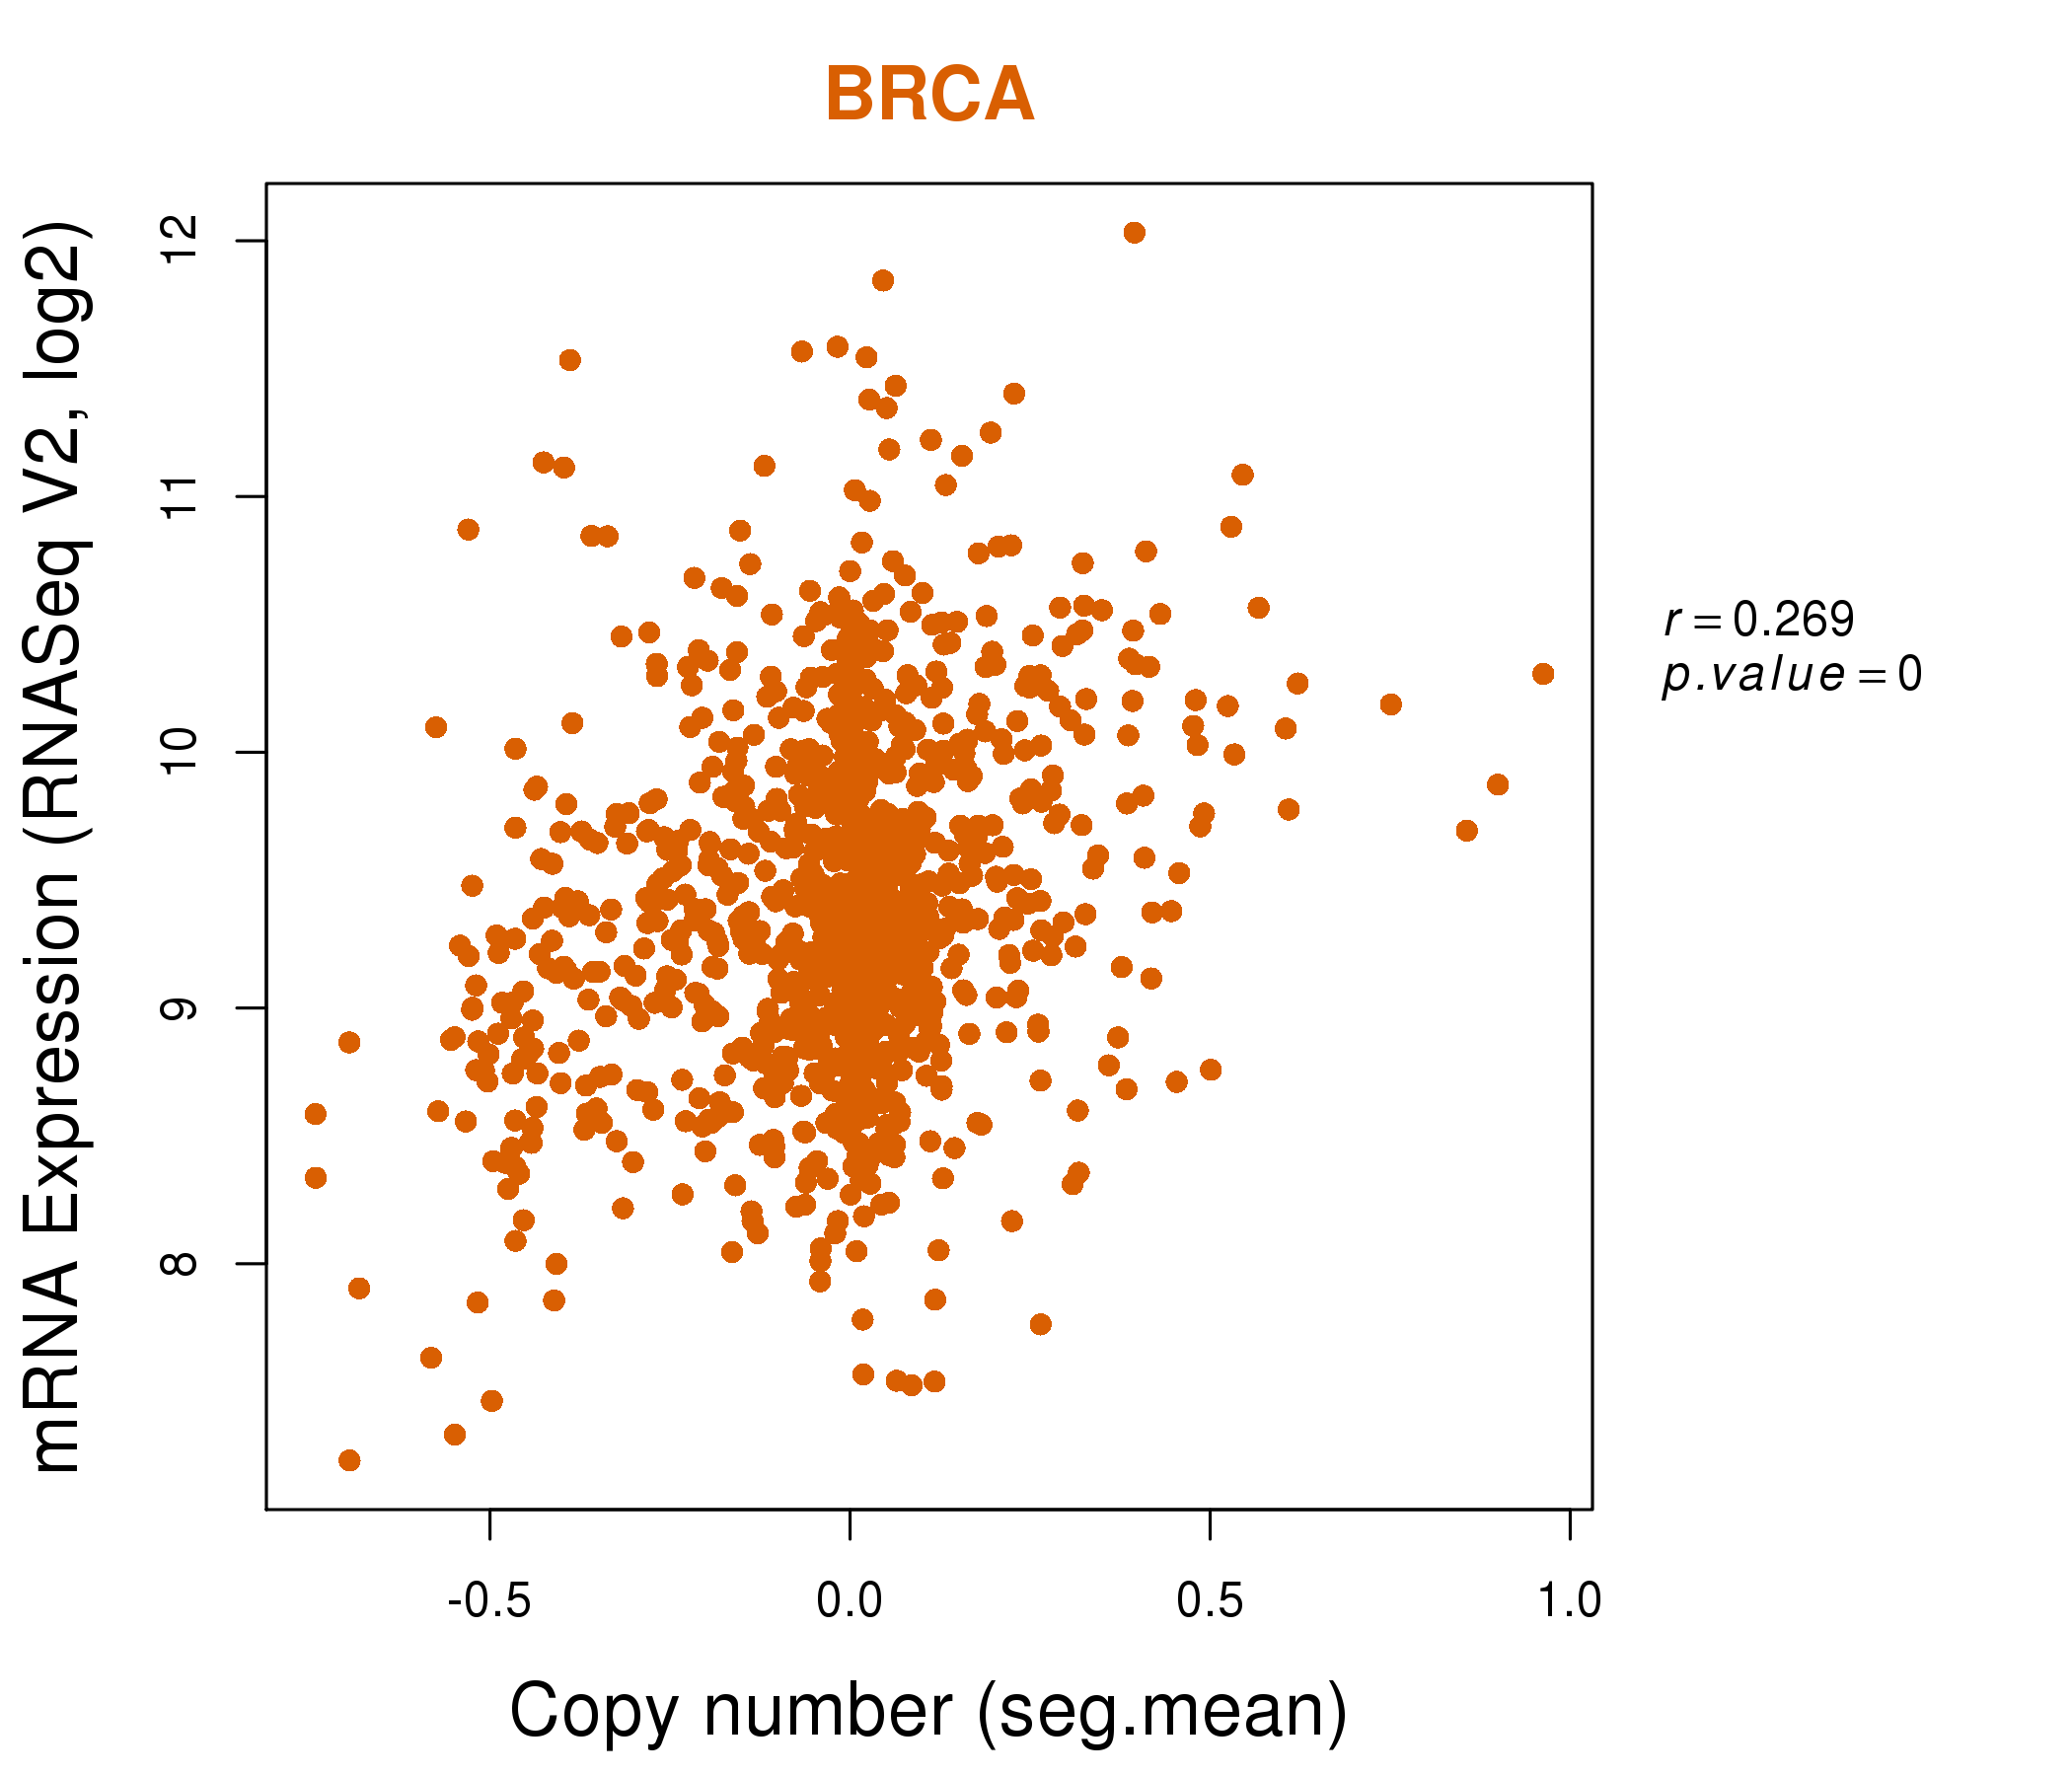
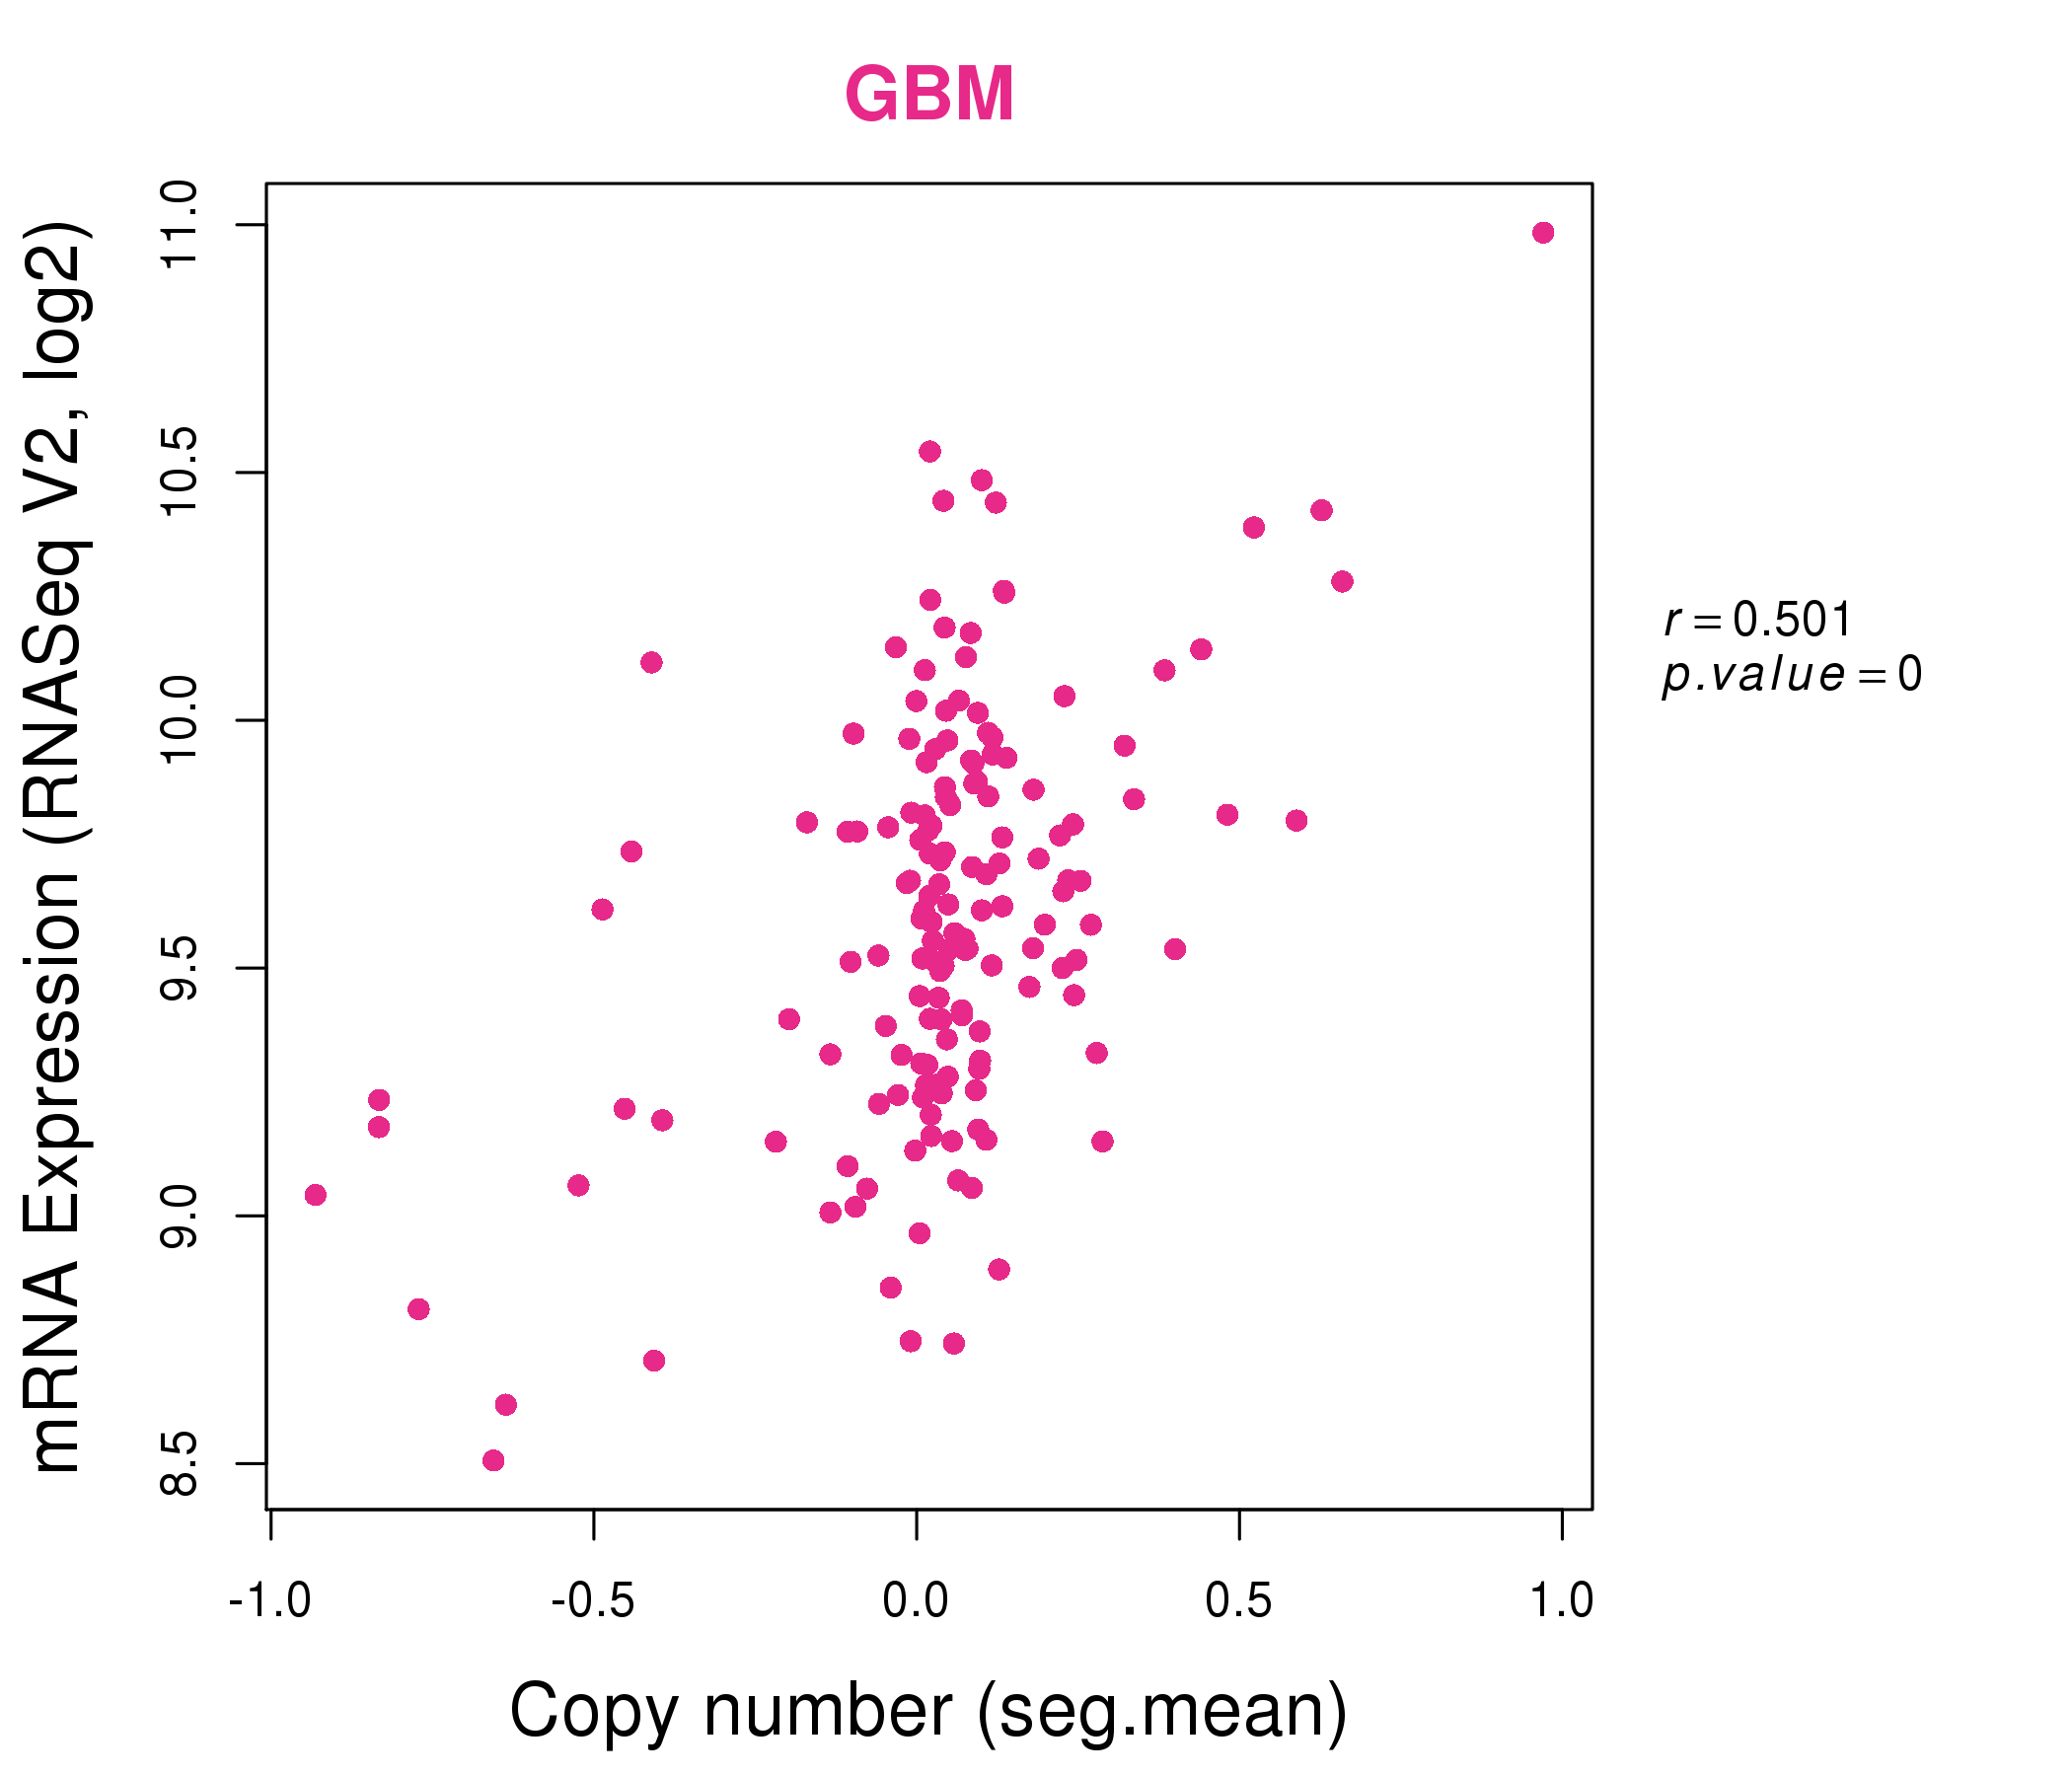
| * This plots show the correlation between CNV and gene expression. |
: Open all plots for all cancer types
 |
|
 |
|
| Top |
| Gene-Gene Network Information |
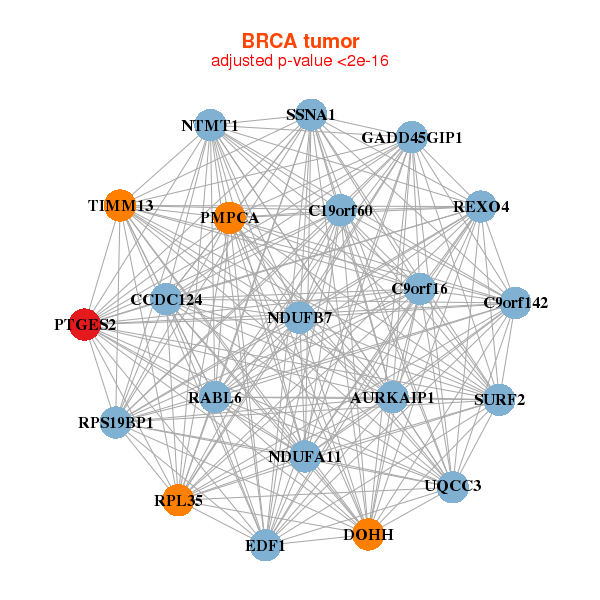
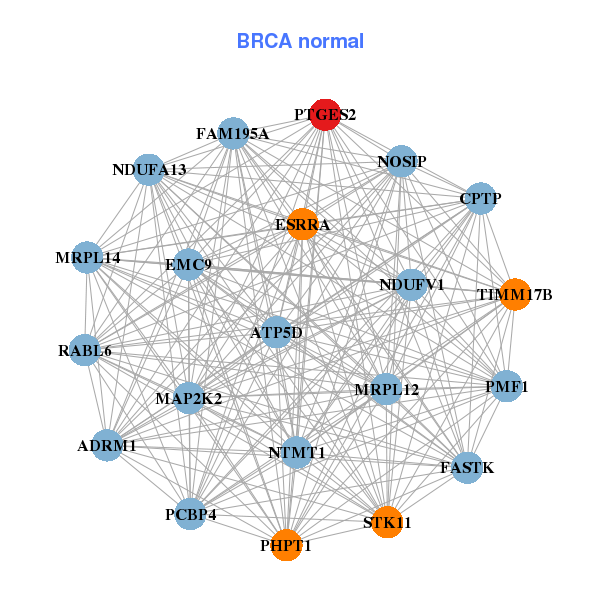
| * Co-Expression network figures were drawn using R package igraph. Only the top 20 genes with the highest correlations were shown. Red circle: input gene, orange circle: cell metabolism gene, sky circle: other gene |
: Open all plots for all cancer types
 |
|
| AURKAIP1,UQCC3,C19orf60,C9orf142,C9orf16,RABL6,CCDC124, DOHH,EDF1,GADD45GIP1,NTMT1,NDUFA11,NDUFB7,PMPCA, PTGES2,REXO4,RPL35,RPS19BP1,SSNA1,SURF2,TIMM13 | ADRM1,ATP5D,RABL6,ESRRA,EMC9,FAM195A,FASTK, CPTP,MAP2K2,NTMT1,MRPL12,MRPL14,NDUFA13,NDUFV1, NOSIP,PCBP4,PHPT1,PMF1,PTGES2,STK11,TIMM17B |
 |
|
| ATP5D,AURKAIP1,UQCC3,C9orf142,COQ4,ENDOG,FPGS, NTMT1,MRPL12,MRPL41,MRPS2,MRPS5,NDUFV1,PMPCA, PTGES2,PTRH1,SLC25A10,TUBB4B,UBAC1,WDR34,ZMYND19 | APEH,ASL,AURKAIP1,CDK2AP2,CYBA,DUS1L,SLC52A2, LMAN2,MAEA,MRPL12,MRPS34,NDUFS6,NDUFS7,NDUFV1, PTGES2,SLC25A10,SLC25A39,TIMM13,TLCD1,TUFM,UQCRC1 |

| * Co-Expression network figures were drawn using R package igraph. Only the top 20 genes with the highest correlations were shown. Red circle: input gene, orange circle: cell metabolism gene, sky circle: other gene |
: Open all plots for all cancer types
| Top |
: Open all interacting genes' information including KEGG pathway for all interacting genes from DAVID
| Top |
| Pharmacological Information for PTGES2 |
| There's no related Drug. |
| Top |
| Cross referenced IDs for PTGES2 |
| * We obtained these cross-references from Uniprot database. It covers 150 different DBs, 18 categories. http://www.uniprot.org/help/cross_references_section |
: Open all cross reference information
|
Copyright © 2016-Present - The Univsersity of Texas Health Science Center at Houston @ |