|
||||||||||||||||||||||||||||||||||||||||||||||||||||||||||||||||||||||||||||||||||||||||||||||||||||||||||||||||||||||||||||||||||||||||||||||||||||||||||||||||||||||||||||||||||||||||||||||||||||||||||||||||||||||||||||||||||||||||||||||||||||||||||||||||||||||||||||||||||||||||||||||||||||||||||||||||||||||||||
| |
| Phenotypic Information (metabolism pathway, cancer, disease, phenome) |
| |
| |
| Gene-Gene Network Information: Co-Expression Network, Interacting Genes & KEGG |
| |
|


| Gene Summary for UXS1 |
| Top |
| Phenotypic Information for UXS1(metabolism pathway, cancer, disease, phenome) |
| Cancer | CGAP: UXS1 |
| Familial Cancer Database: UXS1 | |
| * This gene is included in those cancer gene databases. |
|
|
|
|
|
| . | ||||||||||||||||||||||||||||||||||||||||||||||||||||||||||||||||||||||||||||||||||||||||||||||||||||||||||||||||||||||||||||||||||||||||||||||||||||||||||||||||||||||||||||||||||||||||||||||||||||||||||||||||||||||||||||||||||||||||||||||||||||||||||||||||||||||||||||||||||||||||||||||||||||||||||||||||||||
Oncogene 1 | Significant driver gene in | |||||||||||||||||||||||||||||||||||||||||||||||||||||||||||||||||||||||||||||||||||||||||||||||||||||||||||||||||||||||||||||||||||||||||||||||||||||||||||||||||||||||||||||||||||||||||||||||||||||||||||||||||||||||||||||||||||||||||||||||||||||||||||||||||||||||||||||||||||||||||||||||||||||||||||||||||||||||||
| cf) number; DB name 1 Oncogene; http://nar.oxfordjournals.org/content/35/suppl_1/D721.long, 2 Tumor Suppressor gene; https://bioinfo.uth.edu/TSGene/, 3 Cancer Gene Census; http://www.nature.com/nrc/journal/v4/n3/abs/nrc1299.html, 4 CancerGenes; http://nar.oxfordjournals.org/content/35/suppl_1/D721.long, 5 Network of Cancer Gene; http://ncg.kcl.ac.uk/index.php, 1Therapeutic Vulnerabilities in Cancer; http://cbio.mskcc.org/cancergenomics/statius/ |
| KEGG_STARCH_AND_SUCROSE_METABOLISM KEGG_AMINO_SUGAR_AND_NUCLEOTIDE_SUGAR_METABOLISM | |
| OMIM | |
| Orphanet | |
| Disease | KEGG Disease: UXS1 |
| MedGen: UXS1 (Human Medical Genetics with Condition) | |
| ClinVar: UXS1 | |
| Phenotype | MGI: UXS1 (International Mouse Phenotyping Consortium) |
| PhenomicDB: UXS1 | |
| Mutations for UXS1 |
| * Under tables are showing count per each tissue to give us broad intuition about tissue specific mutation patterns.You can go to the detailed page for each mutation database's web site. |
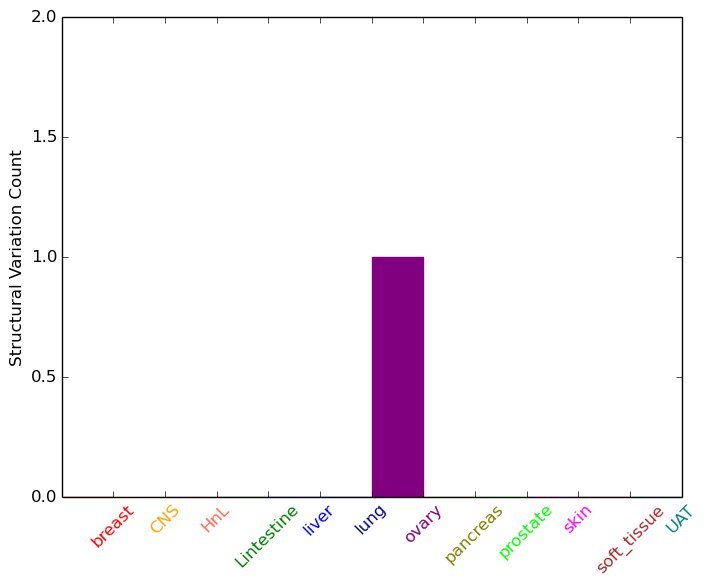
| - Statistics for Tissue and Mutation type | Top |
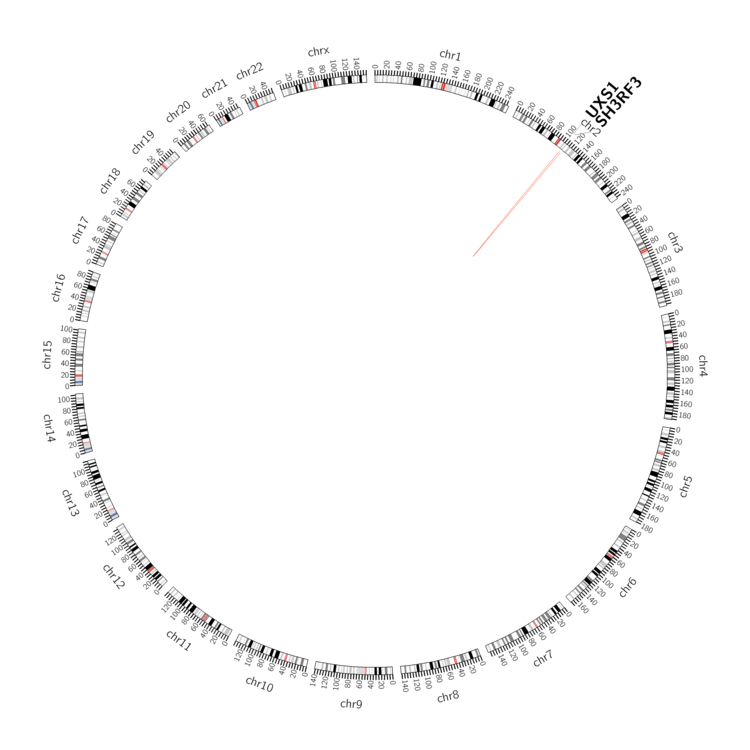 |
| - For Inter-chromosomal Variations |
| There's no inter-chromosomal structural variation. |
| - For Intra-chromosomal Variations |
| * Intra-chromosomal variantions includes 'intrachromosomal amplicon to amplicon', 'intrachromosomal amplicon to non-amplified dna', 'intrachromosomal deletion', 'intrachromosomal fold-back inversion', 'intrachromosomal inversion', 'intrachromosomal tandem duplication', 'Intrachromosomal unknown type', 'intrachromosomal with inverted orientation', 'intrachromosomal with non-inverted orientation'. |
 |
| Sample | Symbol_a | Chr_a | Start_a | End_a | Symbol_b | Chr_b | Start_b | End_b |
| ovary | UXS1 | chr2 | 106739958 | 106740158 | SH3RF3 | chr2 | 109991610 | 109991810 |
| cf) Tissue number; Tissue name (1;Breast, 2;Central_nervous_system, 3;Haematopoietic_and_lymphoid_tissue, 4;Large_intestine, 5;Liver, 6;Lung, 7;Ovary, 8;Pancreas, 9;Prostate, 10;Skin, 11;Soft_tissue, 12;Upper_aerodigestive_tract) |
| * From mRNA Sanger sequences, Chitars2.0 arranged chimeric transcripts. This table shows UXS1 related fusion information. |
| ID | Head Gene | Tail Gene | Accession | Gene_a | qStart_a | qEnd_a | Chromosome_a | tStart_a | tEnd_a | Gene_a | qStart_a | qEnd_a | Chromosome_a | tStart_a | tEnd_a |
| BE156057 | UXS1 | 24 | 133 | 2 | 106710595 | 106713264 | PCBP2 | 131 | 543 | 12 | 53854515 | 53854927 | |
| BF367966 | UXS1 | 2 | 301 | 2 | 106710218 | 106710518 | VTI1A | 298 | 471 | 10 | 114374416 | 114374589 | |
| Top |
| Mutation type/ Tissue ID | brca | cns | cerv | endome | haematopo | kidn | Lintest | liver | lung | ns | ovary | pancre | prost | skin | stoma | thyro | urina | |||
| Total # sample | 1 | 1 | 2 | 1 | ||||||||||||||||
| GAIN (# sample) | 1 | 2 | 1 | |||||||||||||||||
| LOSS (# sample) | 1 |
| cf) Tissue ID; Tissue type (1; Breast, 2; Central_nervous_system, 3; Cervix, 4; Endometrium, 5; Haematopoietic_and_lymphoid_tissue, 6; Kidney, 7; Large_intestine, 8; Liver, 9; Lung, 10; NS, 11; Ovary, 12; Pancreas, 13; Prostate, 14; Skin, 15; Stomach, 16; Thyroid, 17; Urinary_tract) |
| Top |
|
 |
| Top |
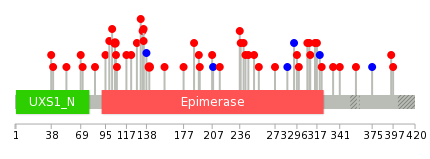
| Stat. for Non-Synonymous SNVs (# total SNVs=44) | (# total SNVs=4) |
 | 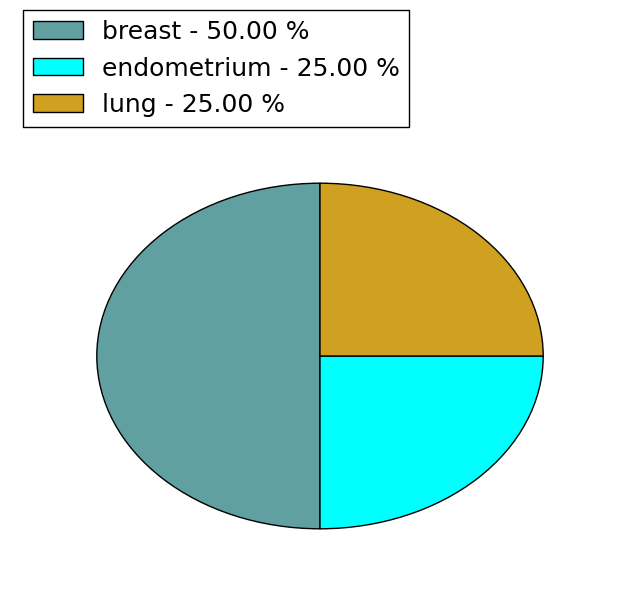 |
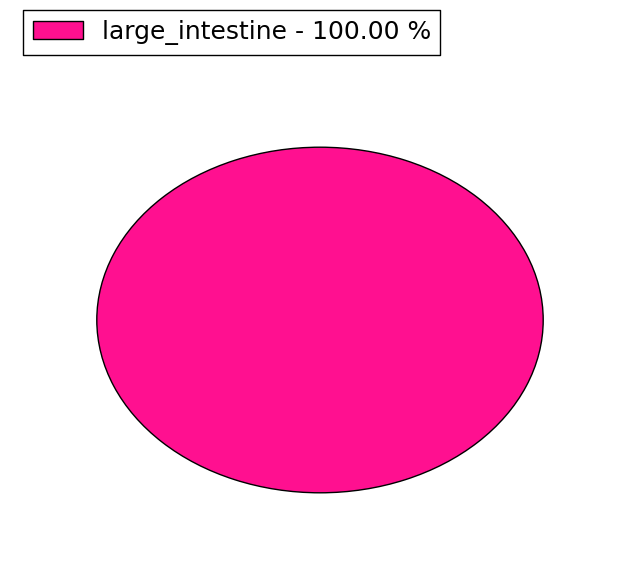
(# total SNVs=0) | (# total SNVs=2) |
 |
| Top |
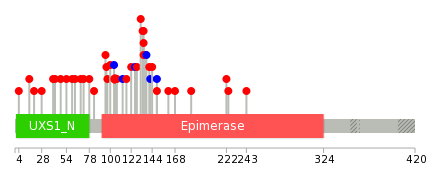
| * When you move the cursor on each content, you can see more deailed mutation information on the Tooltip. Those are primary_site,primary_histology,mutation(aa),pubmedID. |
| GRCh37 position | Mutation(aa) | Unique sampleID count |
| chr2:106761696-106761696 | p.E141G | 2 |
| chr2:106761805-106761805 | p.V105L | 2 |
| chr2:106717549-106717549 | p.L317I | 1 |
| chr2:106761723-106761723 | p.R132I | 1 |
| chr2:106729215-106729215 | p.V256M | 1 |
| chr2:106780123-106780124 | p.S77fs*35 | 1 |
| chr2:106710571-106710571 | p.R397C | 1 |
| chr2:106742133-106742133 | p.L194V | 1 |
| chr2:106717555-106717555 | p.V315L | 1 |
| chr2:106761735-106761735 | p.T128M | 1 |
| Top |
|
 |
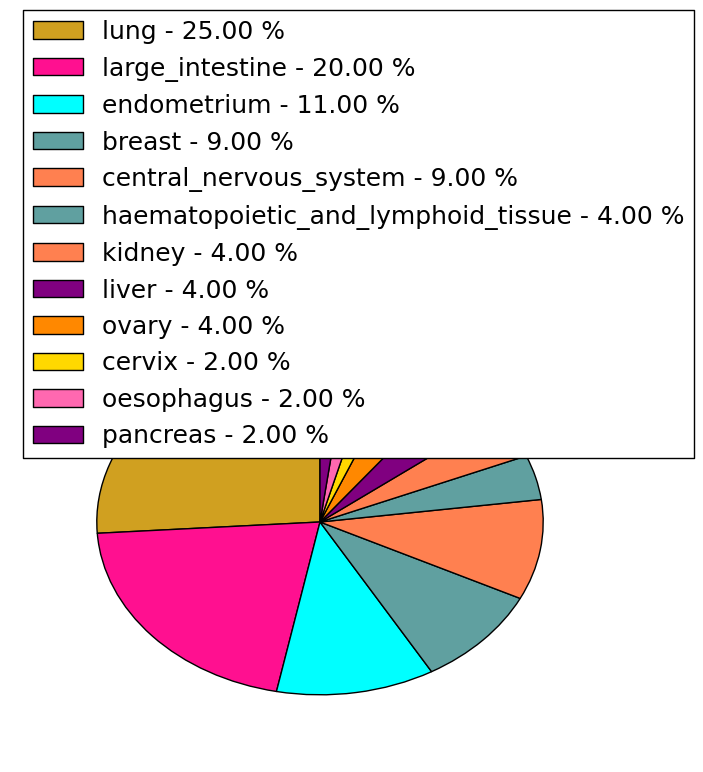
| Point Mutation/ Tissue ID | 1 | 2 | 3 | 4 | 5 | 6 | 7 | 8 | 9 | 10 | 11 | 12 | 13 | 14 | 15 | 16 | 17 | 18 | 19 | 20 |
| # sample | 2 | 1 | 10 | 2 | 1 | 3 | 1 | 5 | 4 | 2 | 3 | 3 | 6 | |||||||
| # mutation | 2 | 1 | 11 | 2 | 1 | 3 | 1 | 5 | 4 | 1 | 3 | 3 | 6 | |||||||
| nonsynonymous SNV | 2 | 1 | 10 | 2 | 1 | 2 | 4 | 4 | 1 | 2 | 3 | 5 | ||||||||
| synonymous SNV | 1 | 1 | 1 | 1 | 1 | 1 |
| cf) Tissue ID; Tissue type (1; BLCA[Bladder Urothelial Carcinoma], 2; BRCA[Breast invasive carcinoma], 3; CESC[Cervical squamous cell carcinoma and endocervical adenocarcinoma], 4; COAD[Colon adenocarcinoma], 5; GBM[Glioblastoma multiforme], 6; Glioma Low Grade, 7; HNSC[Head and Neck squamous cell carcinoma], 8; KICH[Kidney Chromophobe], 9; KIRC[Kidney renal clear cell carcinoma], 10; KIRP[Kidney renal papillary cell carcinoma], 11; LAML[Acute Myeloid Leukemia], 12; LUAD[Lung adenocarcinoma], 13; LUSC[Lung squamous cell carcinoma], 14; OV[Ovarian serous cystadenocarcinoma ], 15; PAAD[Pancreatic adenocarcinoma], 16; PRAD[Prostate adenocarcinoma], 17; SKCM[Skin Cutaneous Melanoma], 18:STAD[Stomach adenocarcinoma], 19:THCA[Thyroid carcinoma], 20:UCEC[Uterine Corpus Endometrial Carcinoma]) |
| Top |
| * We represented just top 10 SNVs. When you move the cursor on each content, you can see more deailed mutation information on the Tooltip. Those are primary_site, primary_histology, mutation(aa), pubmedID. |
| Genomic Position | Mutation(aa) | Unique sampleID count |
| chr2:106761805 | p.V105L,UXS1 | 2 |
| chr2:106729123 | p.R243T,UXS1 | 1 |
| chr2:106781218 | p.T72I,UXS1 | 1 |
| chr2:106742111 | p.R132I,UXS1 | 1 |
| chr2:106710513 | p.R224C,UXS1 | 1 |
| chr2:106761723 | p.Y63C,UXS1 | 1 |
| chr2:106729163 | p.T128M,UXS1 | 1 |
| chr2:106782514 | p.Y222F,UXS1 | 1 |
| chr2:106746130 | p.R60L,UXS1 | 1 |
| chr2:106710571 | p.F126F,UXS1 | 1 |
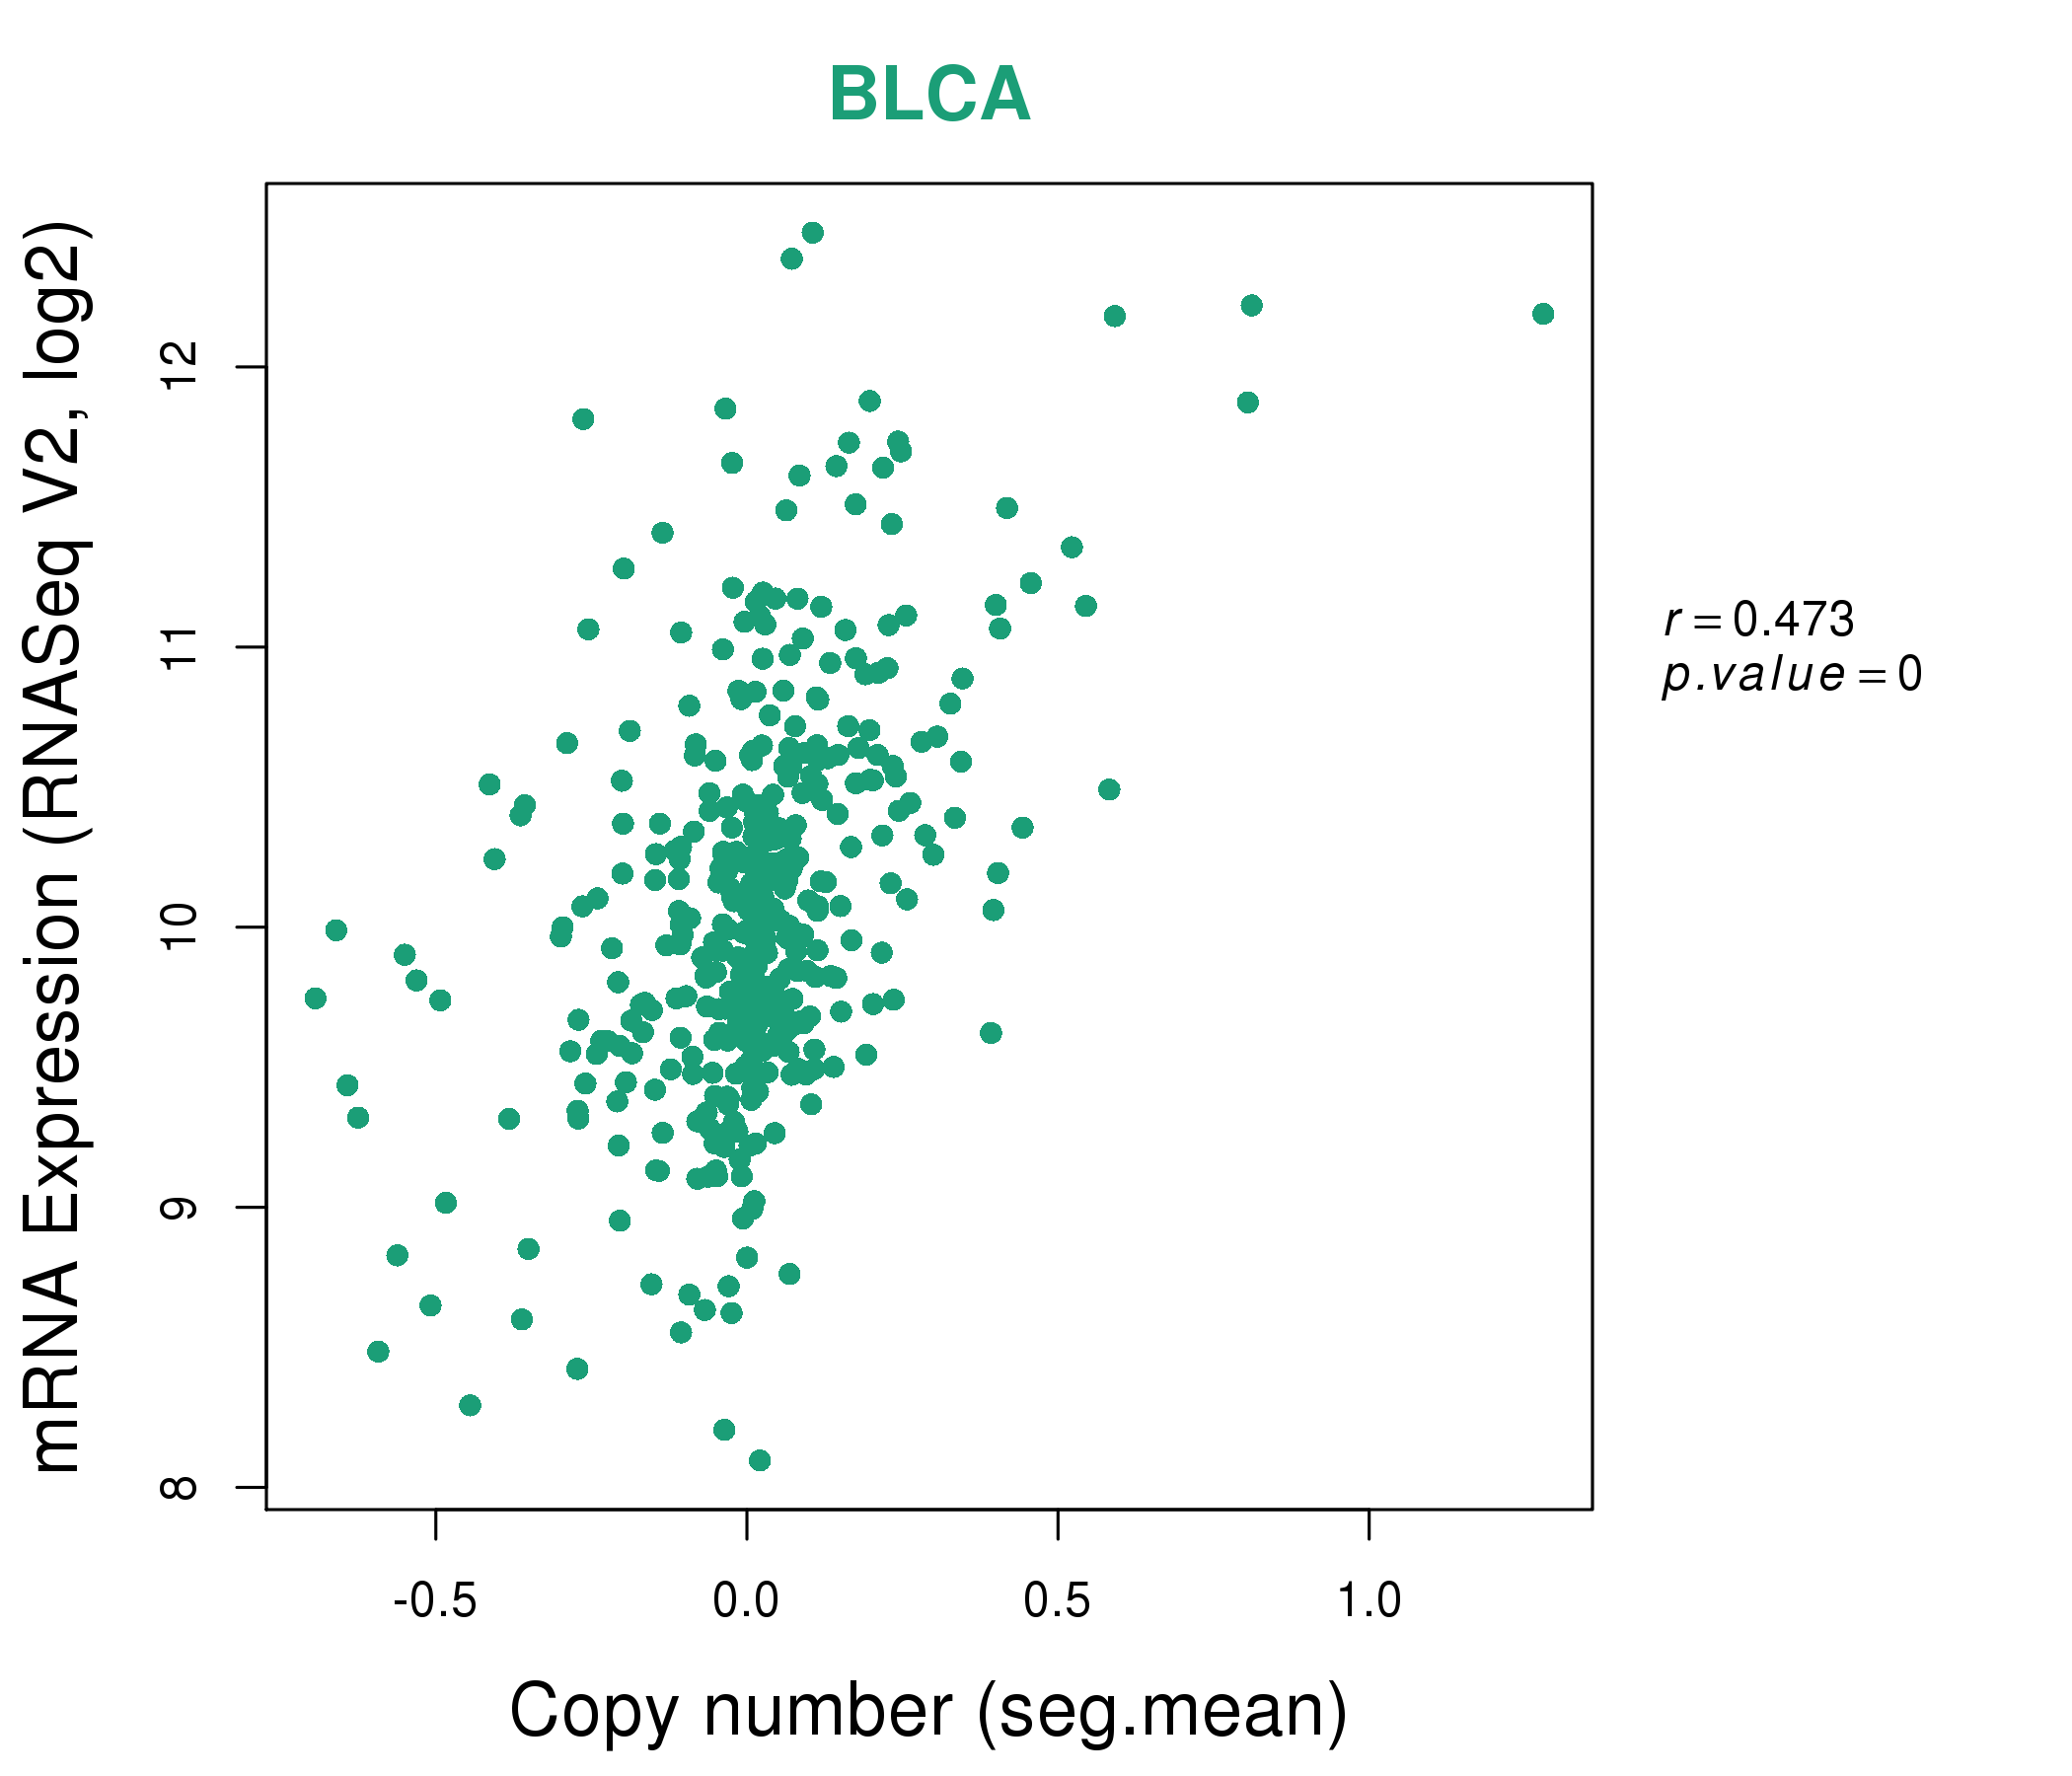
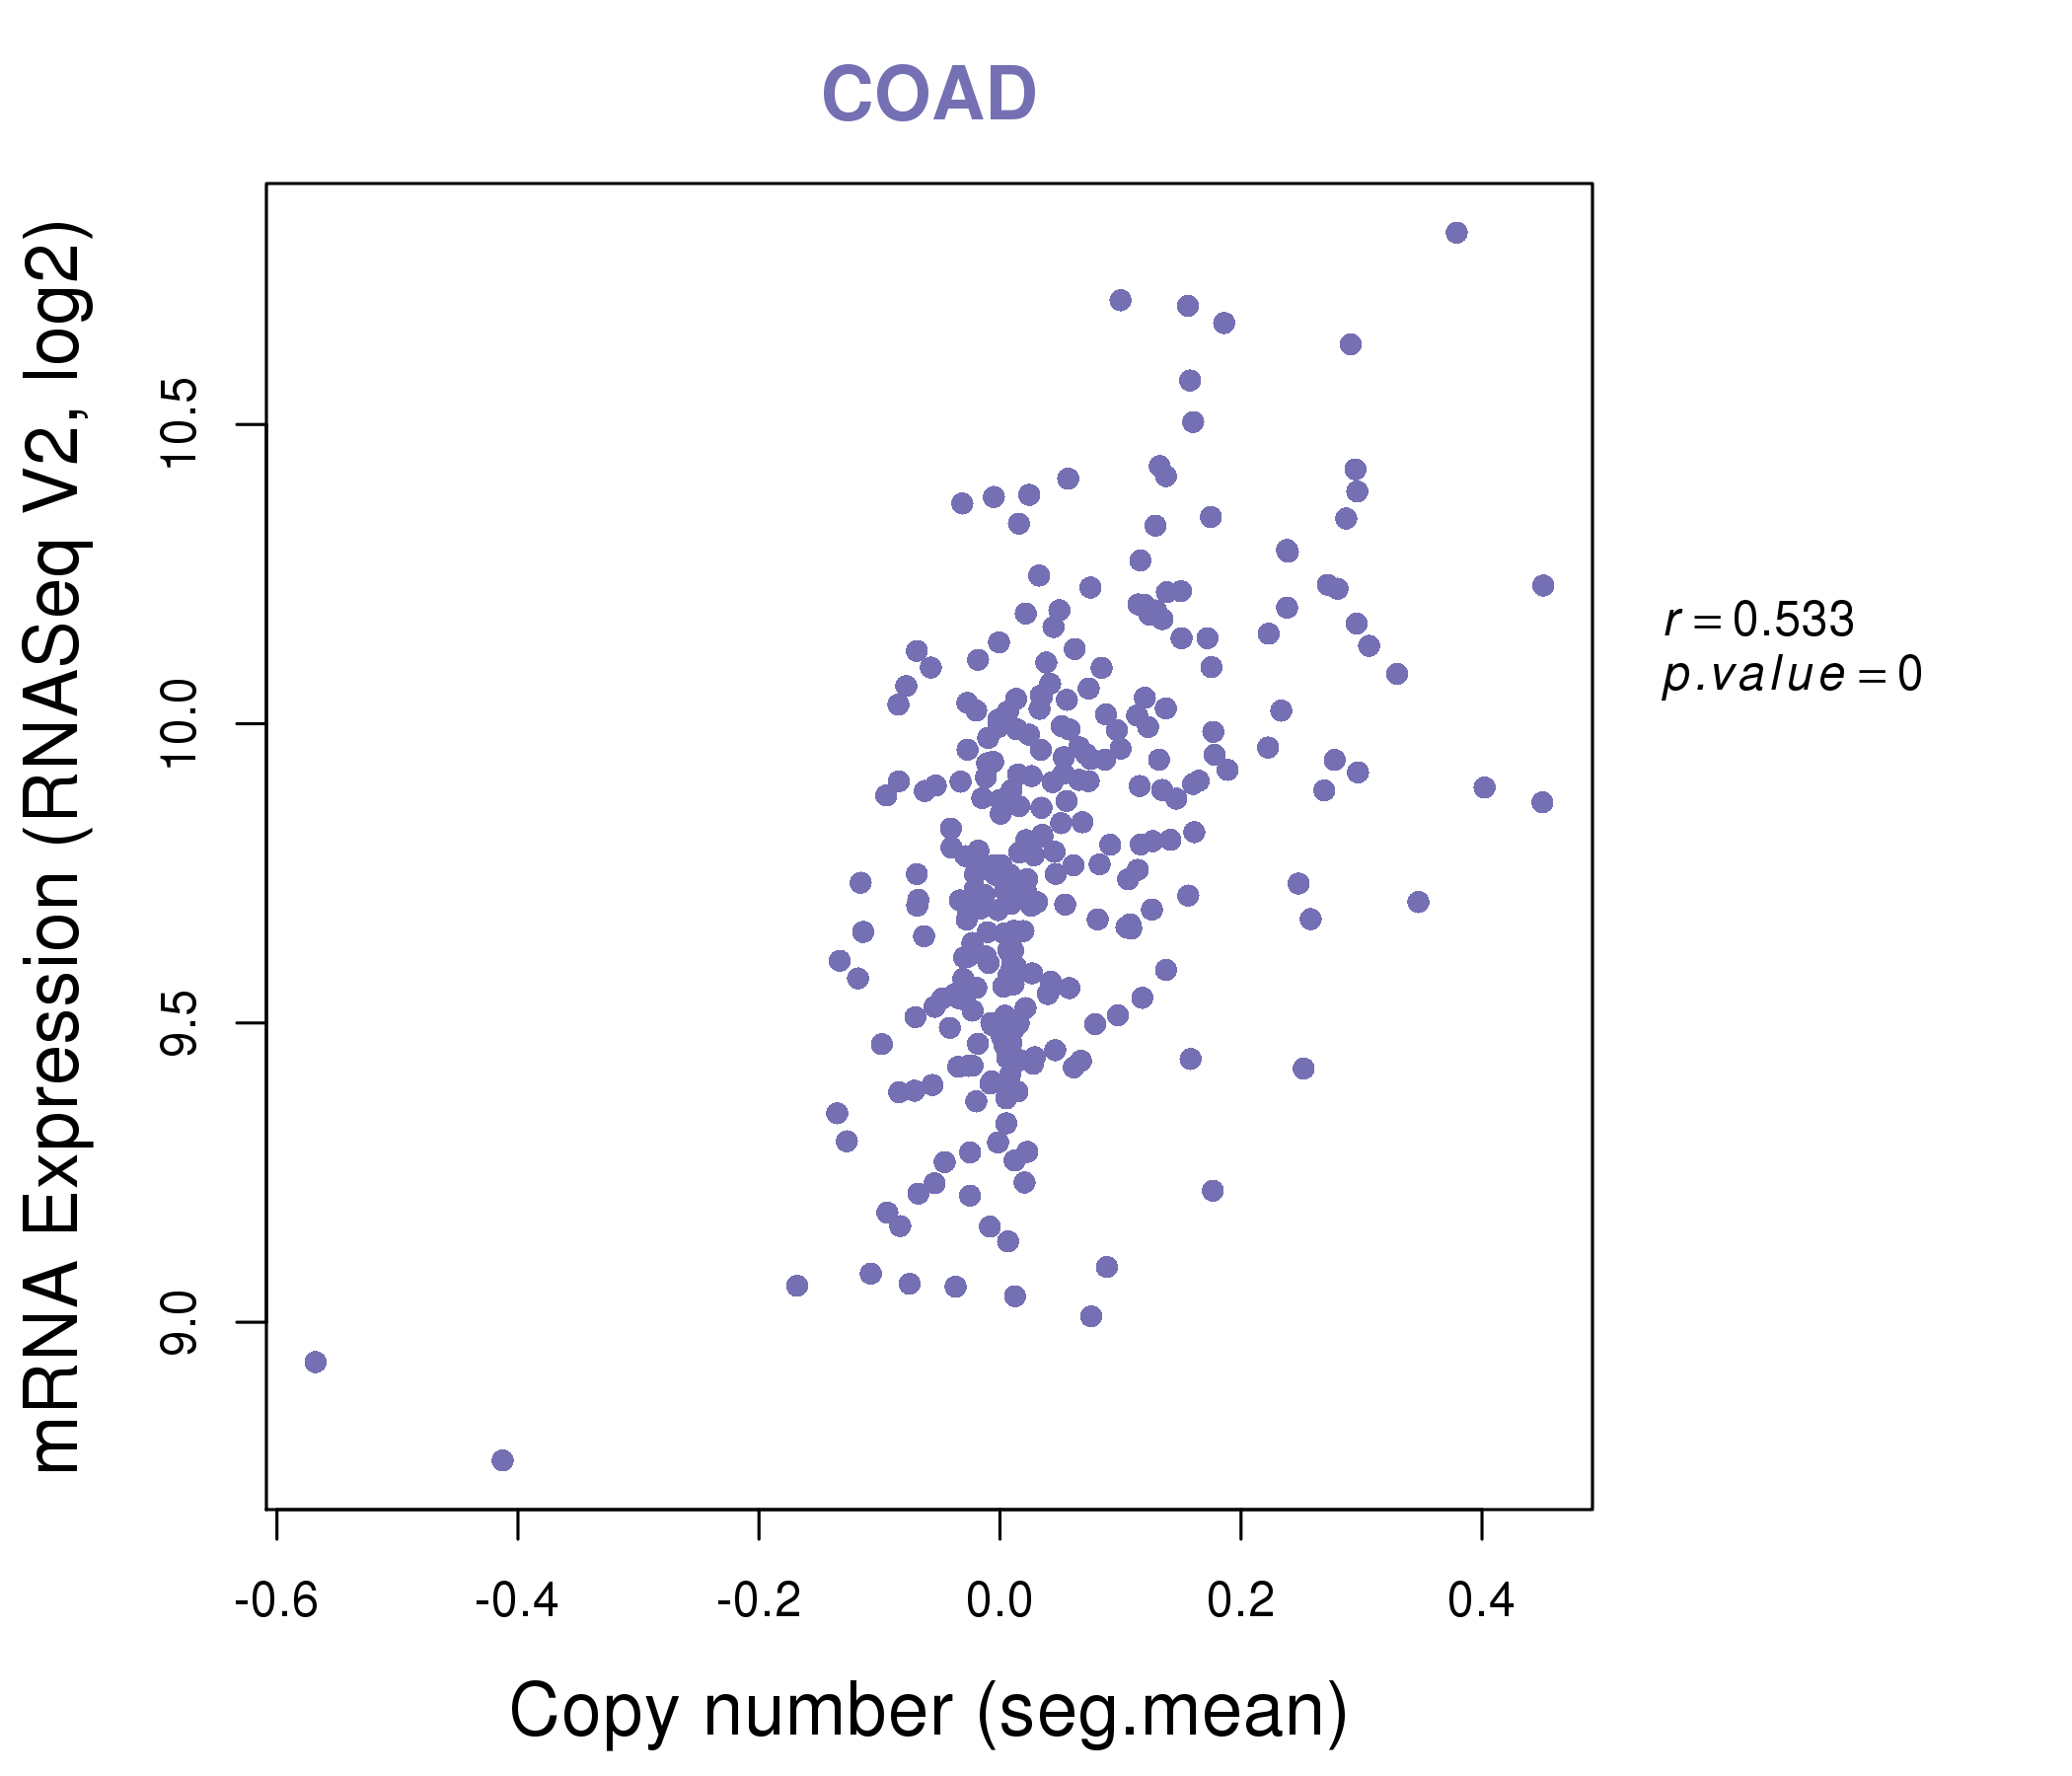
| * Copy number data were extracted from TCGA using R package TCGA-Assembler. The URLs of all public data files on TCGA DCC data server were gathered on Jan-05-2015. Function ProcessCNAData in TCGA-Assembler package was used to obtain gene-level copy number value which is calculated as the average copy number of the genomic region of a gene. |
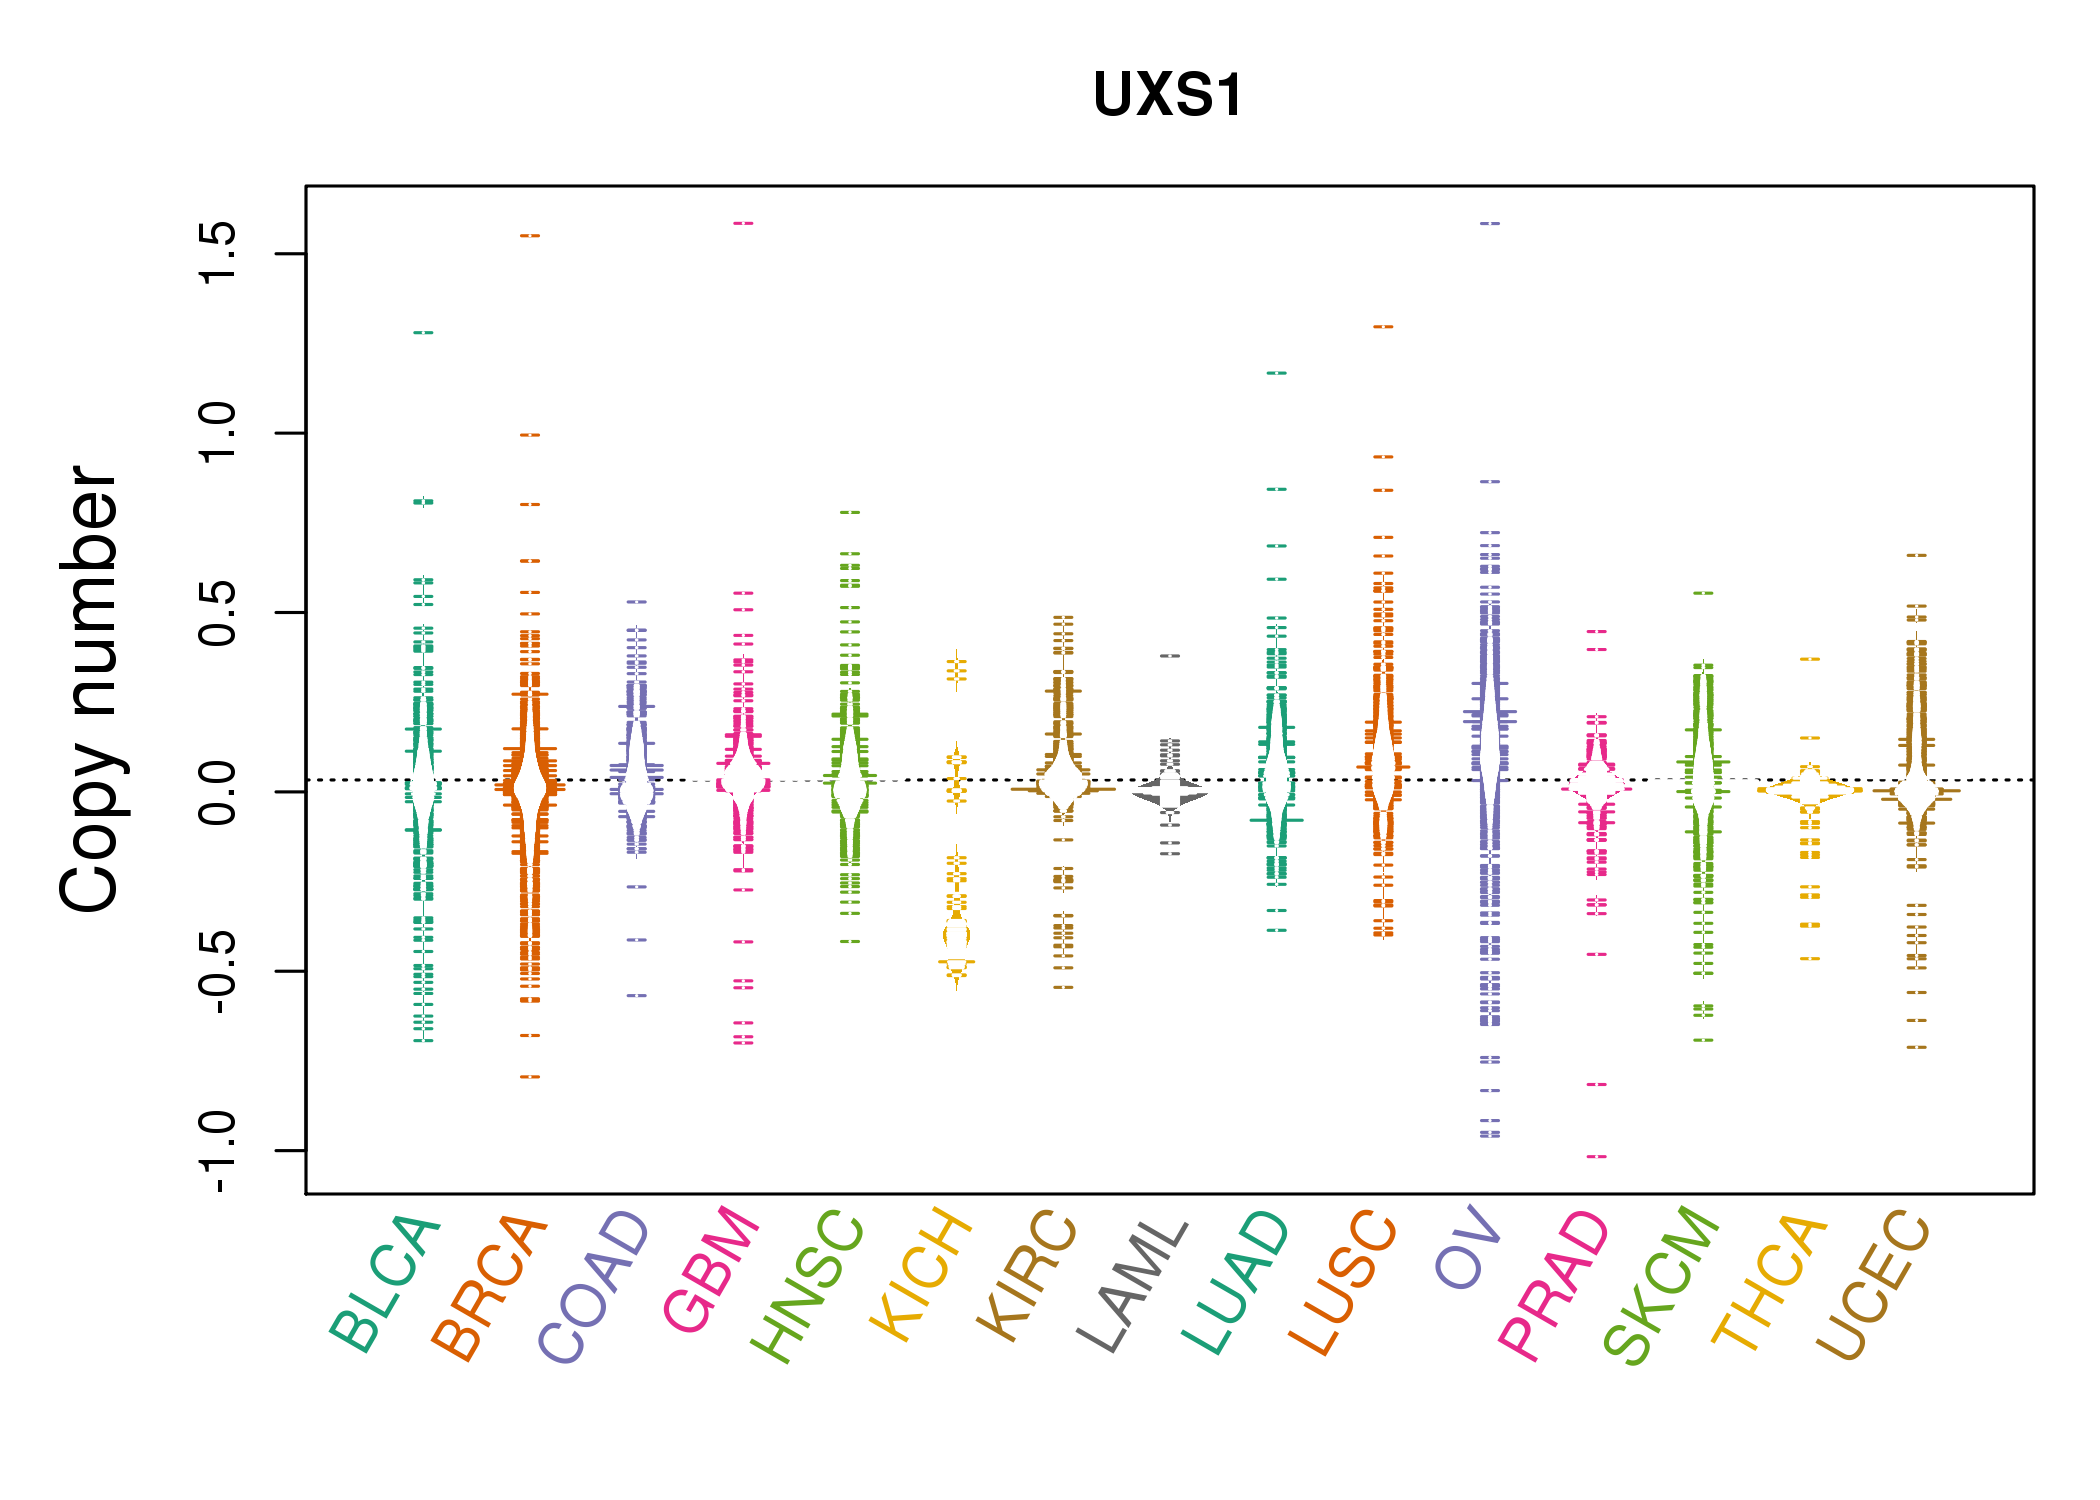 |
| cf) Tissue ID[Tissue type]: BLCA[Bladder Urothelial Carcinoma], BRCA[Breast invasive carcinoma], CESC[Cervical squamous cell carcinoma and endocervical adenocarcinoma], COAD[Colon adenocarcinoma], GBM[Glioblastoma multiforme], Glioma Low Grade, HNSC[Head and Neck squamous cell carcinoma], KICH[Kidney Chromophobe], KIRC[Kidney renal clear cell carcinoma], KIRP[Kidney renal papillary cell carcinoma], LAML[Acute Myeloid Leukemia], LUAD[Lung adenocarcinoma], LUSC[Lung squamous cell carcinoma], OV[Ovarian serous cystadenocarcinoma ], PAAD[Pancreatic adenocarcinoma], PRAD[Prostate adenocarcinoma], SKCM[Skin Cutaneous Melanoma], STAD[Stomach adenocarcinoma], THCA[Thyroid carcinoma], UCEC[Uterine Corpus Endometrial Carcinoma] |
| Top |
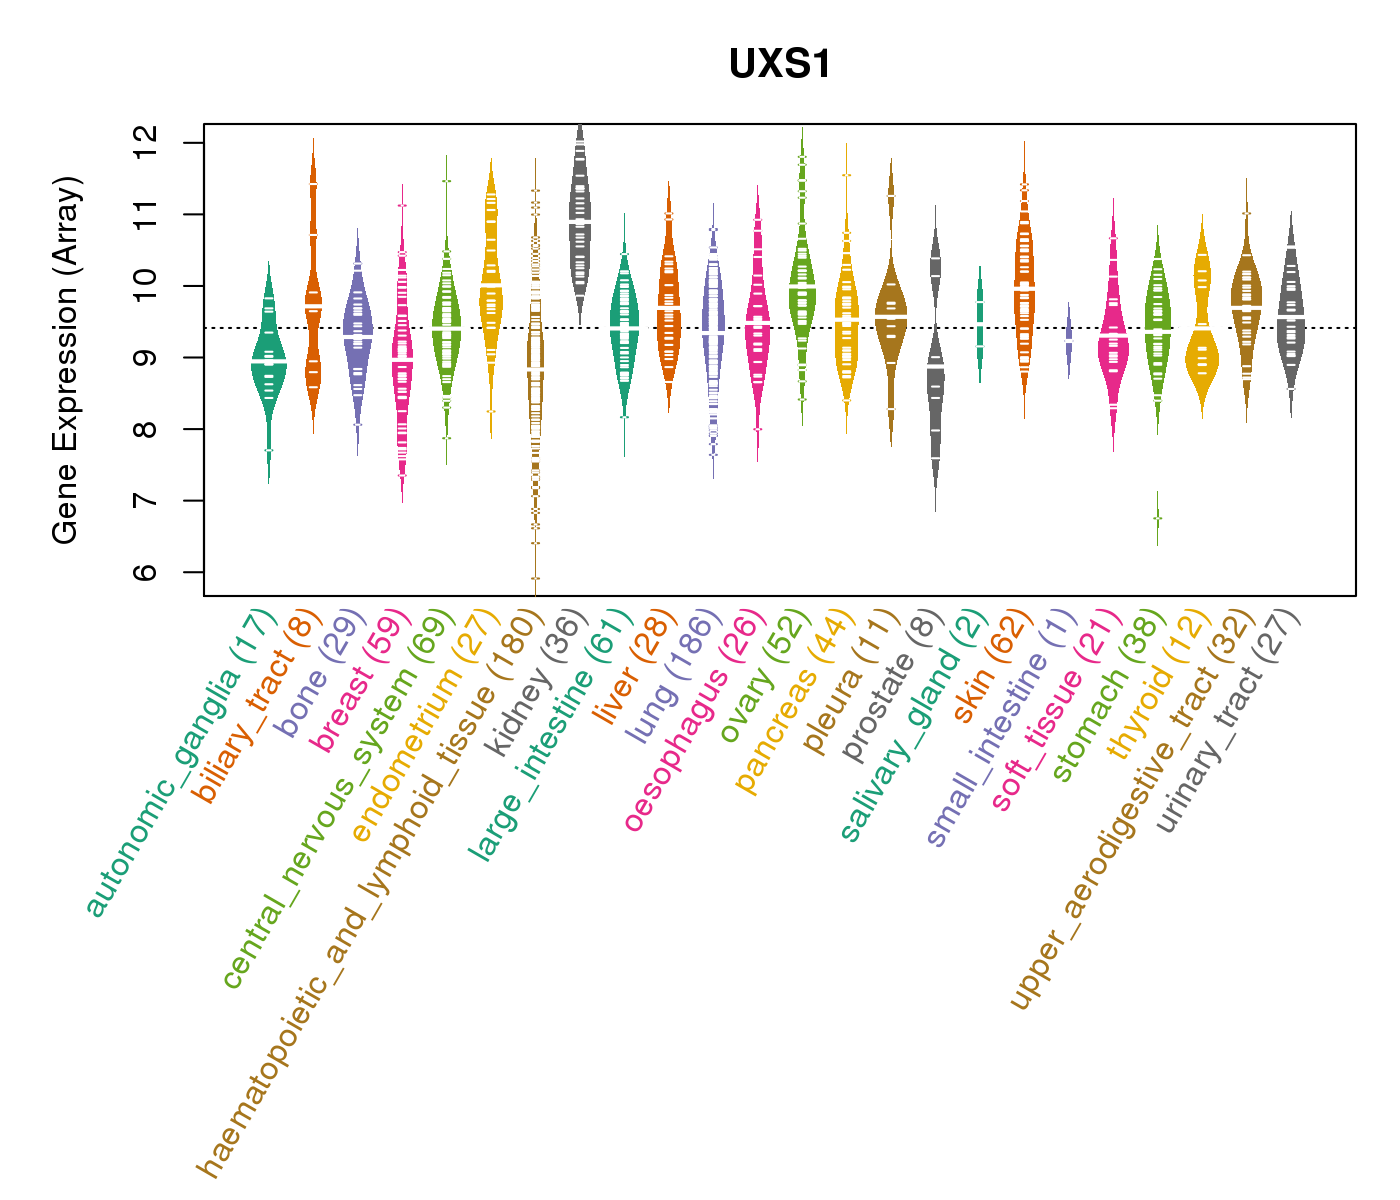
| Gene Expression for UXS1 |
| * CCLE gene expression data were extracted from CCLE_Expression_Entrez_2012-10-18.res: Gene-centric RMA-normalized mRNA expression data. |
 |
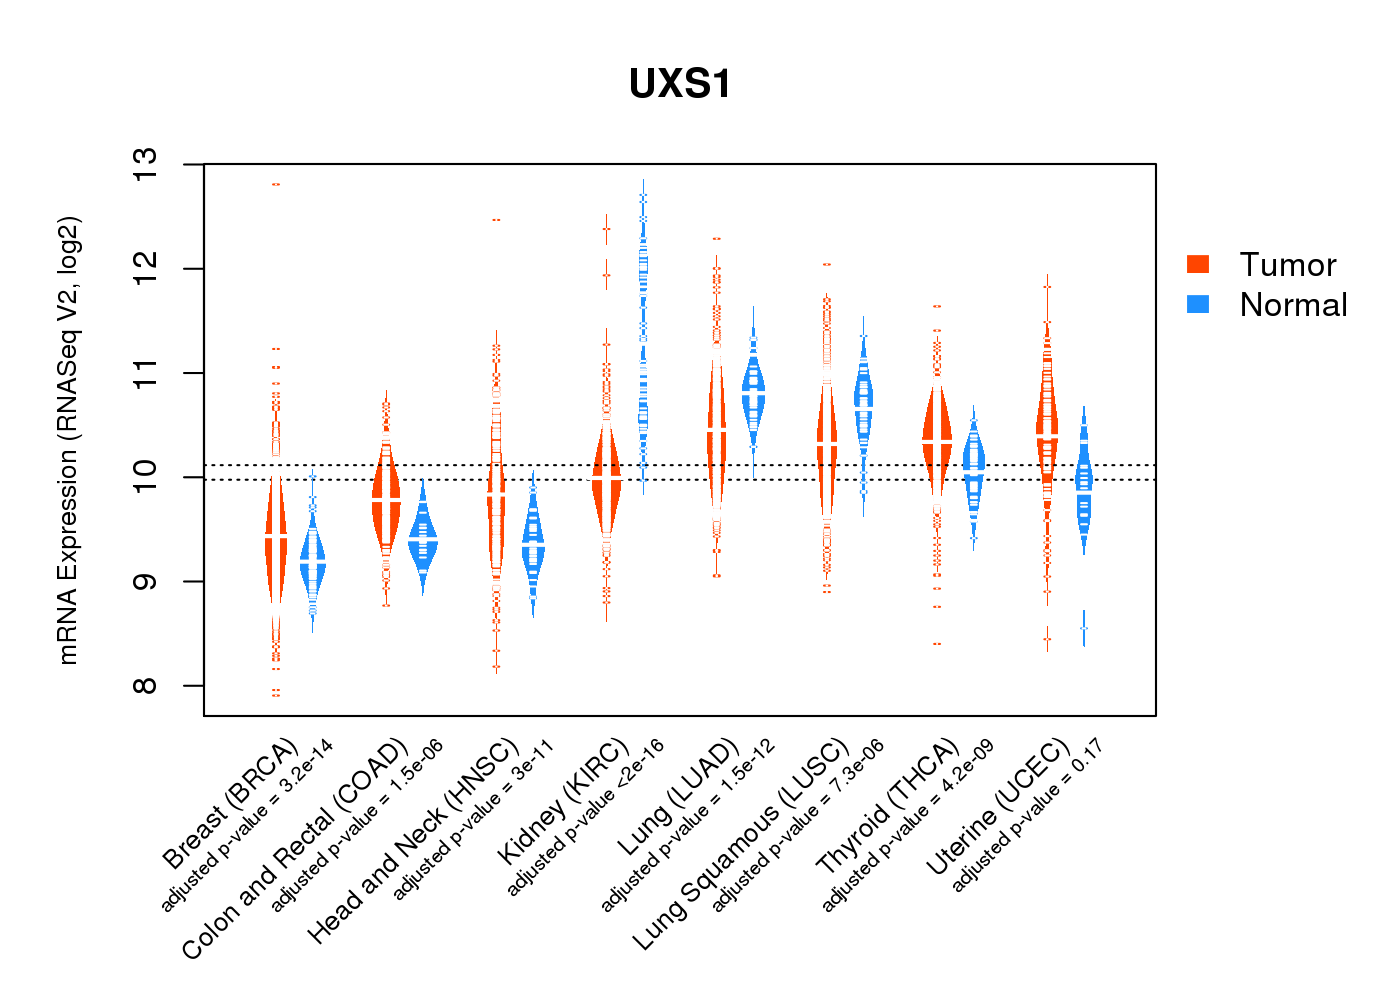
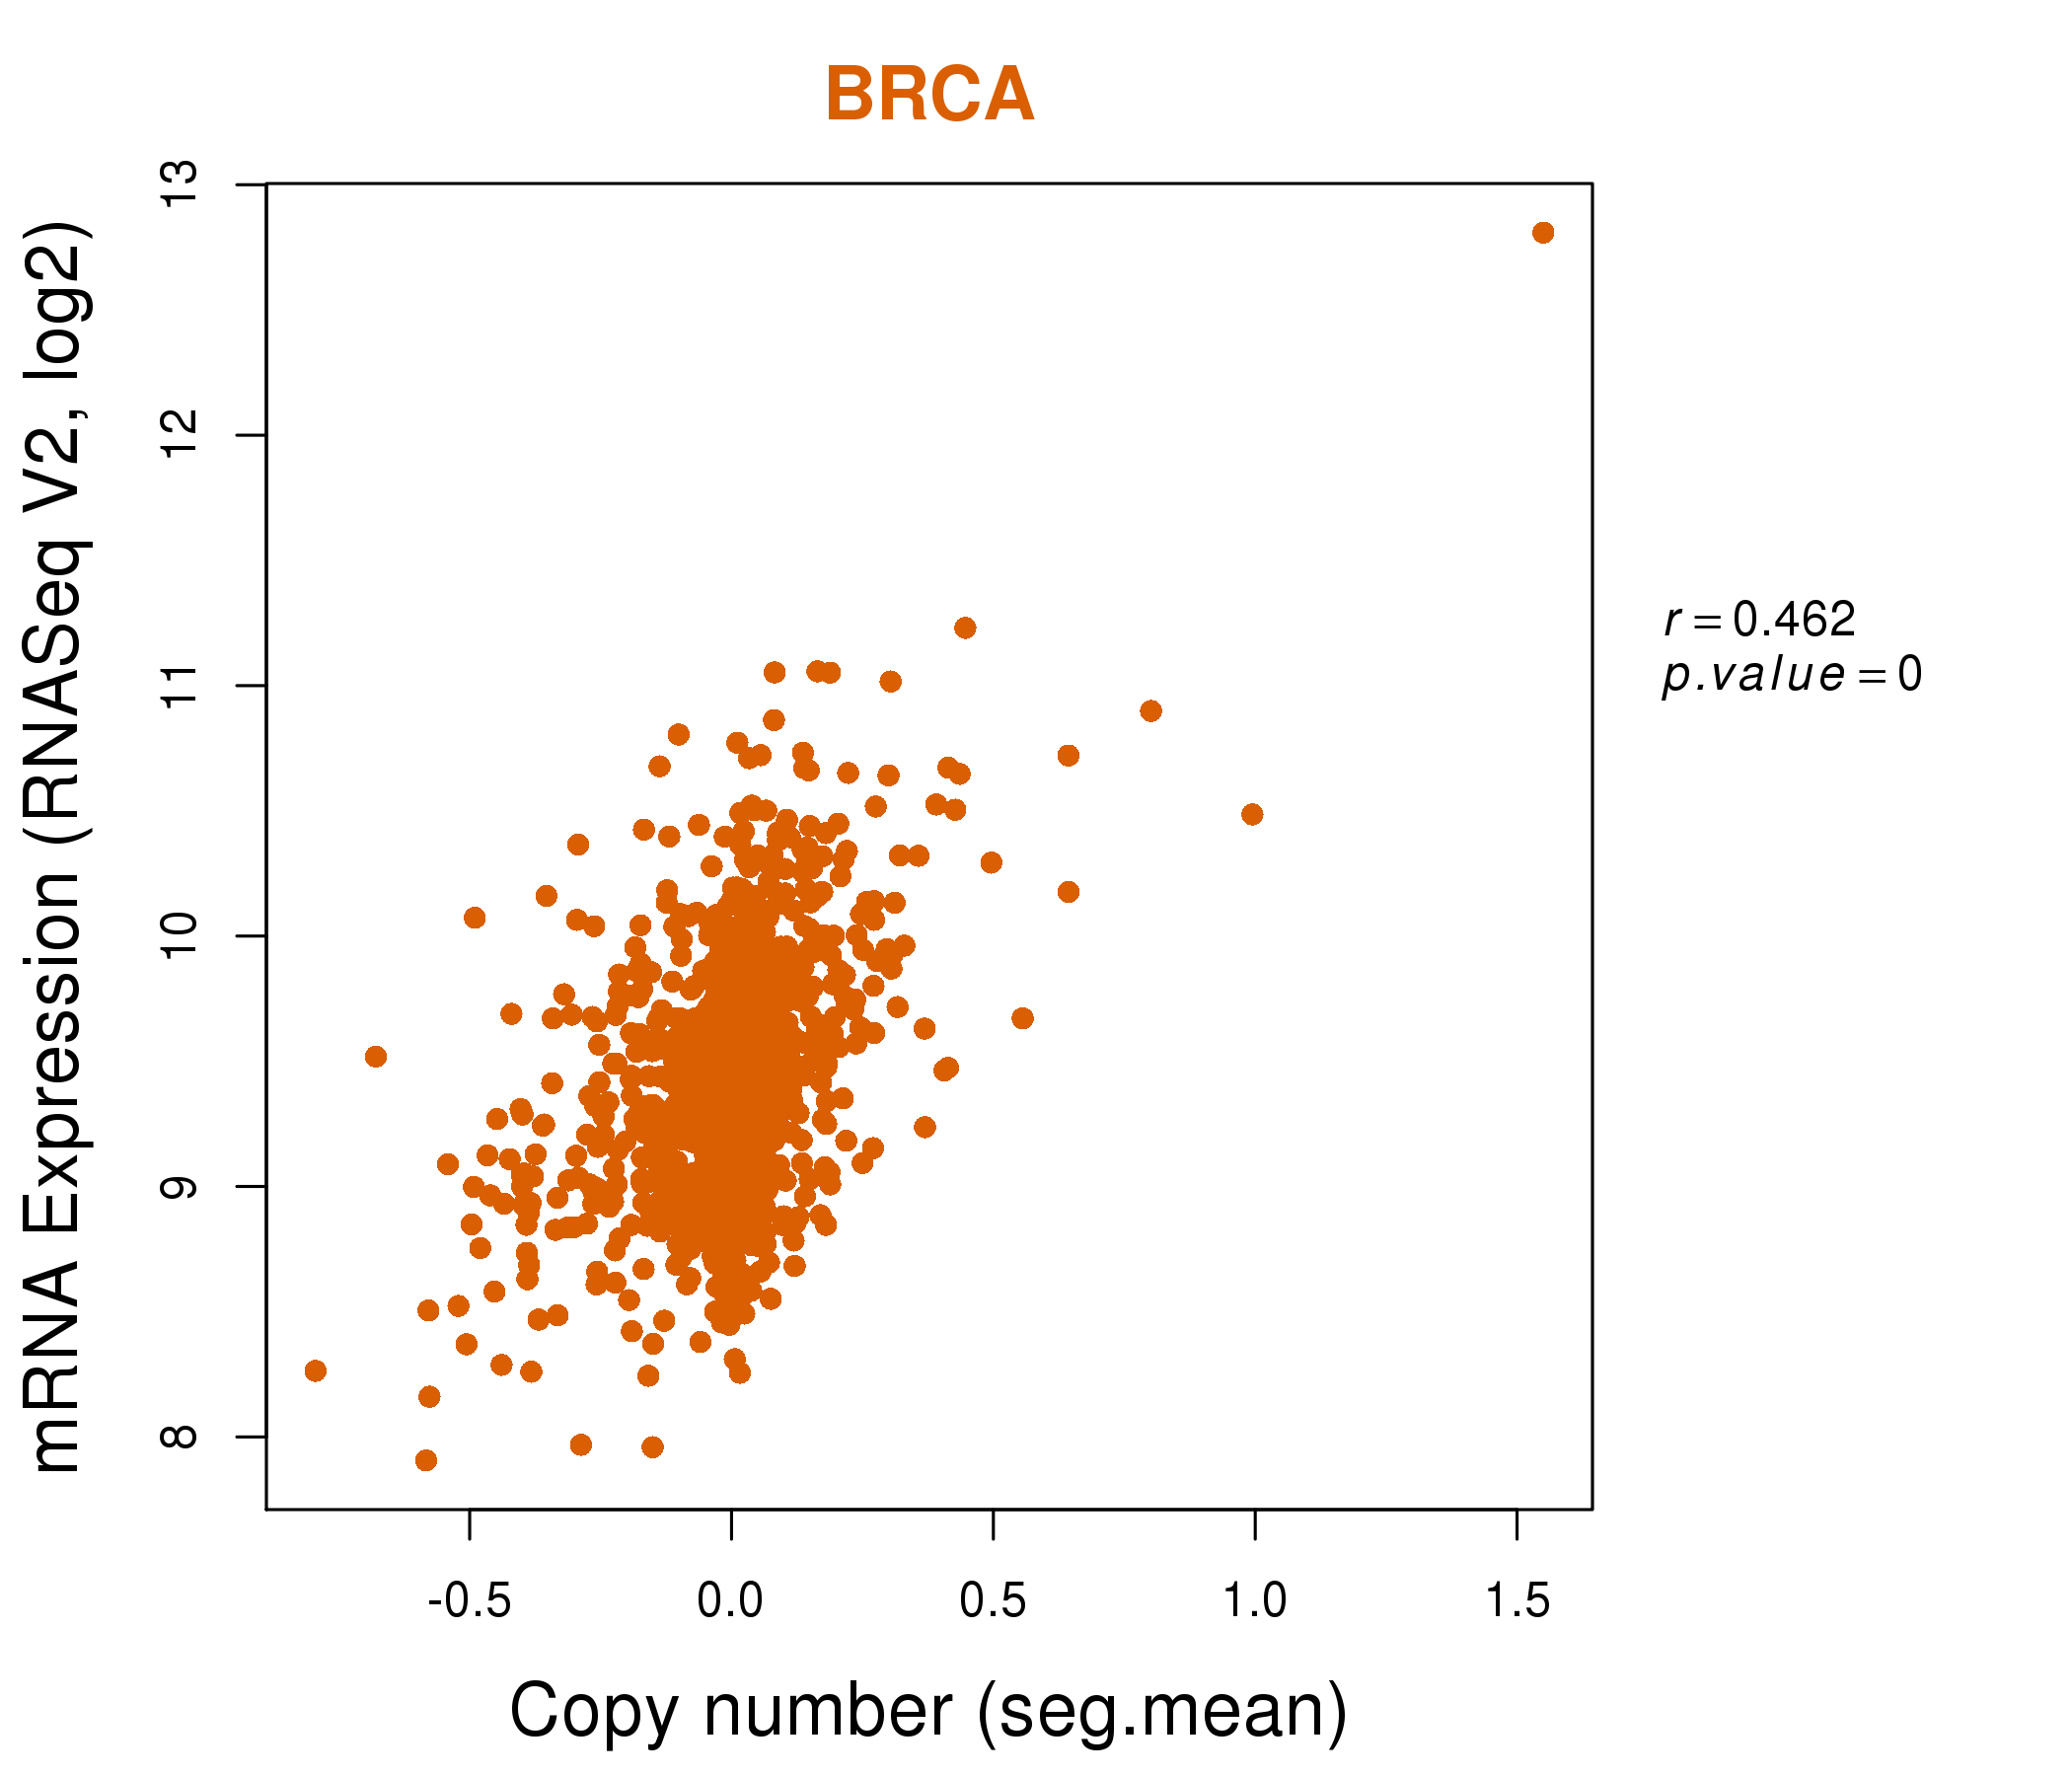
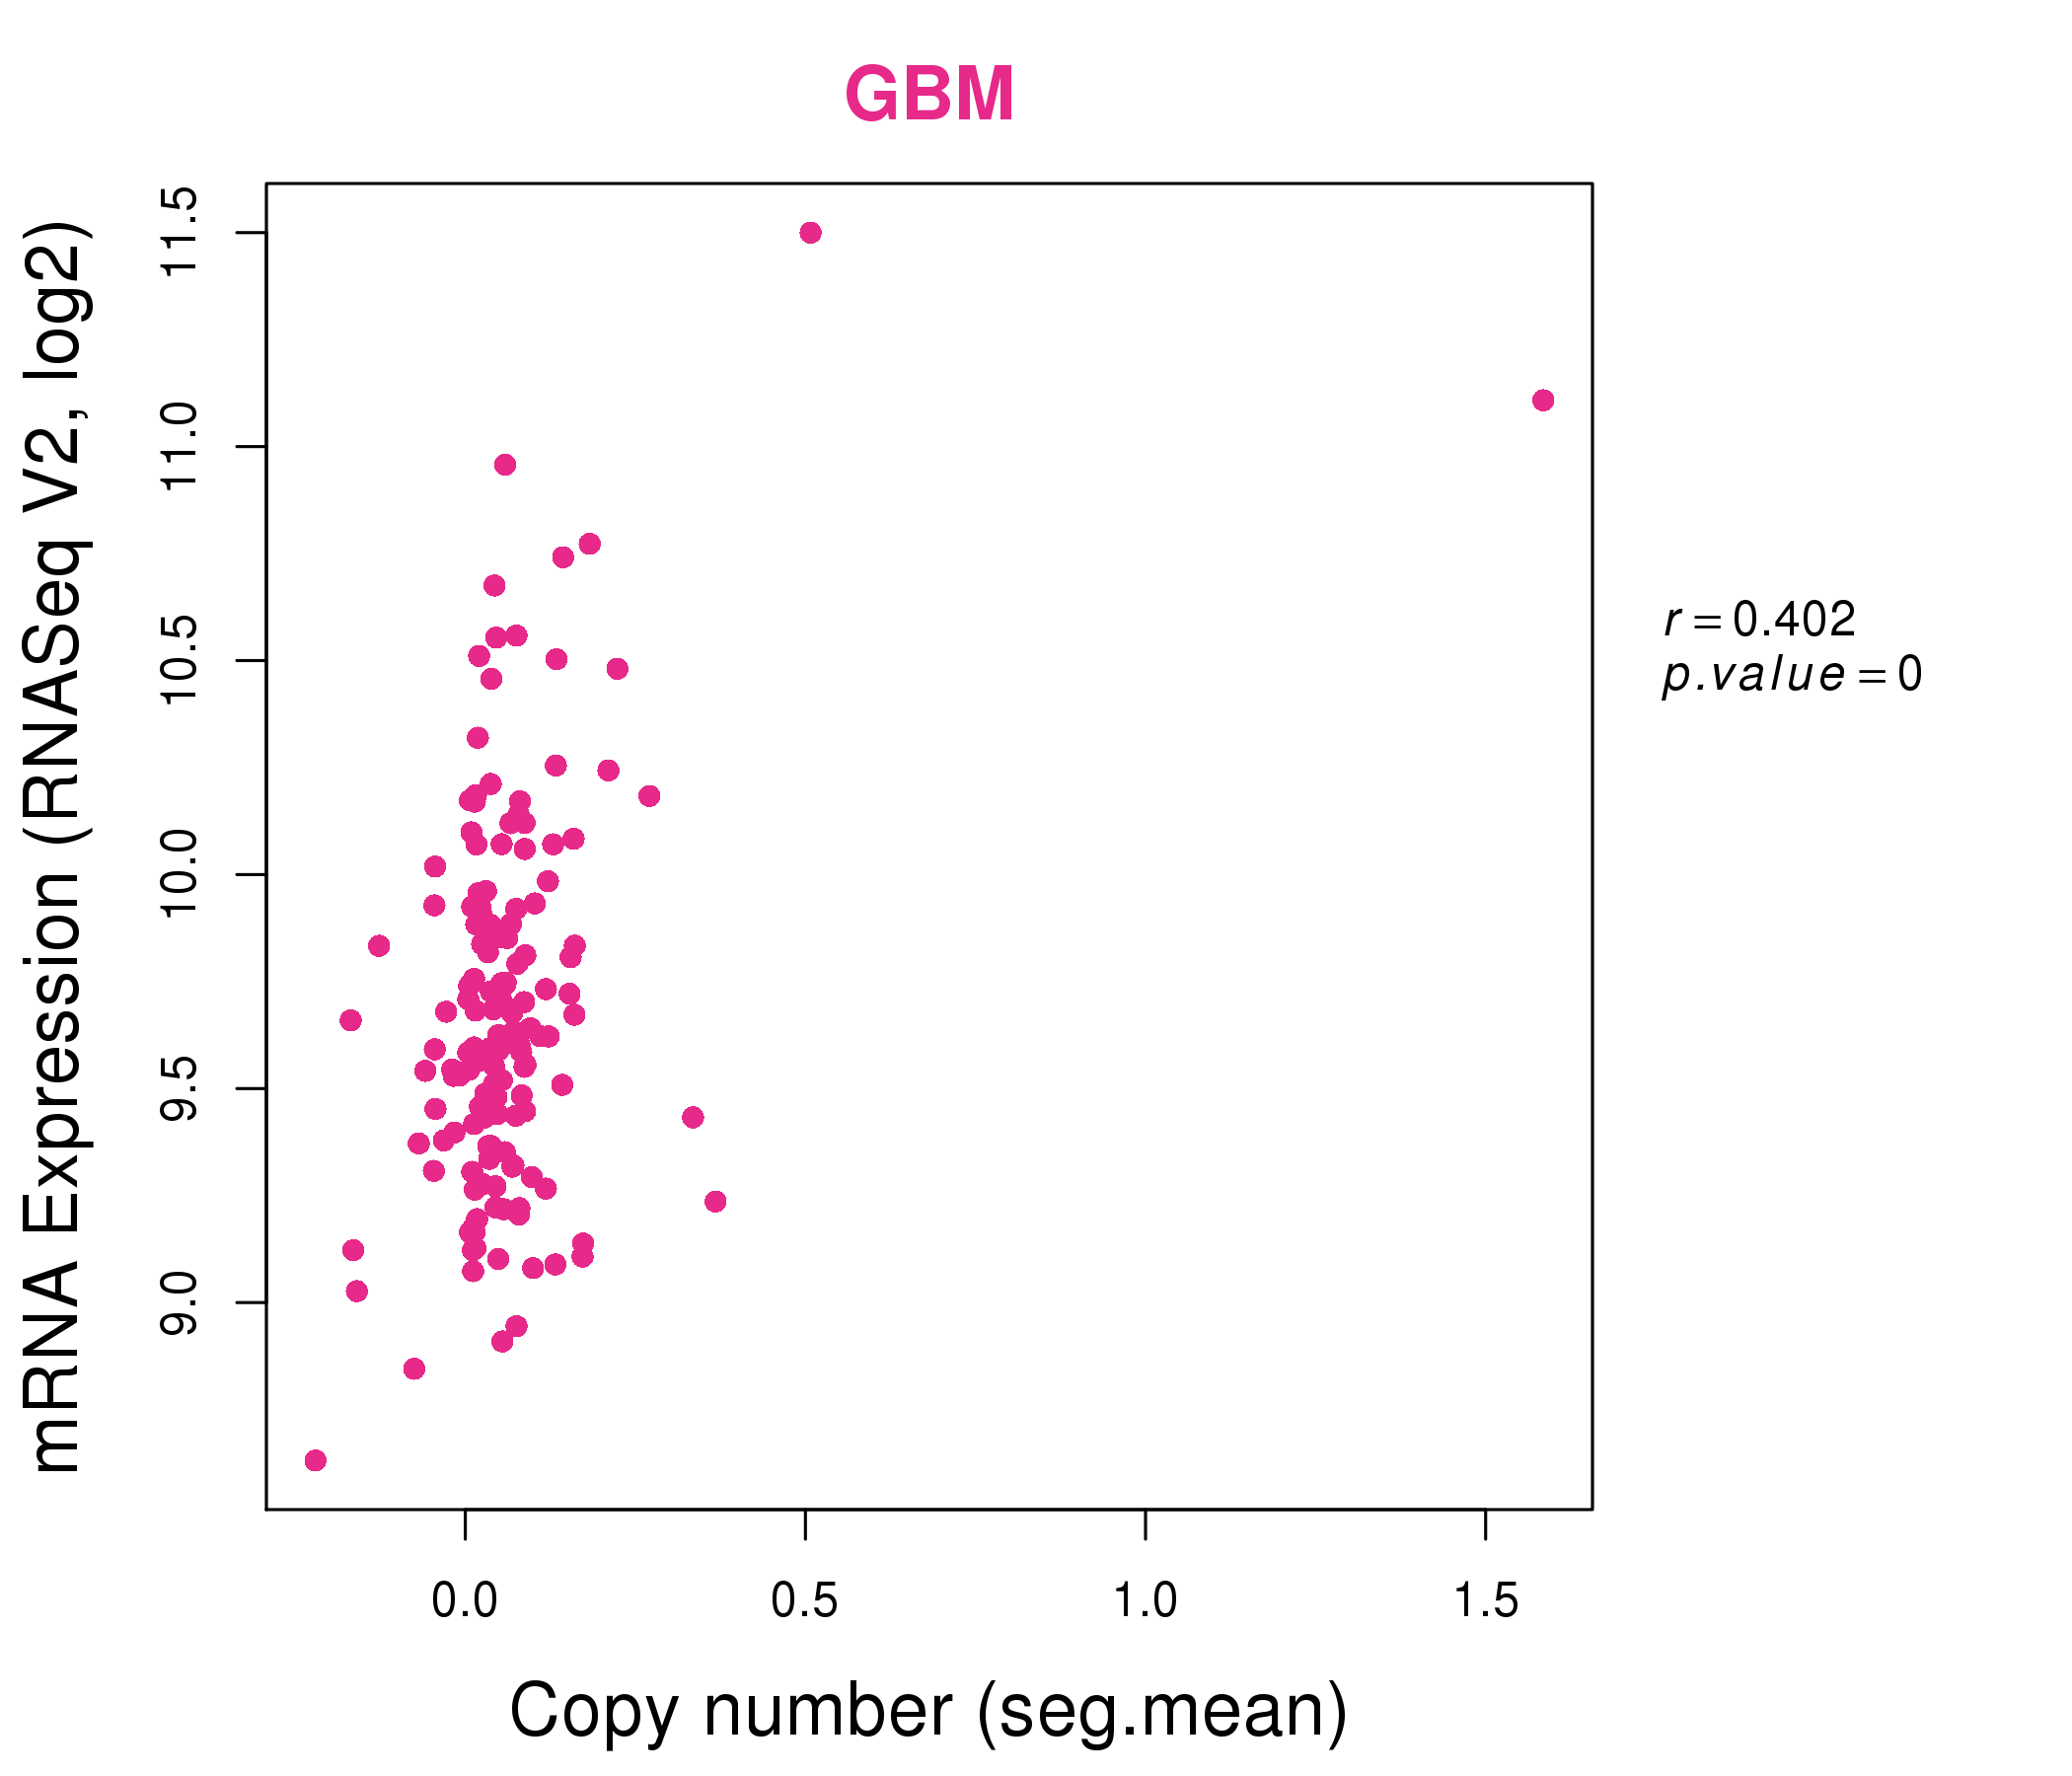
| * Normalized gene expression data of RNASeqV2 was extracted from TCGA using R package TCGA-Assembler. The URLs of all public data files on TCGA DCC data server were gathered at Jan-05-2015. Only eight cancer types have enough normal control samples for differential expression analysis. (t test, adjusted p<0.05 (using Benjamini-Hochberg FDR)) |
 |
| Top |
| * This plots show the correlation between CNV and gene expression. |
: Open all plots for all cancer types
 |
|
 |
|
| Top |
| Gene-Gene Network Information |
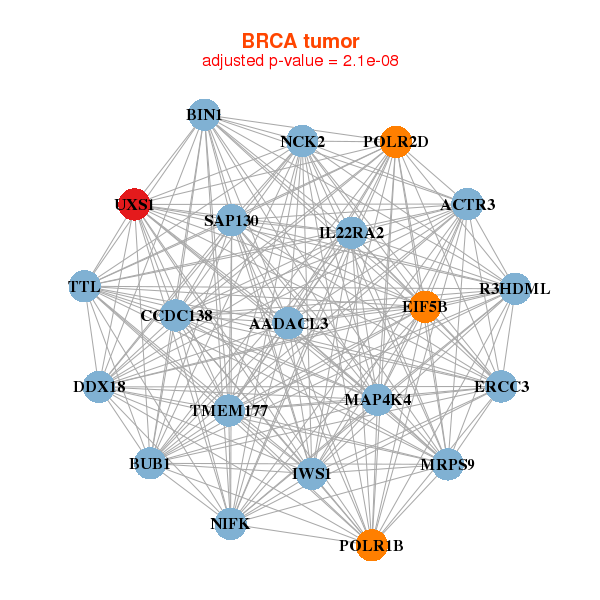
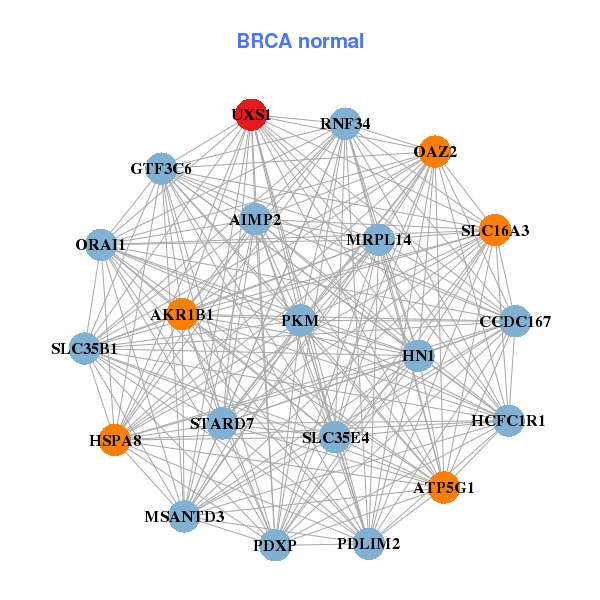
| * Co-Expression network figures were drawn using R package igraph. Only the top 20 genes with the highest correlations were shown. Red circle: input gene, orange circle: cell metabolism gene, sky circle: other gene |
: Open all plots for all cancer types
 |
|
| AADACL3,ACTR3,BIN1,BUB1,CCDC138,DDX18,EIF5B, ERCC3,IL22RA2,IWS1,MAP4K4,NIFK,MRPS9,NCK2, POLR1B,POLR2D,R3HDML,SAP130,TMEM177,TTL,UXS1 | AIMP2,AKR1B1,ATP5G1,CCDC167,MSANTD3,GTF3C6,HCFC1R1, HN1,HSPA8,MRPL14,OAZ2,ORAI1,PDLIM2,PDXP, PKM,RNF34,SLC16A3,SLC35B1,SLC35E4,STARD7,UXS1 |
 |
|
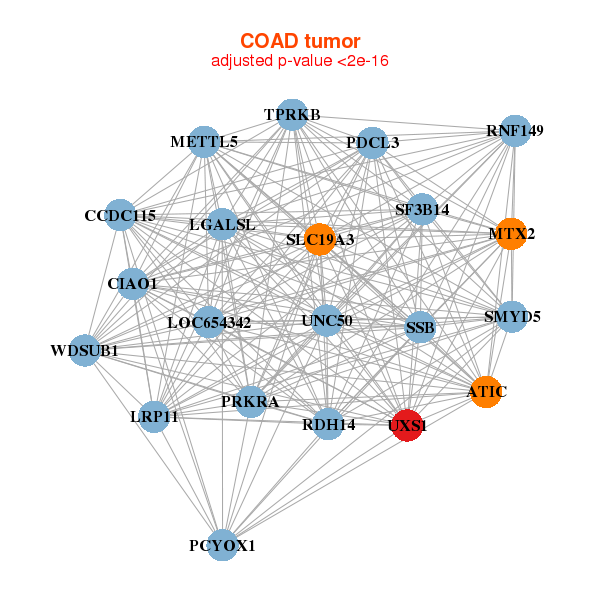
| ATIC,CCDC115,CIAO1,LGALSL,LOC654342,LRP11,METTL5, MTX2,PCYOX1,PDCL3,PRKRA,RDH14,RNF149,SF3B14, SLC19A3,SMYD5,SSB,TPRKB,UNC50,UXS1,WDSUB1 | ERICH5,CLDN8,CPA6,FAM3D,HEPACAM2,IFT57,IGSF22, IL1R2,LOC284578,MFSD4,PRAC1,RNF2,SAMD13,SLC35A1, SLPI,SPAG16,STARD10,TMEM38A,UXS1,VSIG2,ZG16 |
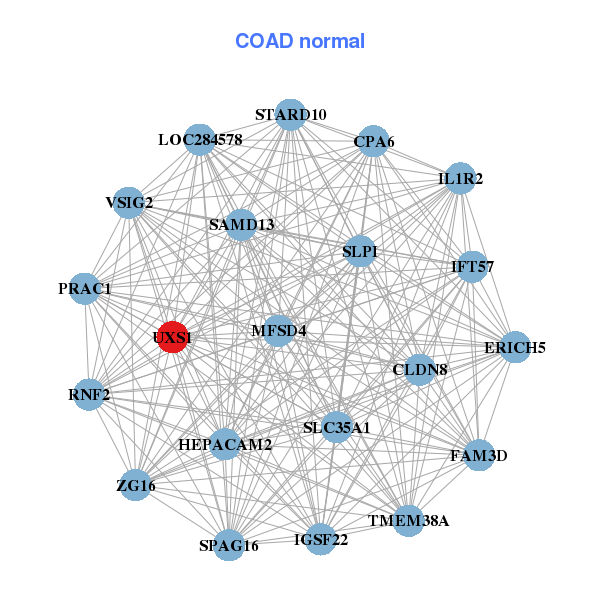
| * Co-Expression network figures were drawn using R package igraph. Only the top 20 genes with the highest correlations were shown. Red circle: input gene, orange circle: cell metabolism gene, sky circle: other gene |
: Open all plots for all cancer types
| Top |
: Open all interacting genes' information including KEGG pathway for all interacting genes from DAVID
| Top |
| Pharmacological Information for UXS1 |
| There's no related Drug. |
| Top |
| Cross referenced IDs for UXS1 |
| * We obtained these cross-references from Uniprot database. It covers 150 different DBs, 18 categories. http://www.uniprot.org/help/cross_references_section |
: Open all cross reference information
|
Copyright © 2016-Present - The Univsersity of Texas Health Science Center at Houston @ |