|
||||||||||||||||||||
| |
| Phenotypic Information (metabolism pathway, cancer, disease, phenome) |
| |
| |
| Gene-Gene Network Information: Co-Expression Network, Interacting Genes & KEGG |
| |
|


| Gene Summary for EDC3 |
| Basic gene info. | Gene symbol | EDC3 |
| Gene name | enhancer of mRNA decapping 3 | |
| Synonyms | LSM16|YJDC|YJEFN2 | |
| Cytomap | UCSC genome browser: 15q24.1 | |
| Genomic location | chr15 :74922898-74988386 | |
| Type of gene | protein-coding | |
| RefGenes | NM_001142443.1, NM_001142444.1,NM_025083.3, | |
| Ensembl id | ENSG00000179151 | |
| Description | LSM16 homolog (EDC3, S. cerevisiae)enhancer of mRNA decapping 3 homologenhancer of mRNA-decapping protein 3hYjeF_N2hYjeF_N2-15q23yjeF N-terminal domain-containing protein 2yjeF domain containingyjeF domain-containing protein 1yjeF_N2 | |
| Modification date | 20141207 | |
| dbXrefs | MIM : 609842 | |
| HGNC : HGNC | ||
| Ensembl : ENSG00000179151 | ||
| HPRD : 07954 | ||
| Vega : OTTHUMG00000142815 | ||
| Protein | UniProt: go to UniProt's Cross Reference DB Table | |
| Expression | CleanEX: HS_EDC3 | |
| BioGPS: 80153 | ||
| Gene Expression Atlas: ENSG00000179151 | ||
| The Human Protein Atlas: ENSG00000179151 | ||
| Pathway | NCI Pathway Interaction Database: EDC3 | |
| KEGG: EDC3 | ||
| REACTOME: EDC3 | ||
| ConsensusPathDB | ||
| Pathway Commons: EDC3 | ||
| Metabolism | MetaCyc: EDC3 | |
| HUMANCyc: EDC3 | ||
| Regulation | Ensembl's Regulation: ENSG00000179151 | |
| miRBase: chr15 :74,922,898-74,988,386 | ||
| TargetScan: NM_001142443 | ||
| cisRED: ENSG00000179151 | ||
| Context | iHOP: EDC3 | |
| cancer metabolism search in PubMed: EDC3 | ||
| UCL Cancer Institute: EDC3 | ||
| Assigned class in ccmGDB | C | |
| Top |
| Phenotypic Information for EDC3(metabolism pathway, cancer, disease, phenome) |
| Cancer | CGAP: EDC3 |
| Familial Cancer Database: EDC3 | |
| * This gene is included in those cancer gene databases. |
|
|
|
|
|
| . | ||||||||||||||
Oncogene 1 | Significant driver gene in | |||||||||||||||||||
| cf) number; DB name 1 Oncogene; http://nar.oxfordjournals.org/content/35/suppl_1/D721.long, 2 Tumor Suppressor gene; https://bioinfo.uth.edu/TSGene/, 3 Cancer Gene Census; http://www.nature.com/nrc/journal/v4/n3/abs/nrc1299.html, 4 CancerGenes; http://nar.oxfordjournals.org/content/35/suppl_1/D721.long, 5 Network of Cancer Gene; http://ncg.kcl.ac.uk/index.php, 1Therapeutic Vulnerabilities in Cancer; http://cbio.mskcc.org/cancergenomics/statius/ |
| REACTOME_METABOLISM_OF_MRNA REACTOME_METABOLISM_OF_RNA | |
| OMIM | |
| Orphanet | |
| Disease | KEGG Disease: EDC3 |
| MedGen: EDC3 (Human Medical Genetics with Condition) | |
| ClinVar: EDC3 | |
| Phenotype | MGI: EDC3 (International Mouse Phenotyping Consortium) |
| PhenomicDB: EDC3 | |
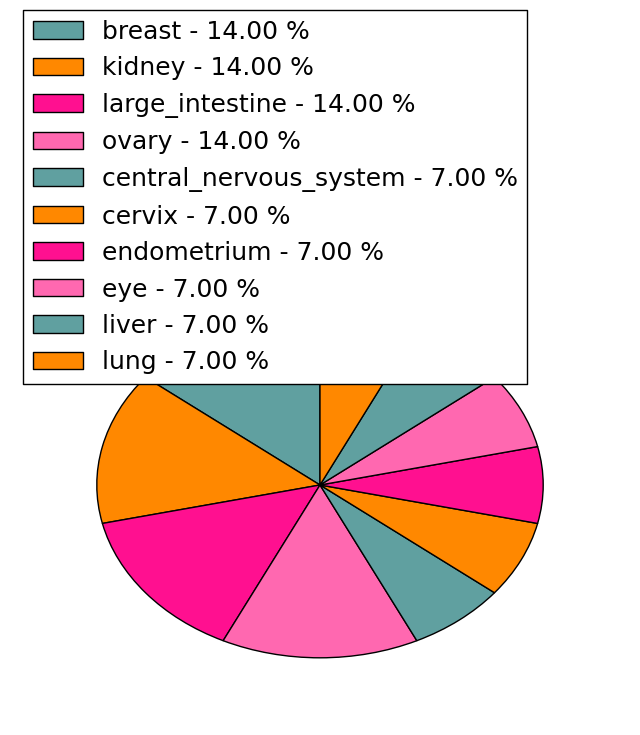
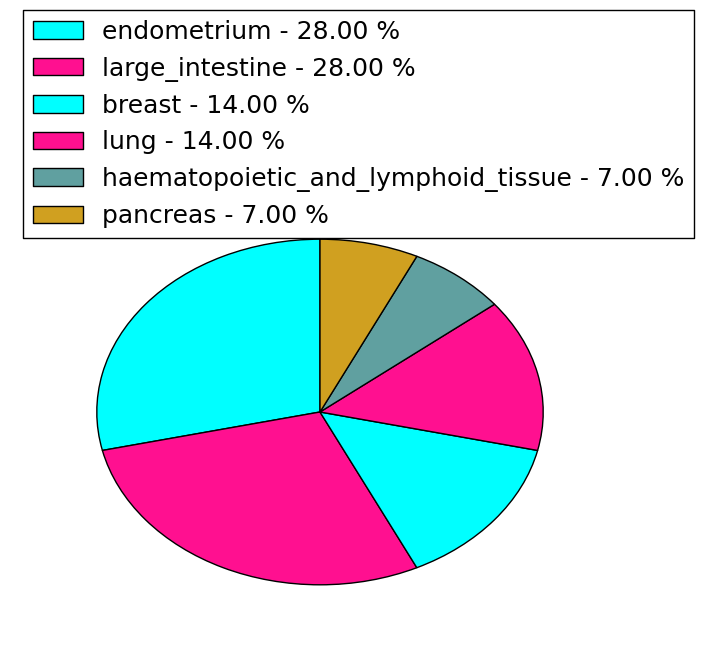
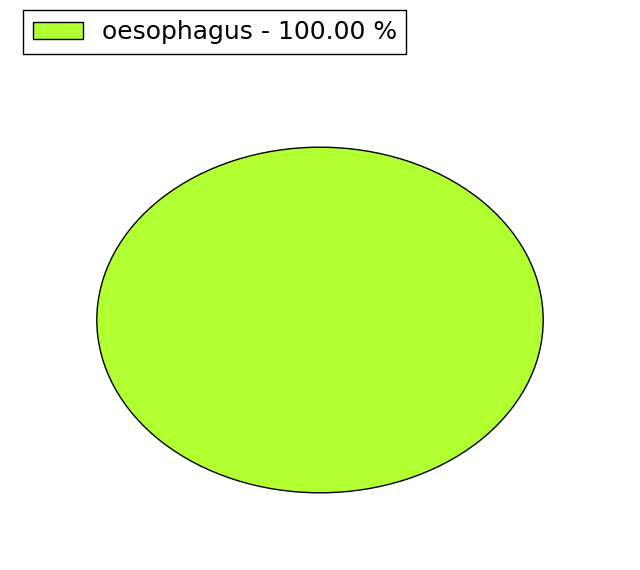
| Mutations for EDC3 |
| * Under tables are showing count per each tissue to give us broad intuition about tissue specific mutation patterns.You can go to the detailed page for each mutation database's web site. |
| - Statistics for Tissue and Mutation type | Top |
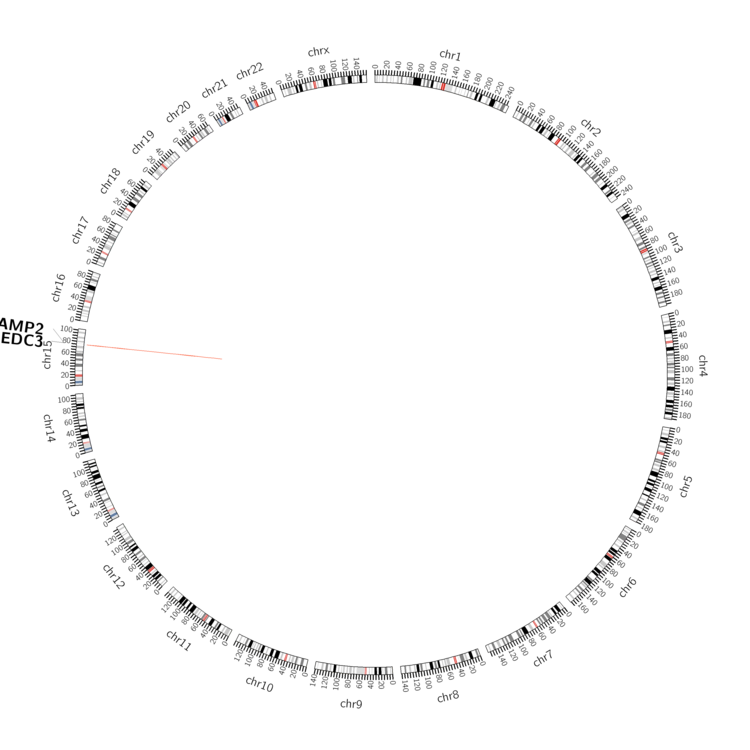 |
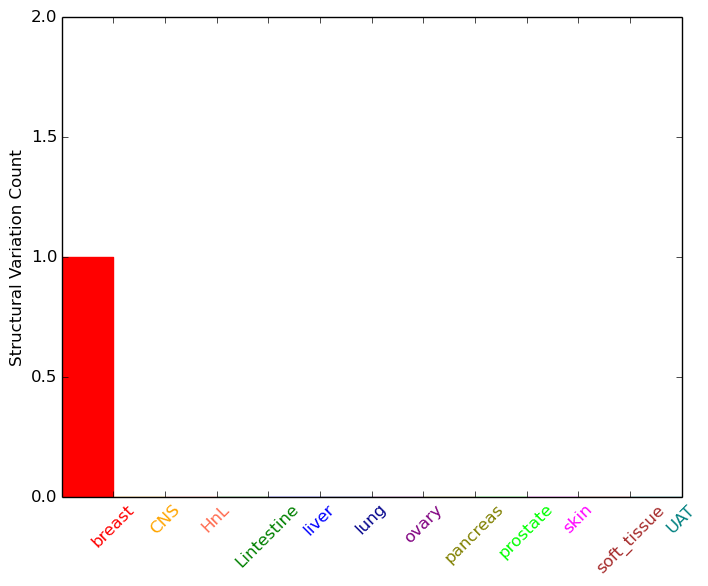
| - For Inter-chromosomal Variations |
| There's no inter-chromosomal structural variation. |
| - For Intra-chromosomal Variations |
| * Intra-chromosomal variantions includes 'intrachromosomal amplicon to amplicon', 'intrachromosomal amplicon to non-amplified dna', 'intrachromosomal deletion', 'intrachromosomal fold-back inversion', 'intrachromosomal inversion', 'intrachromosomal tandem duplication', 'Intrachromosomal unknown type', 'intrachromosomal with inverted orientation', 'intrachromosomal with non-inverted orientation'. |
 |
| Sample | Symbol_a | Chr_a | Start_a | End_a | Symbol_b | Chr_b | Start_b | End_b |
| breast | EDC3 | chr15 | 74982147 | 74982147 | SCAMP2 | chr15 | 75139164 | 75139164 |
| cf) Tissue number; Tissue name (1;Breast, 2;Central_nervous_system, 3;Haematopoietic_and_lymphoid_tissue, 4;Large_intestine, 5;Liver, 6;Lung, 7;Ovary, 8;Pancreas, 9;Prostate, 10;Skin, 11;Soft_tissue, 12;Upper_aerodigestive_tract) |
| * From mRNA Sanger sequences, Chitars2.0 arranged chimeric transcripts. This table shows EDC3 related fusion information. |
| ID | Head Gene | Tail Gene | Accession | Gene_a | qStart_a | qEnd_a | Chromosome_a | tStart_a | tEnd_a | Gene_a | qStart_a | qEnd_a | Chromosome_a | tStart_a | tEnd_a |
| BE095213 | EDC3 | 14 | 303 | 15 | 74925314 | 74925601 | EDC3 | 294 | 352 | 15 | 74925607 | 74925665 | |
| Top |
| There's no copy number variation information in COSMIC data for this gene. |
| Top |
|
 |
| Top |
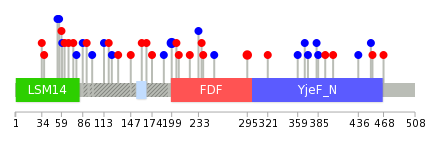
| Stat. for Non-Synonymous SNVs (# total SNVs=14) | (# total SNVs=14) |
 |  |
(# total SNVs=1) | (# total SNVs=0) |
 |
| Top |
| * When you move the cursor on each content, you can see more deailed mutation information on the Tooltip. Those are primary_site,primary_histology,mutation(aa),pubmedID. |
| GRCh37 position | Mutation(aa) | Unique sampleID count |
| chr15:74964117-74964117 | p.? | 5 |
| chr15:74948297-74948297 | p.I199I | 3 |
| chr15:74932898-74932898 | p.E295K | 2 |
| chr15:74948152-74948152 | p.E248* | 2 |
| chr15:74925078-74925078 | p.G468W | 1 |
| chr15:74963941-74963941 | p.A113A | 1 |
| chr15:74927838-74927838 | p.L368L | 1 |
| chr15:74964112-74964112 | p.A56A | 1 |
| chr15:74948281-74948281 | p.D205H | 1 |
| chr15:74925119-74925119 | p.D454G | 1 |
| Top |
|
 |
| Point Mutation/ Tissue ID | 1 | 2 | 3 | 4 | 5 | 6 | 7 | 8 | 9 | 10 | 11 | 12 | 13 | 14 | 15 | 16 | 17 | 18 | 19 | 20 |
| # sample | 3 | 2 | 2 | 4 | 1 | 1 | 2 | 2 | 1 | 5 | 2 | 5 | ||||||||
| # mutation | 3 | 2 | 2 | 4 | 1 | 1 | 2 | 2 | 1 | 5 | 2 | 5 | ||||||||
| nonsynonymous SNV | 2 | 1 | 2 | 1 | 2 | 1 | 4 | 1 | 1 | |||||||||||
| synonymous SNV | 1 | 1 | 4 | 1 | 1 | 1 | 1 | 1 | 4 |
| cf) Tissue ID; Tissue type (1; BLCA[Bladder Urothelial Carcinoma], 2; BRCA[Breast invasive carcinoma], 3; CESC[Cervical squamous cell carcinoma and endocervical adenocarcinoma], 4; COAD[Colon adenocarcinoma], 5; GBM[Glioblastoma multiforme], 6; Glioma Low Grade, 7; HNSC[Head and Neck squamous cell carcinoma], 8; KICH[Kidney Chromophobe], 9; KIRC[Kidney renal clear cell carcinoma], 10; KIRP[Kidney renal papillary cell carcinoma], 11; LAML[Acute Myeloid Leukemia], 12; LUAD[Lung adenocarcinoma], 13; LUSC[Lung squamous cell carcinoma], 14; OV[Ovarian serous cystadenocarcinoma ], 15; PAAD[Pancreatic adenocarcinoma], 16; PRAD[Prostate adenocarcinoma], 17; SKCM[Skin Cutaneous Melanoma], 18:STAD[Stomach adenocarcinoma], 19:THCA[Thyroid carcinoma], 20:UCEC[Uterine Corpus Endometrial Carcinoma]) |
| Top |
| * We represented just top 10 SNVs. When you move the cursor on each content, you can see more deailed mutation information on the Tooltip. Those are primary_site, primary_histology, mutation(aa), pubmedID. |
| Genomic Position | Mutation(aa) | Unique sampleID count |
| chr15:74925078 | p.I199I,EDC3 | 1 |
| chr15:74948184 | p.G468W,EDC3 | 1 |
| chr15:74963915 | p.P174L,EDC3 | 1 |
| chr15:74925119 | p.D454G,EDC3 | 1 |
| chr15:74948195 | p.R167K,EDC3 | 1 |
| chr15:74963937 | p.R436R,EDC3 | 1 |
| chr15:74925172 | p.S161F,EDC3 | 1 |
| chr15:74948230 | p.V404E,EDC3 | 1 |
| chr15:74963941 | p.E147K,EDC3 | 1 |
| chr15:74925269 | p.S394F,EDC3 | 1 |
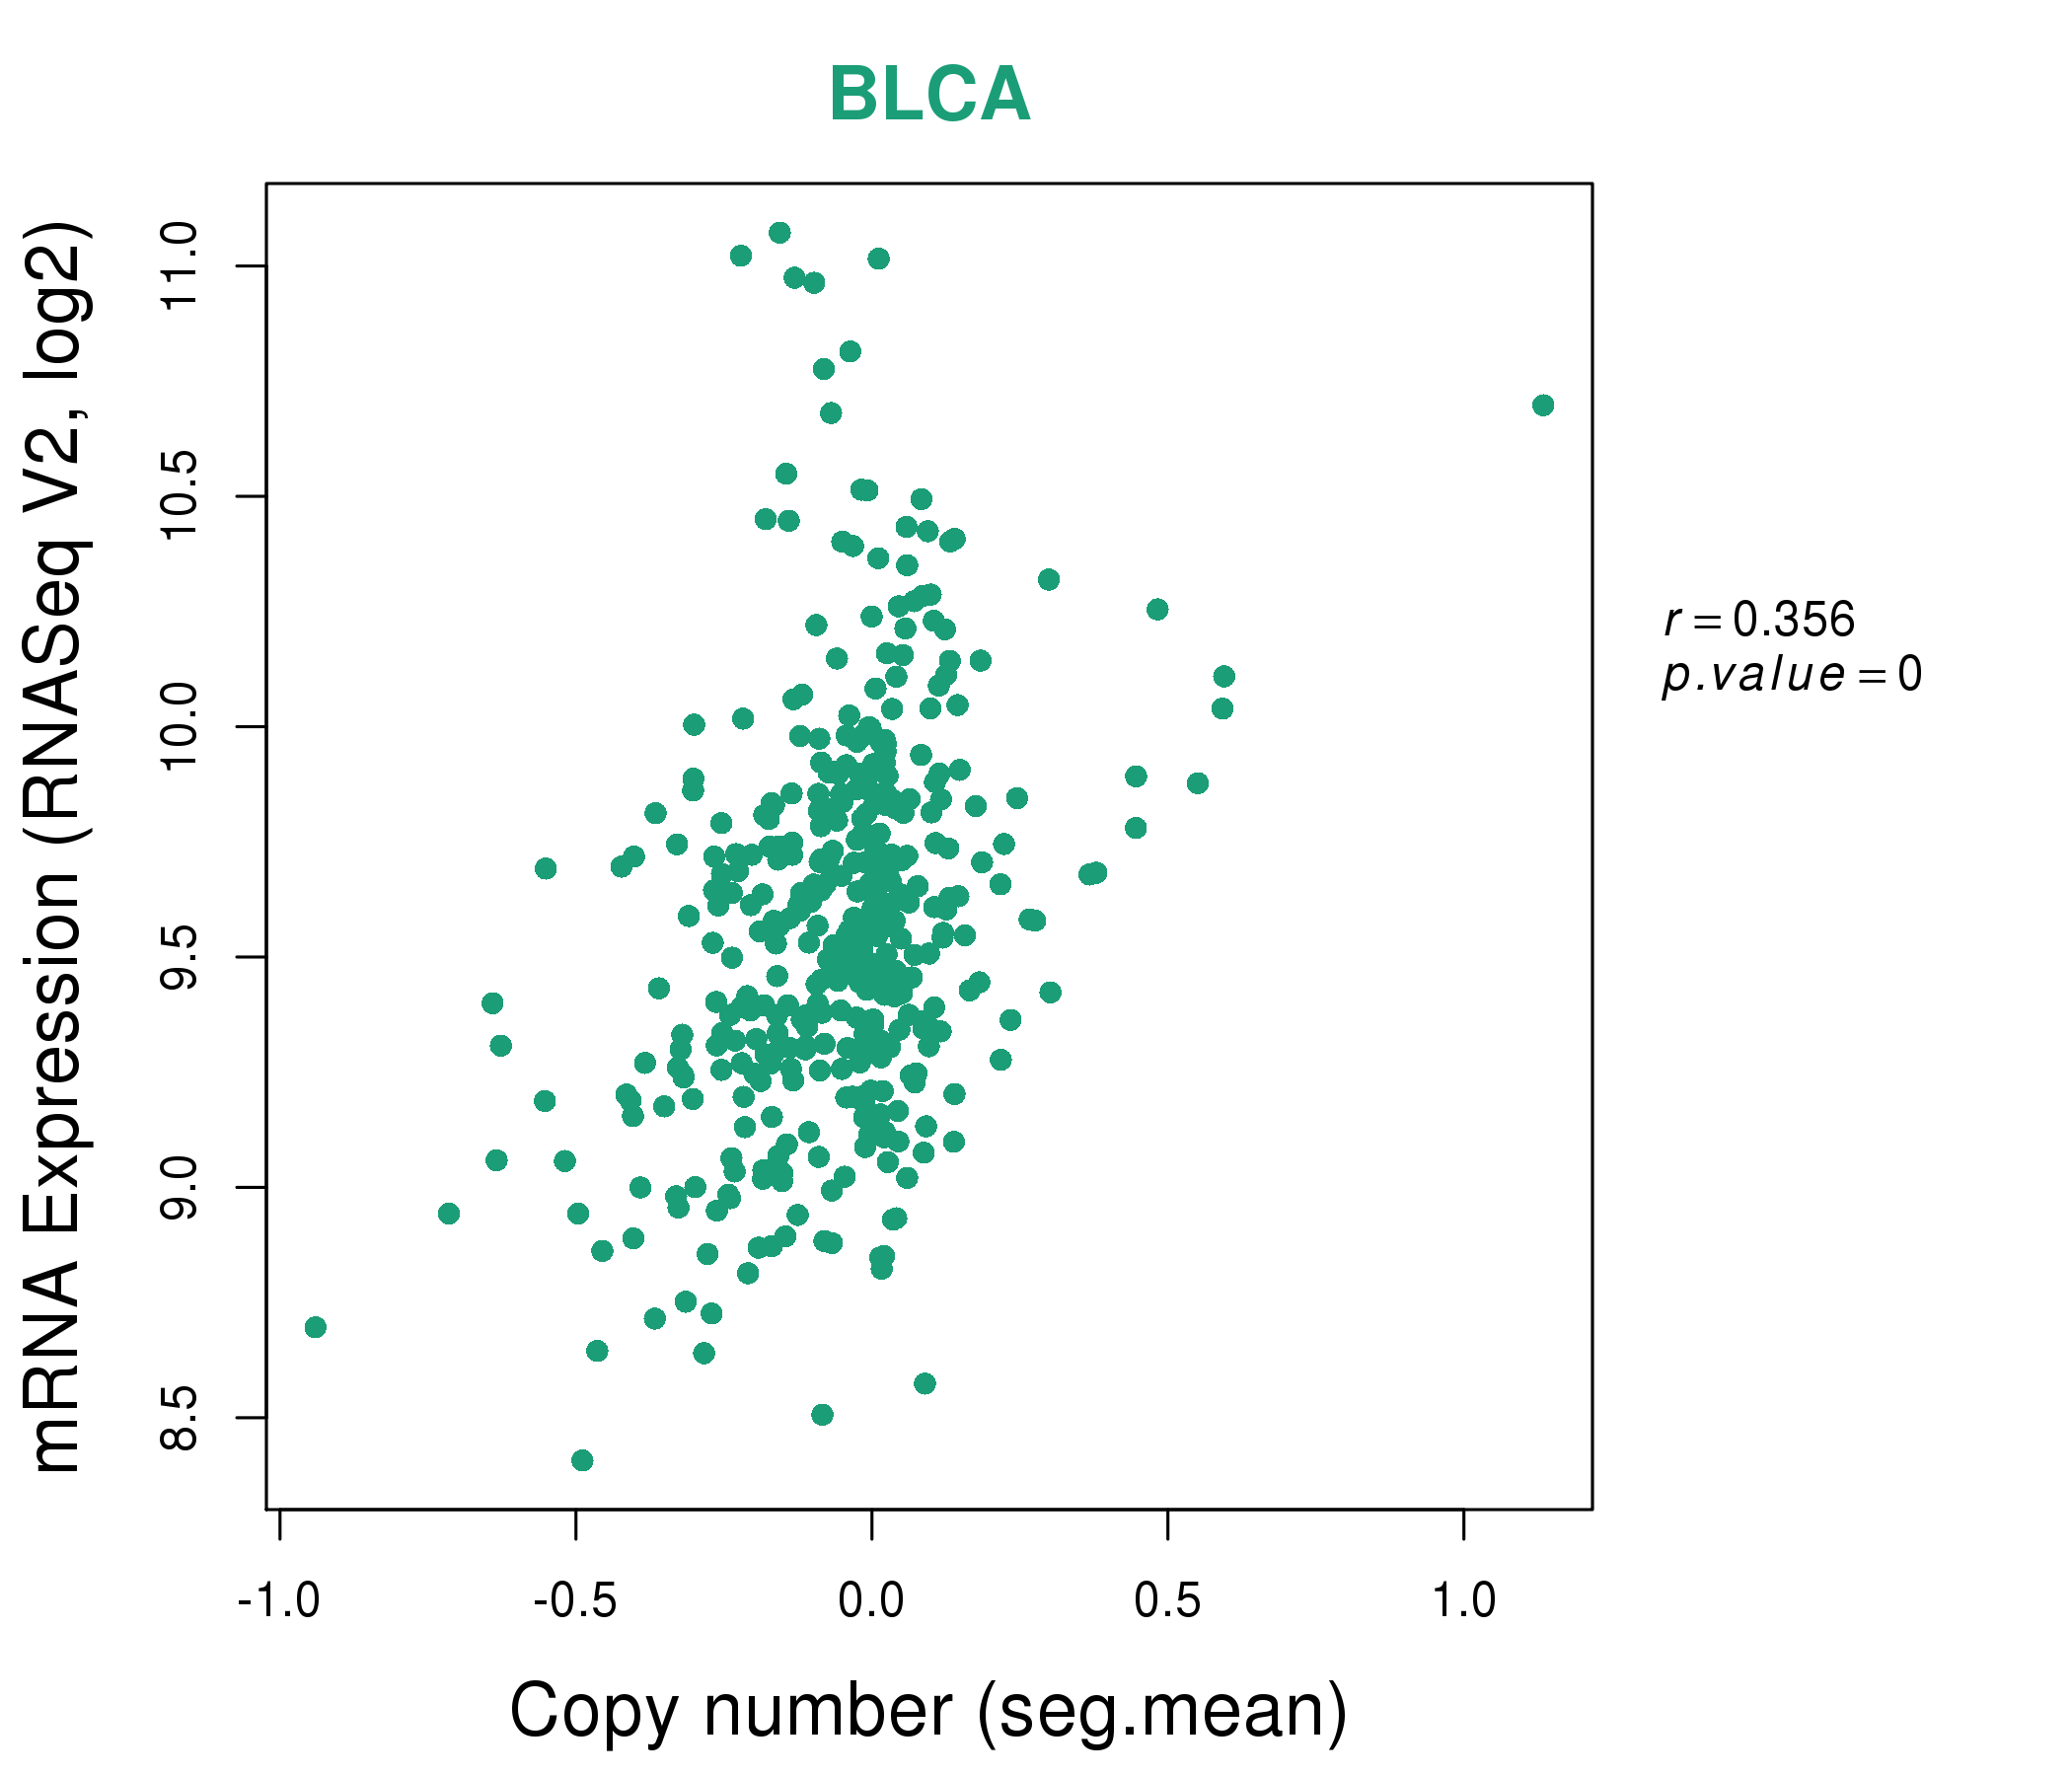
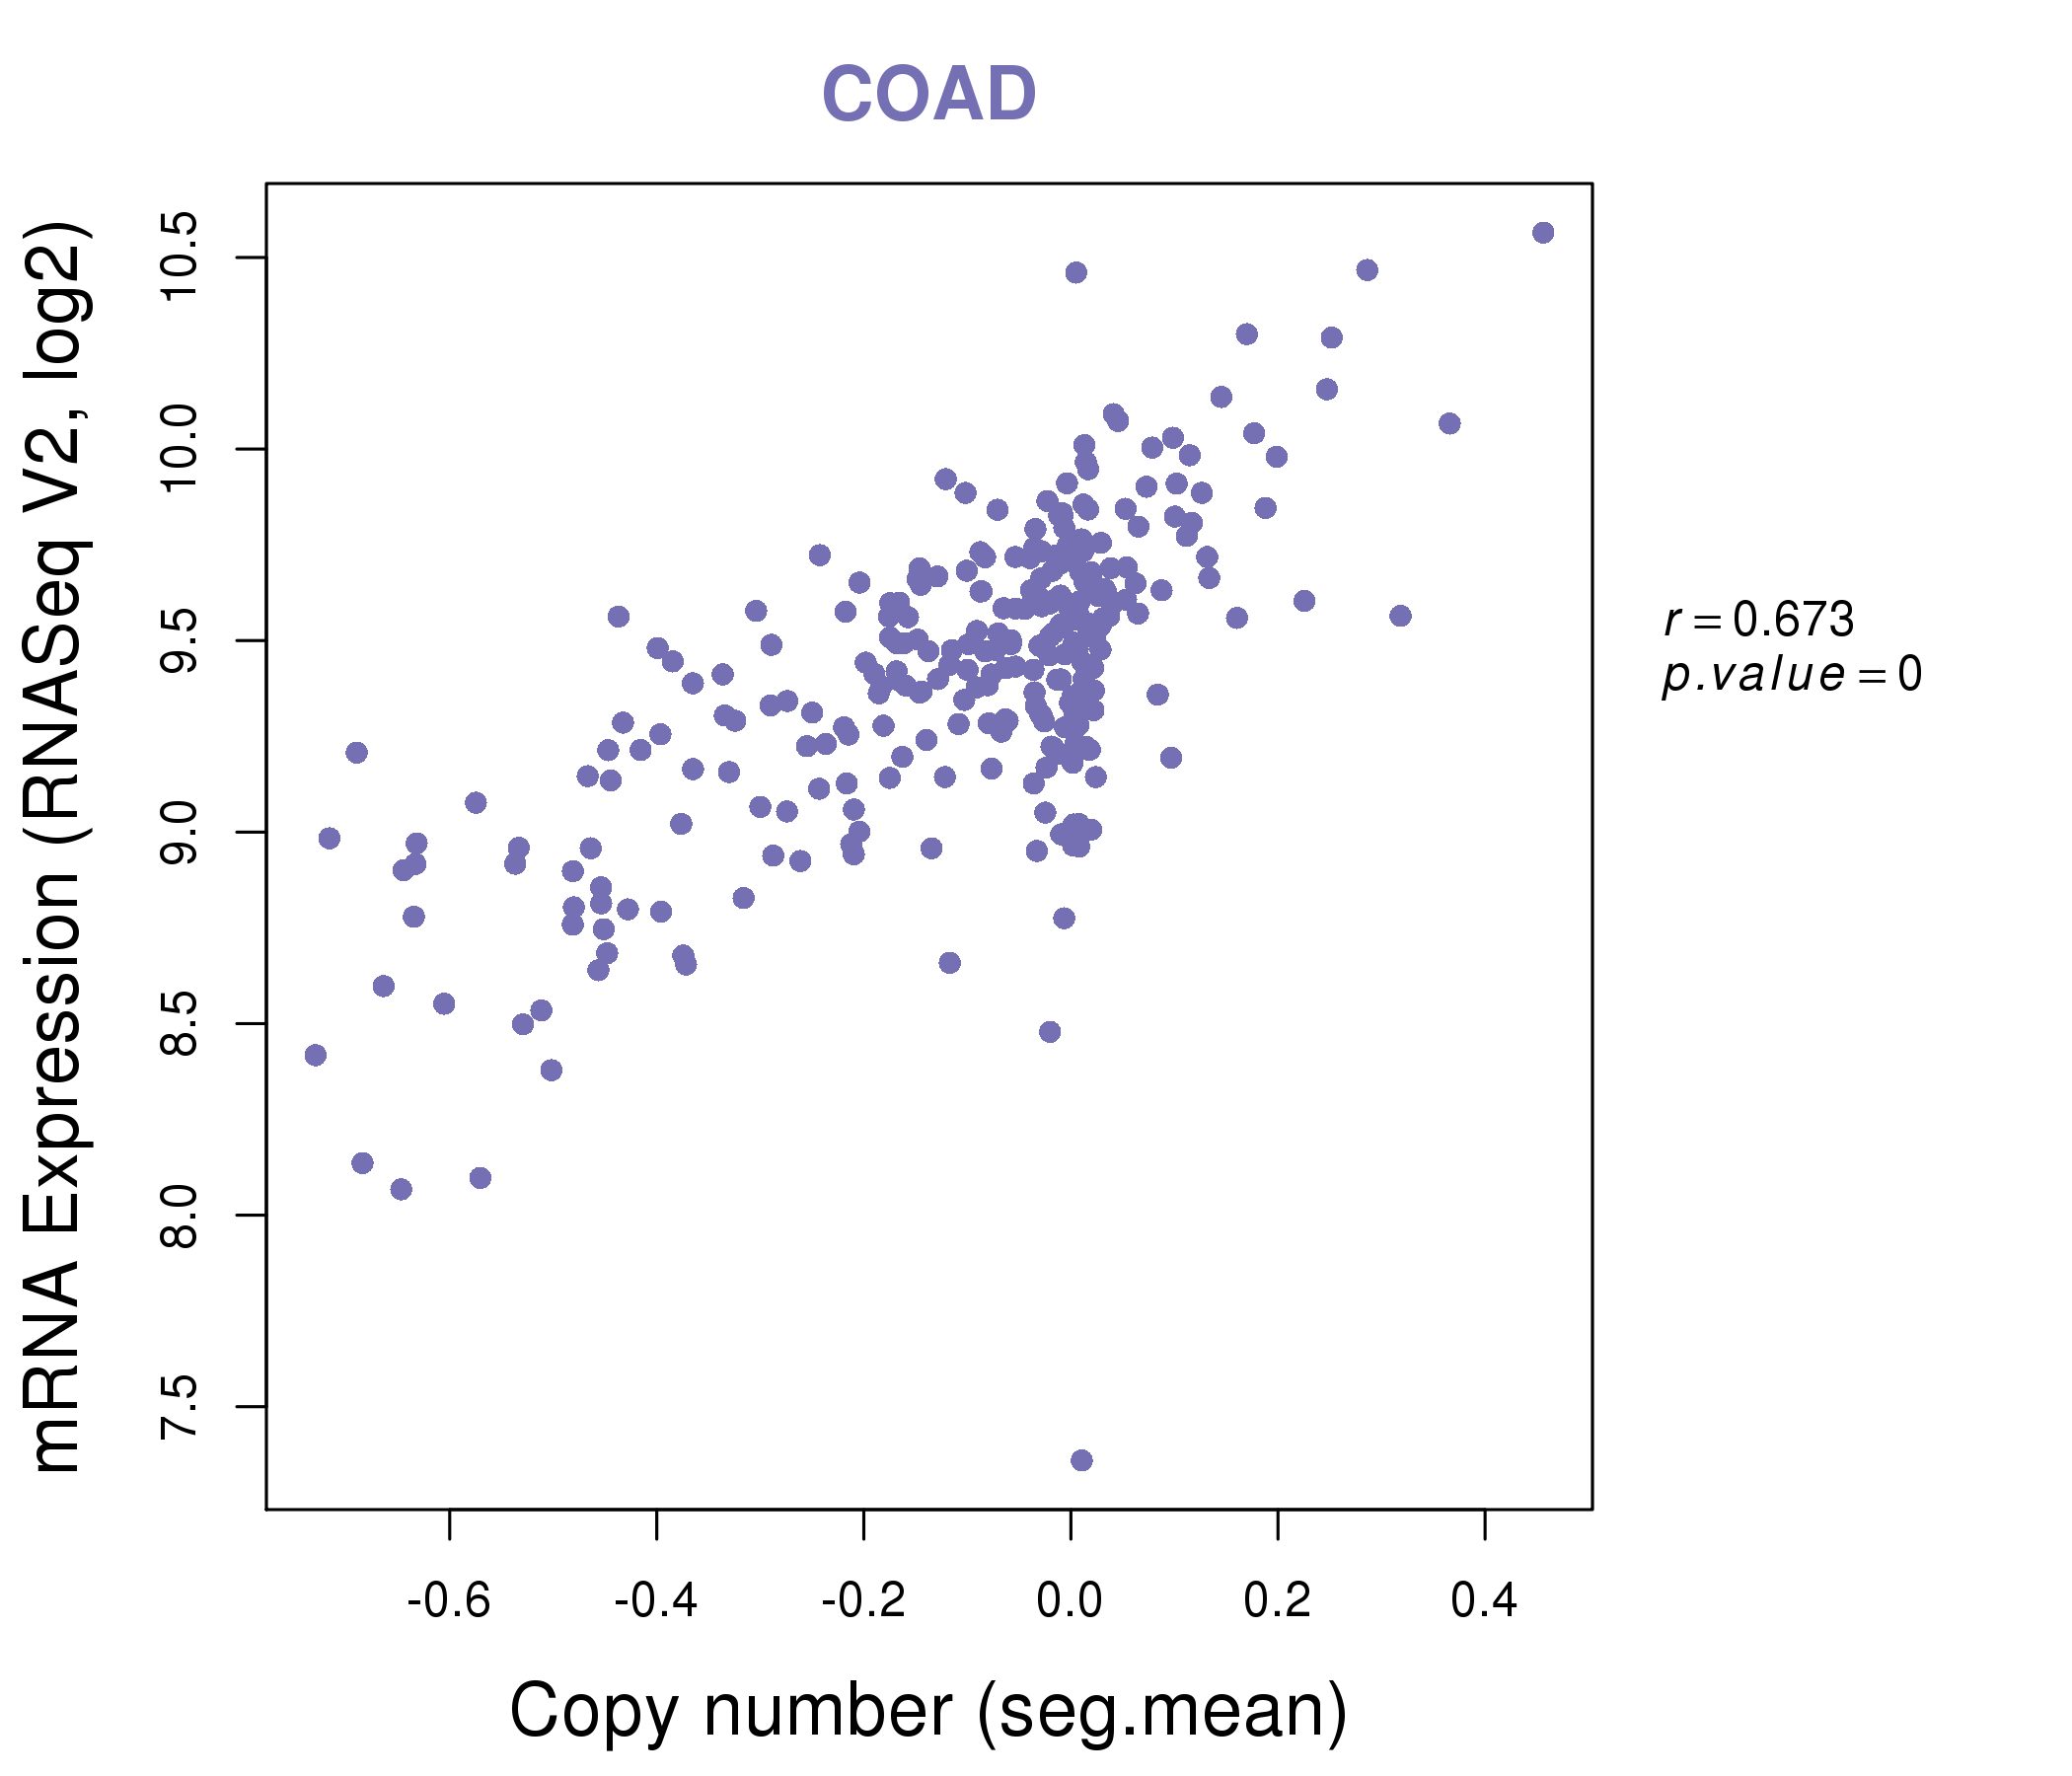
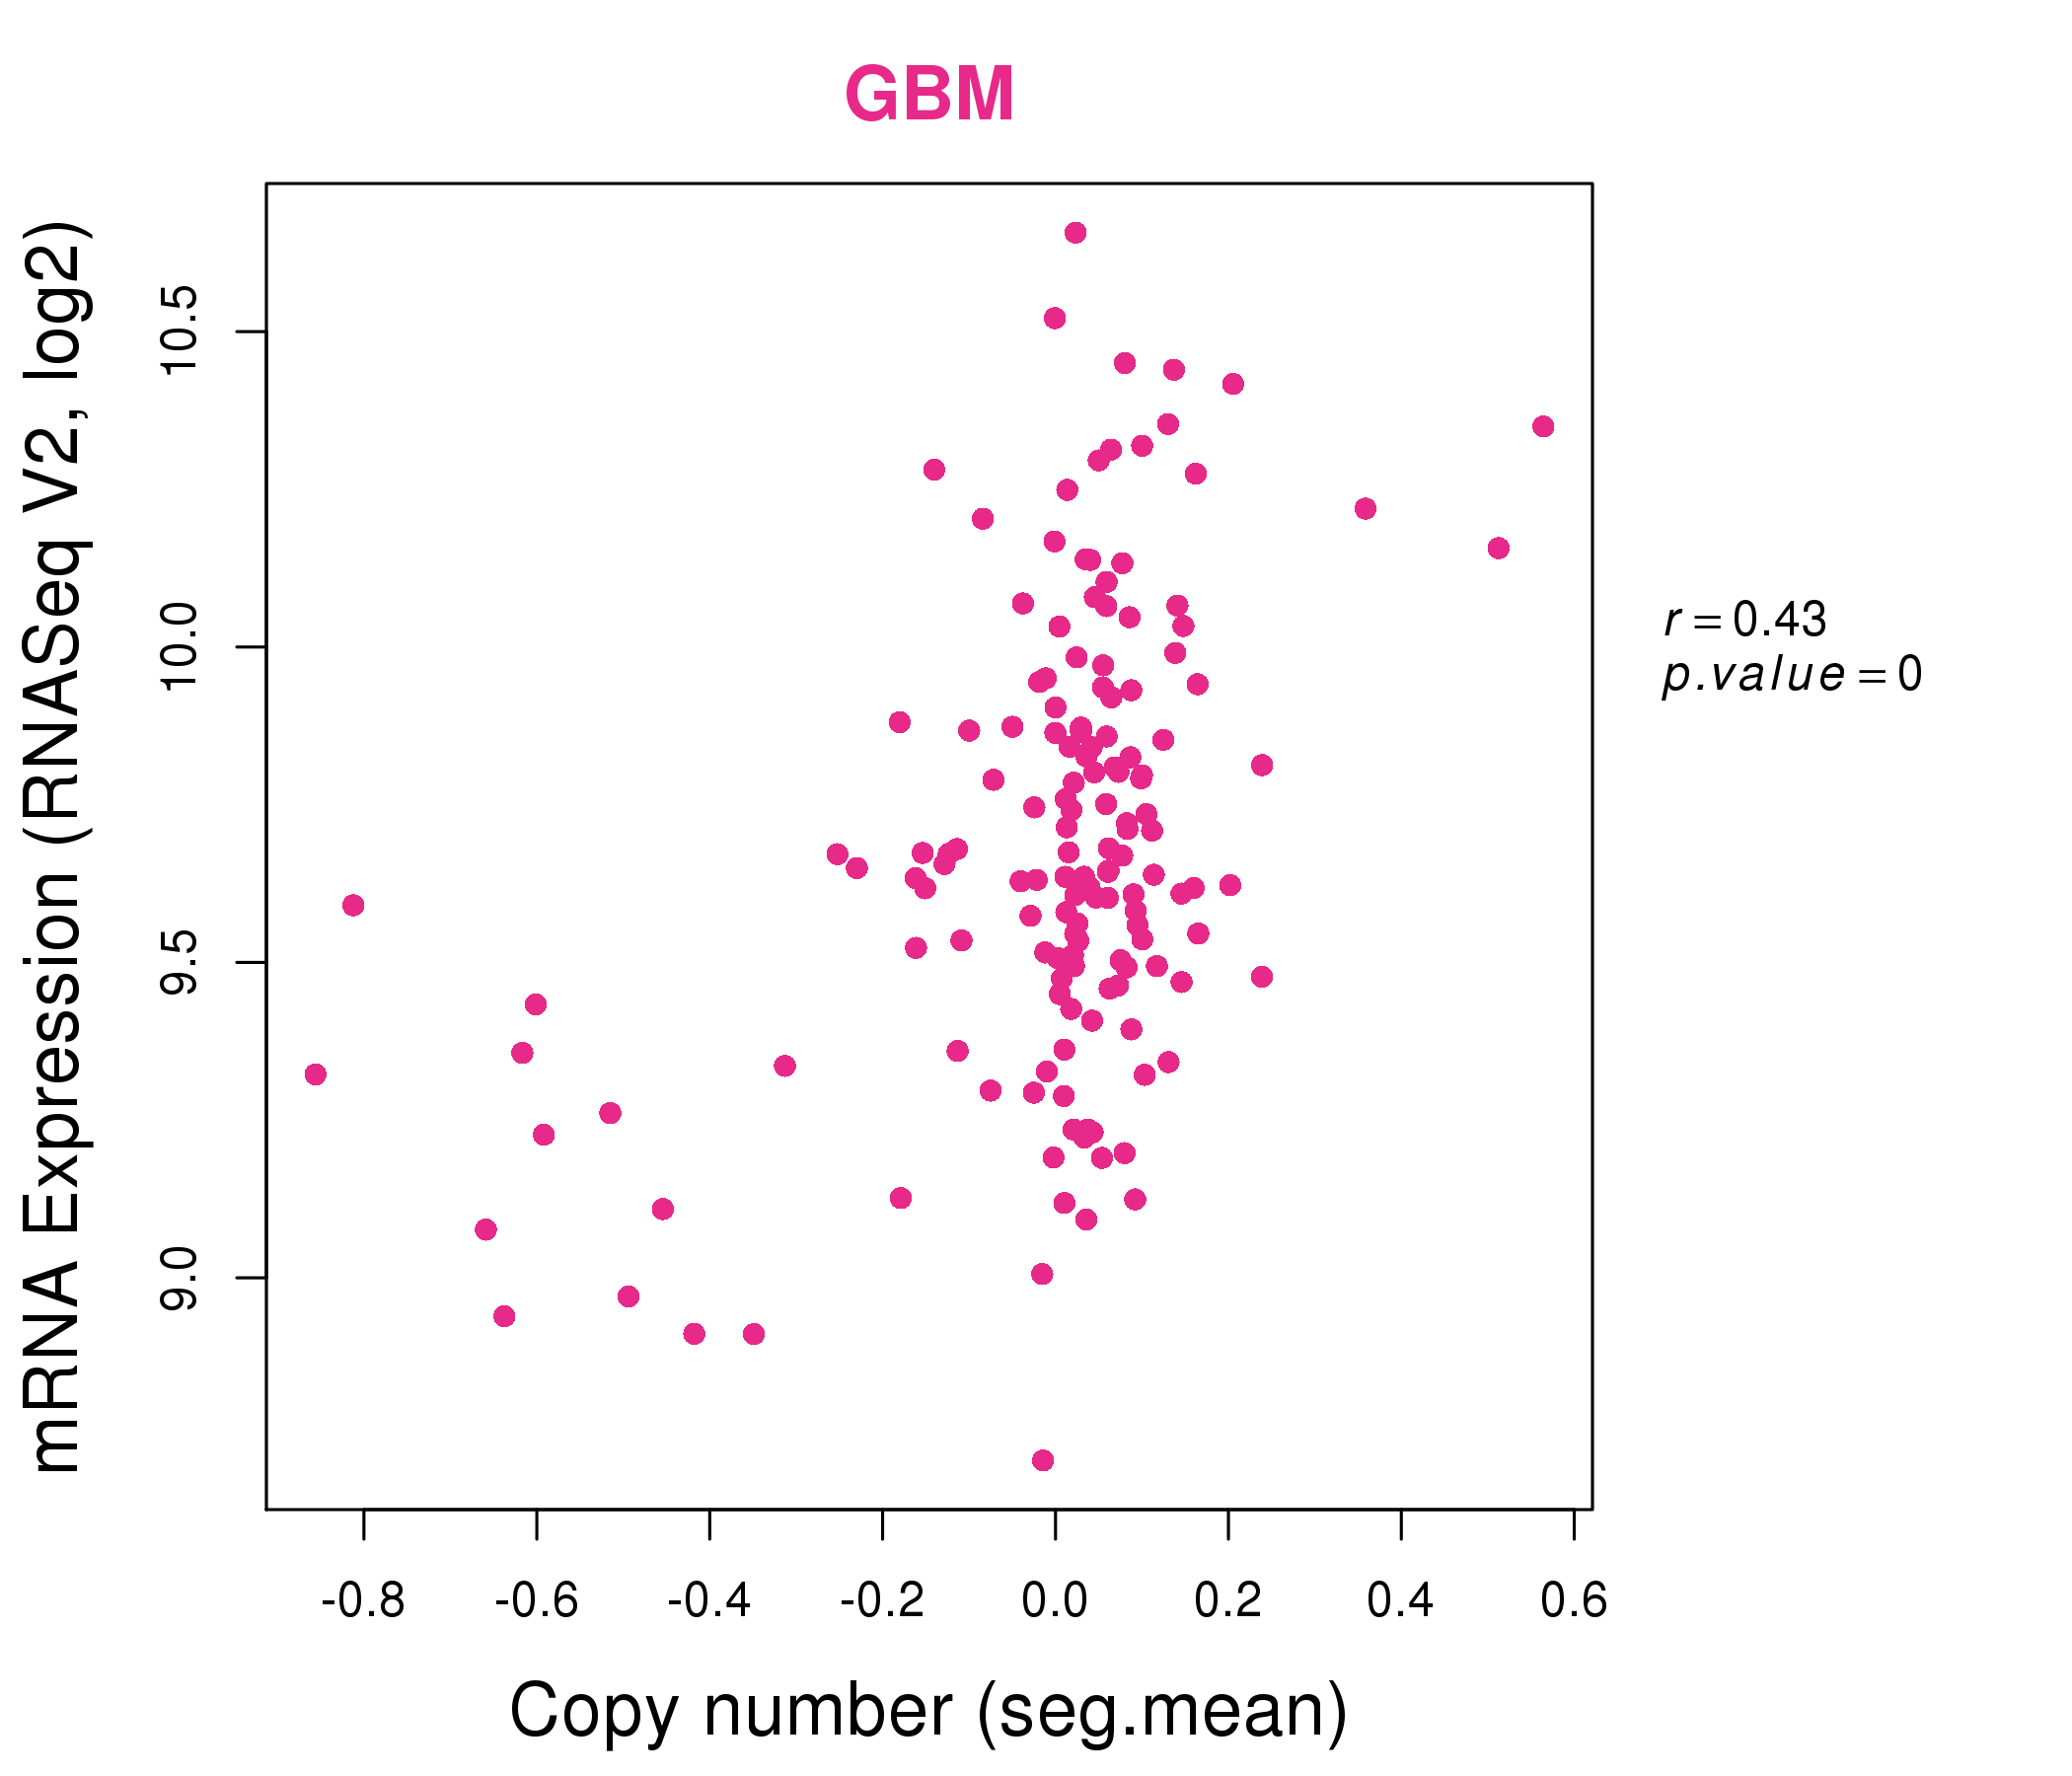
| * Copy number data were extracted from TCGA using R package TCGA-Assembler. The URLs of all public data files on TCGA DCC data server were gathered on Jan-05-2015. Function ProcessCNAData in TCGA-Assembler package was used to obtain gene-level copy number value which is calculated as the average copy number of the genomic region of a gene. |
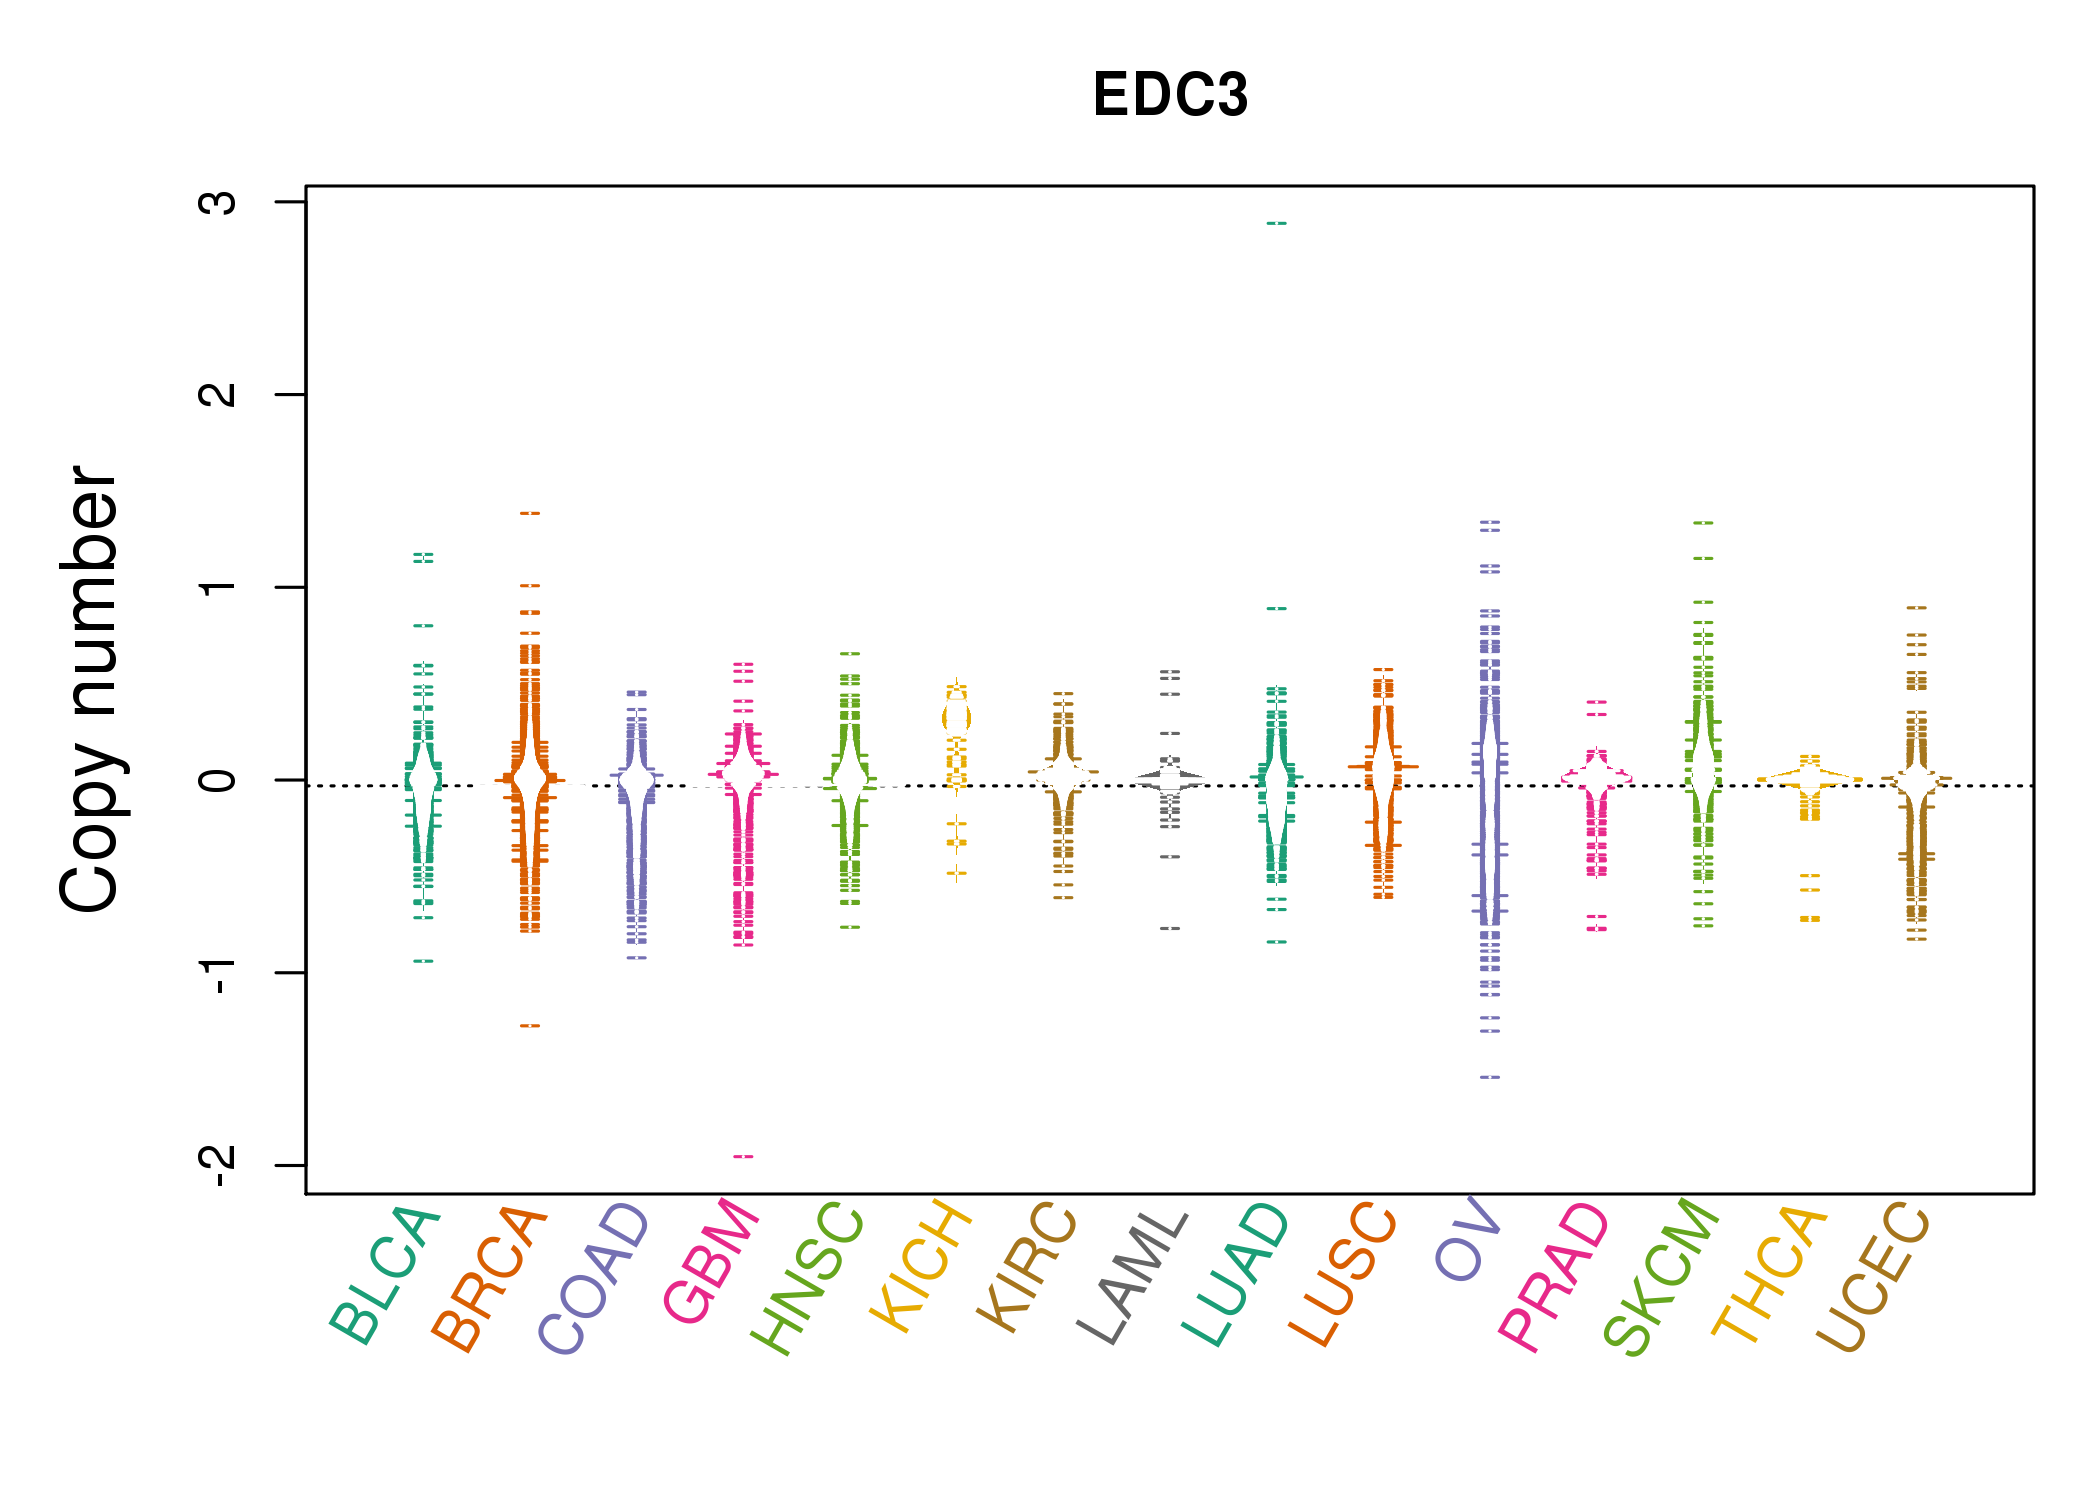 |
| cf) Tissue ID[Tissue type]: BLCA[Bladder Urothelial Carcinoma], BRCA[Breast invasive carcinoma], CESC[Cervical squamous cell carcinoma and endocervical adenocarcinoma], COAD[Colon adenocarcinoma], GBM[Glioblastoma multiforme], Glioma Low Grade, HNSC[Head and Neck squamous cell carcinoma], KICH[Kidney Chromophobe], KIRC[Kidney renal clear cell carcinoma], KIRP[Kidney renal papillary cell carcinoma], LAML[Acute Myeloid Leukemia], LUAD[Lung adenocarcinoma], LUSC[Lung squamous cell carcinoma], OV[Ovarian serous cystadenocarcinoma ], PAAD[Pancreatic adenocarcinoma], PRAD[Prostate adenocarcinoma], SKCM[Skin Cutaneous Melanoma], STAD[Stomach adenocarcinoma], THCA[Thyroid carcinoma], UCEC[Uterine Corpus Endometrial Carcinoma] |
| Top |
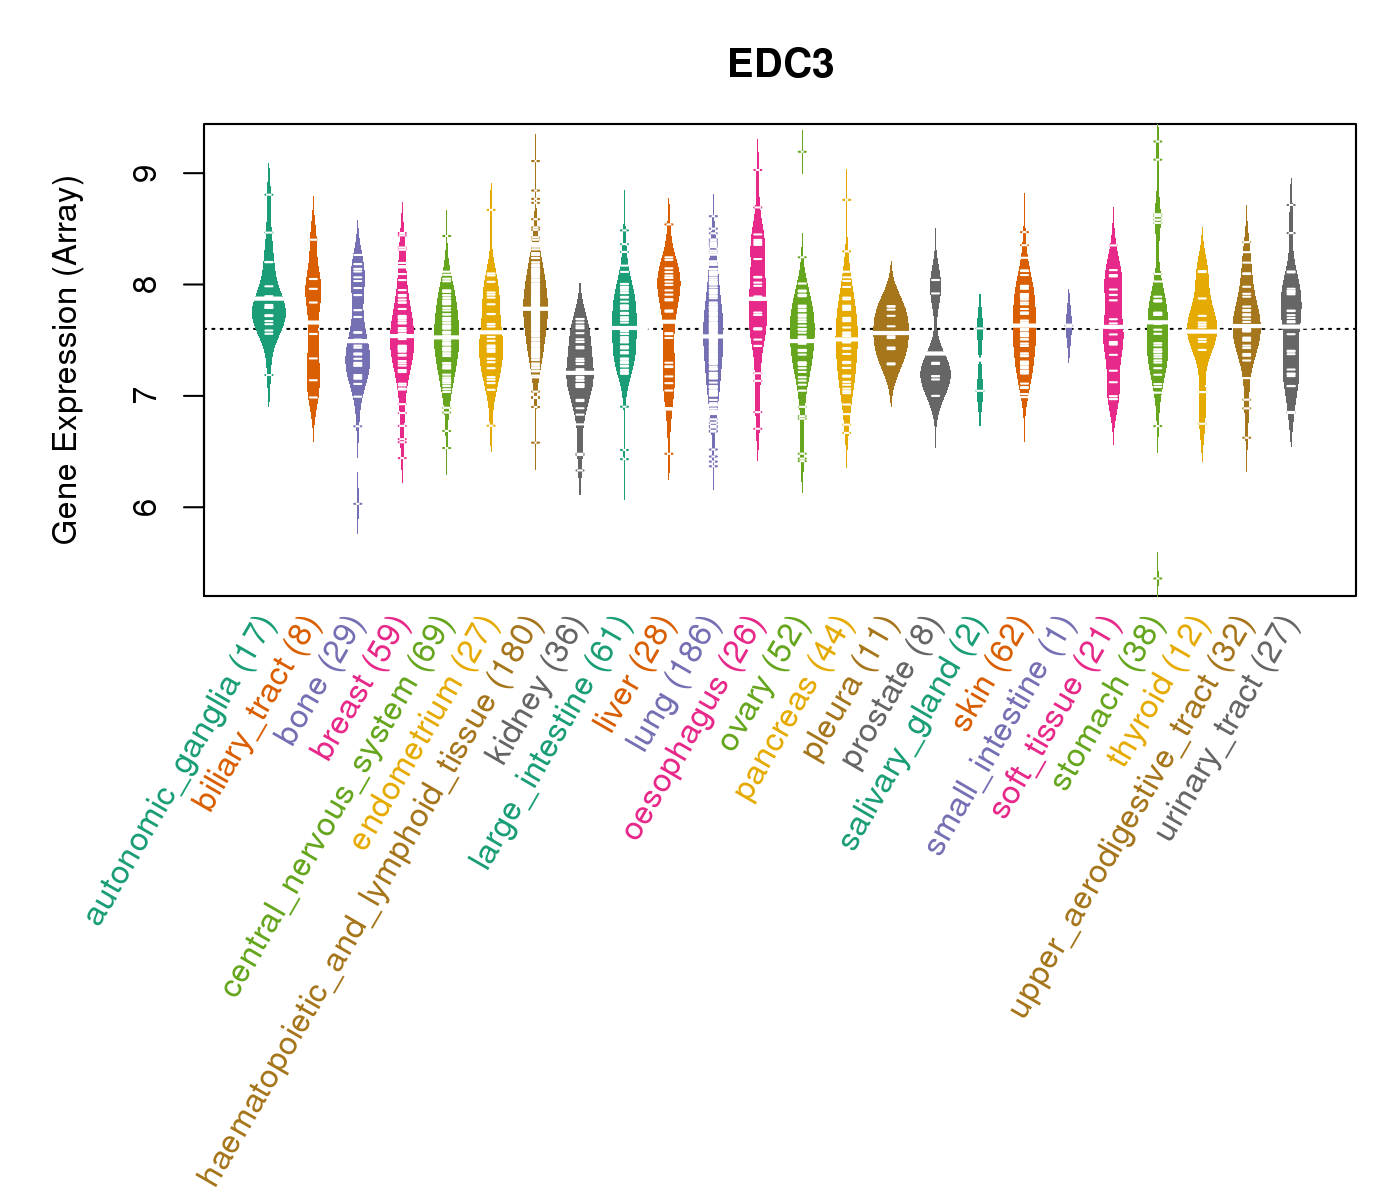
| Gene Expression for EDC3 |
| * CCLE gene expression data were extracted from CCLE_Expression_Entrez_2012-10-18.res: Gene-centric RMA-normalized mRNA expression data. |
 |
| * Normalized gene expression data of RNASeqV2 was extracted from TCGA using R package TCGA-Assembler. The URLs of all public data files on TCGA DCC data server were gathered at Jan-05-2015. Only eight cancer types have enough normal control samples for differential expression analysis. (t test, adjusted p<0.05 (using Benjamini-Hochberg FDR)) |
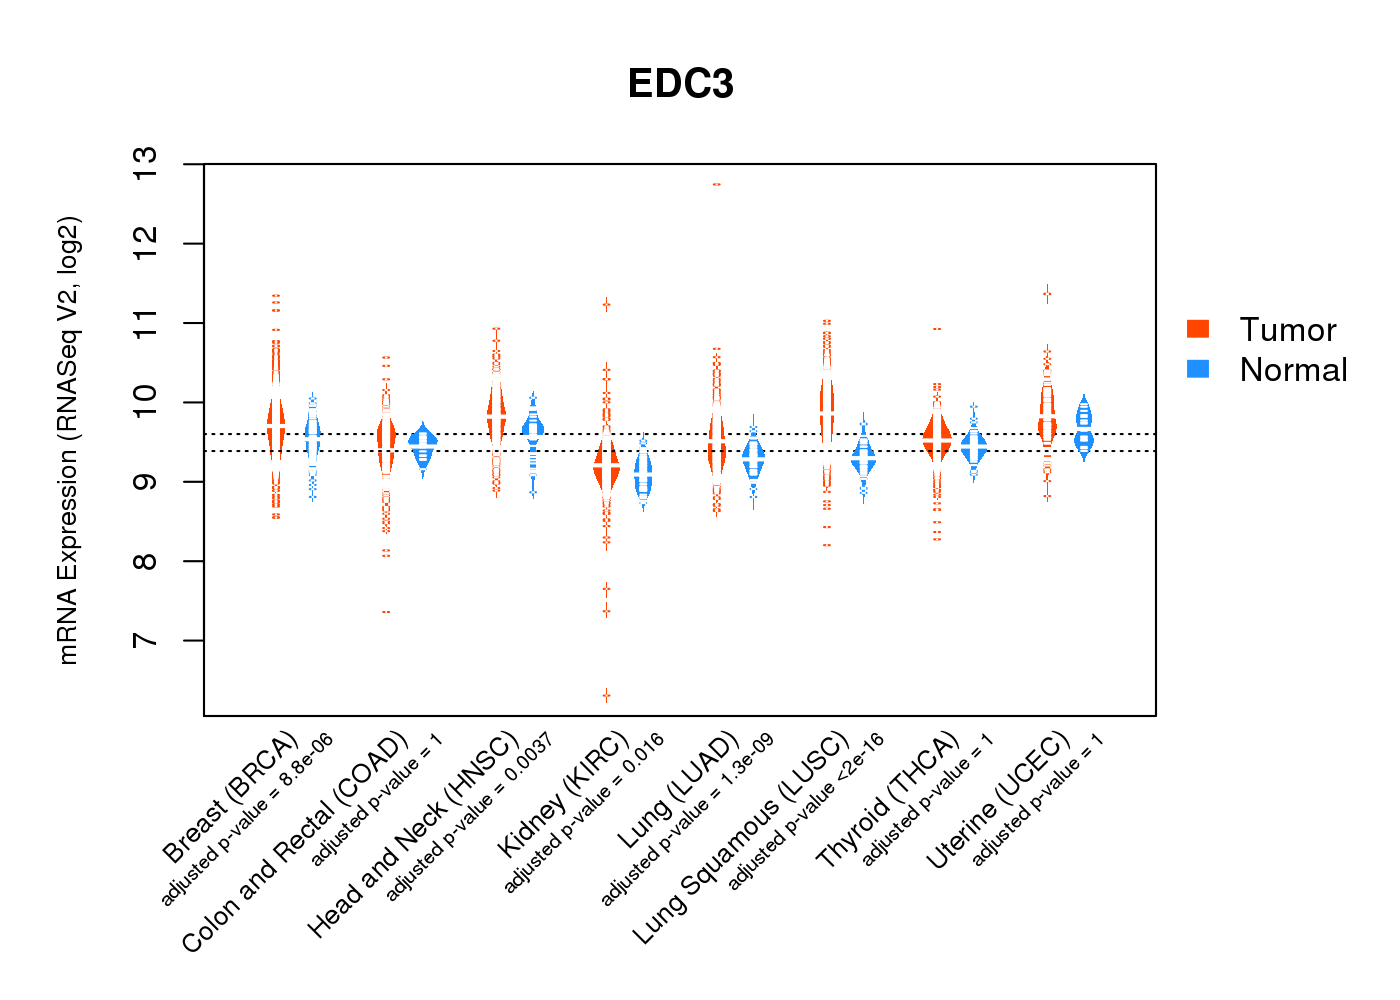 |
| Top |
| * This plots show the correlation between CNV and gene expression. |
: Open all plots for all cancer types
 |
|
 |
|

| Top |
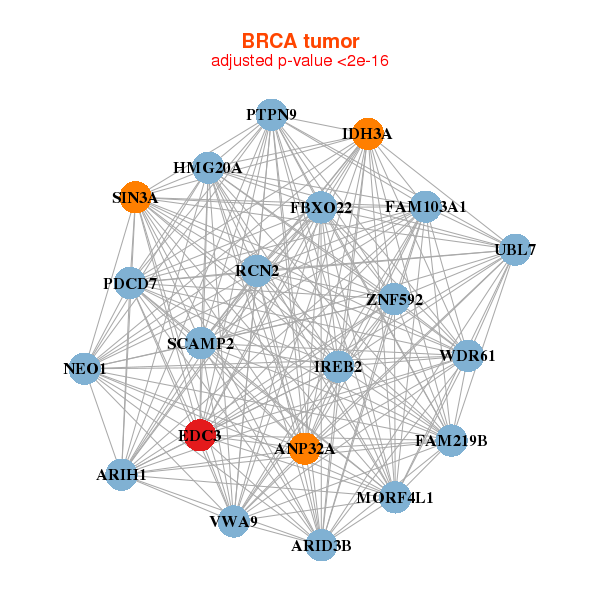
| Gene-Gene Network Information |
| * Co-Expression network figures were drawn using R package igraph. Only the top 20 genes with the highest correlations were shown. Red circle: input gene, orange circle: cell metabolism gene, sky circle: other gene |
: Open all plots for all cancer types
 |
|
| ANP32A,ARID3B,ARIH1,FAM219B,VWA9,EDC3,FAM103A1, FBXO22,HMG20A,IDH3A,IREB2,MORF4L1,NEO1,PDCD7, PTPN9,RCN2,SCAMP2,SIN3A,UBL7,WDR61,ZNF592 | SNHG20,C1orf226,CAD,CCDC120,CCDC85C,CD3EAP,CLSTN1, DDX31,DKC1,EDC3,GEMIN4,LIG1,MKS1,NAT10, PDCD11,POLDIP3,PTK7,SETDB1,WDR6,ZNF346,ZNF74 |
 |
|
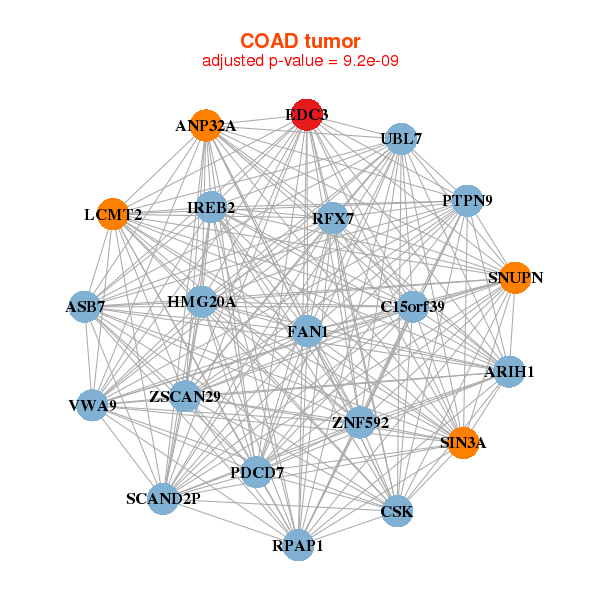
| ANP32A,ARIH1,ASB7,C15orf39,VWA9,CSK,EDC3, HMG20A,IREB2,LCMT2,FAN1,PDCD7,PTPN9,RFX7, RPAP1,SCAND2P,SIN3A,SNUPN,UBL7,ZNF592,ZSCAN29 | ARHGEF10L,DIEXF,CDAN1,CNTROB,DPH1,EDC3,EIF2AK4, FLJ90757,INTS9,ITFG2,TTI1,LIMD1,MMS19,MTSS1, POGK,PTCD1,PTK7,RANBP10,SETDB1,NELFA,ZDHHC8 |
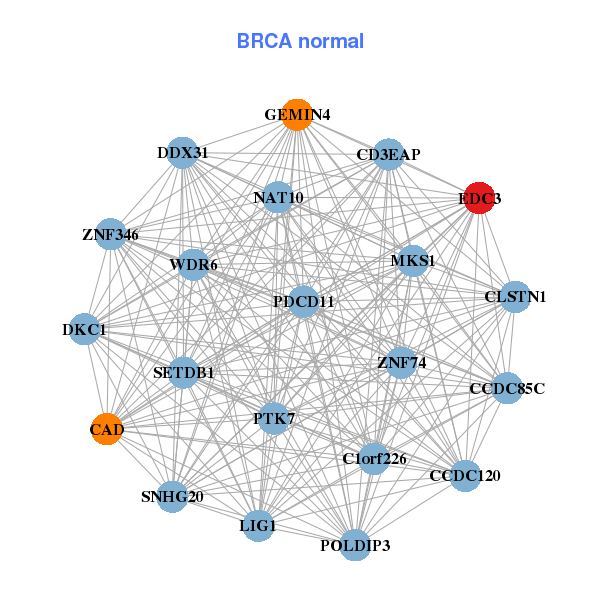
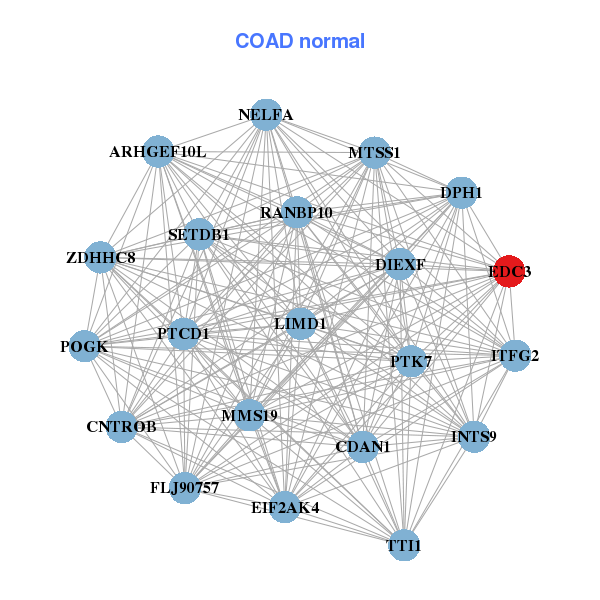
| * Co-Expression network figures were drawn using R package igraph. Only the top 20 genes with the highest correlations were shown. Red circle: input gene, orange circle: cell metabolism gene, sky circle: other gene |
: Open all plots for all cancer types
| Top |
: Open all interacting genes' information including KEGG pathway for all interacting genes from DAVID
| Top |
| Pharmacological Information for EDC3 |
| There's no related Drug. |
| Top |
| Cross referenced IDs for EDC3 |
| * We obtained these cross-references from Uniprot database. It covers 150 different DBs, 18 categories. http://www.uniprot.org/help/cross_references_section |
: Open all cross reference information
|
Copyright © 2016-Present - The Univsersity of Texas Health Science Center at Houston @ |