|
||||||||||||||||||||
| |
| Phenotypic Information (metabolism pathway, cancer, disease, phenome) |
| |
| |
| Gene-Gene Network Information: Co-Expression Network, Interacting Genes & KEGG |
| |
|


| Gene Summary for NUP214 |
| Top |
| Phenotypic Information for NUP214(metabolism pathway, cancer, disease, phenome) |
| Cancer | CGAP: NUP214 |
| Familial Cancer Database: NUP214 | |
| * This gene is included in those cancer gene databases. |
|
|
|
|
|
| . | ||||||||||||||
Oncogene 1 | Significant driver gene in | |||||||||||||||||||
| cf) number; DB name 1 Oncogene; http://nar.oxfordjournals.org/content/35/suppl_1/D721.long, 2 Tumor Suppressor gene; https://bioinfo.uth.edu/TSGene/, 3 Cancer Gene Census; http://www.nature.com/nrc/journal/v4/n3/abs/nrc1299.html, 4 CancerGenes; http://nar.oxfordjournals.org/content/35/suppl_1/D721.long, 5 Network of Cancer Gene; http://ncg.kcl.ac.uk/index.php, 1Therapeutic Vulnerabilities in Cancer; http://cbio.mskcc.org/cancergenomics/statius/ |
| REACTOME_METABOLISM_OF_NON_CODING_RNA REACTOME_METABOLISM_OF_MRNA REACTOME_METABOLISM_OF_RNA REACTOME_METABOLISM_OF_CARBOHYDRATES | |
| OMIM | 114350; gene. |
| Orphanet | 98277; Acute myeloid leukemia with recurrent genetic anomaly. |
| Disease | KEGG Disease: NUP214 |
| MedGen: NUP214 (Human Medical Genetics with Condition) | |
| ClinVar: NUP214 | |
| Phenotype | MGI: NUP214 (International Mouse Phenotyping Consortium) |
| PhenomicDB: NUP214 | |
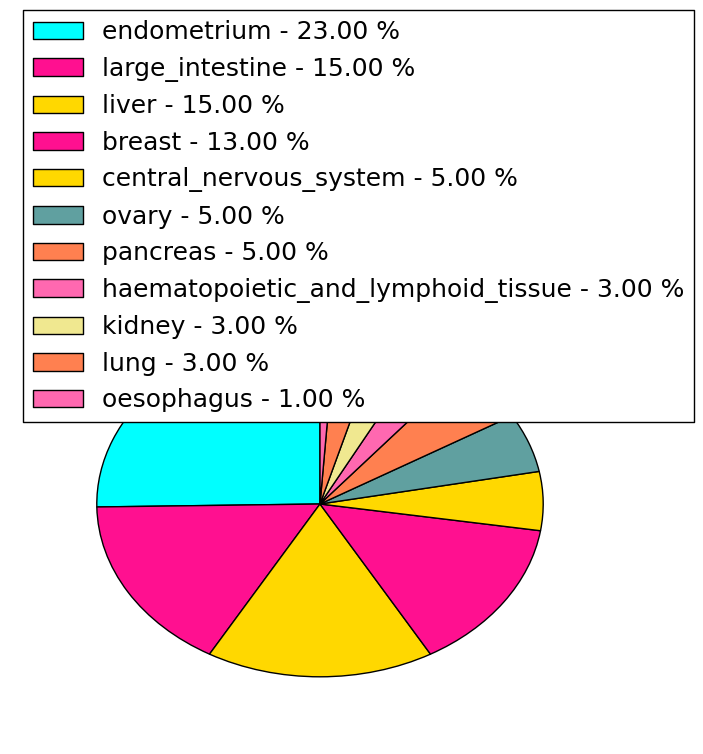
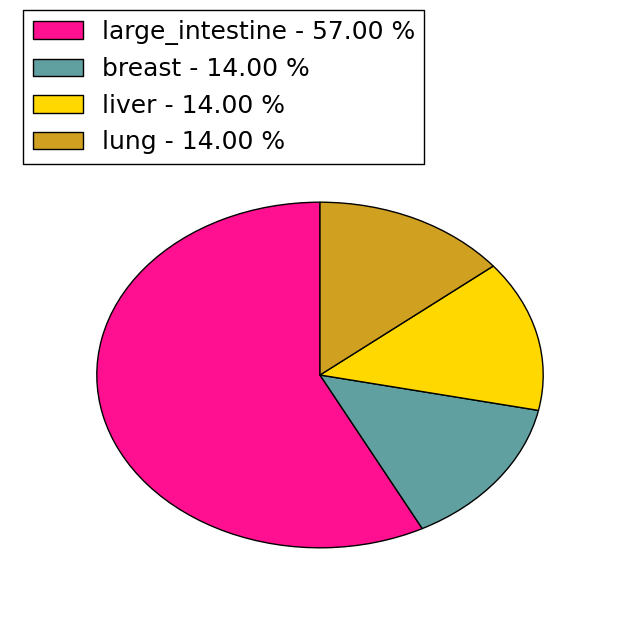
| Mutations for NUP214 |
| * Under tables are showing count per each tissue to give us broad intuition about tissue specific mutation patterns.You can go to the detailed page for each mutation database's web site. |
| - Statistics for Tissue and Mutation type | Top |
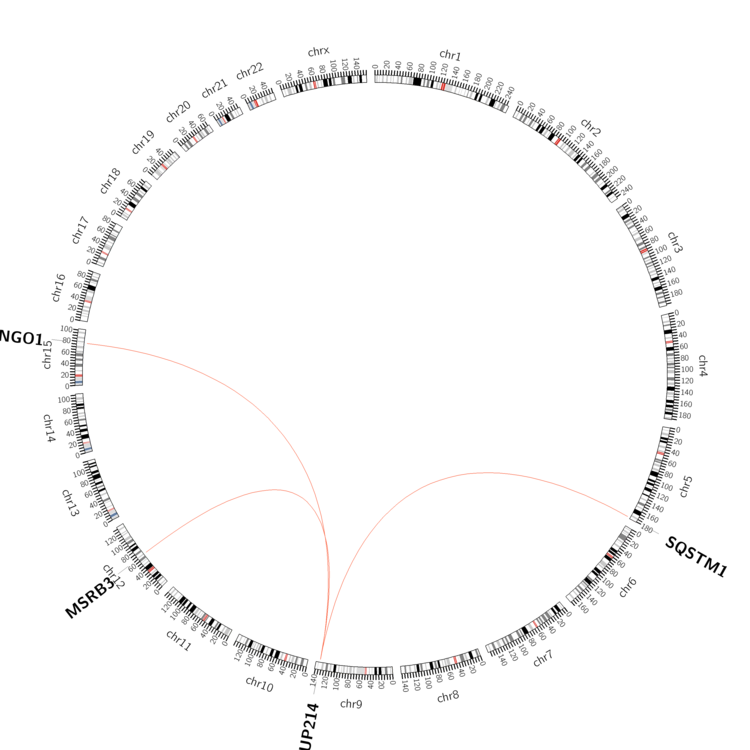 |
| - For Inter-chromosomal Variations |
| * Inter-chromosomal variantions includes 'interchromosomal amplicon to amplicon', 'interchromosomal amplicon to non-amplified dna', 'interchromosomal insertion', 'Interchromosomal unknown type'. |
 |
| - For Intra-chromosomal Variations |
| There's no intra-chromosomal structural variation. |
| Sample | Symbol_a | Chr_a | Start_a | End_a | Symbol_b | Chr_b | Start_b | End_b |
| haematopoietic_and_lymphoid_tissue | NUP214 | chr9 | 134099576 | 134099576 | SQSTM1 | chr5 | 179255575 | 179255575 |
| ovary | NUP214 | chr9 | 134098971 | 134099171 | LINGO1 | chr15 | 77910771 | 77910971 |
| cf) Tissue number; Tissue name (1;Breast, 2;Central_nervous_system, 3;Haematopoietic_and_lymphoid_tissue, 4;Large_intestine, 5;Liver, 6;Lung, 7;Ovary, 8;Pancreas, 9;Prostate, 10;Skin, 11;Soft_tissue, 12;Upper_aerodigestive_tract) |
| * From mRNA Sanger sequences, Chitars2.0 arranged chimeric transcripts. This table shows NUP214 related fusion information. |
| ID | Head Gene | Tail Gene | Accession | Gene_a | qStart_a | qEnd_a | Chromosome_a | tStart_a | tEnd_a | Gene_a | qStart_a | qEnd_a | Chromosome_a | tStart_a | tEnd_a |
| BG003896 | NUP214 | 14 | 72 | 9 | 134070322 | 134070382 | INS-IGF2 | 67 | 212 | 11 | 2154279 | 2154423 | |
| XX000003 | NOTCH1 | 1 | 59 | 9 | 139438476 | 139438534 | NUP214 | 58 | 133 | 9 | 134062675 | 134062750 | |
| BF211581 | NUP214 | 1 | 379 | 9 | 134074021 | 134074402 | XKR3 | 377 | 622 | 22 | 17288733 | 17288976 | |
| BX487600 | PRH1-PRR4 | 22 | 64 | 12 | 11084881 | 11084923 | NUP214 | 59 | 581 | 9 | 134062501 | 134070726 | |
| BF082622 | NUP214 | 10 | 223 | 9 | 134103618 | 134106129 | AGGF1 | 224 | 243 | 5 | 76359022 | 76359041 | |
| BE837492 | NUP214 | 17 | 161 | 9 | 134073077 | 134073222 | ARHGAP26 | 151 | 341 | 5 | 142339348 | 142339538 | |
| BQ329628 | NUP214 | 1 | 209 | 9 | 134039450 | 134049569 | NUP214 | 204 | 279 | 9 | 134039254 | 134039329 | |
| Top |
| There's no copy number variation information in COSMIC data for this gene. |
| Top |
|
 |
| Top |
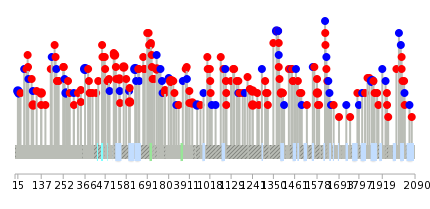
| Stat. for Non-Synonymous SNVs (# total SNVs=122) | (# total SNVs=51) |
 |  |
(# total SNVs=7) | (# total SNVs=3) |
 |  |
| Top |
| * When you move the cursor on each content, you can see more deailed mutation information on the Tooltip. Those are primary_site,primary_histology,mutation(aa),pubmedID. |
| GRCh37 position | Mutation(aa) | Unique sampleID count |
| chr9:134073007-134073008 | p.V1379fs*60 | 3 |
| chr9:134073008-134073008 | p.P1378fs*3 | 3 |
| chr9:134014760-134014760 | p.V366V | 3 |
| chr9:134021630-134021630 | p.T628T | 3 |
| chr9:134090601-134090601 | p.Q1865Q | 3 |
| chr9:134034776-134034776 | p.R815W | 3 |
| chr9:134039494-134039494 | p.A952A | 2 |
| chr9:134026097-134026097 | p.R741Q | 2 |
| chr9:134021542-134021542 | p.P599L | 2 |
| chr9:134073620-134073620 | p.E1580G | 2 |
| Top |
|
 |
| Point Mutation/ Tissue ID | 1 | 2 | 3 | 4 | 5 | 6 | 7 | 8 | 9 | 10 | 11 | 12 | 13 | 14 | 15 | 16 | 17 | 18 | 19 | 20 |
| # sample | 3 | 4 | 1 | 19 | 2 | 7 | 4 | 3 | 26 | 6 | 3 | 1 | 15 | 14 | 3 | 23 | ||||
| # mutation | 4 | 4 | 1 | 21 | 2 | 9 | 4 | 3 | 31 | 6 | 3 | 1 | 15 | 20 | 3 | 28 | ||||
| nonsynonymous SNV | 3 | 3 | 1 | 13 | 1 | 8 | 2 | 3 | 23 | 5 | 1 | 1 | 12 | 16 | 2 | 18 | ||||
| synonymous SNV | 1 | 1 | 8 | 1 | 1 | 2 | 8 | 1 | 2 | 3 | 4 | 1 | 10 |
| cf) Tissue ID; Tissue type (1; BLCA[Bladder Urothelial Carcinoma], 2; BRCA[Breast invasive carcinoma], 3; CESC[Cervical squamous cell carcinoma and endocervical adenocarcinoma], 4; COAD[Colon adenocarcinoma], 5; GBM[Glioblastoma multiforme], 6; Glioma Low Grade, 7; HNSC[Head and Neck squamous cell carcinoma], 8; KICH[Kidney Chromophobe], 9; KIRC[Kidney renal clear cell carcinoma], 10; KIRP[Kidney renal papillary cell carcinoma], 11; LAML[Acute Myeloid Leukemia], 12; LUAD[Lung adenocarcinoma], 13; LUSC[Lung squamous cell carcinoma], 14; OV[Ovarian serous cystadenocarcinoma ], 15; PAAD[Pancreatic adenocarcinoma], 16; PRAD[Prostate adenocarcinoma], 17; SKCM[Skin Cutaneous Melanoma], 18:STAD[Stomach adenocarcinoma], 19:THCA[Thyroid carcinoma], 20:UCEC[Uterine Corpus Endometrial Carcinoma]) |
| Top |
| * We represented just top 10 SNVs. When you move the cursor on each content, you can see more deailed mutation information on the Tooltip. Those are primary_site, primary_histology, mutation(aa), pubmedID. |
| Genomic Position | Mutation(aa) | Unique sampleID count |
| chr9:134004681 | p.V366V | 2 |
| chr9:134034776 | p.E1580G | 2 |
| chr9:134072982 | p.R137C | 2 |
| chr9:134073620 | p.R815W | 2 |
| chr9:134014760 | p.G1367G | 2 |
| chr9:134107673 | p.L329F | 1 |
| chr9:134026030 | p.T1572T | 1 |
| chr9:134067664 | p.G516D | 1 |
| chr9:134073745 | p.Q1814Q | 1 |
| chr9:134014772 | p.V702L | 1 |
| * Copy number data were extracted from TCGA using R package TCGA-Assembler. The URLs of all public data files on TCGA DCC data server were gathered on Jan-05-2015. Function ProcessCNAData in TCGA-Assembler package was used to obtain gene-level copy number value which is calculated as the average copy number of the genomic region of a gene. |
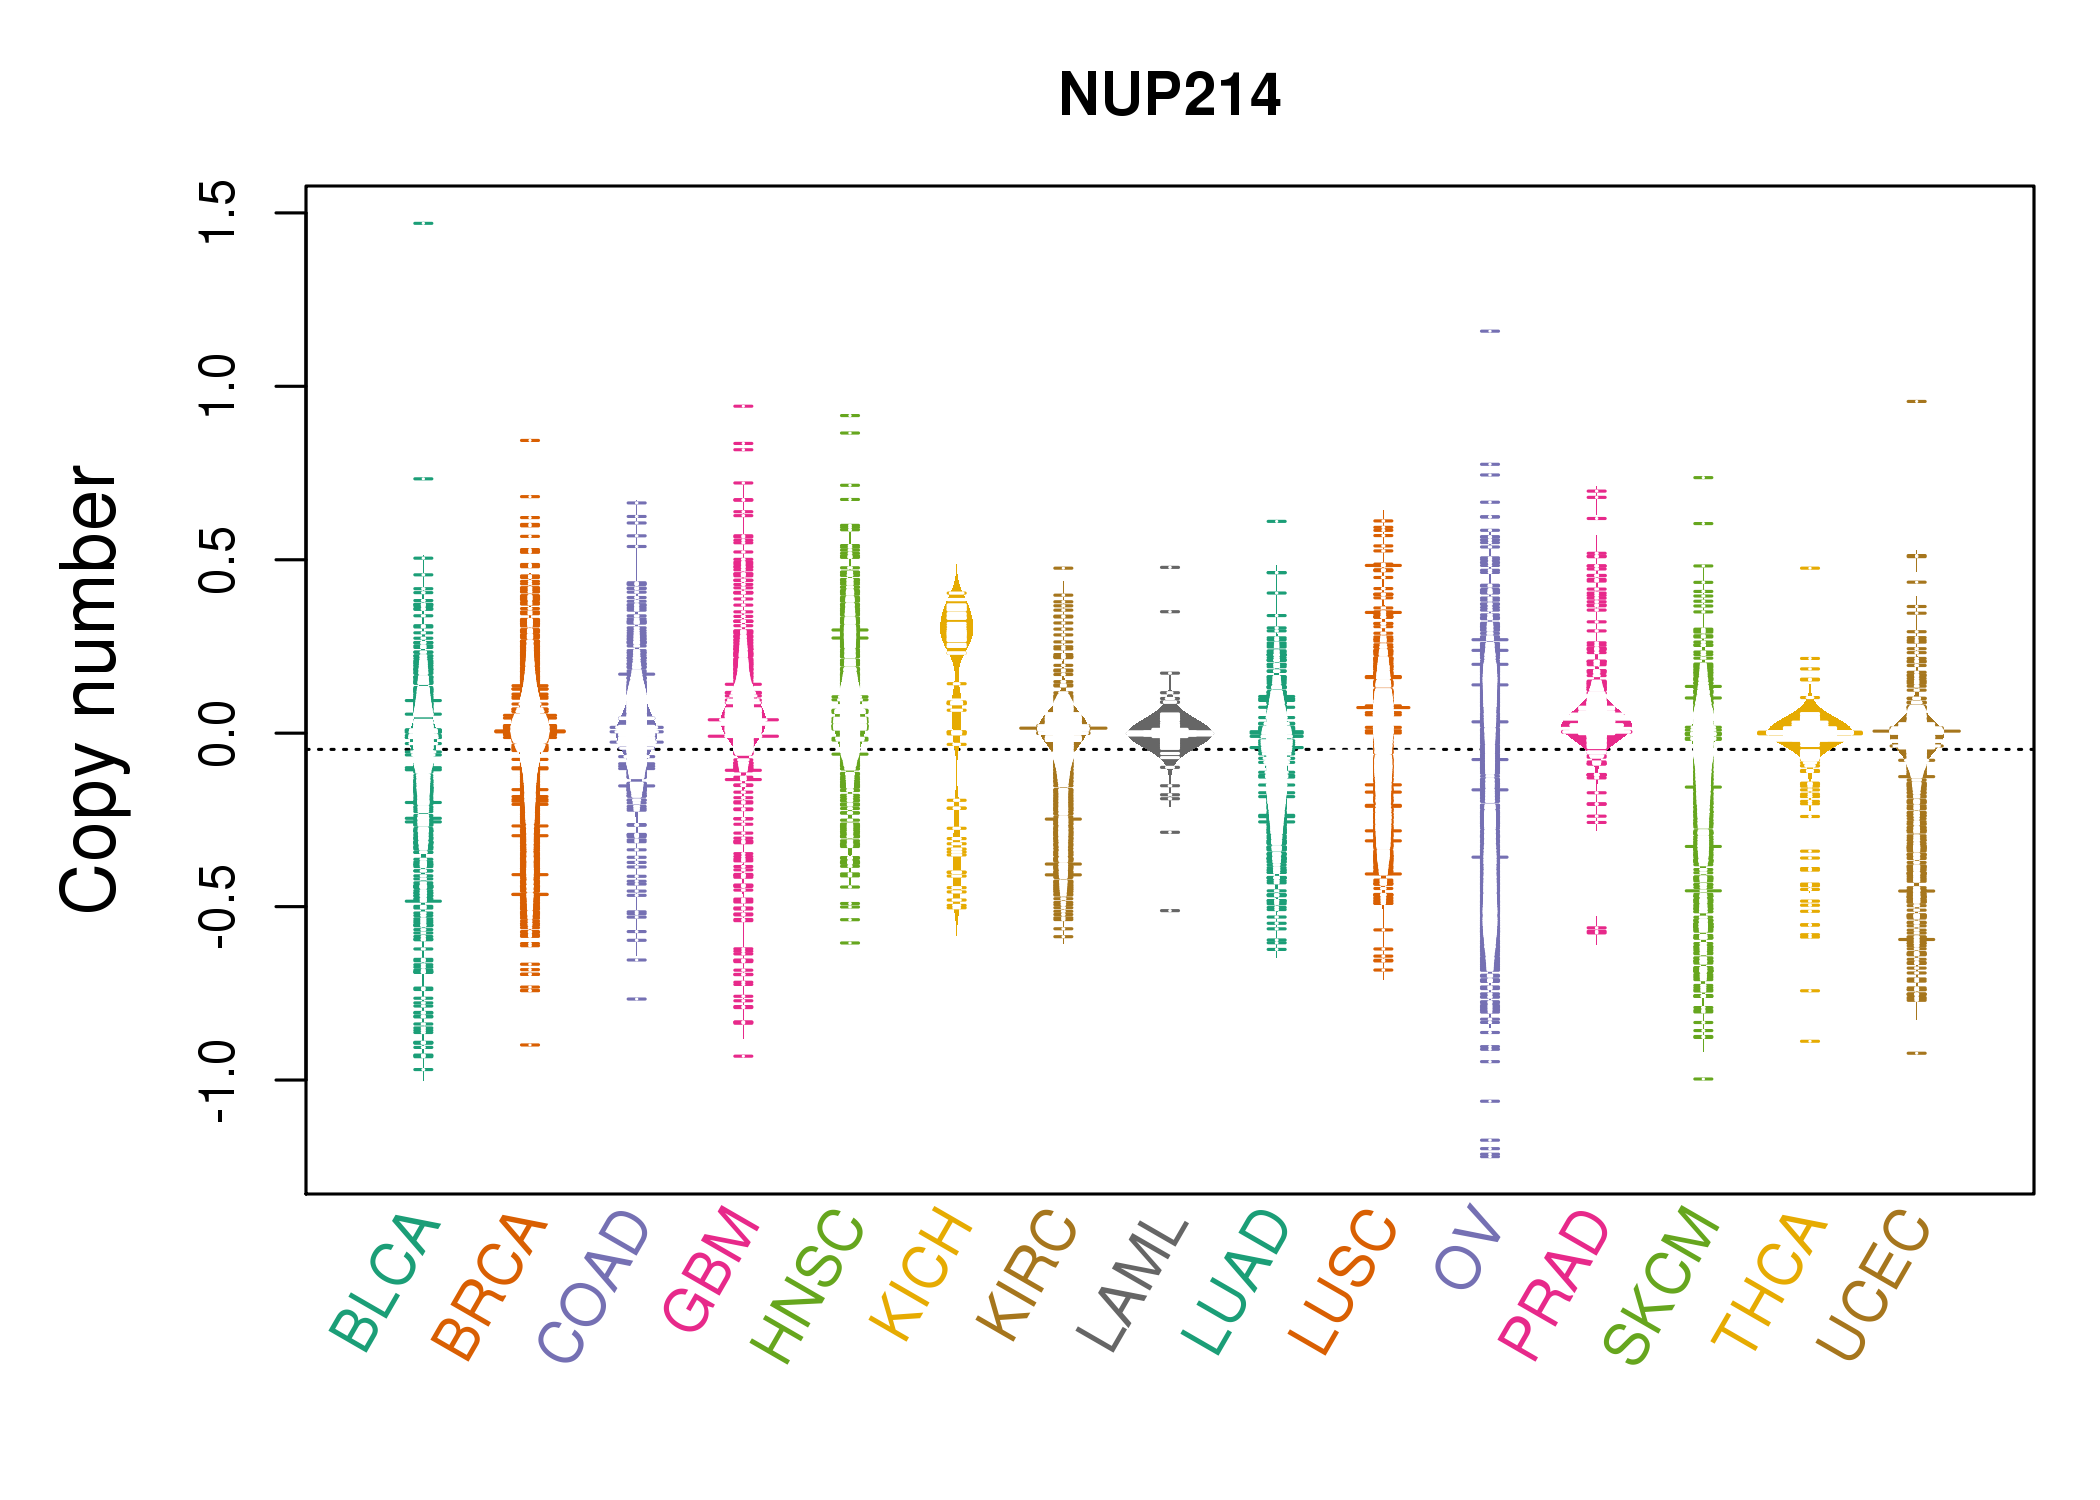 |
| cf) Tissue ID[Tissue type]: BLCA[Bladder Urothelial Carcinoma], BRCA[Breast invasive carcinoma], CESC[Cervical squamous cell carcinoma and endocervical adenocarcinoma], COAD[Colon adenocarcinoma], GBM[Glioblastoma multiforme], Glioma Low Grade, HNSC[Head and Neck squamous cell carcinoma], KICH[Kidney Chromophobe], KIRC[Kidney renal clear cell carcinoma], KIRP[Kidney renal papillary cell carcinoma], LAML[Acute Myeloid Leukemia], LUAD[Lung adenocarcinoma], LUSC[Lung squamous cell carcinoma], OV[Ovarian serous cystadenocarcinoma ], PAAD[Pancreatic adenocarcinoma], PRAD[Prostate adenocarcinoma], SKCM[Skin Cutaneous Melanoma], STAD[Stomach adenocarcinoma], THCA[Thyroid carcinoma], UCEC[Uterine Corpus Endometrial Carcinoma] |
| Top |
| Gene Expression for NUP214 |
| * CCLE gene expression data were extracted from CCLE_Expression_Entrez_2012-10-18.res: Gene-centric RMA-normalized mRNA expression data. |
 |
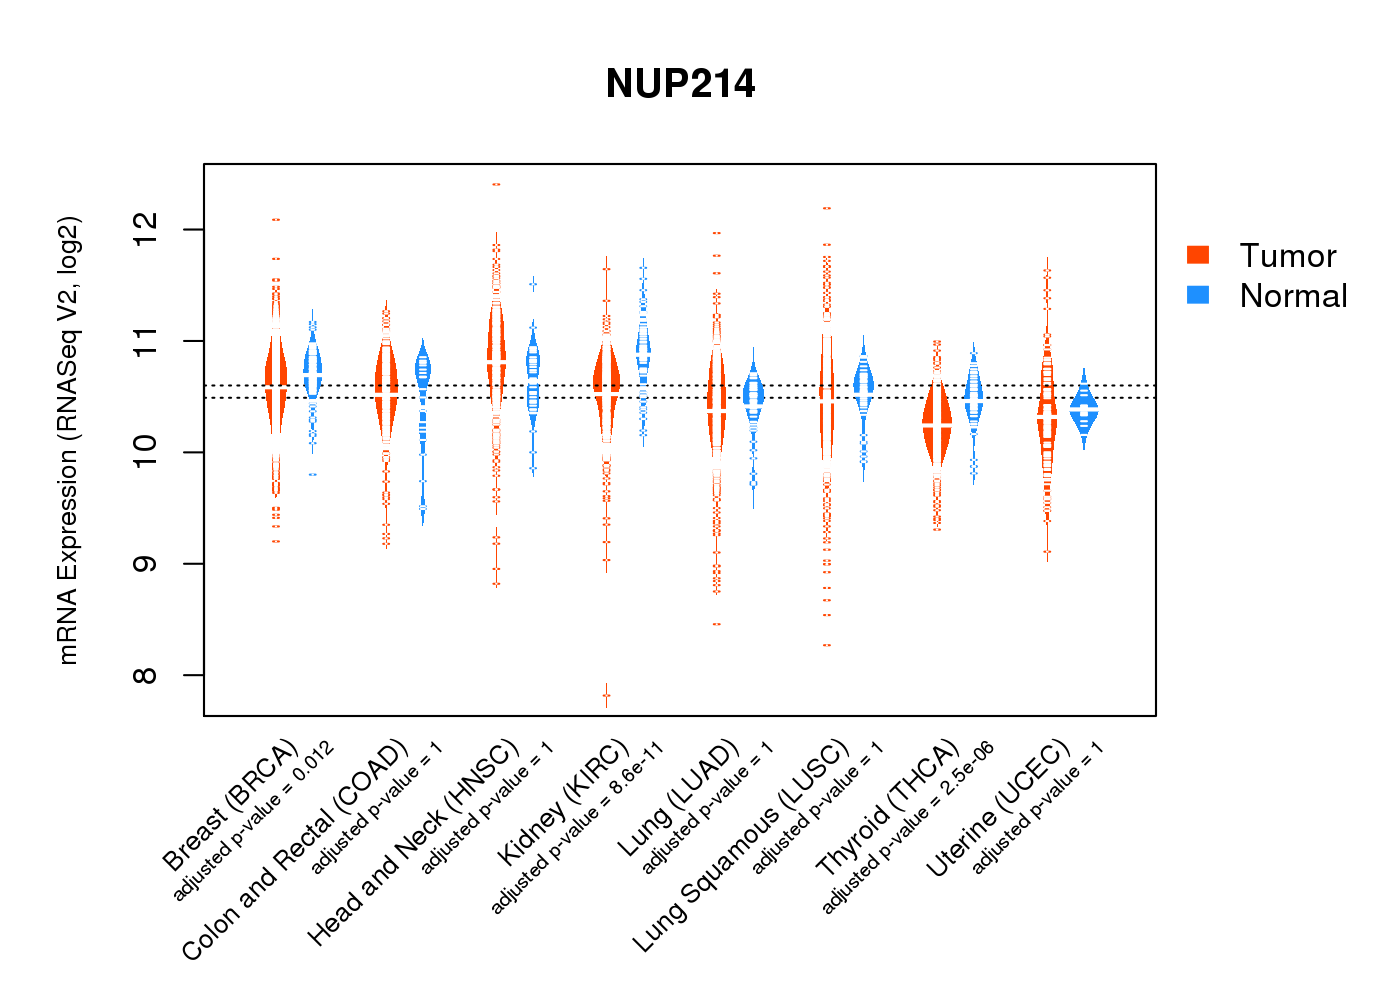
| * Normalized gene expression data of RNASeqV2 was extracted from TCGA using R package TCGA-Assembler. The URLs of all public data files on TCGA DCC data server were gathered at Jan-05-2015. Only eight cancer types have enough normal control samples for differential expression analysis. (t test, adjusted p<0.05 (using Benjamini-Hochberg FDR)) |
 |
| Top |
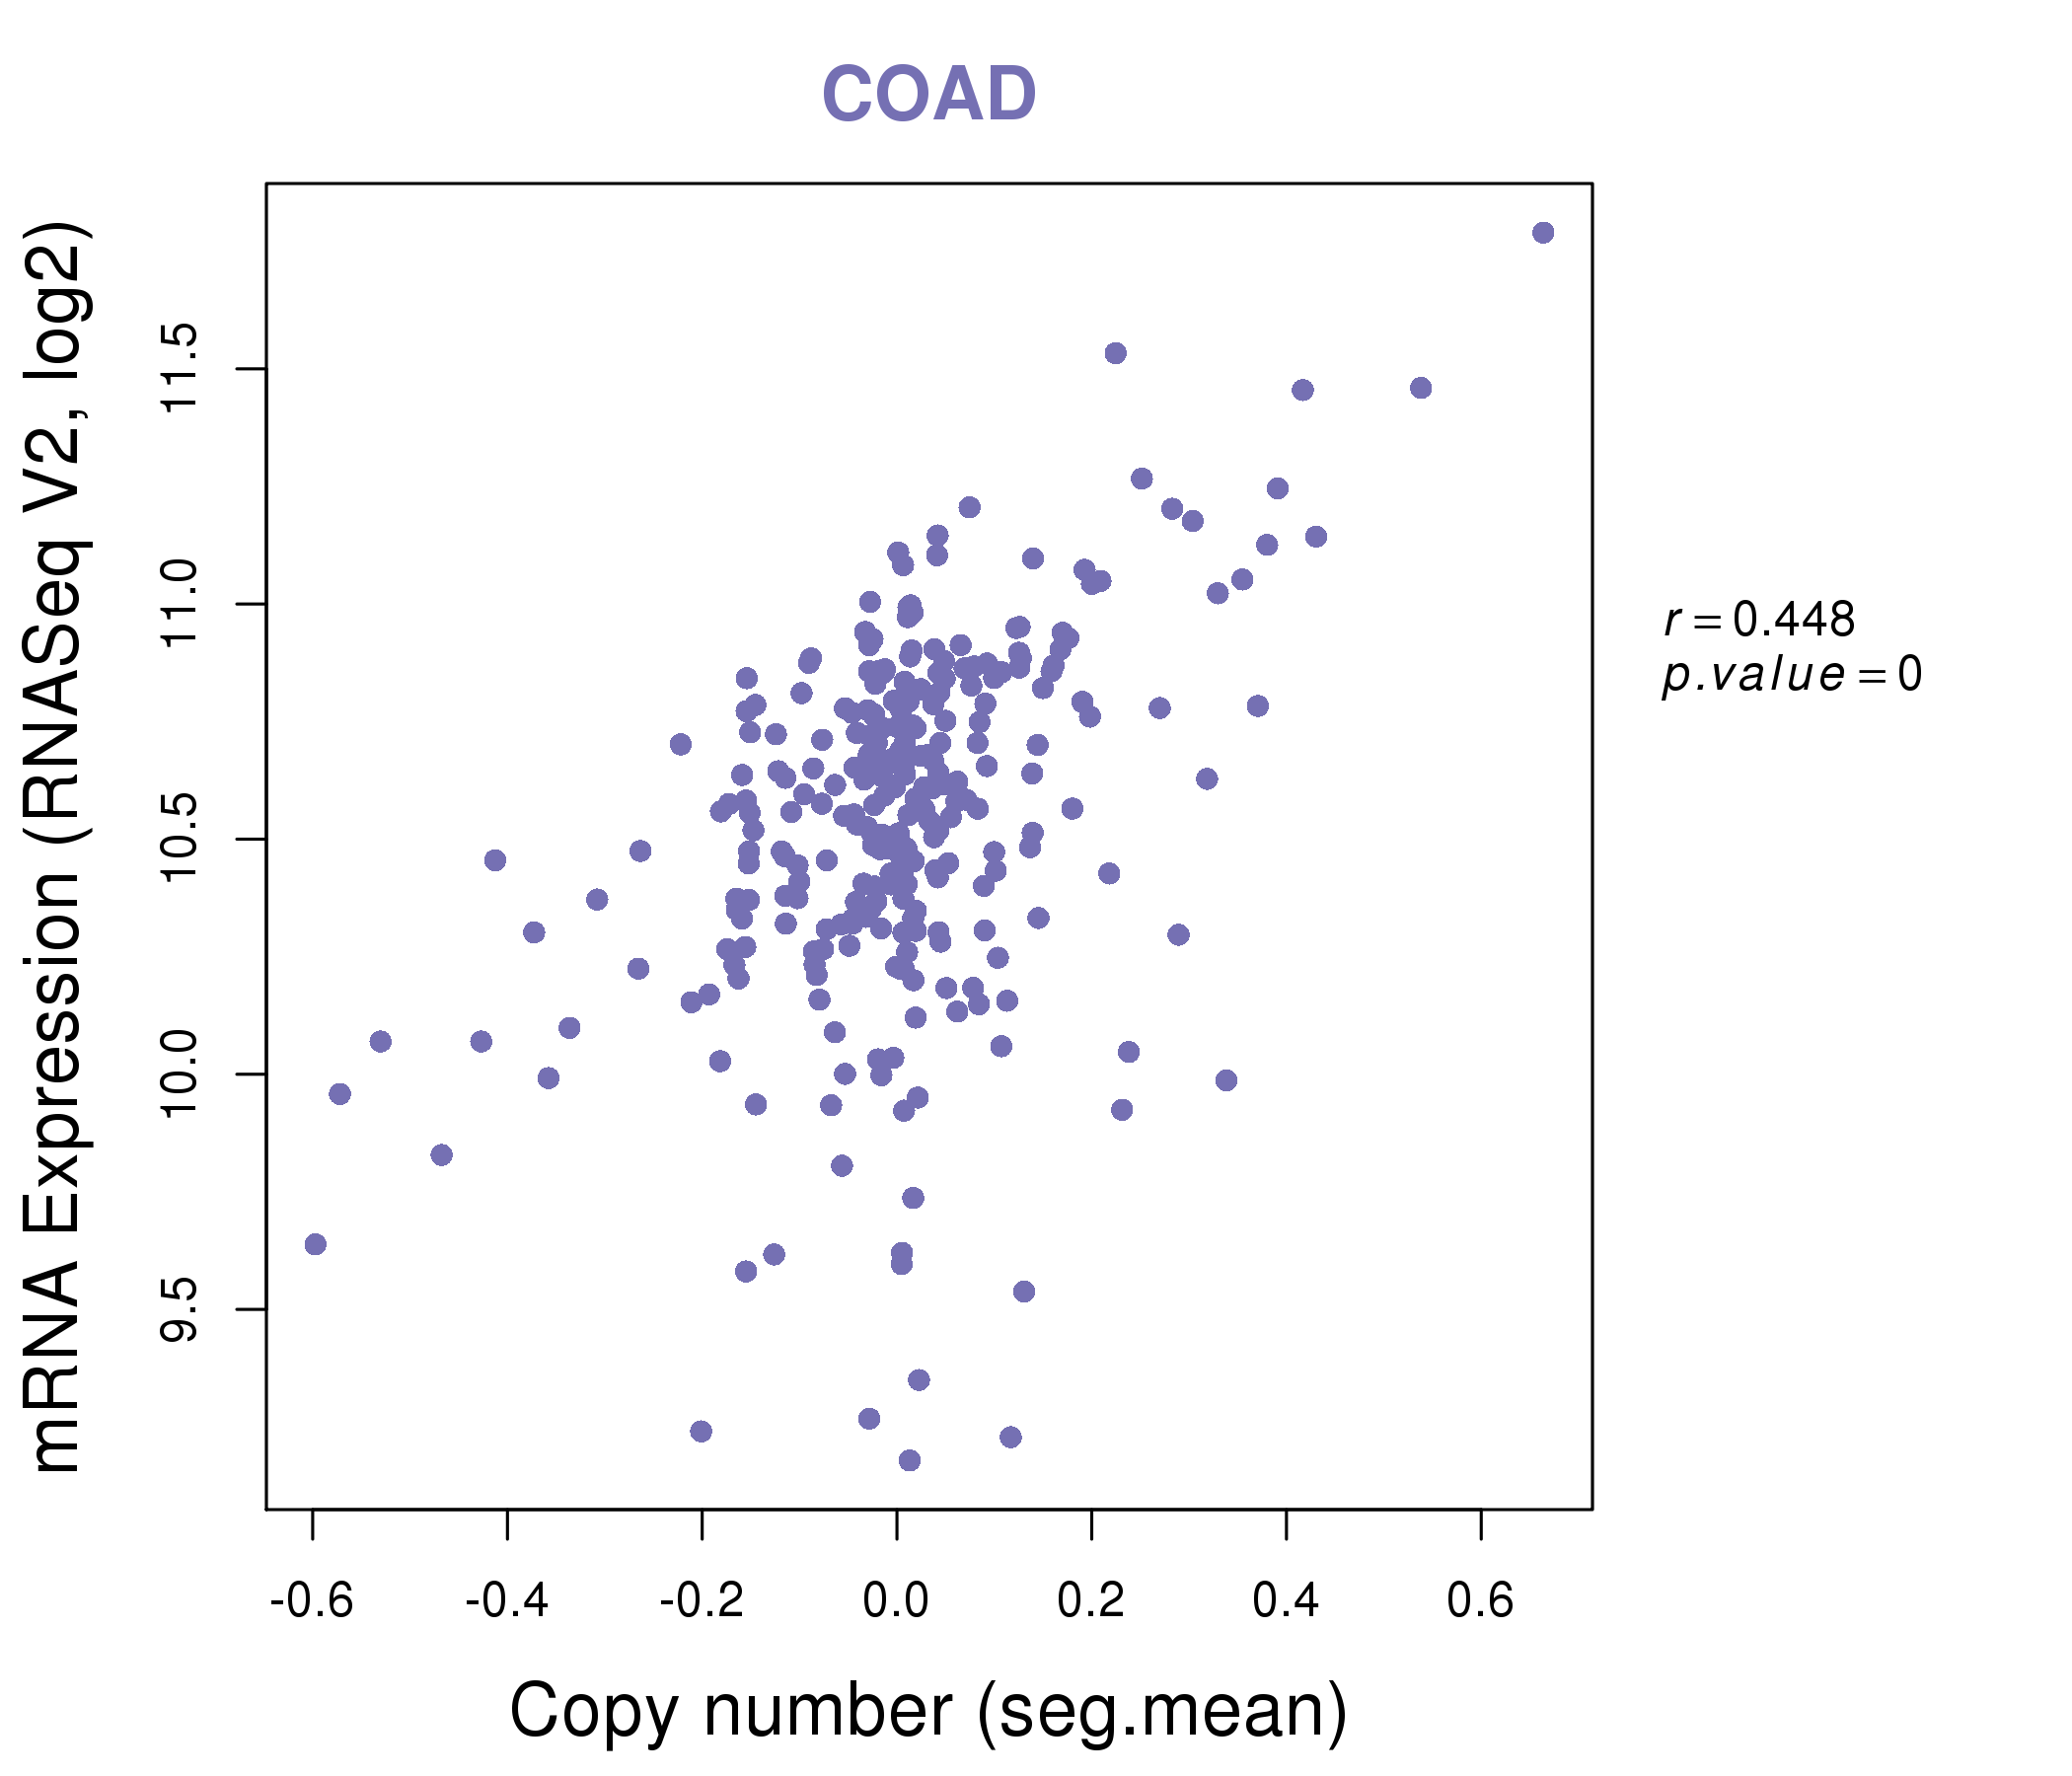
| * This plots show the correlation between CNV and gene expression. |
: Open all plots for all cancer types
 |
|
 |
|


| Top |
| Gene-Gene Network Information |
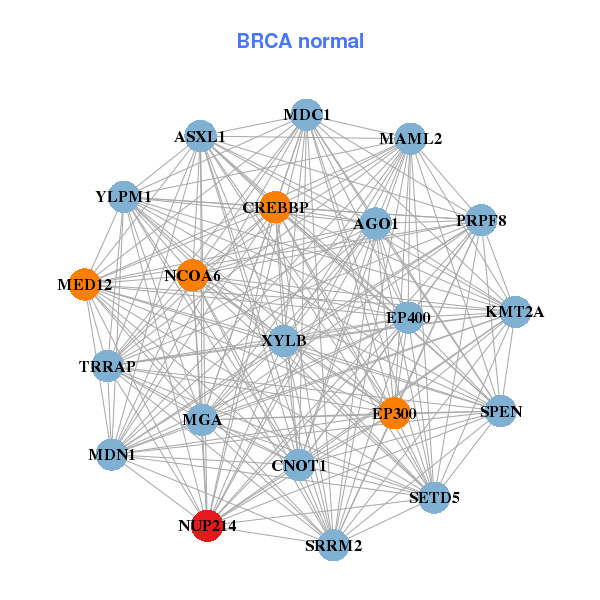
| * Co-Expression network figures were drawn using R package igraph. Only the top 20 genes with the highest correlations were shown. Red circle: input gene, orange circle: cell metabolism gene, sky circle: other gene |
: Open all plots for all cancer types
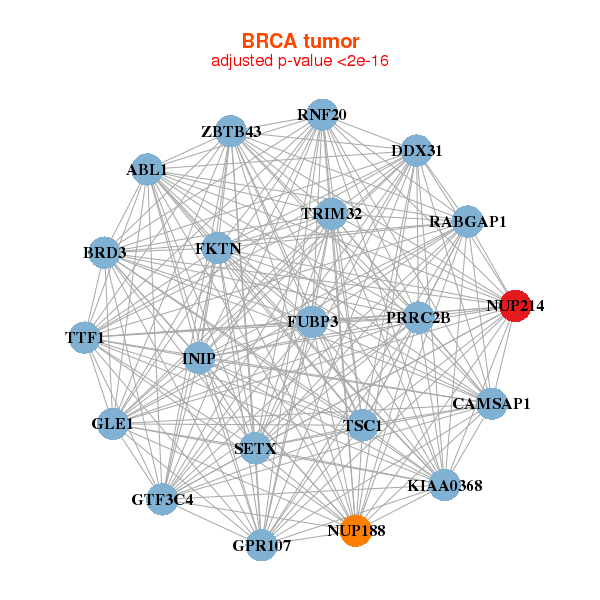 |
| ||||
| ABL1,PRRC2B,BRD3,INIP,CAMSAP1,DDX31,FKTN, FUBP3,GLE1,GPR107,GTF3C4,KIAA0368,NUP188,NUP214, RABGAP1,RNF20,SETX,TRIM32,TSC1,TTF1,ZBTB43 | ASXL1,CNOT1,CREBBP,AGO1,EP300,EP400,MAML2, MDC1,MDN1,MED12,MGA,KMT2A,NCOA6,NUP214, PRPF8,SETD5,SPEN,SRRM2,TRRAP,XYLB,YLPM1 | ||||
 |
| ||||
| ABL1,PRRC2A,PRRC2B,BRD3,CDK5RAP2,CNTRL,CIZ1, EHMT1,FBXW2,FUBP3,GOLGA1,KIAA0368,PPP1R26,KMT2B___KMT2D, NUP214,RNF20,SNAPC4,TBC1D13,TSC1,UBAP2,USP20 | PRRC2A,CBX5,CHERP,EP400,GCN1L1,GTF3C1,LARP1, MTOR,NUP214,PDCD11,PRPF8,SAFB2,SAFB,SNRNP200, SRCAP,TRRAP,UBAP2,UBE2O,YLPM1,ZC3H18,ZNF142 |

| * Co-Expression network figures were drawn using R package igraph. Only the top 20 genes with the highest correlations were shown. Red circle: input gene, orange circle: cell metabolism gene, sky circle: other gene |
: Open all plots for all cancer types
| Top |
: Open all interacting genes' information including KEGG pathway for all interacting genes from DAVID
| Top |
| Pharmacological Information for NUP214 |
| DB Category | DB Name | DB's ID and Url link |
| Organism-specific databases | PharmGKB | PA31851; -. |
| Organism-specific databases | CTD | 8021; -. |
| * Gene Centered Interaction Network. |
 |
| * Drug Centered Interaction Network. |
| DrugBank ID | Target Name | Drug Groups | Generic Name | Drug Centered Network | Drug Structure |
| DB00864 | nucleoporin 214kDa | approved; investigational | Tacrolimus |  |  |
| Top |
| Cross referenced IDs for NUP214 |
| * We obtained these cross-references from Uniprot database. It covers 150 different DBs, 18 categories. http://www.uniprot.org/help/cross_references_section |
: Open all cross reference information
|
Copyright © 2016-Present - The Univsersity of Texas Health Science Center at Houston @ |