|
||||||||||||||||||||||||||||||||||||||||||||||||||||||||||||||||||||||||||||||||||||||||||||||||||||||||||||||||||||||||||||||||||||||||||||||||||||||||||||||||||||||||||||||||||||||||||||||||||||||||||||||||||||||||||||||||||||||||||||||||||||||||||||||||||||||||||||||||||||||||||||||||||||||||||||||||||||||||||
| |
| Phenotypic Information (metabolism pathway, cancer, disease, phenome) |
| |
| |
| Gene-Gene Network Information: Co-Expression Network, Interacting Genes & KEGG |
| |
|


| Gene Summary for EDEM3 |
| Basic gene info. | Gene symbol | EDEM3 |
| Gene name | ER degradation enhancer, mannosidase alpha-like 3 | |
| Synonyms | C1orf22 | |
| Cytomap | UCSC genome browser: 1q25 | |
| Genomic location | chr1 :184659624-184724041 | |
| Type of gene | protein-coding | |
| RefGenes | NM_025191.3, | |
| Ensembl id | ENSG00000116406 | |
| Description | ER degradation-enhancing -mannosidase-like protein 3ER degradation-enhancing alpha-mannosidase-like 3ER degradation-enhancing alpha-mannosidase-like protein 3alpha-1,2-mannosidase EDEM3 | |
| Modification date | 20141207 | |
| dbXrefs | MIM : 610214 | |
| HGNC : HGNC | ||
| Ensembl : ENSG00000116406 | ||
| HPRD : 10724 | ||
| Vega : OTTHUMG00000035387 | ||
| Protein | UniProt: go to UniProt's Cross Reference DB Table | |
| Expression | CleanEX: HS_EDEM3 | |
| BioGPS: 80267 | ||
| Gene Expression Atlas: ENSG00000116406 | ||
| The Human Protein Atlas: ENSG00000116406 | ||
| Pathway | NCI Pathway Interaction Database: EDEM3 | |
| KEGG: EDEM3 | ||
| REACTOME: EDEM3 | ||
| ConsensusPathDB | ||
| Pathway Commons: EDEM3 | ||
| Metabolism | MetaCyc: EDEM3 | |
| HUMANCyc: EDEM3 | ||
| Regulation | Ensembl's Regulation: ENSG00000116406 | |
| miRBase: chr1 :184,659,624-184,724,041 | ||
| TargetScan: NM_025191 | ||
| cisRED: ENSG00000116406 | ||
| Context | iHOP: EDEM3 | |
| cancer metabolism search in PubMed: EDEM3 | ||
| UCL Cancer Institute: EDEM3 | ||
| Assigned class in ccmGDB | C | |
| Top |
| Phenotypic Information for EDEM3(metabolism pathway, cancer, disease, phenome) |
| Cancer | CGAP: EDEM3 |
| Familial Cancer Database: EDEM3 | |
| * This gene is included in those cancer gene databases. |
|
|
|
|
|
| . | ||||||||||||||||||||||||||||||||||||||||||||||||||||||||||||||||||||||||||||||||||||||||||||||||||||||||||||||||||||||||||||||||||||||||||||||||||||||||||||||||||||||||||||||||||||||||||||||||||||||||||||||||||||||||||||||||||||||||||||||||||||||||||||||||||||||||||||||||||||||||||||||||||||||||||||||||||||
Oncogene 1 | Significant driver gene in | |||||||||||||||||||||||||||||||||||||||||||||||||||||||||||||||||||||||||||||||||||||||||||||||||||||||||||||||||||||||||||||||||||||||||||||||||||||||||||||||||||||||||||||||||||||||||||||||||||||||||||||||||||||||||||||||||||||||||||||||||||||||||||||||||||||||||||||||||||||||||||||||||||||||||||||||||||||||||
| cf) number; DB name 1 Oncogene; http://nar.oxfordjournals.org/content/35/suppl_1/D721.long, 2 Tumor Suppressor gene; https://bioinfo.uth.edu/TSGene/, 3 Cancer Gene Census; http://www.nature.com/nrc/journal/v4/n3/abs/nrc1299.html, 4 CancerGenes; http://nar.oxfordjournals.org/content/35/suppl_1/D721.long, 5 Network of Cancer Gene; http://ncg.kcl.ac.uk/index.php, 1Therapeutic Vulnerabilities in Cancer; http://cbio.mskcc.org/cancergenomics/statius/ |
| REACTOME_METABOLISM_OF_PROTEINS | |
| OMIM | |
| Orphanet | |
| Disease | KEGG Disease: EDEM3 |
| MedGen: EDEM3 (Human Medical Genetics with Condition) | |
| ClinVar: EDEM3 | |
| Phenotype | MGI: EDEM3 (International Mouse Phenotyping Consortium) |
| PhenomicDB: EDEM3 | |
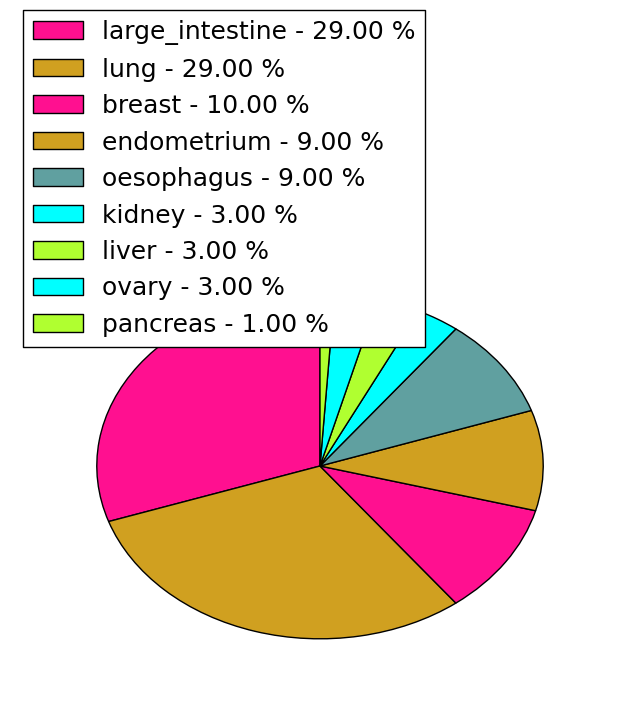
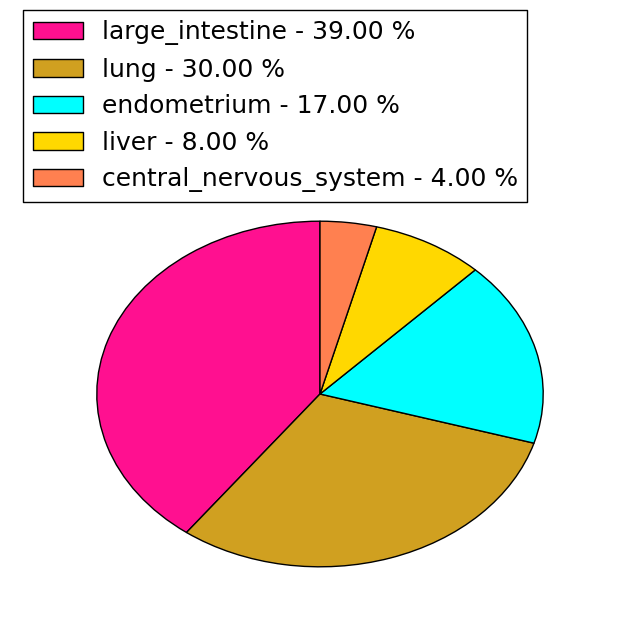
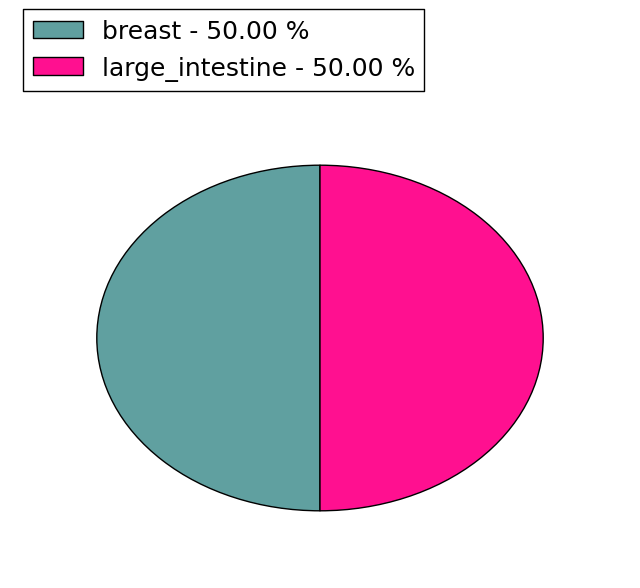
| Mutations for EDEM3 |
| * Under tables are showing count per each tissue to give us broad intuition about tissue specific mutation patterns.You can go to the detailed page for each mutation database's web site. |
| - Statistics for Tissue and Mutation type | Top |
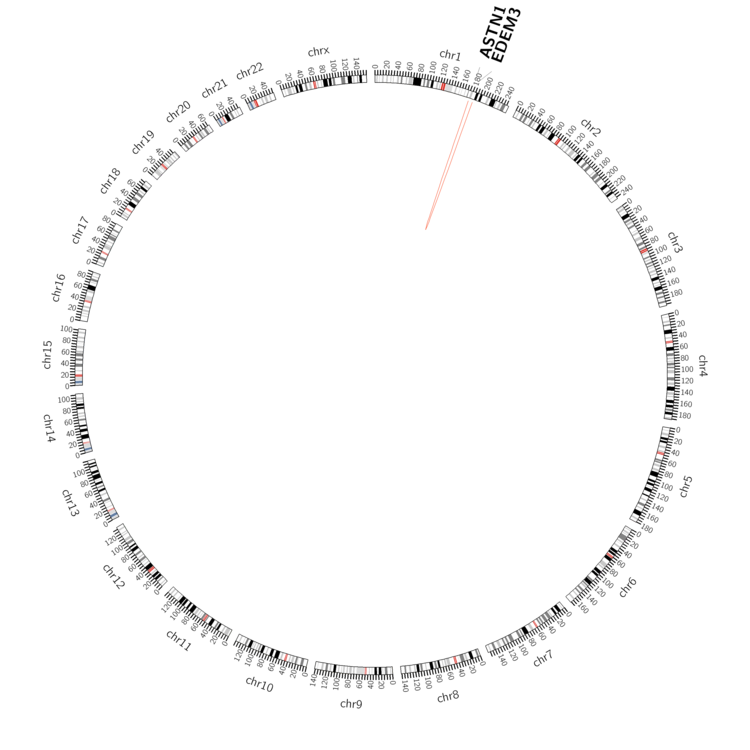 |
| - For Inter-chromosomal Variations |
| There's no inter-chromosomal structural variation. |
| - For Intra-chromosomal Variations |
| * Intra-chromosomal variantions includes 'intrachromosomal amplicon to amplicon', 'intrachromosomal amplicon to non-amplified dna', 'intrachromosomal deletion', 'intrachromosomal fold-back inversion', 'intrachromosomal inversion', 'intrachromosomal tandem duplication', 'Intrachromosomal unknown type', 'intrachromosomal with inverted orientation', 'intrachromosomal with non-inverted orientation'. |
 |
| Sample | Symbol_a | Chr_a | Start_a | End_a | Symbol_b | Chr_b | Start_b | End_b |
| pancreas | EDEM3 | chr1 | 184691261 | 184691281 | ASTN1 | chr1 | 176989263 | 176989283 |
| cf) Tissue number; Tissue name (1;Breast, 2;Central_nervous_system, 3;Haematopoietic_and_lymphoid_tissue, 4;Large_intestine, 5;Liver, 6;Lung, 7;Ovary, 8;Pancreas, 9;Prostate, 10;Skin, 11;Soft_tissue, 12;Upper_aerodigestive_tract) |
| * From mRNA Sanger sequences, Chitars2.0 arranged chimeric transcripts. This table shows EDEM3 related fusion information. |
| ID | Head Gene | Tail Gene | Accession | Gene_a | qStart_a | qEnd_a | Chromosome_a | tStart_a | tEnd_a | Gene_a | qStart_a | qEnd_a | Chromosome_a | tStart_a | tEnd_a |
| BF919684 | TBPL1 | 27 | 300 | 6 | 134274374 | 134301303 | EDEM3 | 292 | 425 | 1 | 184662691 | 184662824 | |
| M16328 | EDEM3 | 4 | 347 | 1 | 184664188 | 184664531 | GBAP1 | 348 | 2587 | 1 | 155204244 | 155210991 | |
| CV569883 | EDEM3 | 10 | 285 | 1 | 184660956 | 184661234 | EDEM3 | 278 | 523 | 1 | 184662192 | 184662437 | |
| Top |
| Mutation type/ Tissue ID | brca | cns | cerv | endome | haematopo | kidn | Lintest | liver | lung | ns | ovary | pancre | prost | skin | stoma | thyro | urina | |||
| Total # sample | 2 | 1 | 1 | |||||||||||||||||
| GAIN (# sample) | 2 | 1 | 1 | |||||||||||||||||
| LOSS (# sample) |
| cf) Tissue ID; Tissue type (1; Breast, 2; Central_nervous_system, 3; Cervix, 4; Endometrium, 5; Haematopoietic_and_lymphoid_tissue, 6; Kidney, 7; Large_intestine, 8; Liver, 9; Lung, 10; NS, 11; Ovary, 12; Pancreas, 13; Prostate, 14; Skin, 15; Stomach, 16; Thyroid, 17; Urinary_tract) |
| Top |
|
 |
| Top |
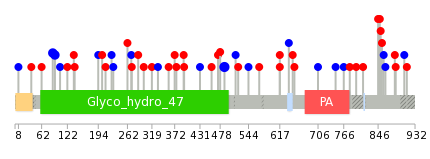
| Stat. for Non-Synonymous SNVs (# total SNVs=55) | (# total SNVs=23) |
 |  |
(# total SNVs=2) | (# total SNVs=0) |
 |
| Top |
| * When you move the cursor on each content, you can see more deailed mutation information on the Tooltip. Those are primary_site,primary_histology,mutation(aa),pubmedID. |
| GRCh37 position | Mutation(aa) | Unique sampleID count |
| chr1:184663581-184663581 | p.Q762Q | 3 |
| chr1:184703759-184703759 | p.E79* | 2 |
| chr1:184663418-184663418 | p.P817S | 2 |
| chr1:184680954-184680954 | p.Q489K | 2 |
| chr1:184706771-184706771 | p.R50R | 2 |
| chr1:184680990-184680990 | p.D477N | 2 |
| chr1:184677464-184677464 | p.I577I | 2 |
| chr1:184663537-184663537 | p.I777S | 2 |
| chr1:184681639-184681639 | p.I445I | 2 |
| chr1:184663392-184663392 | p.T825T | 1 |
| Top |
|
 |
| Point Mutation/ Tissue ID | 1 | 2 | 3 | 4 | 5 | 6 | 7 | 8 | 9 | 10 | 11 | 12 | 13 | 14 | 15 | 16 | 17 | 18 | 19 | 20 |
| # sample | 2 | 2 | 10 | 1 | 1 | 7 | 5 | 1 | 9 | 5 | 1 | 5 | ||||||||
| # mutation | 2 | 2 | 9 | 1 | 1 | 7 | 5 | 1 | 9 | 7 | 1 | 6 | ||||||||
| nonsynonymous SNV | 2 | 2 | 4 | 1 | 1 | 4 | 5 | 1 | 5 | 5 | 1 | 3 | ||||||||
| synonymous SNV | 5 | 3 | 4 | 2 | 3 |
| cf) Tissue ID; Tissue type (1; BLCA[Bladder Urothelial Carcinoma], 2; BRCA[Breast invasive carcinoma], 3; CESC[Cervical squamous cell carcinoma and endocervical adenocarcinoma], 4; COAD[Colon adenocarcinoma], 5; GBM[Glioblastoma multiforme], 6; Glioma Low Grade, 7; HNSC[Head and Neck squamous cell carcinoma], 8; KICH[Kidney Chromophobe], 9; KIRC[Kidney renal clear cell carcinoma], 10; KIRP[Kidney renal papillary cell carcinoma], 11; LAML[Acute Myeloid Leukemia], 12; LUAD[Lung adenocarcinoma], 13; LUSC[Lung squamous cell carcinoma], 14; OV[Ovarian serous cystadenocarcinoma ], 15; PAAD[Pancreatic adenocarcinoma], 16; PRAD[Prostate adenocarcinoma], 17; SKCM[Skin Cutaneous Melanoma], 18:STAD[Stomach adenocarcinoma], 19:THCA[Thyroid carcinoma], 20:UCEC[Uterine Corpus Endometrial Carcinoma]) |
| Top |
| * We represented just top 10 SNVs. When you move the cursor on each content, you can see more deailed mutation information on the Tooltip. Those are primary_site, primary_histology, mutation(aa), pubmedID. |
| Genomic Position | Mutation(aa) | Unique sampleID count |
| chr1:184681639 | p.I488I | 3 |
| chr1:184706771 | p.R93R | 2 |
| chr1:184677474 | p.A617V | 2 |
| chr1:184706786 | p.G88G | 2 |
| chr1:184663564 | p.I706I | 1 |
| chr1:184695461 | p.Y376D | 1 |
| chr1:184680916 | p.D137G | 1 |
| chr1:184723669 | p.I913M | 1 |
| chr1:184663257 | p.Q651R | 1 |
| chr1:184688343 | p.H372N | 1 |
| * Copy number data were extracted from TCGA using R package TCGA-Assembler. The URLs of all public data files on TCGA DCC data server were gathered on Jan-05-2015. Function ProcessCNAData in TCGA-Assembler package was used to obtain gene-level copy number value which is calculated as the average copy number of the genomic region of a gene. |
 |
| cf) Tissue ID[Tissue type]: BLCA[Bladder Urothelial Carcinoma], BRCA[Breast invasive carcinoma], CESC[Cervical squamous cell carcinoma and endocervical adenocarcinoma], COAD[Colon adenocarcinoma], GBM[Glioblastoma multiforme], Glioma Low Grade, HNSC[Head and Neck squamous cell carcinoma], KICH[Kidney Chromophobe], KIRC[Kidney renal clear cell carcinoma], KIRP[Kidney renal papillary cell carcinoma], LAML[Acute Myeloid Leukemia], LUAD[Lung adenocarcinoma], LUSC[Lung squamous cell carcinoma], OV[Ovarian serous cystadenocarcinoma ], PAAD[Pancreatic adenocarcinoma], PRAD[Prostate adenocarcinoma], SKCM[Skin Cutaneous Melanoma], STAD[Stomach adenocarcinoma], THCA[Thyroid carcinoma], UCEC[Uterine Corpus Endometrial Carcinoma] |
| Top |
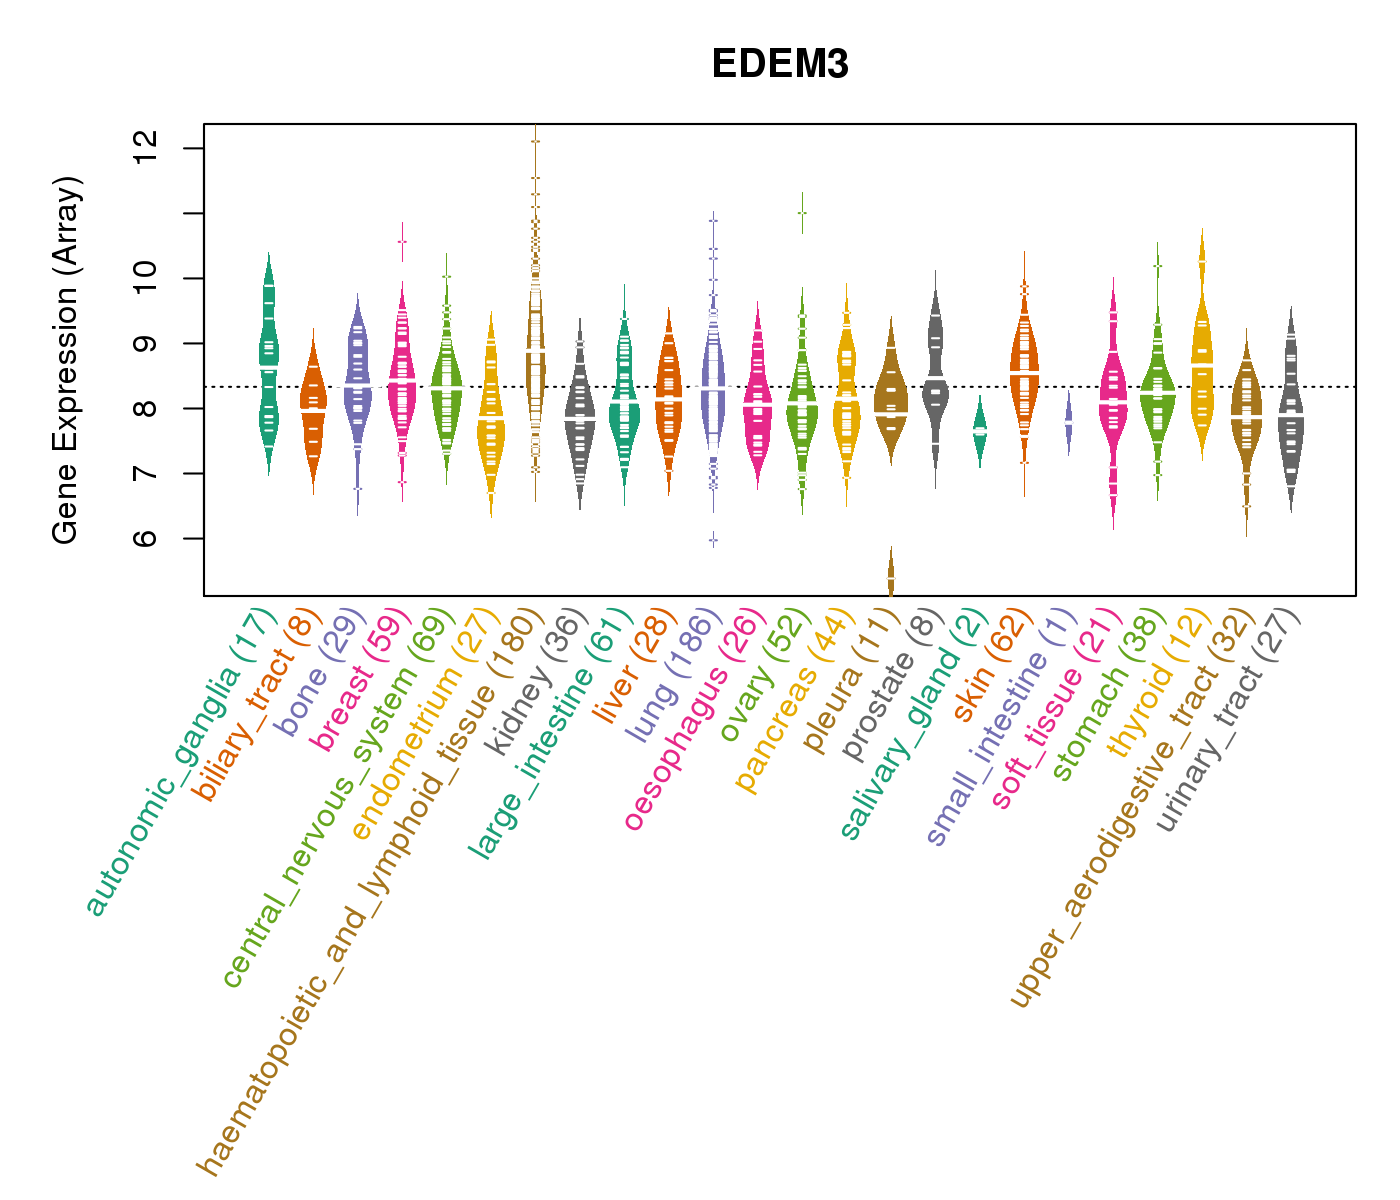
| Gene Expression for EDEM3 |
| * CCLE gene expression data were extracted from CCLE_Expression_Entrez_2012-10-18.res: Gene-centric RMA-normalized mRNA expression data. |
 |
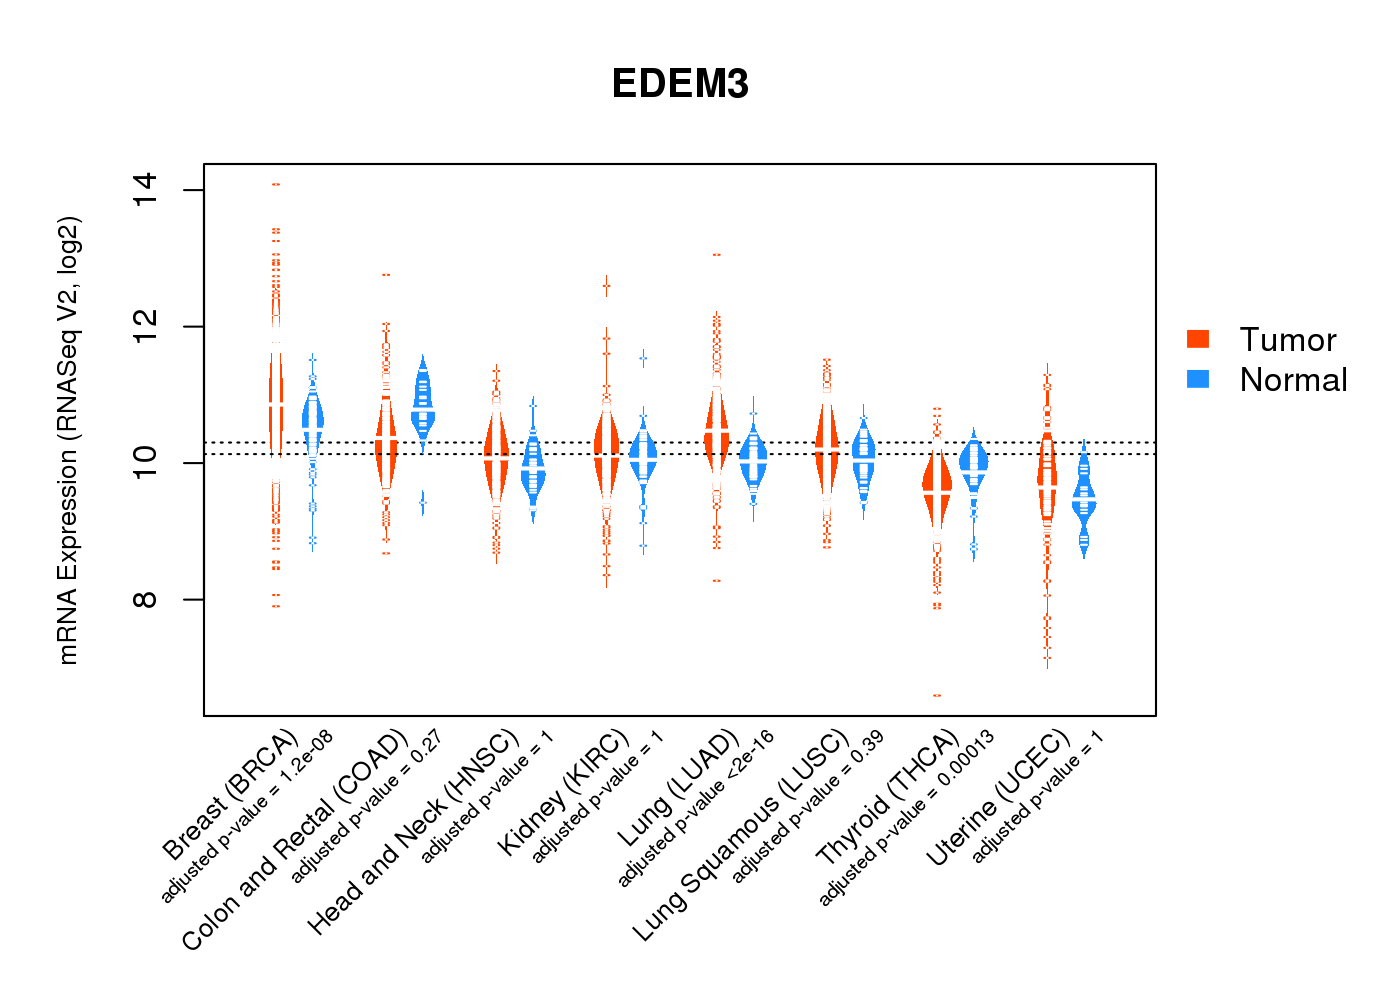
| * Normalized gene expression data of RNASeqV2 was extracted from TCGA using R package TCGA-Assembler. The URLs of all public data files on TCGA DCC data server were gathered at Jan-05-2015. Only eight cancer types have enough normal control samples for differential expression analysis. (t test, adjusted p<0.05 (using Benjamini-Hochberg FDR)) |
 |
| Top |
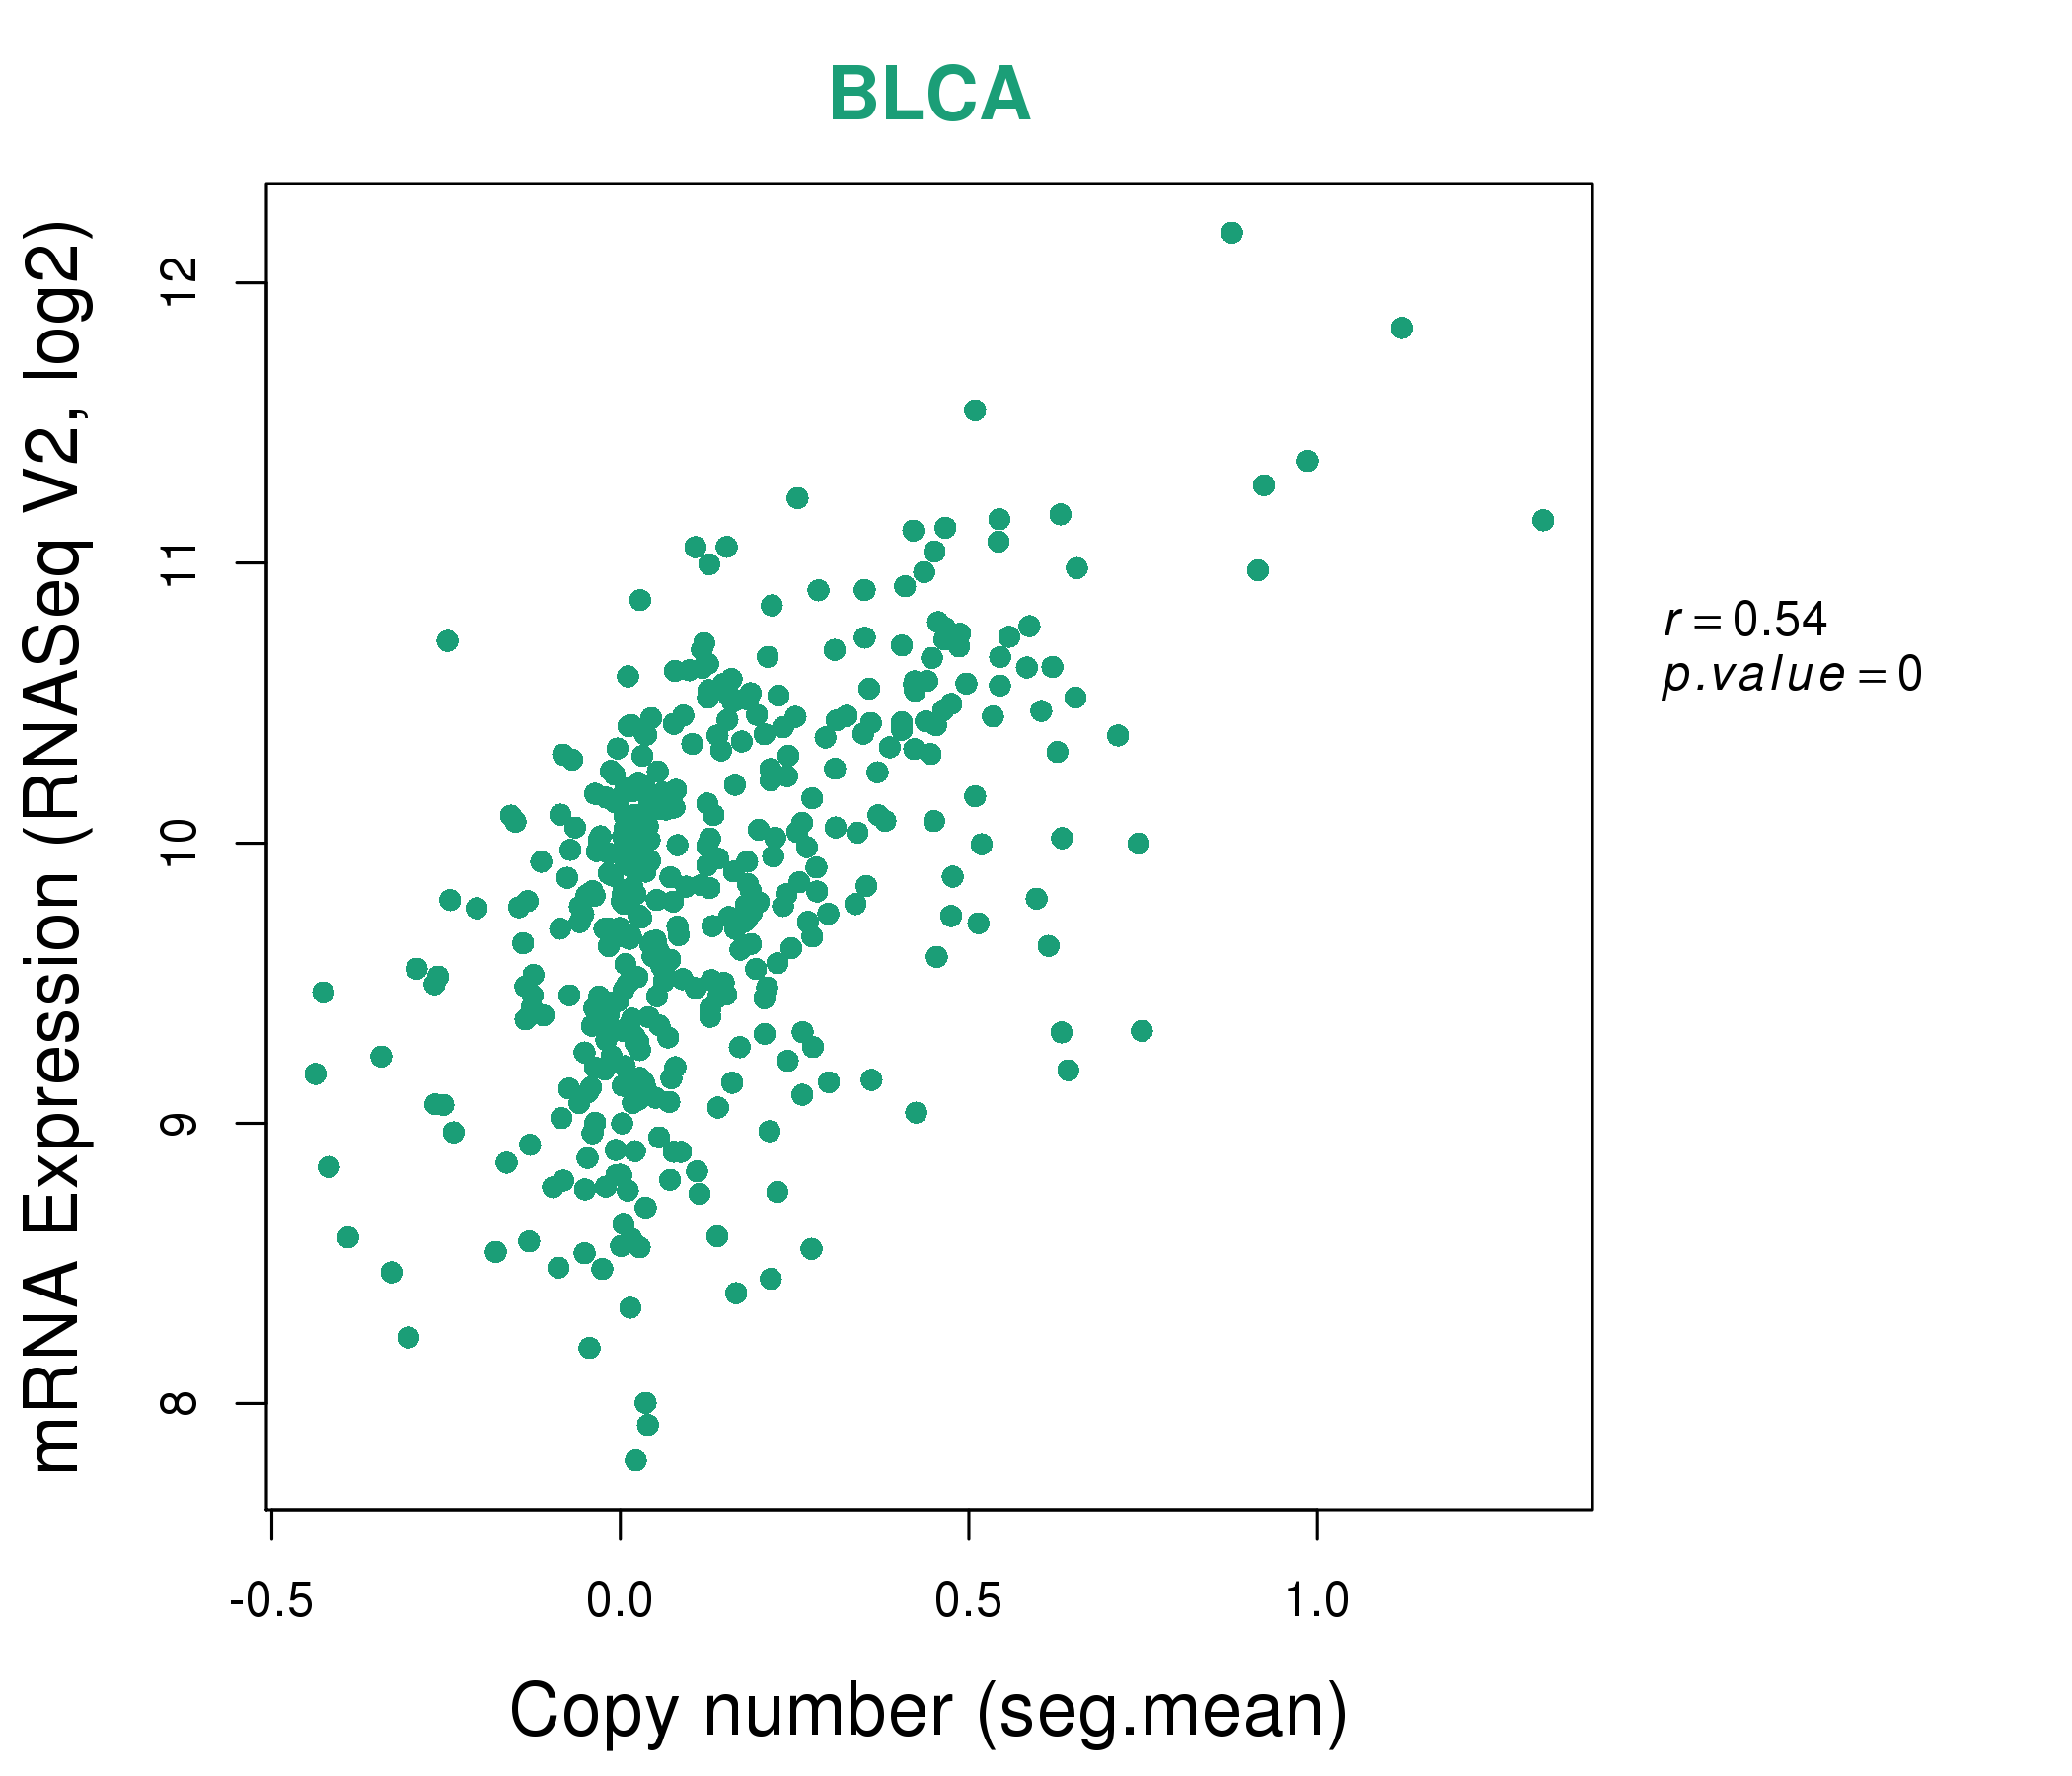
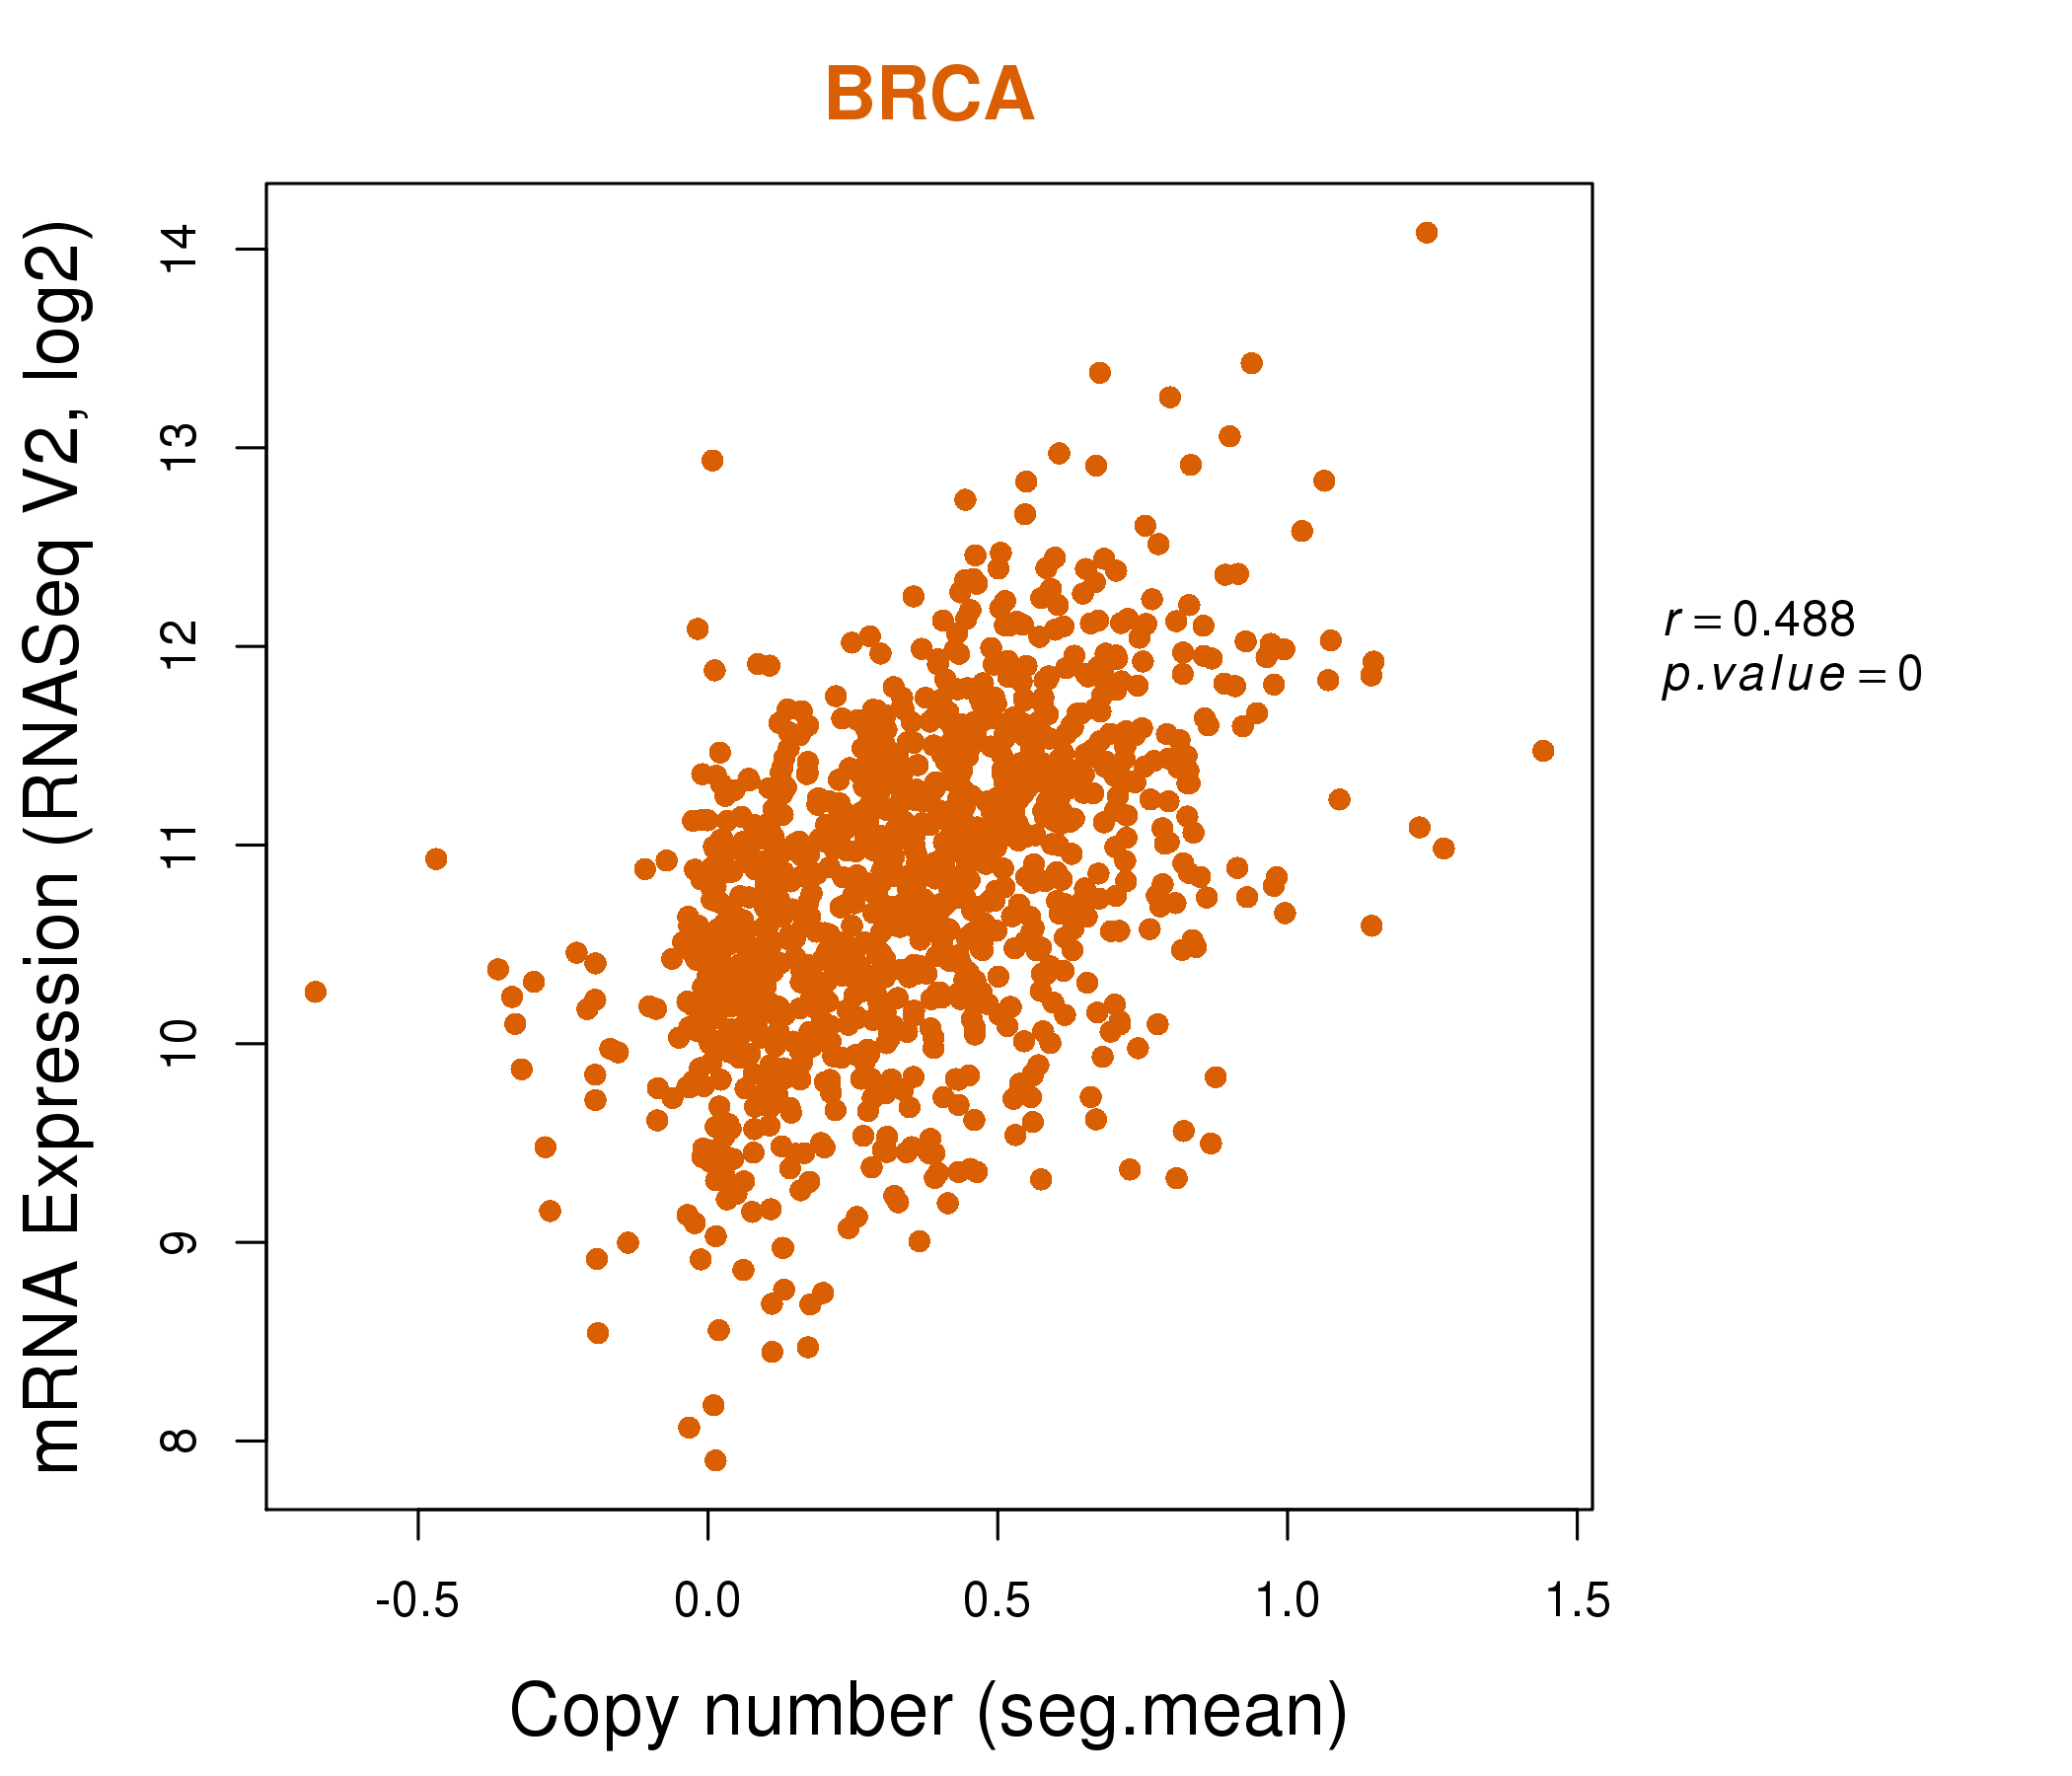
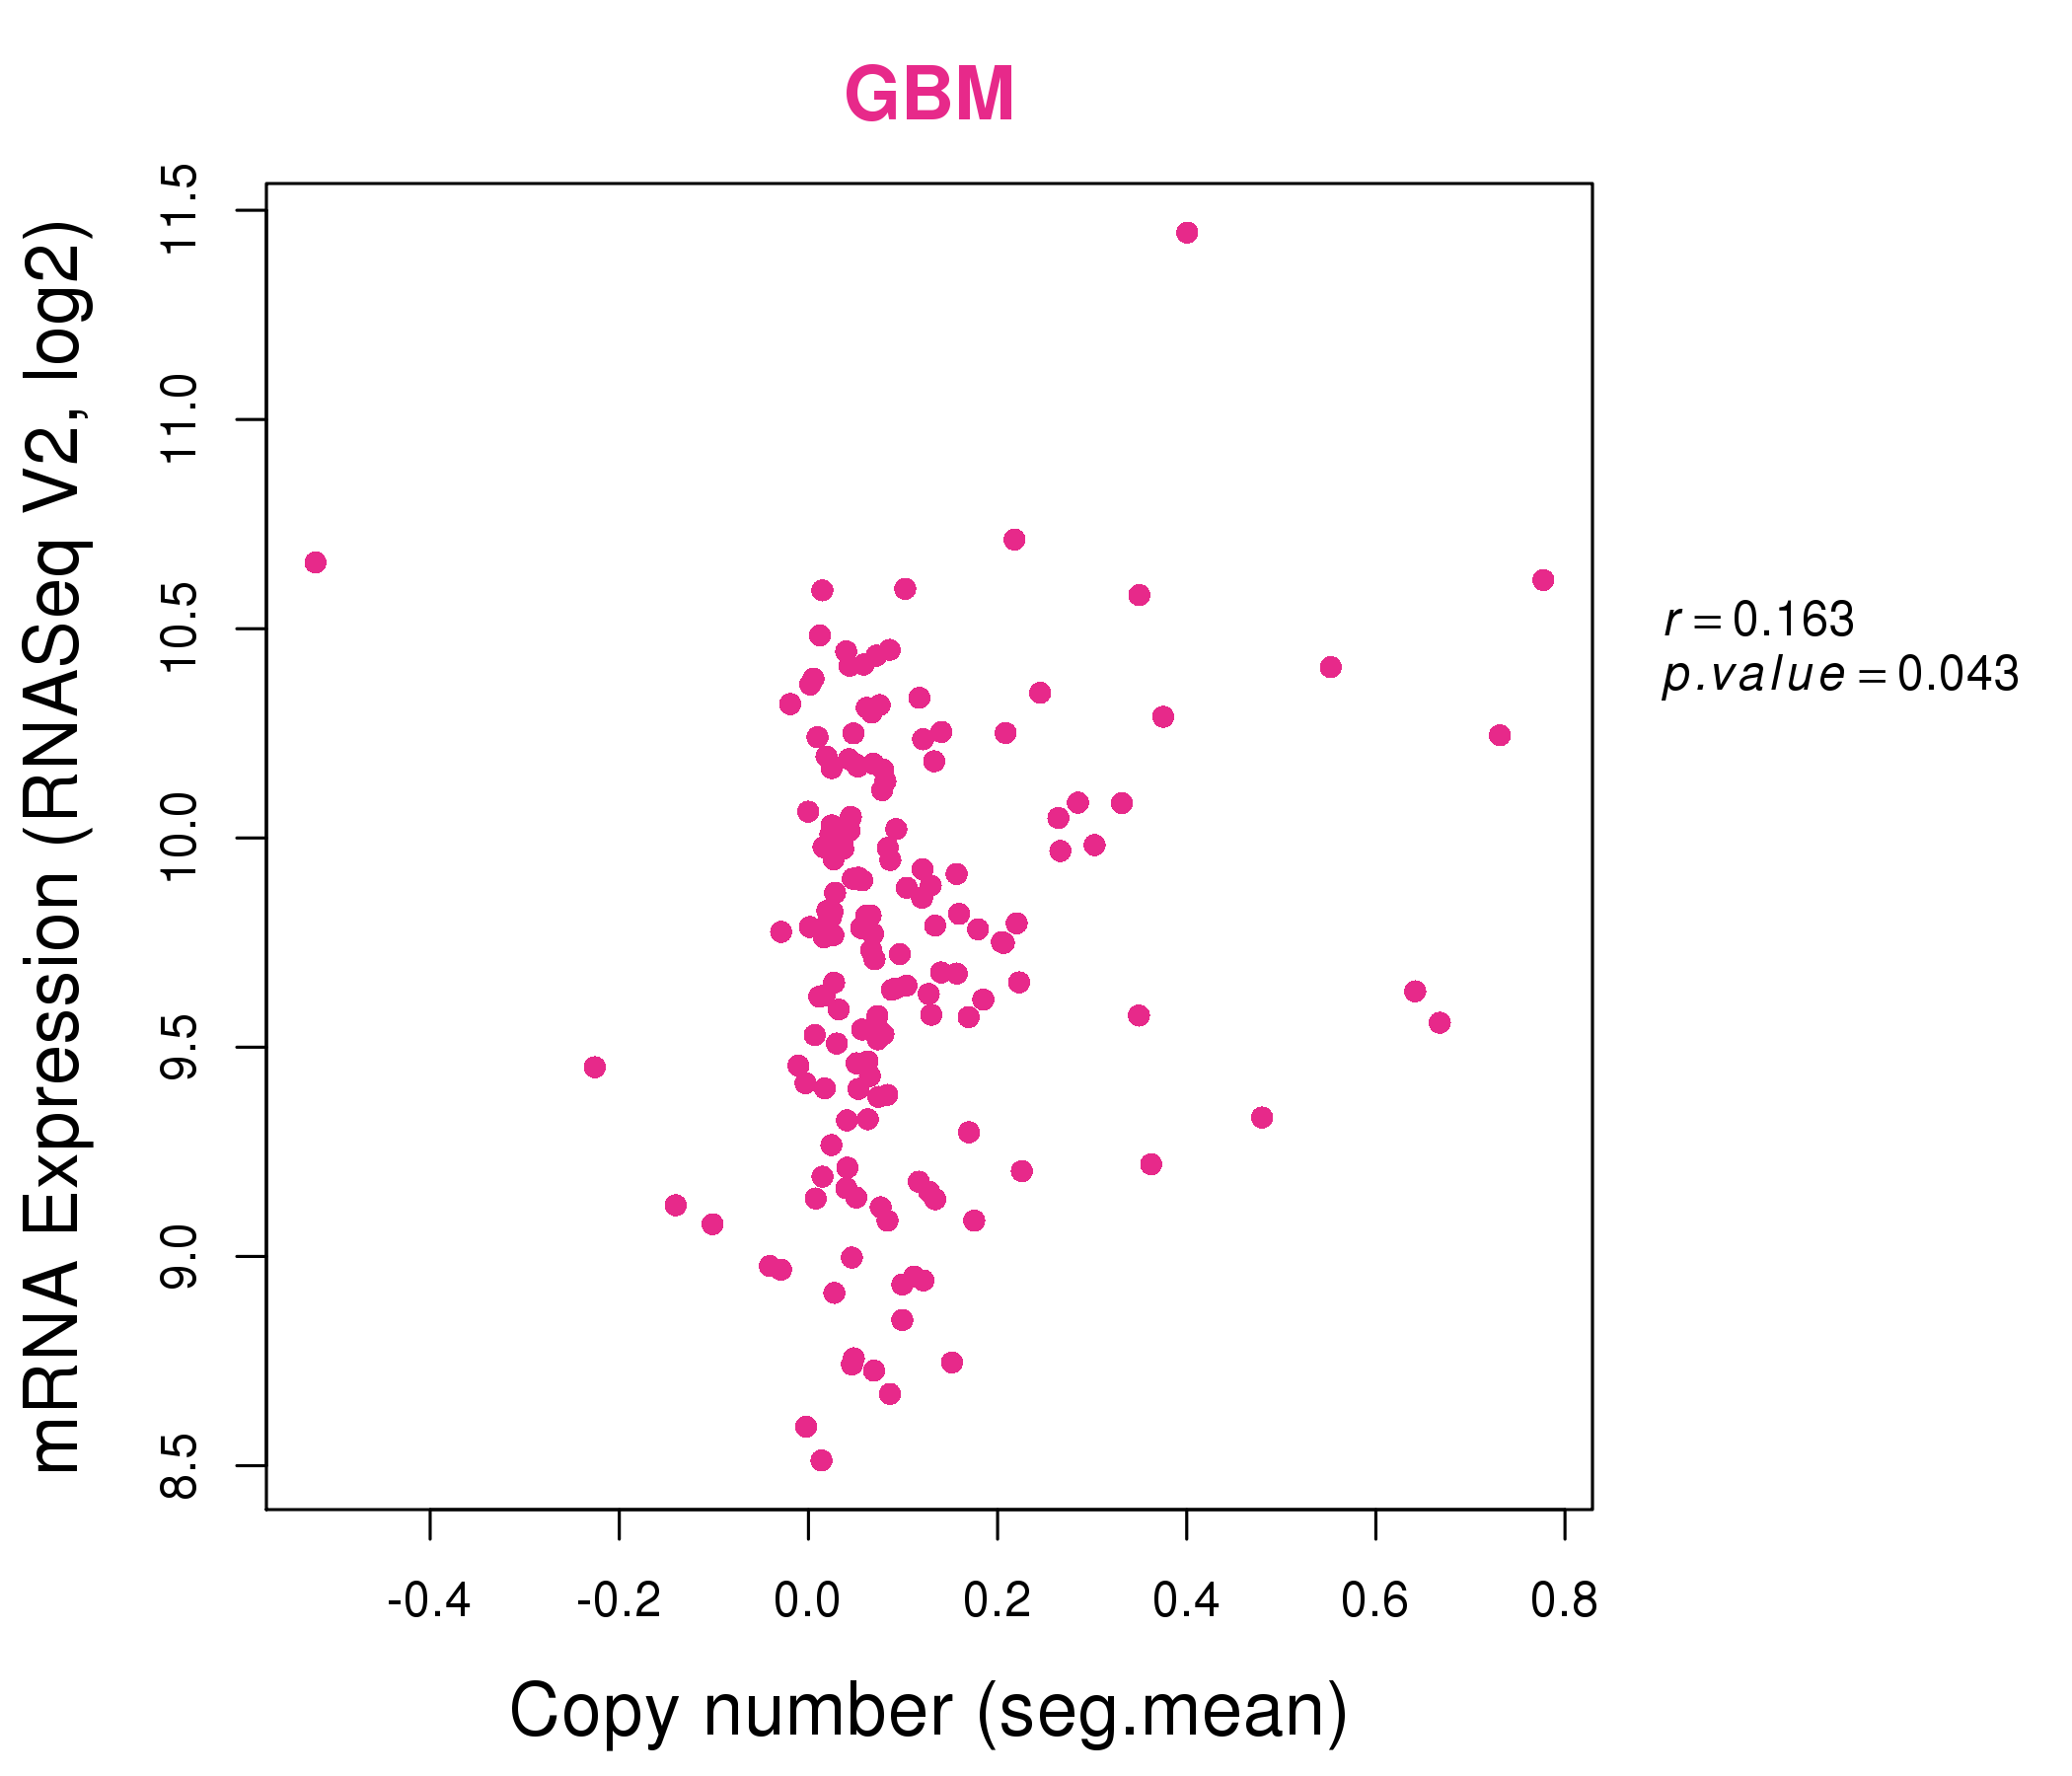
| * This plots show the correlation between CNV and gene expression. |
: Open all plots for all cancer types
 |
|
 |
|
| Top |
| Gene-Gene Network Information |
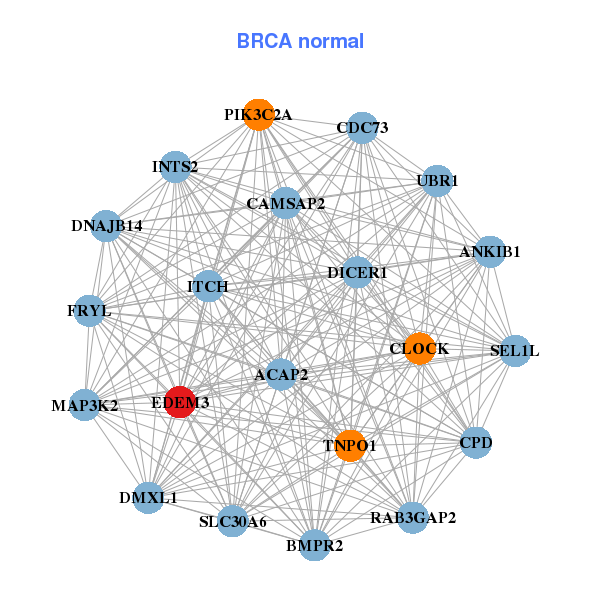
| * Co-Expression network figures were drawn using R package igraph. Only the top 20 genes with the highest correlations were shown. Red circle: input gene, orange circle: cell metabolism gene, sky circle: other gene |
: Open all plots for all cancer types
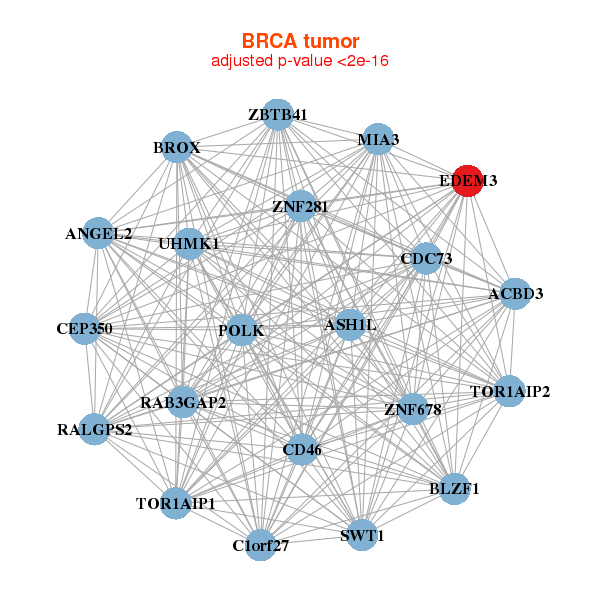 |
|
| ACBD3,ANGEL2,ASH1L,BLZF1,SWT1,C1orf27,BROX, CD46,CDC73,CEP350,EDEM3,MIA3,POLK,RAB3GAP2, RALGPS2,TOR1AIP1,TOR1AIP2,UHMK1,ZBTB41,ZNF281,ZNF678 | ACAP2,ANKIB1,BMPR2,CAMSAP2,CDC73,CLOCK,CPD, DICER1,DMXL1,DNAJB14,EDEM3,FRYL,INTS2,ITCH, MAP3K2,PIK3C2A,RAB3GAP2,SEL1L,SLC30A6,TNPO1,UBR1 |
 |
|
| ACBD3,ARNT,ATF6,BLZF1,CEP350,COPA,EDEM3, EGLN1,F11R,FAM177B,FAM20B,FBXO28,GNAQ,GOLPH3L, KCTD3,KDM5B,MIA3,RNASEL,TM9SF3,UAP1,WDR26 | APAF1,ARFGEF2,ATP11B,CFTR,DOPEY2,EDEM3,FAM102B, FGD4,FNBP1L,FRYL,GALNT3,KIAA1468,KIAA1598,MCTP2, MYO5C,PAWR,SATB2,SLC9A2,TM9SF3,TOX3,UTP14C |

| * Co-Expression network figures were drawn using R package igraph. Only the top 20 genes with the highest correlations were shown. Red circle: input gene, orange circle: cell metabolism gene, sky circle: other gene |
: Open all plots for all cancer types
| Top |
: Open all interacting genes' information including KEGG pathway for all interacting genes from DAVID
| Top |
| Pharmacological Information for EDEM3 |
| There's no related Drug. |
| Top |
| Cross referenced IDs for EDEM3 |
| * We obtained these cross-references from Uniprot database. It covers 150 different DBs, 18 categories. http://www.uniprot.org/help/cross_references_section |
: Open all cross reference information
|
Copyright © 2016-Present - The Univsersity of Texas Health Science Center at Houston @ |