|
||||||||||||||||||||
| |
| Phenotypic Information (metabolism pathway, cancer, disease, phenome) |
| |
| |
| Gene-Gene Network Information: Co-Expression Network, Interacting Genes & KEGG |
| |
|


| Gene Summary for HSD3B7 |
| Basic gene info. | Gene symbol | HSD3B7 |
| Gene name | hydroxy-delta-5-steroid dehydrogenase, 3 beta- and steroid delta-isomerase 7 | |
| Synonyms | CBAS1|PFIC4|SDR11E3 | |
| Cytomap | UCSC genome browser: 16p11.2 | |
| Genomic location | chr16 :30996518-31000473 | |
| Type of gene | protein-coding | |
| RefGenes | NM_001142777.1, NM_001142778.1,NM_025193.3, | |
| Ensembl id | ENSG00000099377 | |
| Description | 3 beta-hydroxy-delta 5-C27-steroid oxidoreductase3 beta-hydroxysteroid dehydrogenase type 73 beta-hydroxysteroid dehydrogenase type VII3-beta-HSD VII3-beta-hydroxy-Delta(5)-C27 steroid oxidoreductaseC(27)-3BETA-HSDc(27) 3-beta-HSDcholest-5-ene-3-be | |
| Modification date | 20141207 | |
| dbXrefs | MIM : 607764 | |
| HGNC : HGNC | ||
| Ensembl : ENSG00000099377 | ||
| HPRD : 09680 | ||
| Vega : OTTHUMG00000132417 | ||
| Protein | UniProt: go to UniProt's Cross Reference DB Table | |
| Expression | CleanEX: HS_HSD3B7 | |
| BioGPS: 80270 | ||
| Gene Expression Atlas: ENSG00000099377 | ||
| The Human Protein Atlas: ENSG00000099377 | ||
| Pathway | NCI Pathway Interaction Database: HSD3B7 | |
| KEGG: HSD3B7 | ||
| REACTOME: HSD3B7 | ||
| ConsensusPathDB | ||
| Pathway Commons: HSD3B7 | ||
| Metabolism | MetaCyc: HSD3B7 | |
| HUMANCyc: HSD3B7 | ||
| Regulation | Ensembl's Regulation: ENSG00000099377 | |
| miRBase: chr16 :30,996,518-31,000,473 | ||
| TargetScan: NM_001142777 | ||
| cisRED: ENSG00000099377 | ||
| Context | iHOP: HSD3B7 | |
| cancer metabolism search in PubMed: HSD3B7 | ||
| UCL Cancer Institute: HSD3B7 | ||
| Assigned class in ccmGDB | C | |
| Top |
| Phenotypic Information for HSD3B7(metabolism pathway, cancer, disease, phenome) |
| Cancer | CGAP: HSD3B7 |
| Familial Cancer Database: HSD3B7 | |
| * This gene is included in those cancer gene databases. |
|
|
|
|
|
| . | ||||||||||||||
Oncogene 1 | Significant driver gene in | |||||||||||||||||||
| cf) number; DB name 1 Oncogene; http://nar.oxfordjournals.org/content/35/suppl_1/D721.long, 2 Tumor Suppressor gene; https://bioinfo.uth.edu/TSGene/, 3 Cancer Gene Census; http://www.nature.com/nrc/journal/v4/n3/abs/nrc1299.html, 4 CancerGenes; http://nar.oxfordjournals.org/content/35/suppl_1/D721.long, 5 Network of Cancer Gene; http://ncg.kcl.ac.uk/index.php, 1Therapeutic Vulnerabilities in Cancer; http://cbio.mskcc.org/cancergenomics/statius/ |
| REACTOME_METABOLISM_OF_LIPIDS_AND_LIPOPROTEINS | |
| OMIM | |
| Orphanet | |
| Disease | KEGG Disease: HSD3B7 |
| MedGen: HSD3B7 (Human Medical Genetics with Condition) | |
| ClinVar: HSD3B7 | |
| Phenotype | MGI: HSD3B7 (International Mouse Phenotyping Consortium) |
| PhenomicDB: HSD3B7 | |
| Mutations for HSD3B7 |
| * Under tables are showing count per each tissue to give us broad intuition about tissue specific mutation patterns.You can go to the detailed page for each mutation database's web site. |
| There's no structural variation information in COSMIC data for this gene. |
| * From mRNA Sanger sequences, Chitars2.0 arranged chimeric transcripts. This table shows HSD3B7 related fusion information. |
| ID | Head Gene | Tail Gene | Accession | Gene_a | qStart_a | qEnd_a | Chromosome_a | tStart_a | tEnd_a | Gene_a | qStart_a | qEnd_a | Chromosome_a | tStart_a | tEnd_a |
| Top |
| There's no copy number variation information in COSMIC data for this gene. |
| Top |
|
 |
| Top |
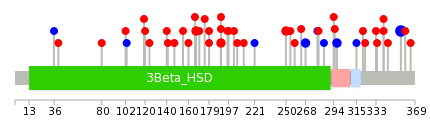
| Stat. for Non-Synonymous SNVs (# total SNVs=23) | (# total SNVs=11) |
 |  |
(# total SNVs=0) | (# total SNVs=0) |
| Top |
| * When you move the cursor on each content, you can see more deailed mutation information on the Tooltip. Those are primary_site,primary_histology,mutation(aa),pubmedID. |
| GRCh37 position | Mutation(aa) | Unique sampleID count |
| chr16:30999462-30999462 | p.R356R | 6 |
| chr16:30998198-30998198 | p.R190L | 3 |
| chr16:30999198-30999198 | p.Y268Y | 2 |
| chr16:30999232-30999232 | p.G280* | 2 |
| chr16:30997993-30997993 | p.E167K | 2 |
| chr16:30999285-30999285 | p.F297F | 2 |
| chr16:30999142-30999142 | p.T250A | 2 |
| chr16:30999155-30999155 | p.G254D | 1 |
| chr16:30999355-30999355 | p.P321S | 1 |
| chr16:30997791-30997791 | p.L124M | 1 |
| Top |
|
 |
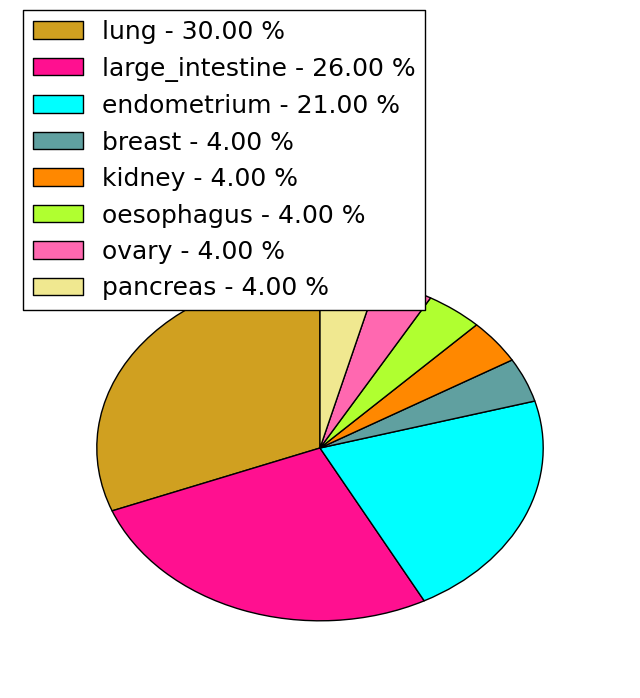
| Point Mutation/ Tissue ID | 1 | 2 | 3 | 4 | 5 | 6 | 7 | 8 | 9 | 10 | 11 | 12 | 13 | 14 | 15 | 16 | 17 | 18 | 19 | 20 |
| # sample | 1 | 1 | 5 | 1 | 3 | 1 | 5 | 5 | 1 | 6 | ||||||||||
| # mutation | 1 | 1 | 5 | 1 | 3 | 1 | 4 | 5 | 1 | 6 | ||||||||||
| nonsynonymous SNV | 1 | 4 | 3 | 1 | 3 | 4 | 1 | 5 | ||||||||||||
| synonymous SNV | 1 | 1 | 1 | 1 | 1 | 1 |
| cf) Tissue ID; Tissue type (1; BLCA[Bladder Urothelial Carcinoma], 2; BRCA[Breast invasive carcinoma], 3; CESC[Cervical squamous cell carcinoma and endocervical adenocarcinoma], 4; COAD[Colon adenocarcinoma], 5; GBM[Glioblastoma multiforme], 6; Glioma Low Grade, 7; HNSC[Head and Neck squamous cell carcinoma], 8; KICH[Kidney Chromophobe], 9; KIRC[Kidney renal clear cell carcinoma], 10; KIRP[Kidney renal papillary cell carcinoma], 11; LAML[Acute Myeloid Leukemia], 12; LUAD[Lung adenocarcinoma], 13; LUSC[Lung squamous cell carcinoma], 14; OV[Ovarian serous cystadenocarcinoma ], 15; PAAD[Pancreatic adenocarcinoma], 16; PRAD[Prostate adenocarcinoma], 17; SKCM[Skin Cutaneous Melanoma], 18:STAD[Stomach adenocarcinoma], 19:THCA[Thyroid carcinoma], 20:UCEC[Uterine Corpus Endometrial Carcinoma]) |
| Top |
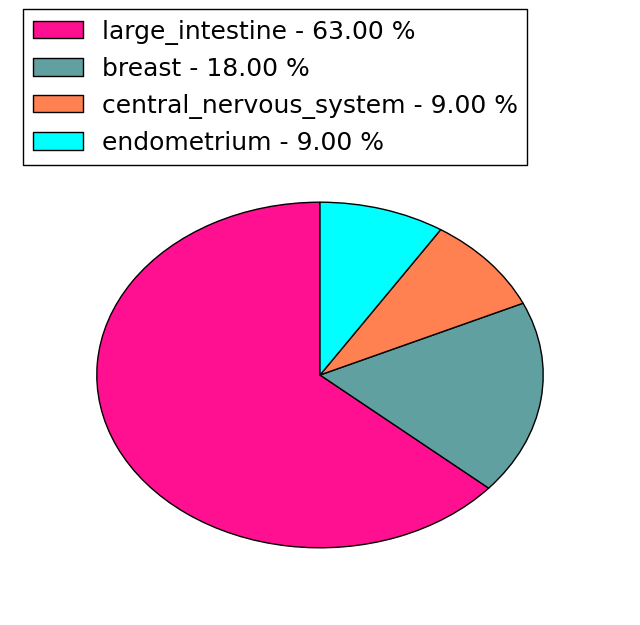
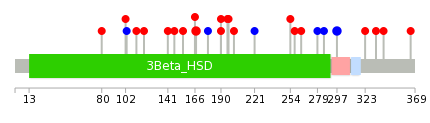
| * We represented just top 10 SNVs. When you move the cursor on each content, you can see more deailed mutation information on the Tooltip. Those are primary_site, primary_histology, mutation(aa), pubmedID. |
| Genomic Position | Mutation(aa) | Unique sampleID count |
| chr16:30997993 | p.E167K,HSD3B7 | 2 |
| chr16:30999285 | p.F297F | 2 |
| chr16:30997959 | p.V333I | 1 |
| chr16:30999168 | p.A166T,HSD3B7 | 1 |
| chr16:30997990 | p.R340C | 1 |
| chr16:30999184 | p.T365M | 1 |
| chr16:30999231 | p.V178V | 1 |
| chr16:30998163 | p.R190C | 1 |
| chr16:30999249 | p.R190H | 1 |
| chr16:30997441 | p.G196V | 1 |
| * Copy number data were extracted from TCGA using R package TCGA-Assembler. The URLs of all public data files on TCGA DCC data server were gathered on Jan-05-2015. Function ProcessCNAData in TCGA-Assembler package was used to obtain gene-level copy number value which is calculated as the average copy number of the genomic region of a gene. |
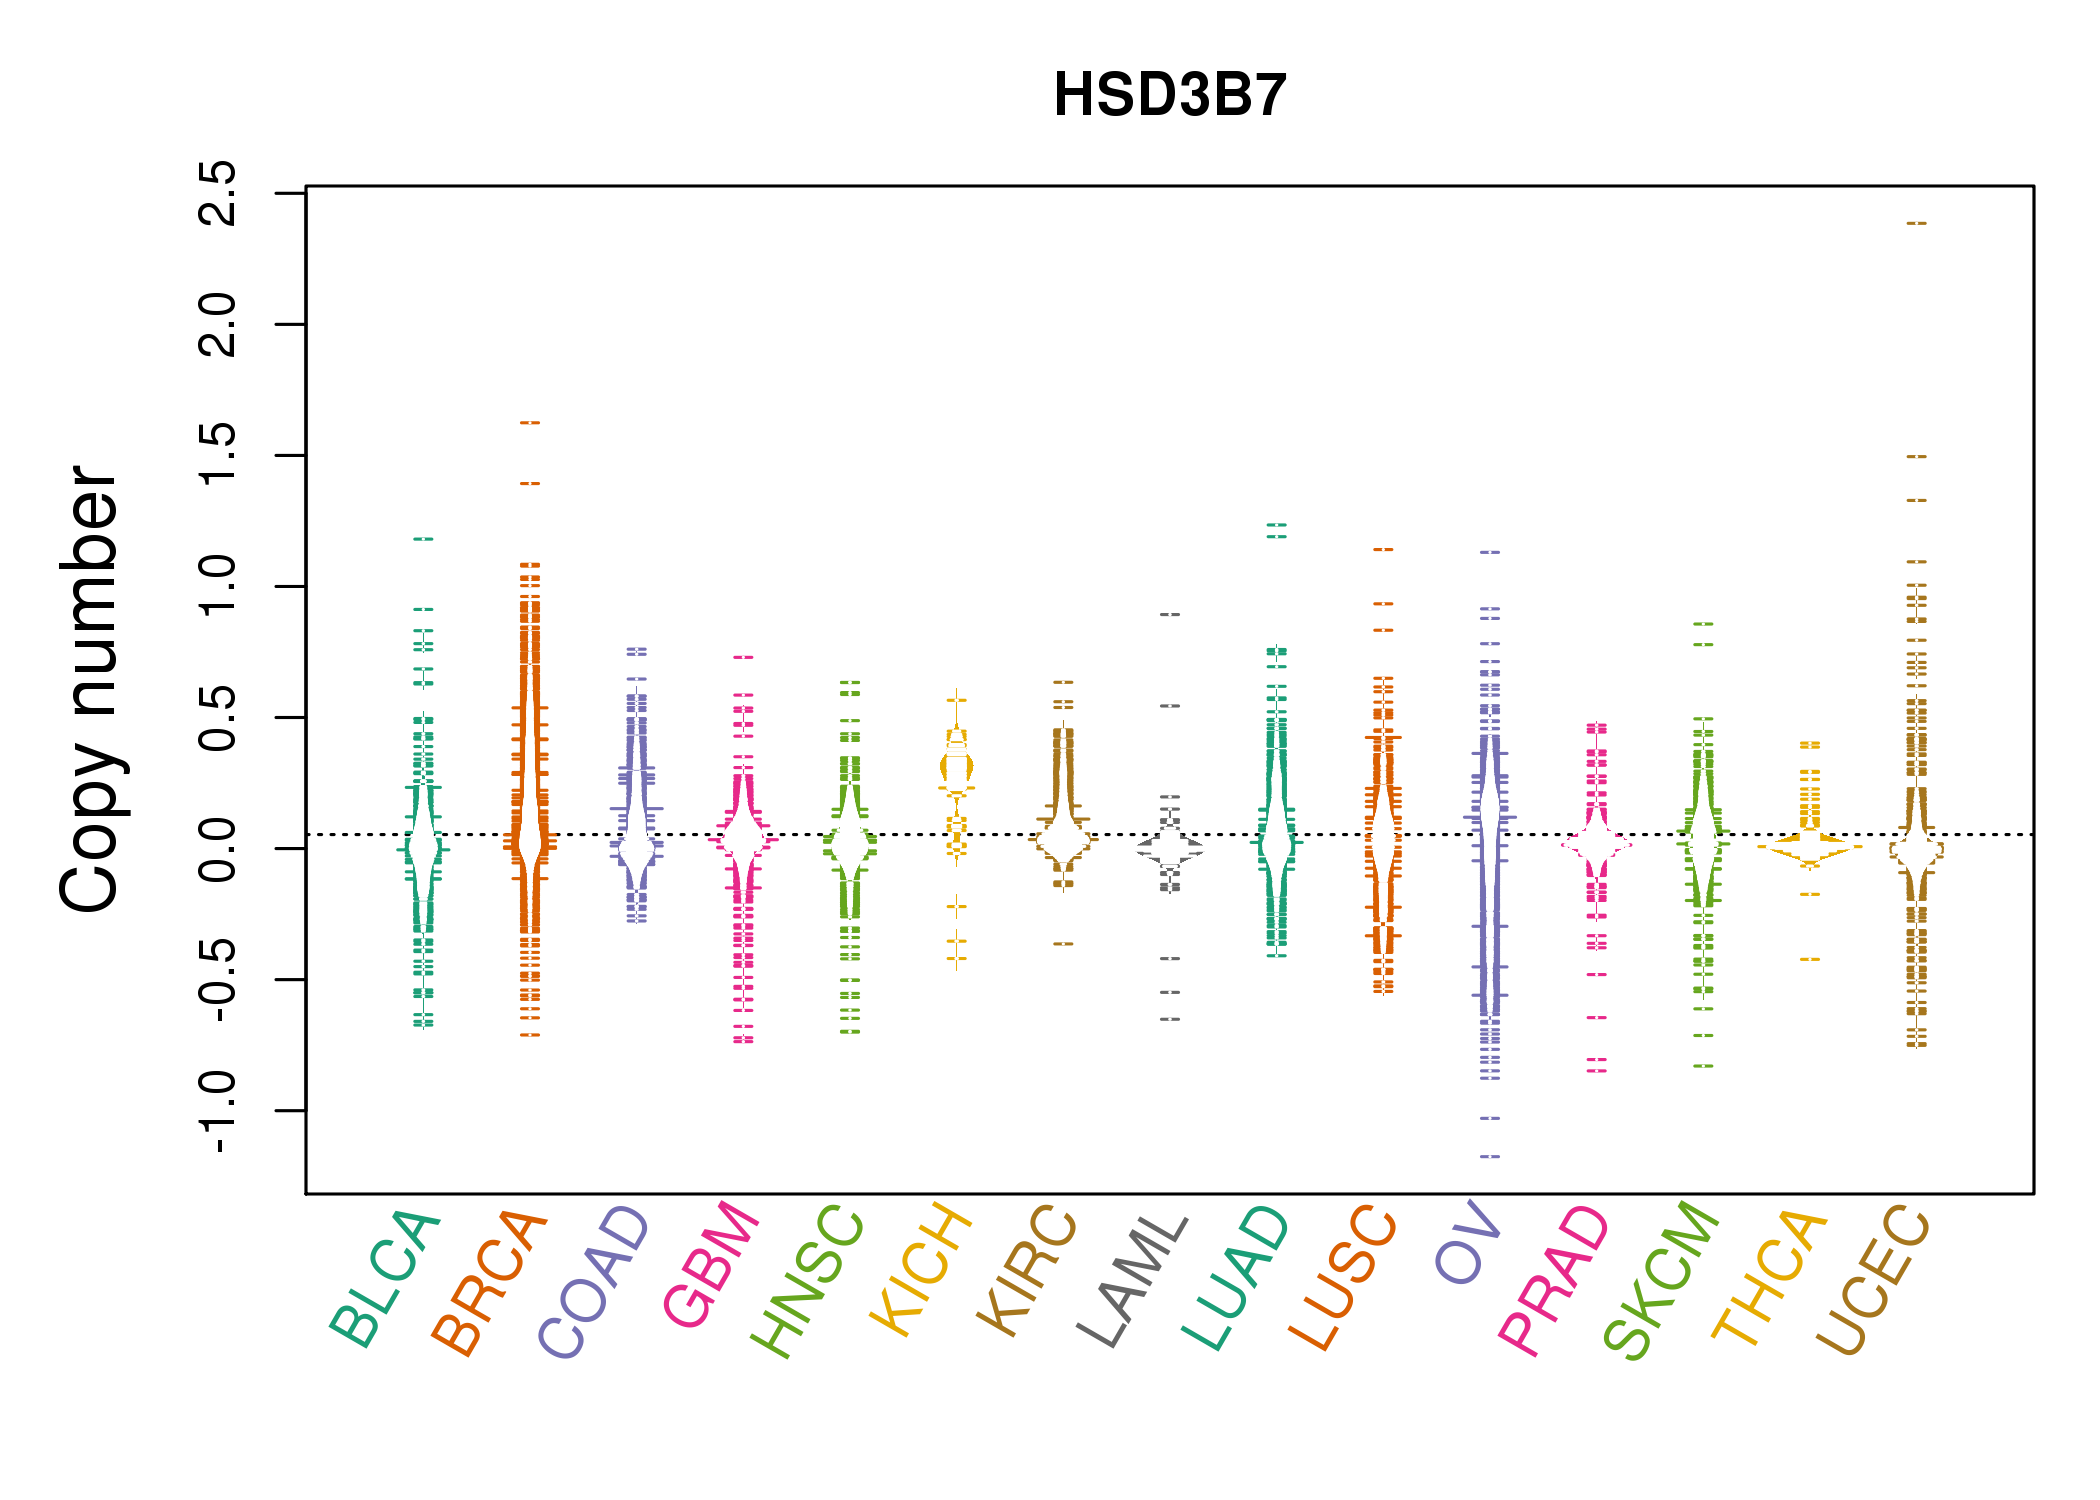 |
| cf) Tissue ID[Tissue type]: BLCA[Bladder Urothelial Carcinoma], BRCA[Breast invasive carcinoma], CESC[Cervical squamous cell carcinoma and endocervical adenocarcinoma], COAD[Colon adenocarcinoma], GBM[Glioblastoma multiforme], Glioma Low Grade, HNSC[Head and Neck squamous cell carcinoma], KICH[Kidney Chromophobe], KIRC[Kidney renal clear cell carcinoma], KIRP[Kidney renal papillary cell carcinoma], LAML[Acute Myeloid Leukemia], LUAD[Lung adenocarcinoma], LUSC[Lung squamous cell carcinoma], OV[Ovarian serous cystadenocarcinoma ], PAAD[Pancreatic adenocarcinoma], PRAD[Prostate adenocarcinoma], SKCM[Skin Cutaneous Melanoma], STAD[Stomach adenocarcinoma], THCA[Thyroid carcinoma], UCEC[Uterine Corpus Endometrial Carcinoma] |
| Top |
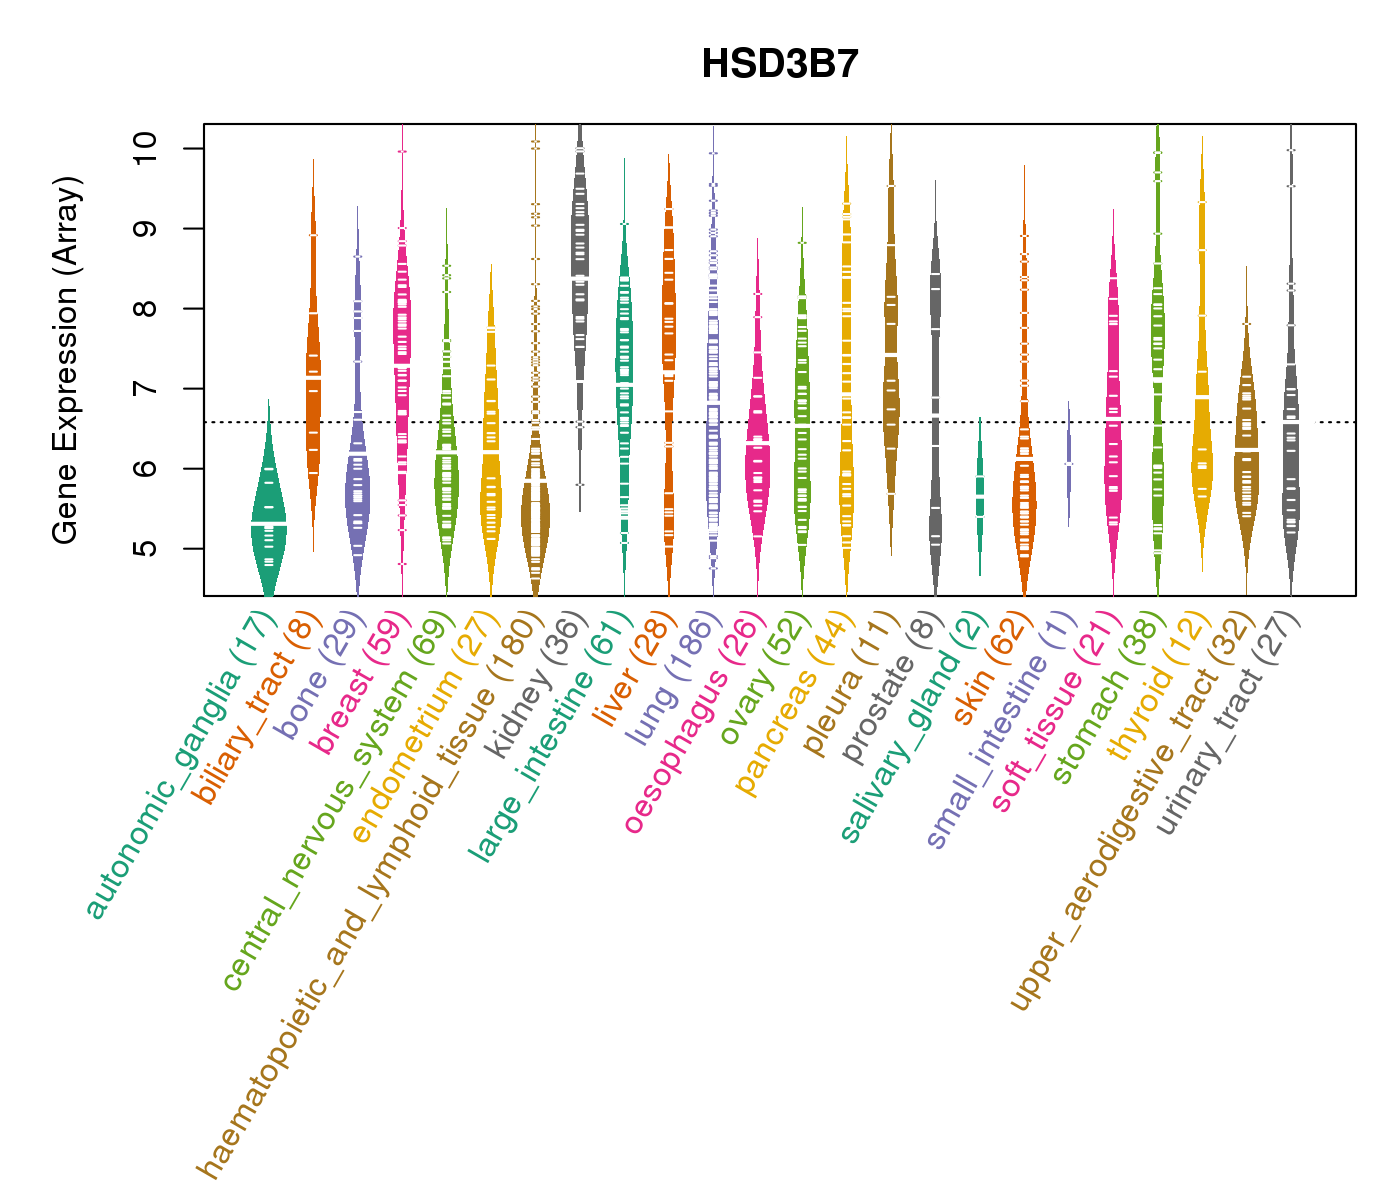
| Gene Expression for HSD3B7 |
| * CCLE gene expression data were extracted from CCLE_Expression_Entrez_2012-10-18.res: Gene-centric RMA-normalized mRNA expression data. |
 |
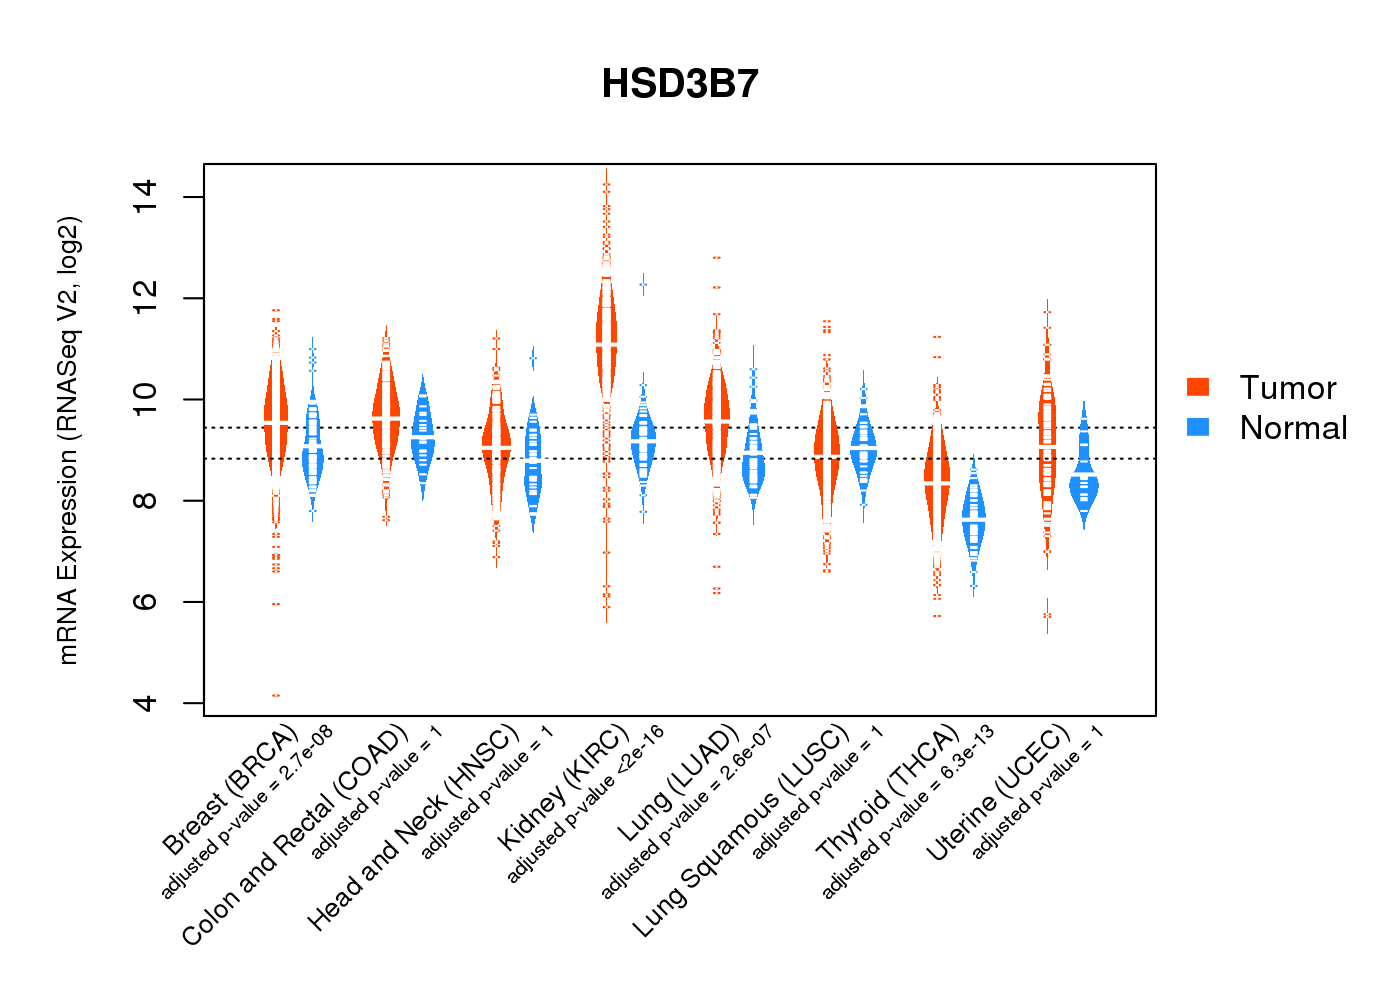
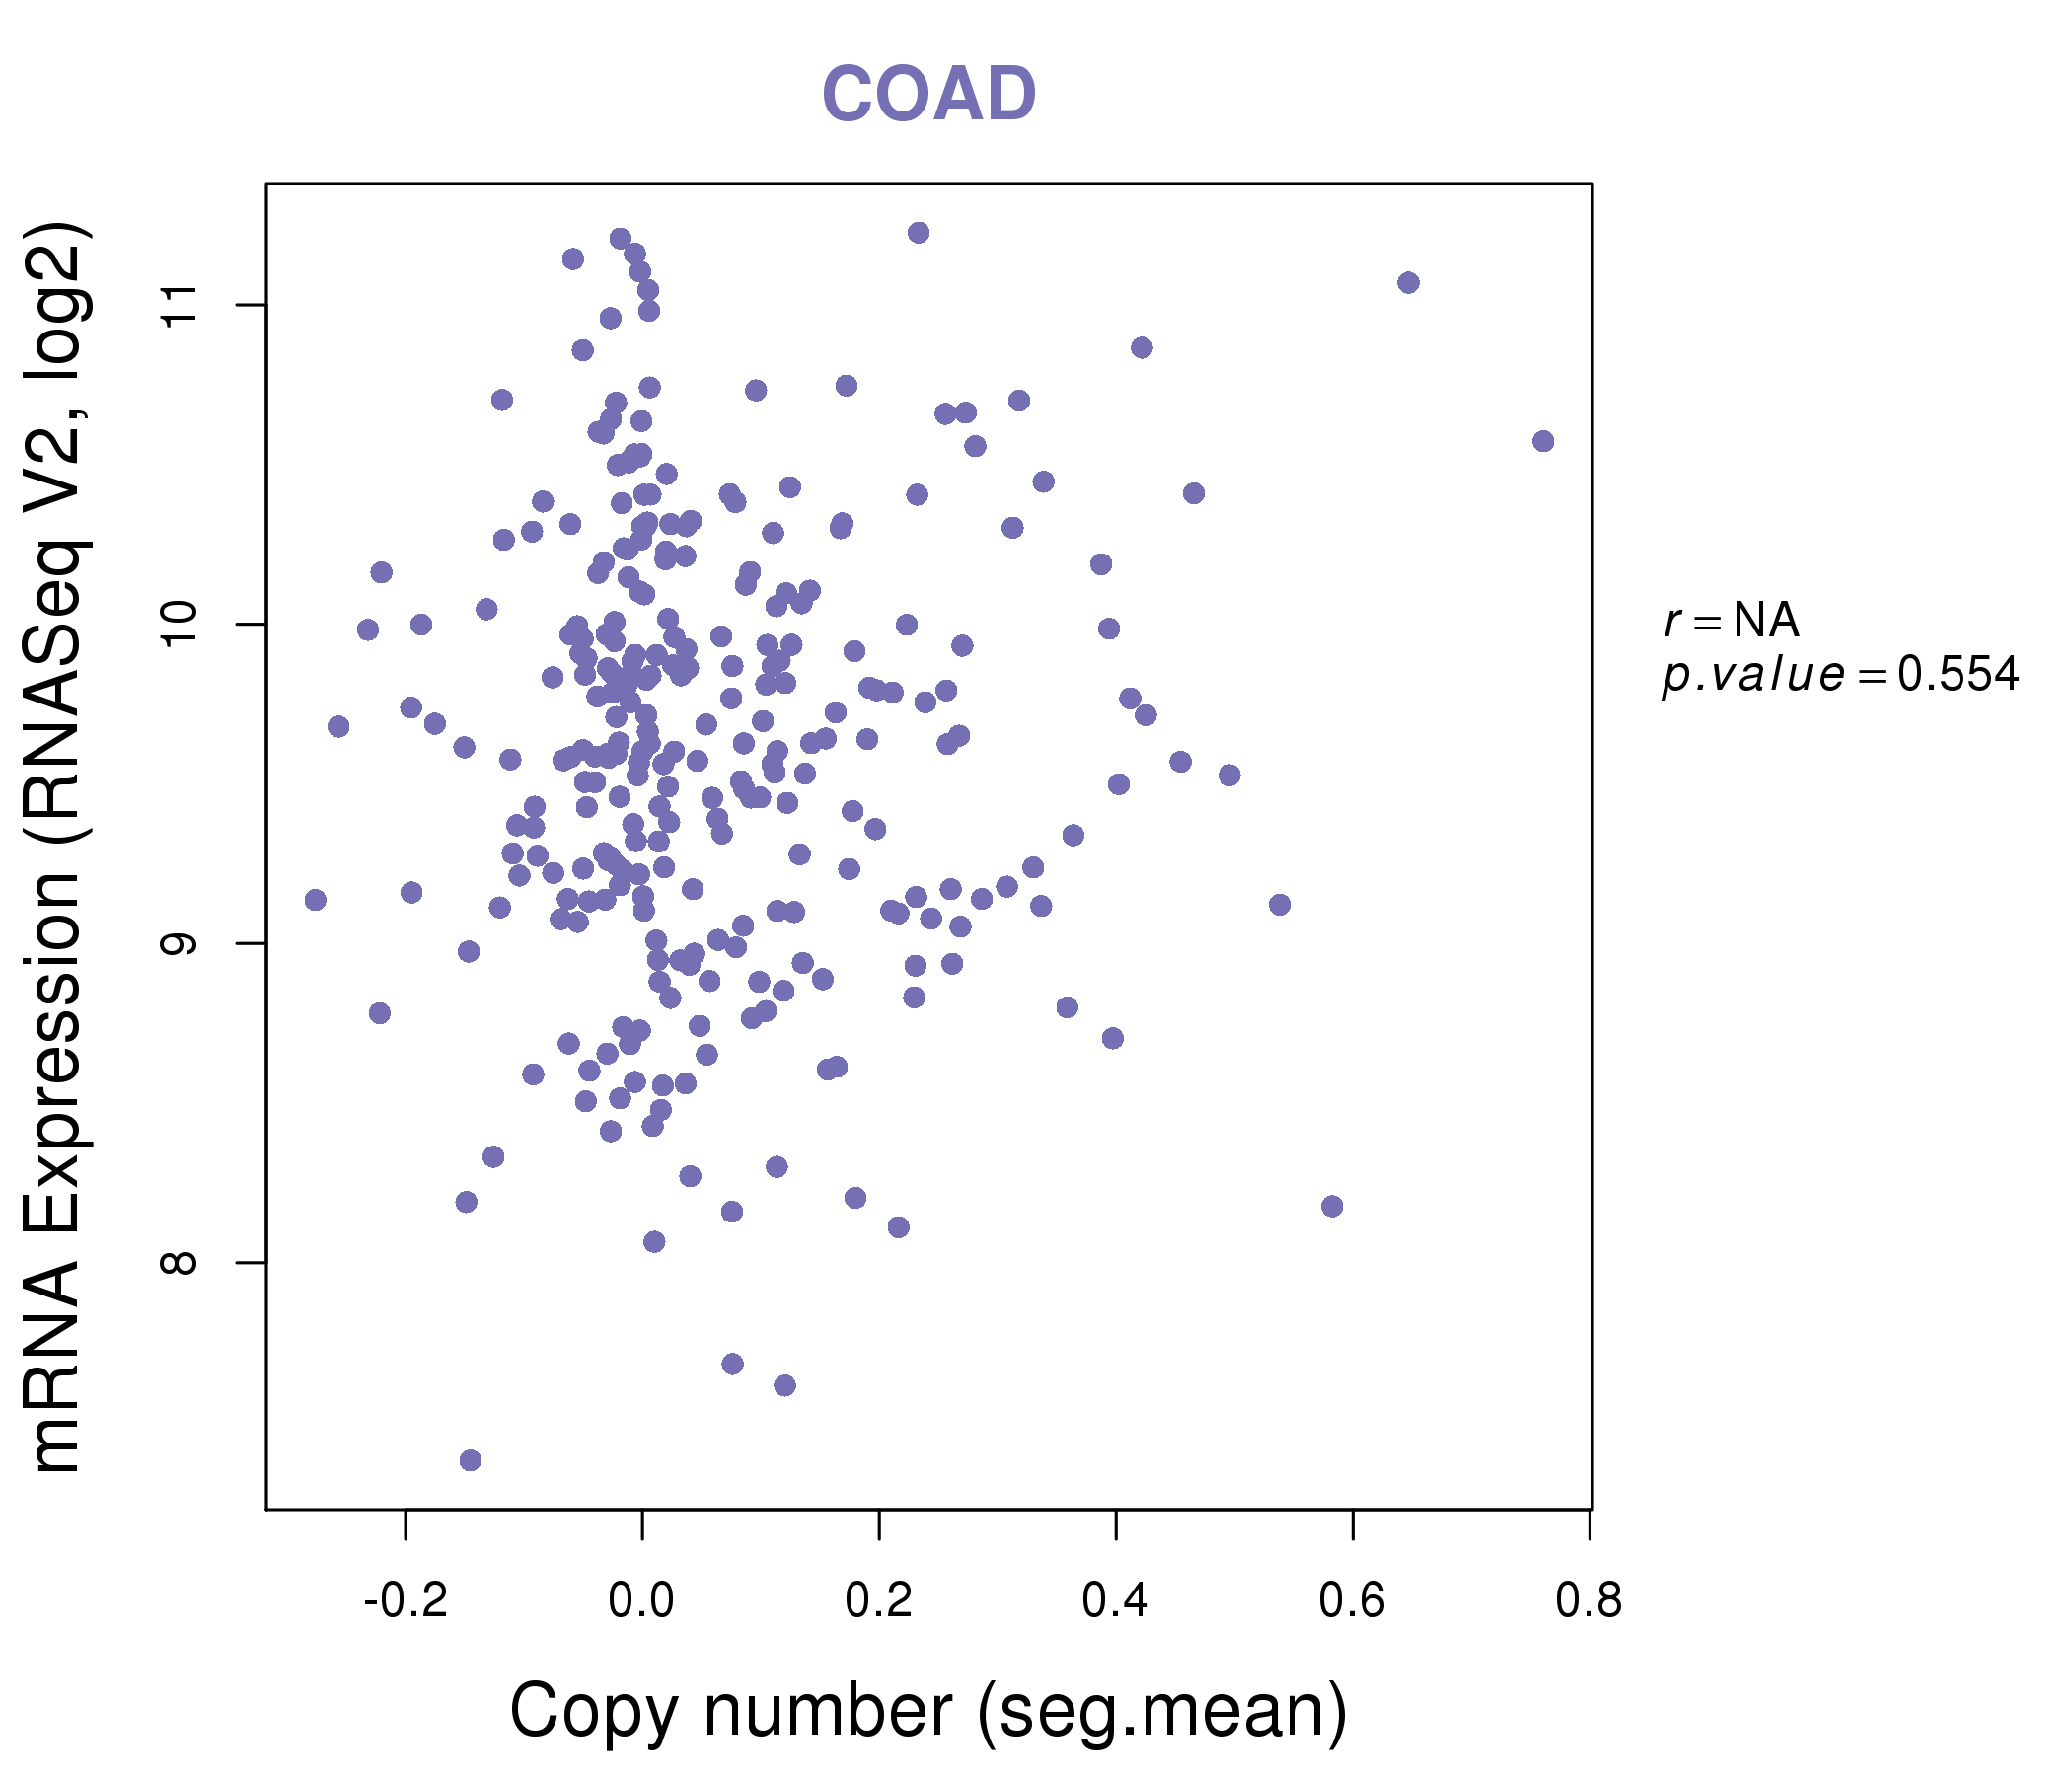
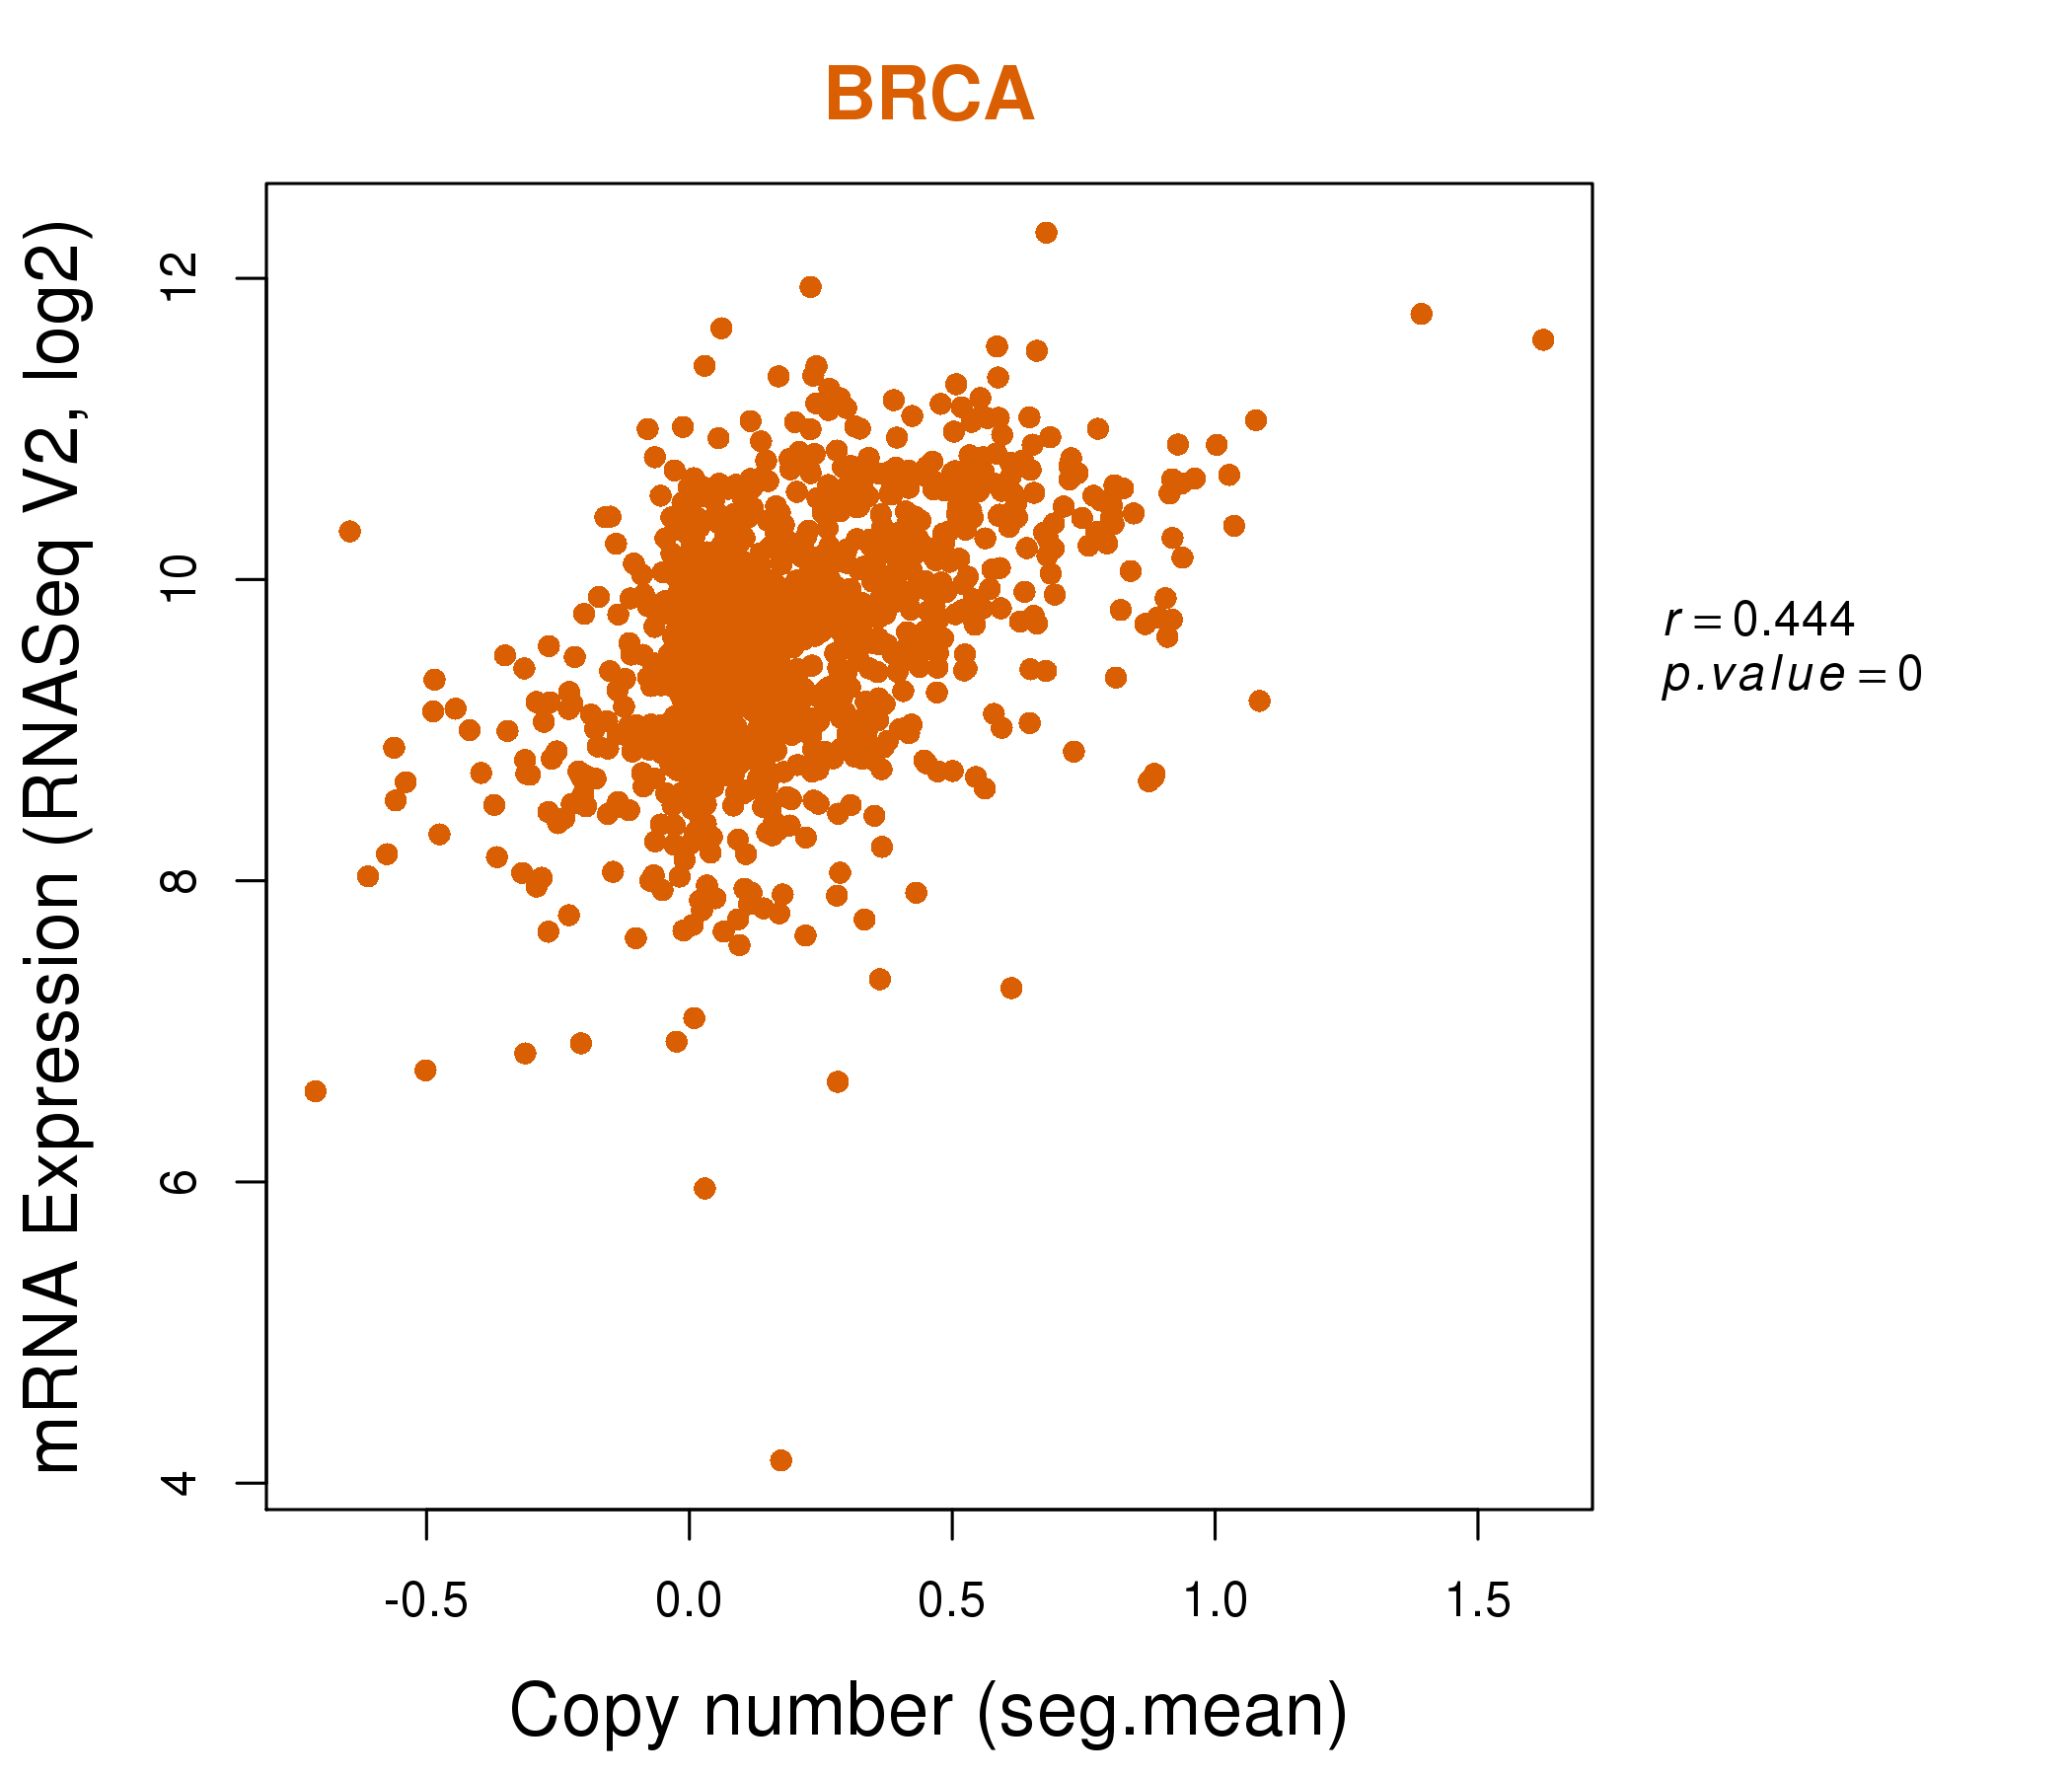
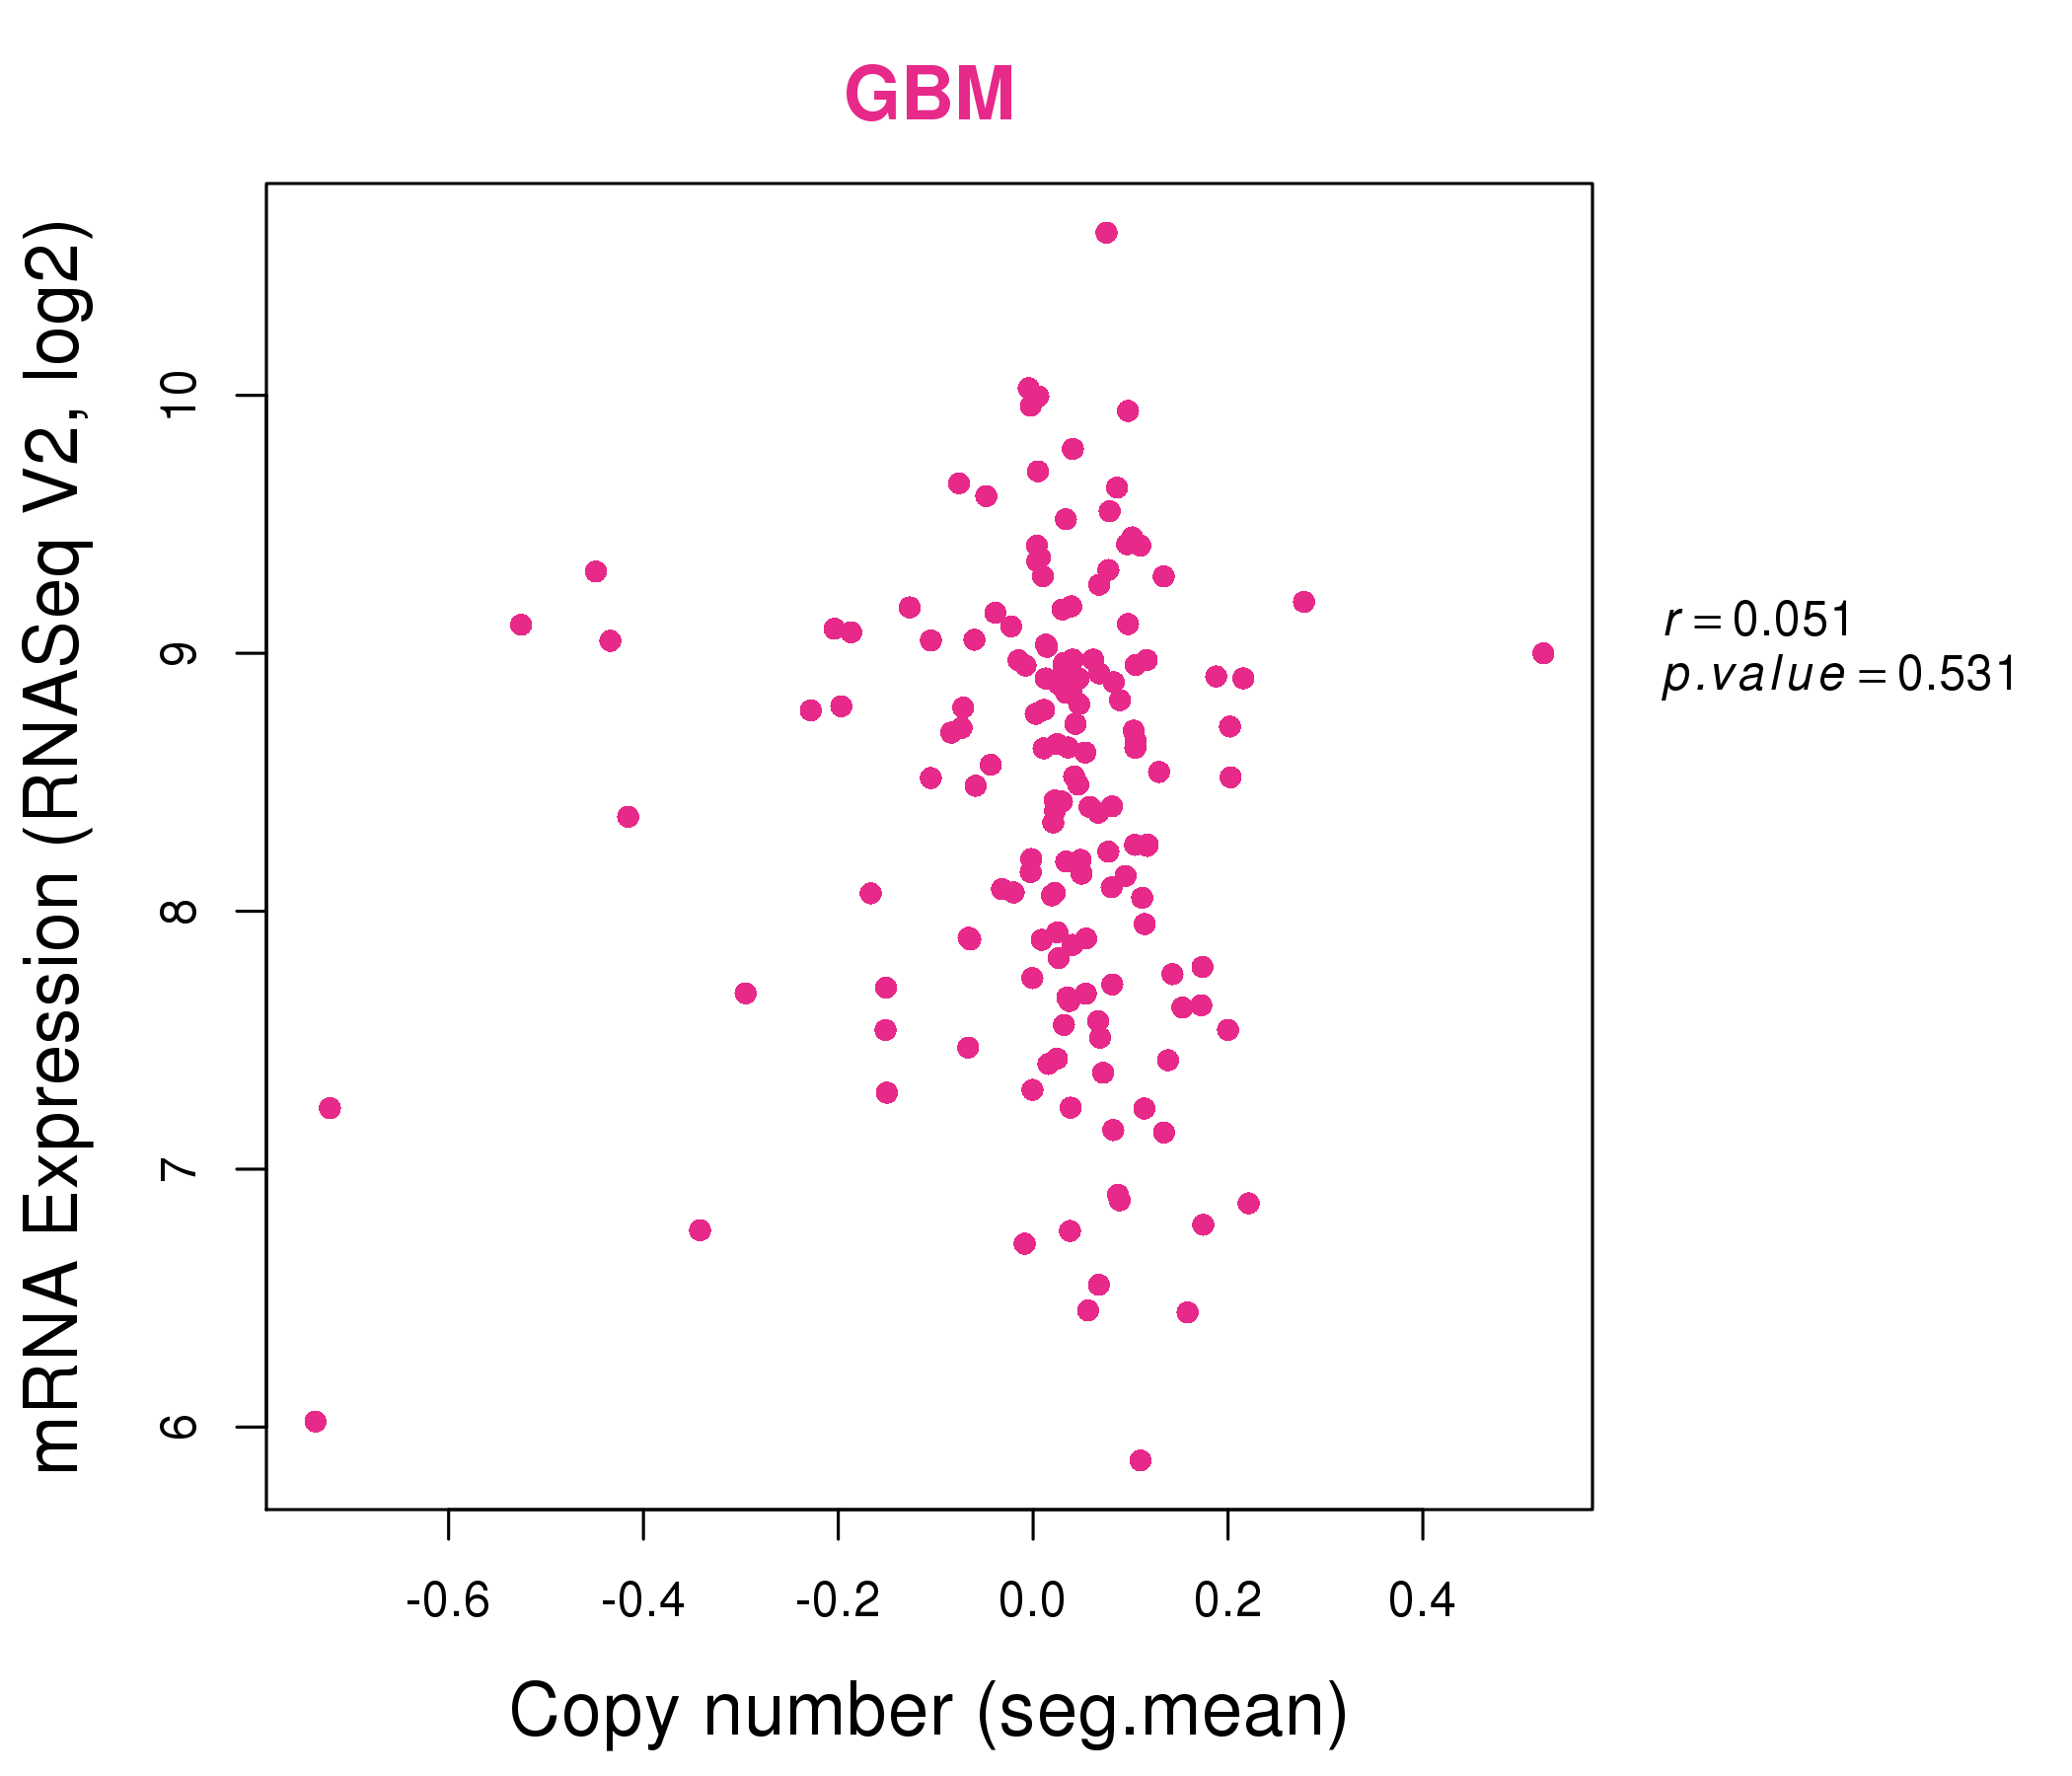
| * Normalized gene expression data of RNASeqV2 was extracted from TCGA using R package TCGA-Assembler. The URLs of all public data files on TCGA DCC data server were gathered at Jan-05-2015. Only eight cancer types have enough normal control samples for differential expression analysis. (t test, adjusted p<0.05 (using Benjamini-Hochberg FDR)) |
 |
| Top |
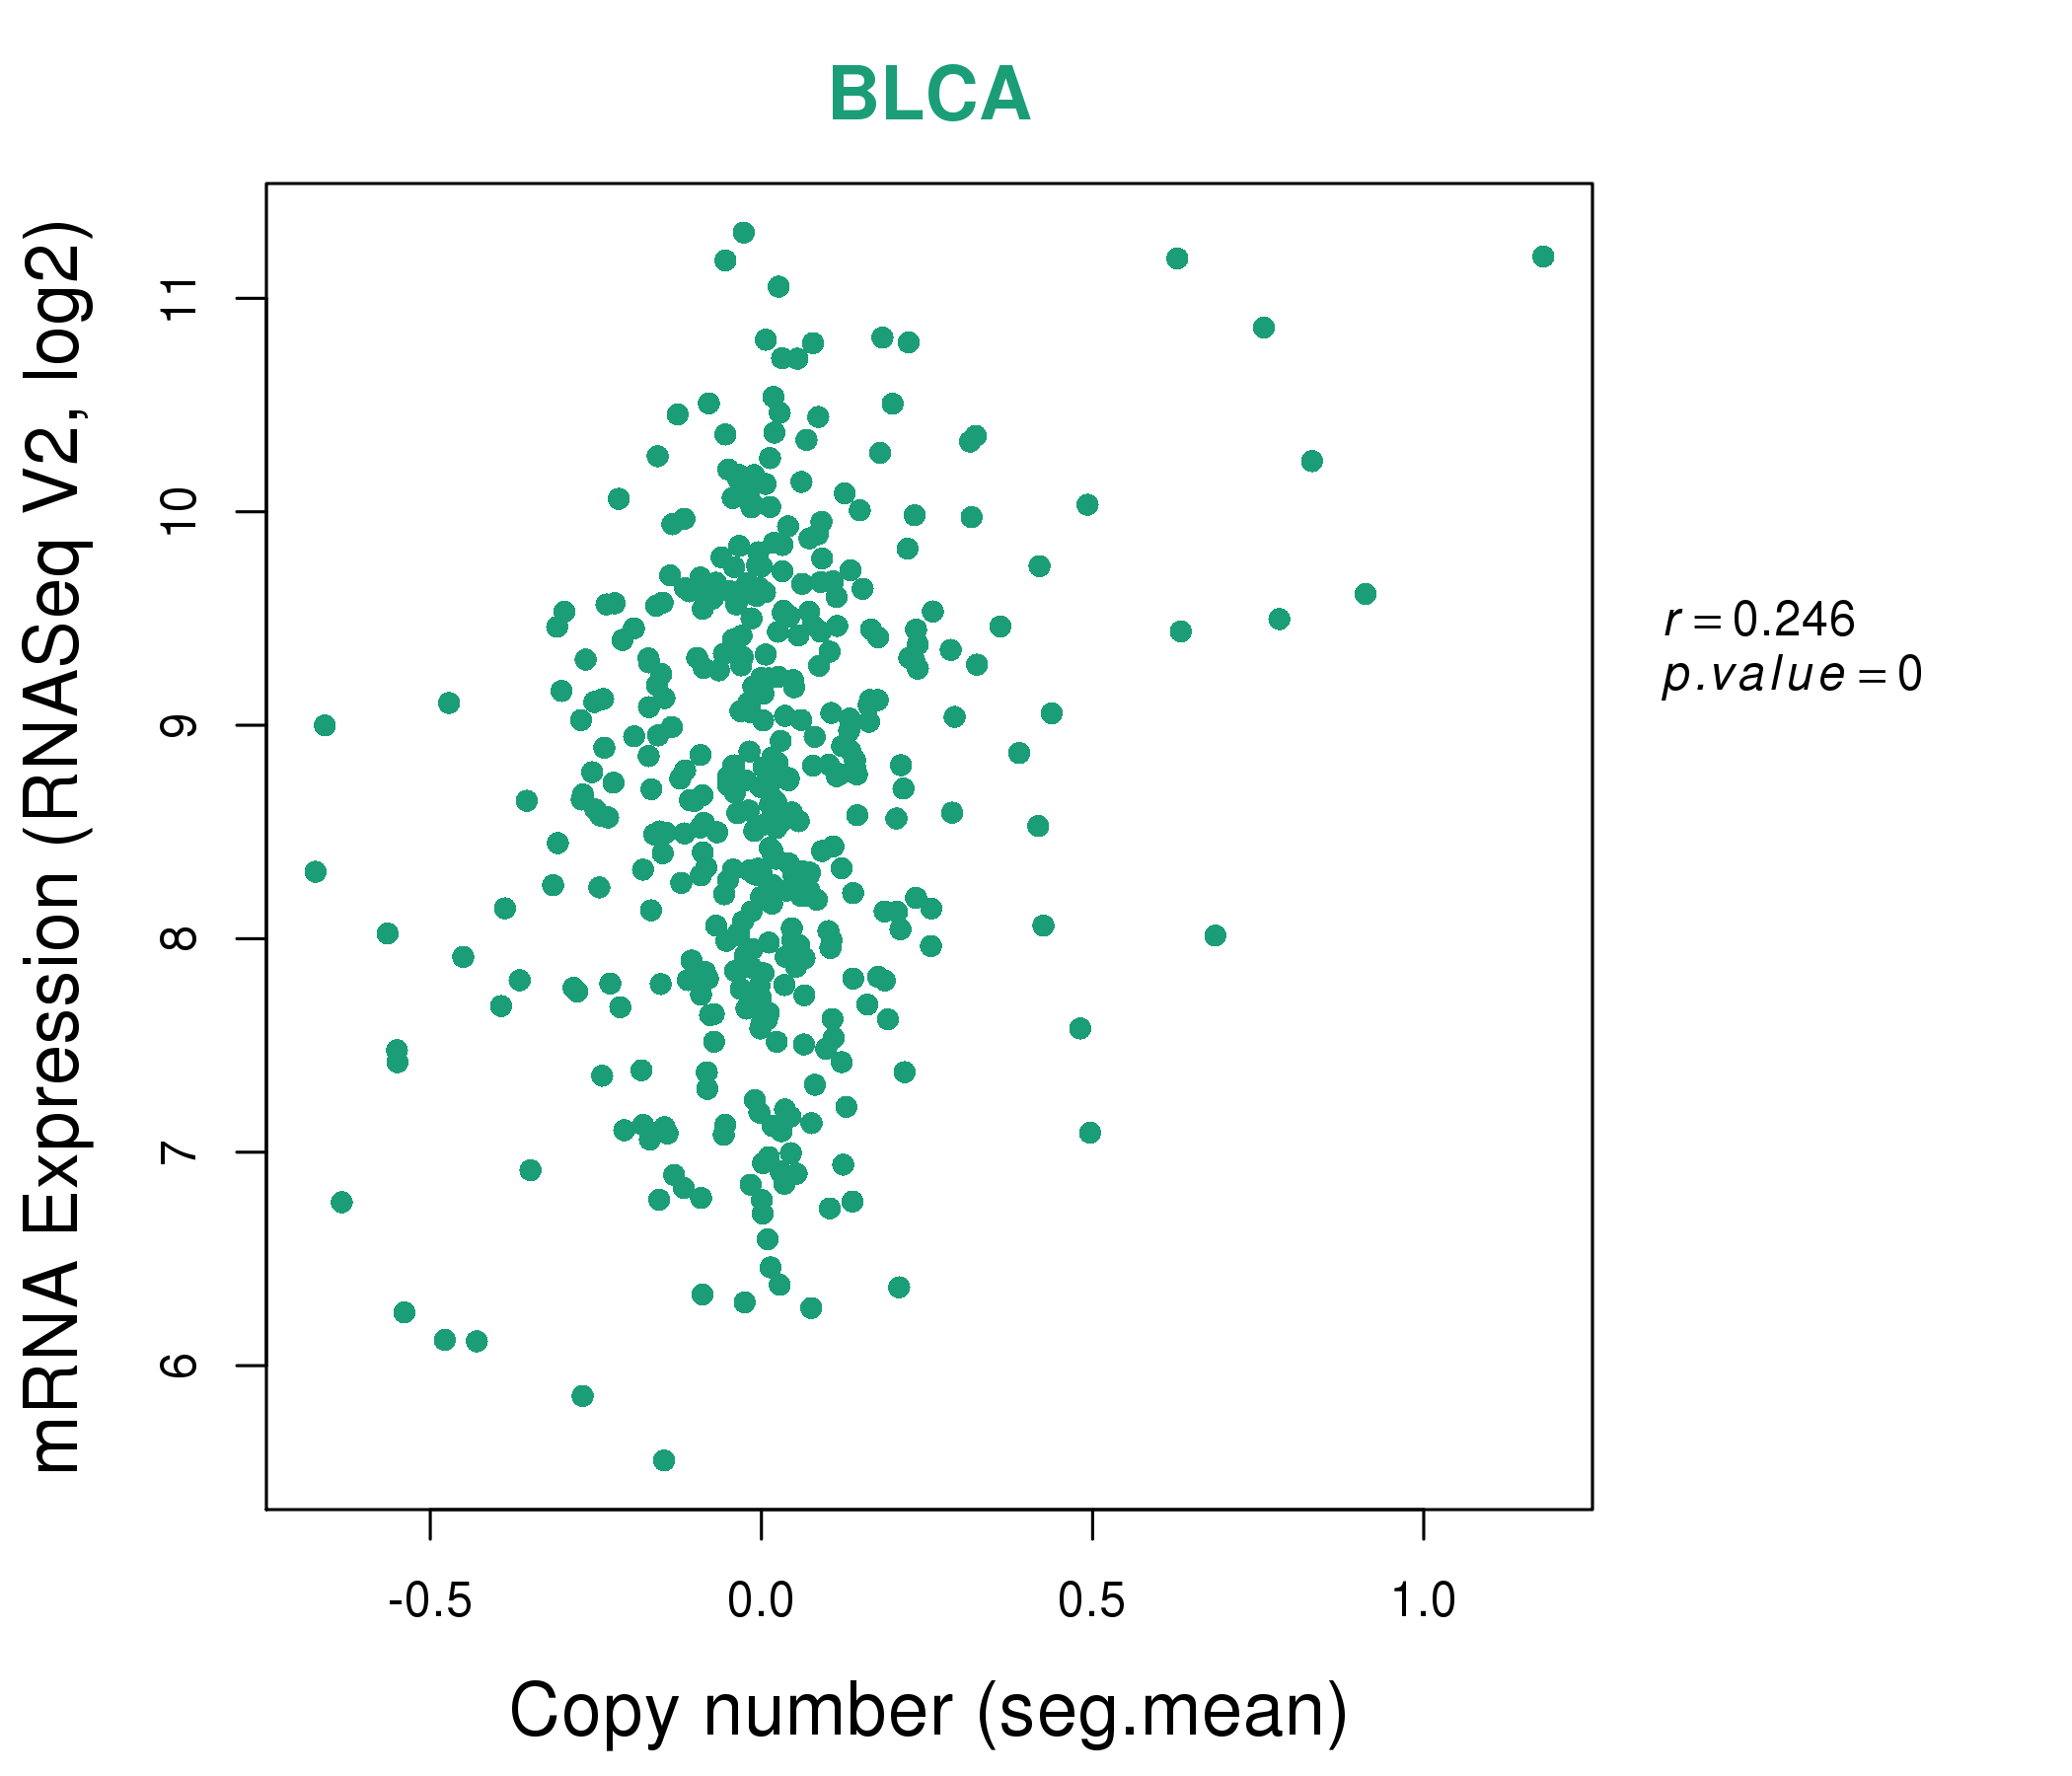
| * This plots show the correlation between CNV and gene expression. |
: Open all plots for all cancer types
 |
|
 |
|
| Top |
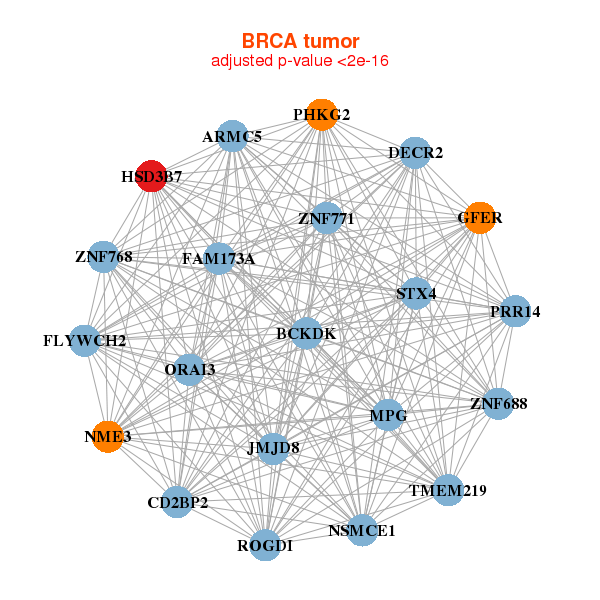
| Gene-Gene Network Information |
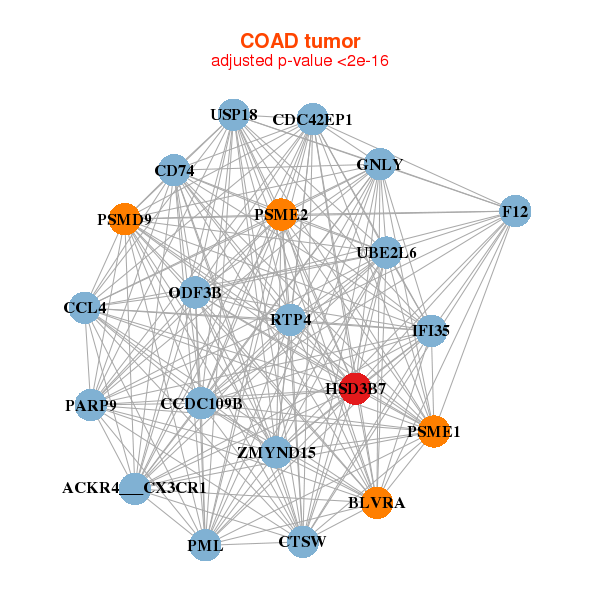
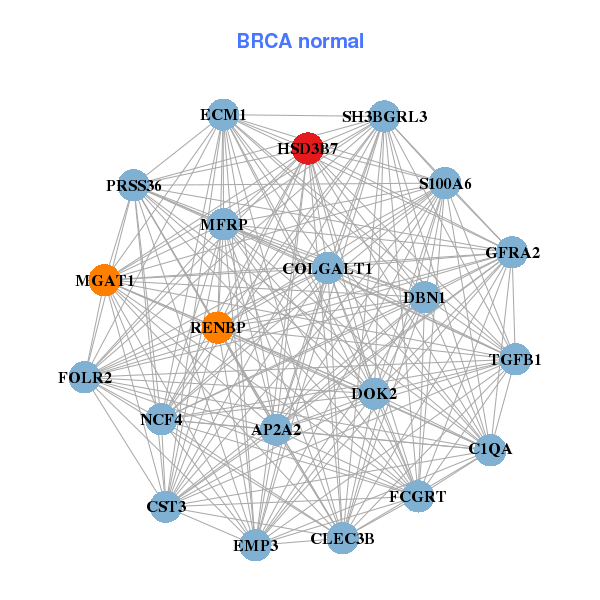
| * Co-Expression network figures were drawn using R package igraph. Only the top 20 genes with the highest correlations were shown. Red circle: input gene, orange circle: cell metabolism gene, sky circle: other gene |
: Open all plots for all cancer types
 |
| ||||
| ARMC5,BCKDK,CD2BP2,DECR2,FAM173A,FLYWCH2,GFER, HSD3B7,JMJD8,MPG,NME3,NSMCE1,ORAI3,PHKG2, PRR14,ROGDI,STX4,TMEM219,ZNF688,ZNF768,ZNF771 | AP2A2,C1QA,CLEC3B,CST3,DBN1,DOK2,ECM1, EMP3,FCGRT,FOLR2,GFRA2,COLGALT1,HSD3B7,MFRP, MGAT1,NCF4,PRSS36,RENBP,S100A6,SH3BGRL3,TGFB1 | ||||
 |
| ||||
| BLVRA,CCDC109B,CCL4,ACKR4___CX3CR1,CD74,CDC42EP1,CTSW, F12,GNLY,HSD3B7,IFI35,ODF3B,PARP9,PML, PSMD9,PSME1,PSME2,RTP4,UBE2L6,USP18,ZMYND15 | ACOT7,ASPA,PLEKHS1,EXOC3L4,C19orf12,CA9,ACKR4___CX3CR1, CNDP2,DGKZ,RMDN3,GALK1,HSD3B7,LPGAT1,MLN, ODF3B,SH3GL1,SHISA5,SHMT1,SLC25A22,TK2,UNC5CL |
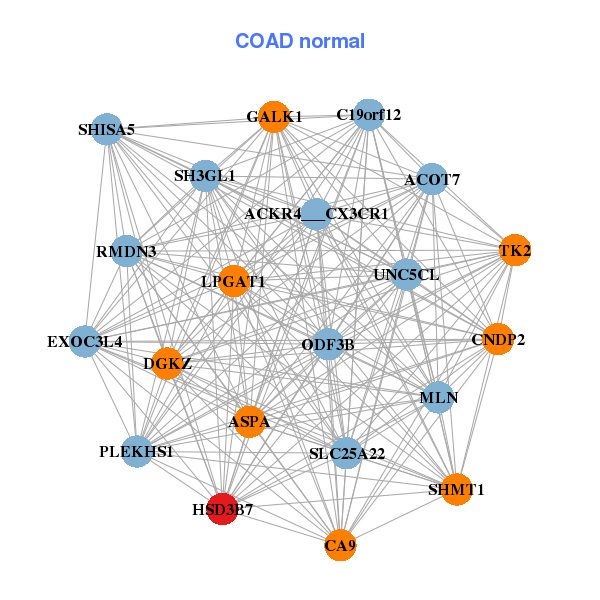
| * Co-Expression network figures were drawn using R package igraph. Only the top 20 genes with the highest correlations were shown. Red circle: input gene, orange circle: cell metabolism gene, sky circle: other gene |
: Open all plots for all cancer types
| Top |
: Open all interacting genes' information including KEGG pathway for all interacting genes from DAVID
| Top |
| Pharmacological Information for HSD3B7 |
| DB Category | DB Name | DB's ID and Url link |
| * Gene Centered Interaction Network. |
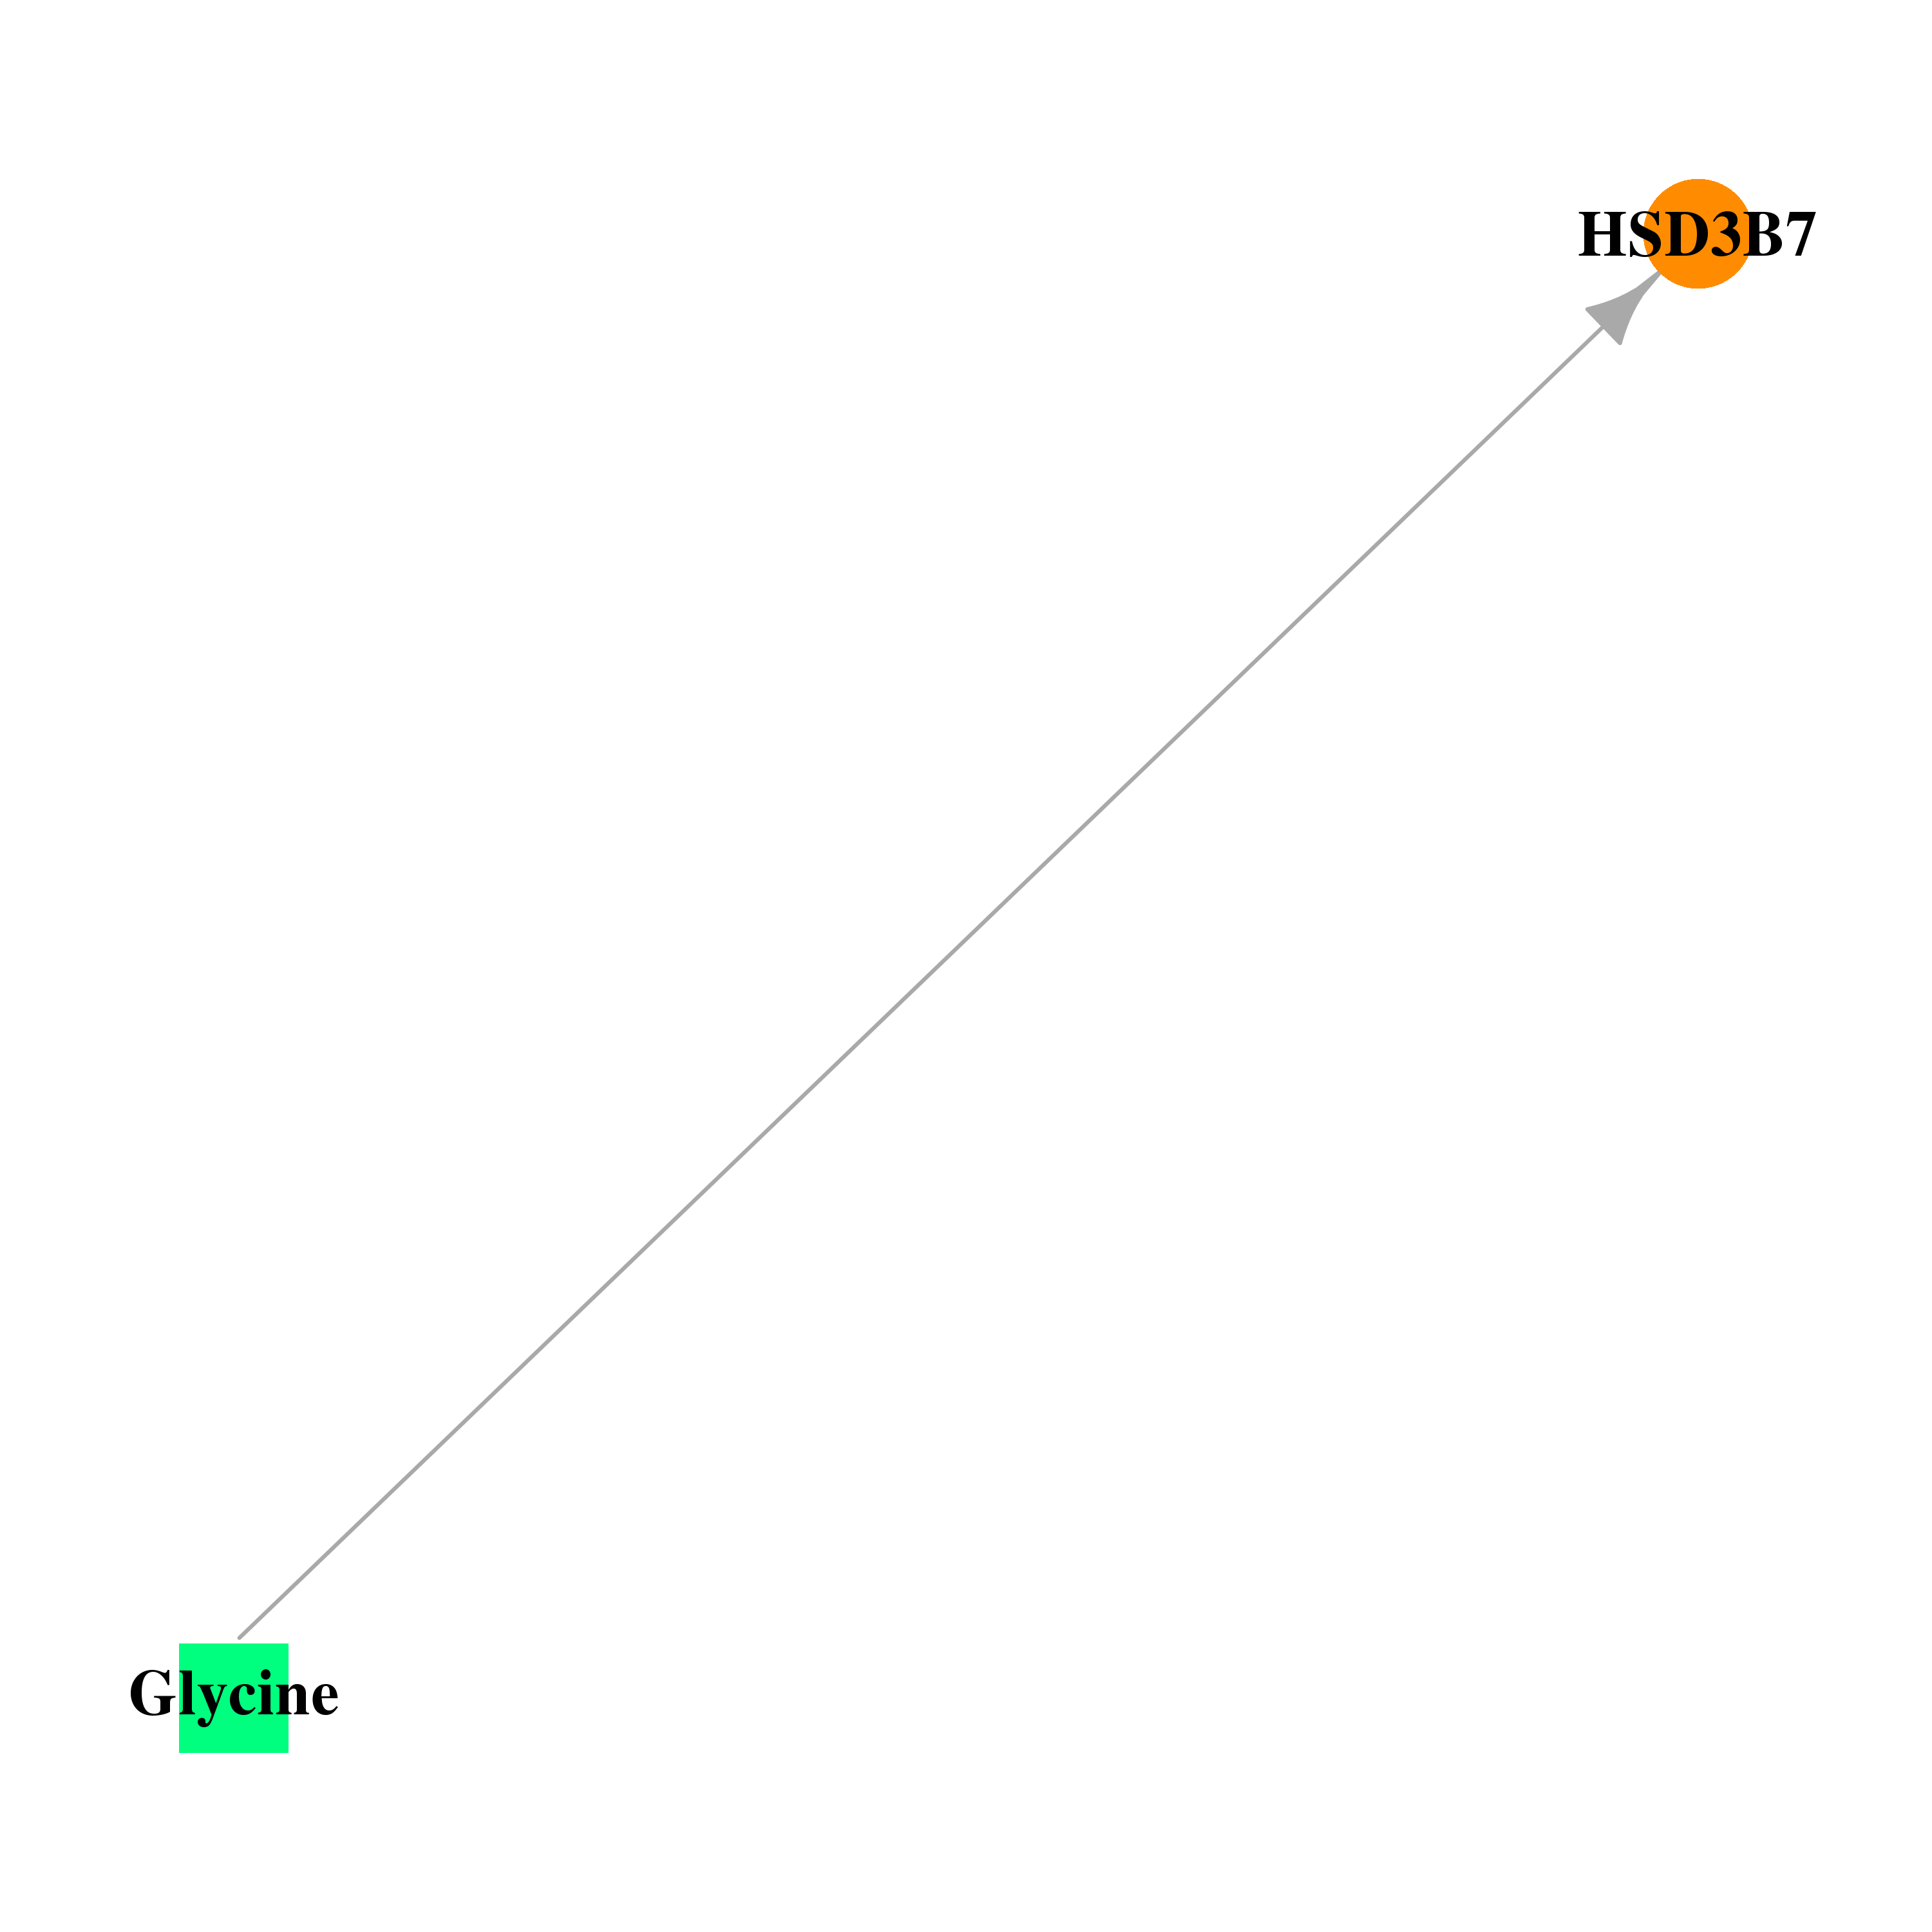 |
| * Drug Centered Interaction Network. |
| DrugBank ID | Target Name | Drug Groups | Generic Name | Drug Centered Network | Drug Structure |
| DB00145 | hydroxy-delta-5-steroid dehydrogenase, 3 beta- and steroid delta-isomerase 7 | approved; nutraceutical | Glycine |  |  |
| Top |
| Cross referenced IDs for HSD3B7 |
| * We obtained these cross-references from Uniprot database. It covers 150 different DBs, 18 categories. http://www.uniprot.org/help/cross_references_section |
: Open all cross reference information
|
Copyright © 2016-Present - The Univsersity of Texas Health Science Center at Houston @ |