|
||||||||||||||||||||
| |
| Phenotypic Information (metabolism pathway, cancer, disease, phenome) |
| |
| |
| Gene-Gene Network Information: Co-Expression Network, Interacting Genes & KEGG |
| |
|


| Gene Summary for CALM3 |
| Top |
| Phenotypic Information for CALM3(metabolism pathway, cancer, disease, phenome) |
| Cancer | CGAP: CALM3 |
| Familial Cancer Database: CALM3 | |
| * This gene is included in those cancer gene databases. |
|
|
|
|
|
| . | ||||||||||||||
Oncogene 1 | Significant driver gene in | |||||||||||||||||||
| cf) number; DB name 1 Oncogene; http://nar.oxfordjournals.org/content/35/suppl_1/D721.long, 2 Tumor Suppressor gene; https://bioinfo.uth.edu/TSGene/, 3 Cancer Gene Census; http://www.nature.com/nrc/journal/v4/n3/abs/nrc1299.html, 4 CancerGenes; http://nar.oxfordjournals.org/content/35/suppl_1/D721.long, 5 Network of Cancer Gene; http://ncg.kcl.ac.uk/index.php, 1Therapeutic Vulnerabilities in Cancer; http://cbio.mskcc.org/cancergenomics/statius/ |
| REACTOME_METABOLISM_OF_CARBOHYDRATES REACTOME_GLUCOSE_METABOLISM | |
| OMIM | |
| Orphanet | |
| Disease | KEGG Disease: CALM3 |
| MedGen: CALM3 (Human Medical Genetics with Condition) | |
| ClinVar: CALM3 | |
| Phenotype | MGI: CALM3 (International Mouse Phenotyping Consortium) |
| PhenomicDB: CALM3 | |
| Mutations for CALM3 |
| * Under tables are showing count per each tissue to give us broad intuition about tissue specific mutation patterns.You can go to the detailed page for each mutation database's web site. |
| There's no structural variation information in COSMIC data for this gene. |
| * From mRNA Sanger sequences, Chitars2.0 arranged chimeric transcripts. This table shows CALM3 related fusion information. |
| ID | Head Gene | Tail Gene | Accession | Gene_a | qStart_a | qEnd_a | Chromosome_a | tStart_a | tEnd_a | Gene_a | qStart_a | qEnd_a | Chromosome_a | tStart_a | tEnd_a |
| BE930858 | PPAP2B | 20 | 166 | 1 | 57004977 | 57005126 | CALM3 | 165 | 388 | 19 | 47112191 | 47112551 | |
| BQ327040 | CALM3 | 5 | 123 | 19 | 47113184 | 47113304 | TROVE2 | 117 | 400 | 1 | 193057032 | 193057310 | |
| BF947810 | CADM3 | 6 | 225 | 1 | 159172123 | 159172343 | CALM3 | 219 | 419 | 19 | 47113040 | 47113240 | |
| BU931140 | COL18A1 | 18 | 553 | 21 | 46933101 | 46933634 | CALM3 | 553 | 674 | 19 | 47104576 | 47104696 | |
| M86171 | CALM3 | 1 | 140 | 19 | 47113557 | 47113696 | CALM3 | 136 | 350 | 19 | 47104584 | 47111524 | |
| BF802907 | CALM3 | 13 | 191 | 19 | 47112775 | 47112954 | DDX5 | 181 | 430 | 17 | 62496951 | 62497200 | |
| AW867517 | CALM3 | 15 | 215 | 19 | 47111744 | 47112203 | MSN | 212 | 600 | X | 64960799 | 64961187 | |
| BI028359 | CALM3 | 27 | 196 | 19 | 47111737 | 47112165 | CALM3 | 191 | 308 | 19 | 47112200 | 47112460 | |
| BF839329 | CALM3 | 13 | 168 | 19 | 47111191 | 47111347 | ANKRD26 | 160 | 225 | 10 | 27369421 | 27369486 | |
| AK124456 | CALM3 | 802 | 1116 | 19 | 47113510 | 47113824 | CALM3 | 1111 | 2170 | 19 | 47112612 | 47114038 | |
| BQ327094 | CALM3 | 9 | 94 | 19 | 47113184 | 47113269 | TROVE2 | 88 | 321 | 1 | 193057032 | 193057265 | |
| AI760114 | CALM3 | 16 | 378 | 19 | 47113677 | 47114039 | SCN3A | 370 | 447 | 2 | 166043719 | 166043797 | |
| BG979974 | SPINT1 | 14 | 146 | 15 | 41149688 | 41149827 | CALM3 | 137 | 404 | 19 | 47112181 | 47112592 | |
| AW895034 | CELSR2 | 1 | 185 | 1 | 109817969 | 109818153 | CALM3 | 186 | 305 | 19 | 47112215 | 47112477 | |
| T05484 | NCAM1 | 1 | 90 | 11 | 113094797 | 113094887 | CALM3 | 91 | 232 | 19 | 47111512 | 47111794 | |
| Top |
| There's no copy number variation information in COSMIC data for this gene. |
| Top |
|
 |
| Top |
| Stat. for Non-Synonymous SNVs (# total SNVs=5) | (# total SNVs=3) |
 |  |
(# total SNVs=1) | (# total SNVs=0) |
 |
| Top |
| * When you move the cursor on each content, you can see more deailed mutation information on the Tooltip. Those are primary_site,primary_histology,mutation(aa),pubmedID. |
| GRCh37 position | Mutation(aa) | Unique sampleID count |
| chr19:47111527-47111527 | p.V36V | 1 |
| chr19:47111798-47111801 | p.D81fs*28 | 1 |
| chr19:47111800-47111800 | p.T80T | 1 |
| chr19:47112130-47112130 | p.E105Q | 1 |
| chr19:47112165-47112165 | p.K116K | 1 |
| chr19:47112210-47112210 | p.I131I | 1 |
| chr19:47112393-47112393 | p.M145V | 1 |
| chr19:47112395-47112395 | p.M145I | 1 |
| chr19:47109107-47109107 | p.Q9H | 1 |
| chr19:47111488-47111488 | p.D23E | 1 |
| Top |
|
 |
| Point Mutation/ Tissue ID | 1 | 2 | 3 | 4 | 5 | 6 | 7 | 8 | 9 | 10 | 11 | 12 | 13 | 14 | 15 | 16 | 17 | 18 | 19 | 20 |
| # sample | 1 | 1 | 1 | 1 | 1 | 1 | 2 | |||||||||||||
| # mutation | 1 | 1 | 1 | 1 | 1 | 1 | 2 | |||||||||||||
| nonsynonymous SNV | 1 | 1 | 1 | 1 | 1 | |||||||||||||||
| synonymous SNV | 1 | 2 |
| cf) Tissue ID; Tissue type (1; BLCA[Bladder Urothelial Carcinoma], 2; BRCA[Breast invasive carcinoma], 3; CESC[Cervical squamous cell carcinoma and endocervical adenocarcinoma], 4; COAD[Colon adenocarcinoma], 5; GBM[Glioblastoma multiforme], 6; Glioma Low Grade, 7; HNSC[Head and Neck squamous cell carcinoma], 8; KICH[Kidney Chromophobe], 9; KIRC[Kidney renal clear cell carcinoma], 10; KIRP[Kidney renal papillary cell carcinoma], 11; LAML[Acute Myeloid Leukemia], 12; LUAD[Lung adenocarcinoma], 13; LUSC[Lung squamous cell carcinoma], 14; OV[Ovarian serous cystadenocarcinoma ], 15; PAAD[Pancreatic adenocarcinoma], 16; PRAD[Prostate adenocarcinoma], 17; SKCM[Skin Cutaneous Melanoma], 18:STAD[Stomach adenocarcinoma], 19:THCA[Thyroid carcinoma], 20:UCEC[Uterine Corpus Endometrial Carcinoma]) |
| Top |
| * We represented just top 10 SNVs. When you move the cursor on each content, you can see more deailed mutation information on the Tooltip. Those are primary_site, primary_histology, mutation(aa), pubmedID. |
| Genomic Position | Mutation(aa) | Unique sampleID count |
| chr19:47111779 | p.Q9H | 1 |
| chr19:47112165 | p.V36V | 1 |
| chr19:47112210 | p.M52V | 1 |
| chr19:47112393 | p.M73I | 1 |
| chr19:47112395 | p.K116K | 1 |
| chr19:47109107 | p.I131I | 1 |
| chr19:47111527 | p.M145V | 1 |
| chr19:47111573 | p.M145I | 1 |
| * Copy number data were extracted from TCGA using R package TCGA-Assembler. The URLs of all public data files on TCGA DCC data server were gathered on Jan-05-2015. Function ProcessCNAData in TCGA-Assembler package was used to obtain gene-level copy number value which is calculated as the average copy number of the genomic region of a gene. |
 |
| cf) Tissue ID[Tissue type]: BLCA[Bladder Urothelial Carcinoma], BRCA[Breast invasive carcinoma], CESC[Cervical squamous cell carcinoma and endocervical adenocarcinoma], COAD[Colon adenocarcinoma], GBM[Glioblastoma multiforme], Glioma Low Grade, HNSC[Head and Neck squamous cell carcinoma], KICH[Kidney Chromophobe], KIRC[Kidney renal clear cell carcinoma], KIRP[Kidney renal papillary cell carcinoma], LAML[Acute Myeloid Leukemia], LUAD[Lung adenocarcinoma], LUSC[Lung squamous cell carcinoma], OV[Ovarian serous cystadenocarcinoma ], PAAD[Pancreatic adenocarcinoma], PRAD[Prostate adenocarcinoma], SKCM[Skin Cutaneous Melanoma], STAD[Stomach adenocarcinoma], THCA[Thyroid carcinoma], UCEC[Uterine Corpus Endometrial Carcinoma] |
| Top |
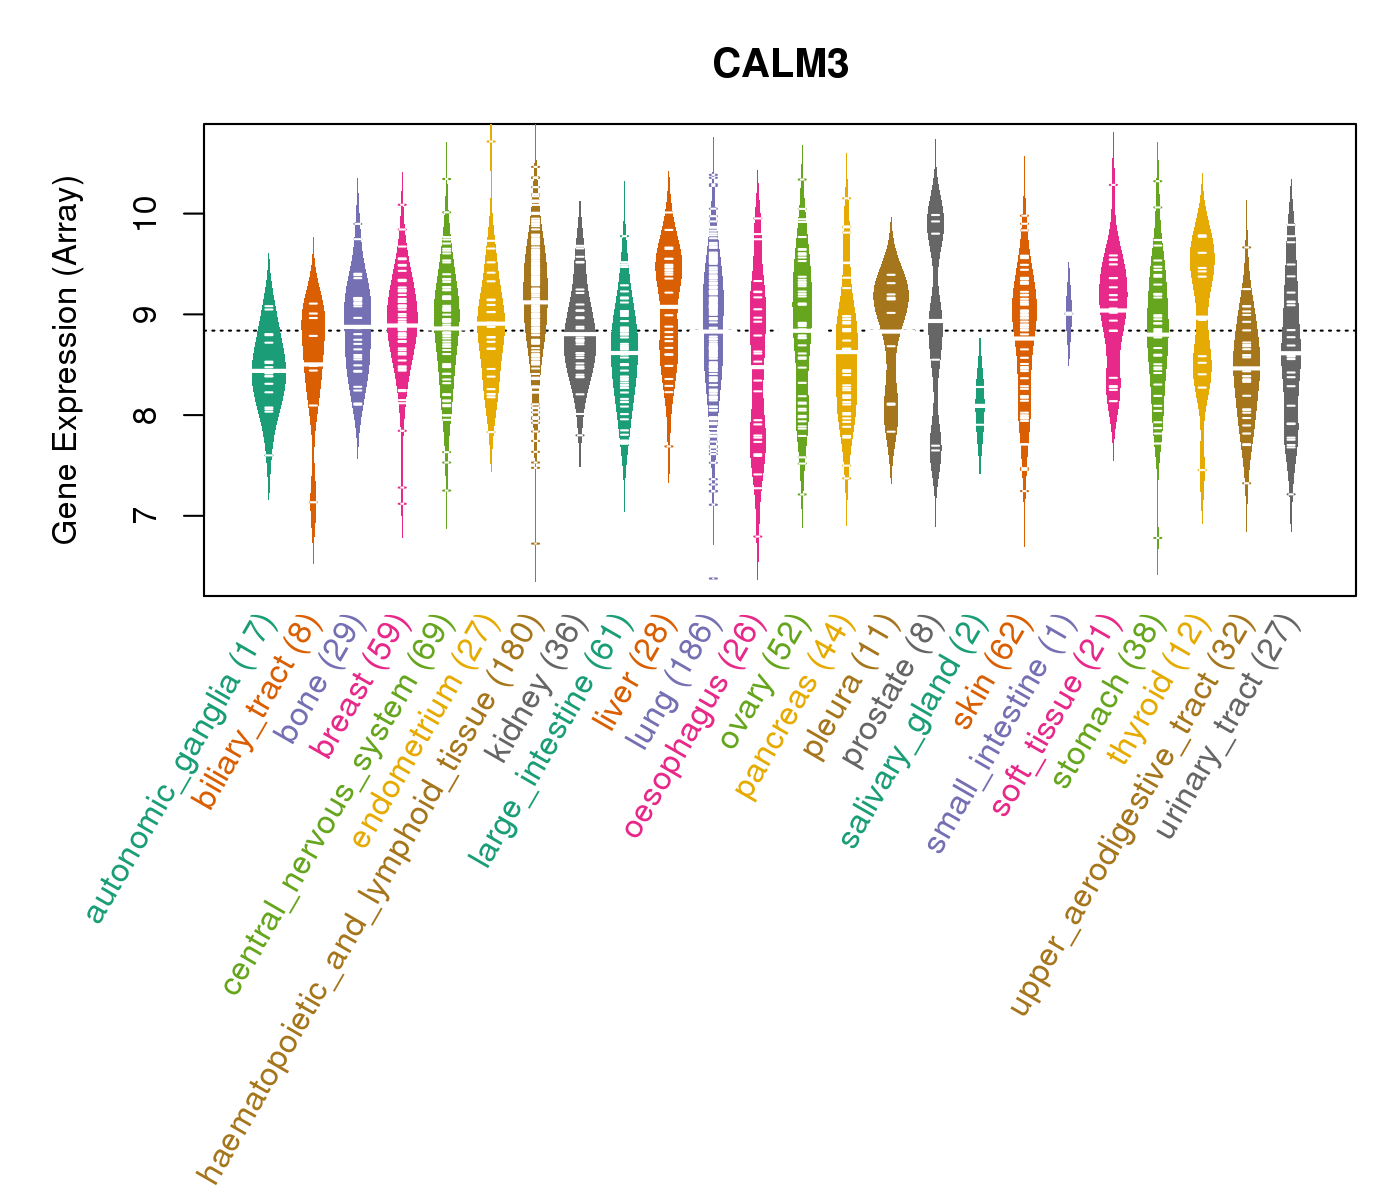
| Gene Expression for CALM3 |
| * CCLE gene expression data were extracted from CCLE_Expression_Entrez_2012-10-18.res: Gene-centric RMA-normalized mRNA expression data. |
 |
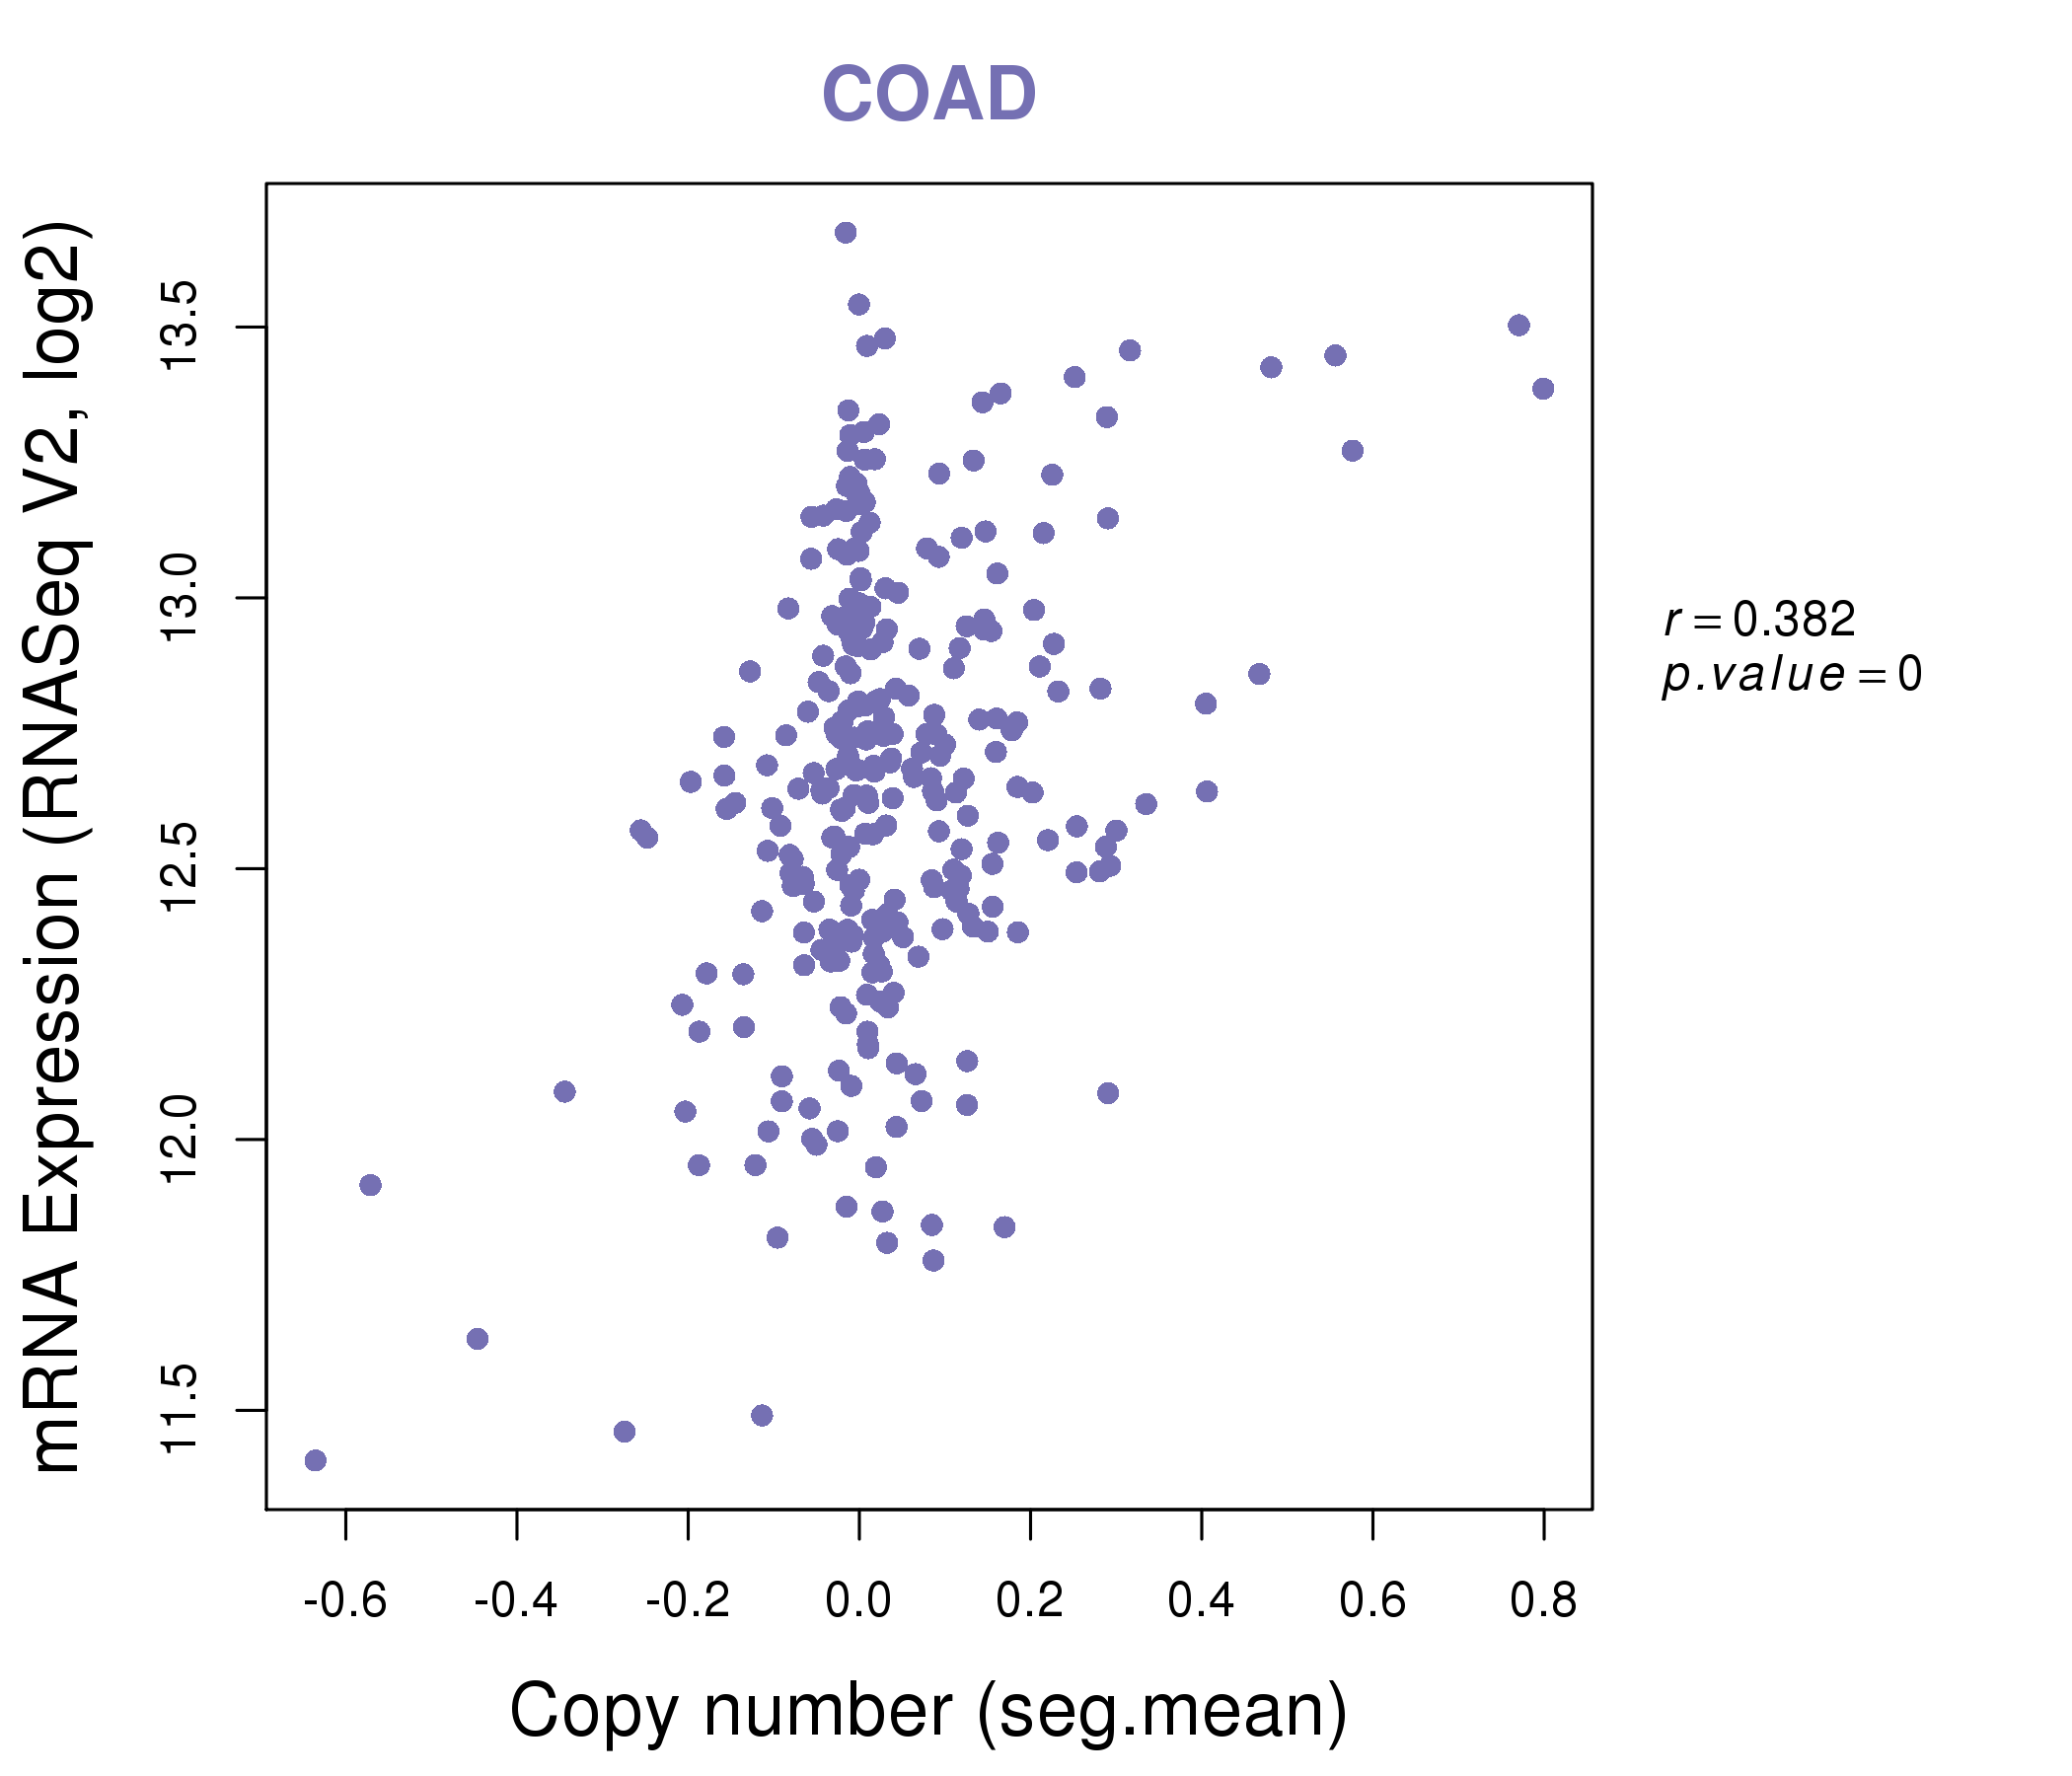
| * Normalized gene expression data of RNASeqV2 was extracted from TCGA using R package TCGA-Assembler. The URLs of all public data files on TCGA DCC data server were gathered at Jan-05-2015. Only eight cancer types have enough normal control samples for differential expression analysis. (t test, adjusted p<0.05 (using Benjamini-Hochberg FDR)) |
 |
| Top |
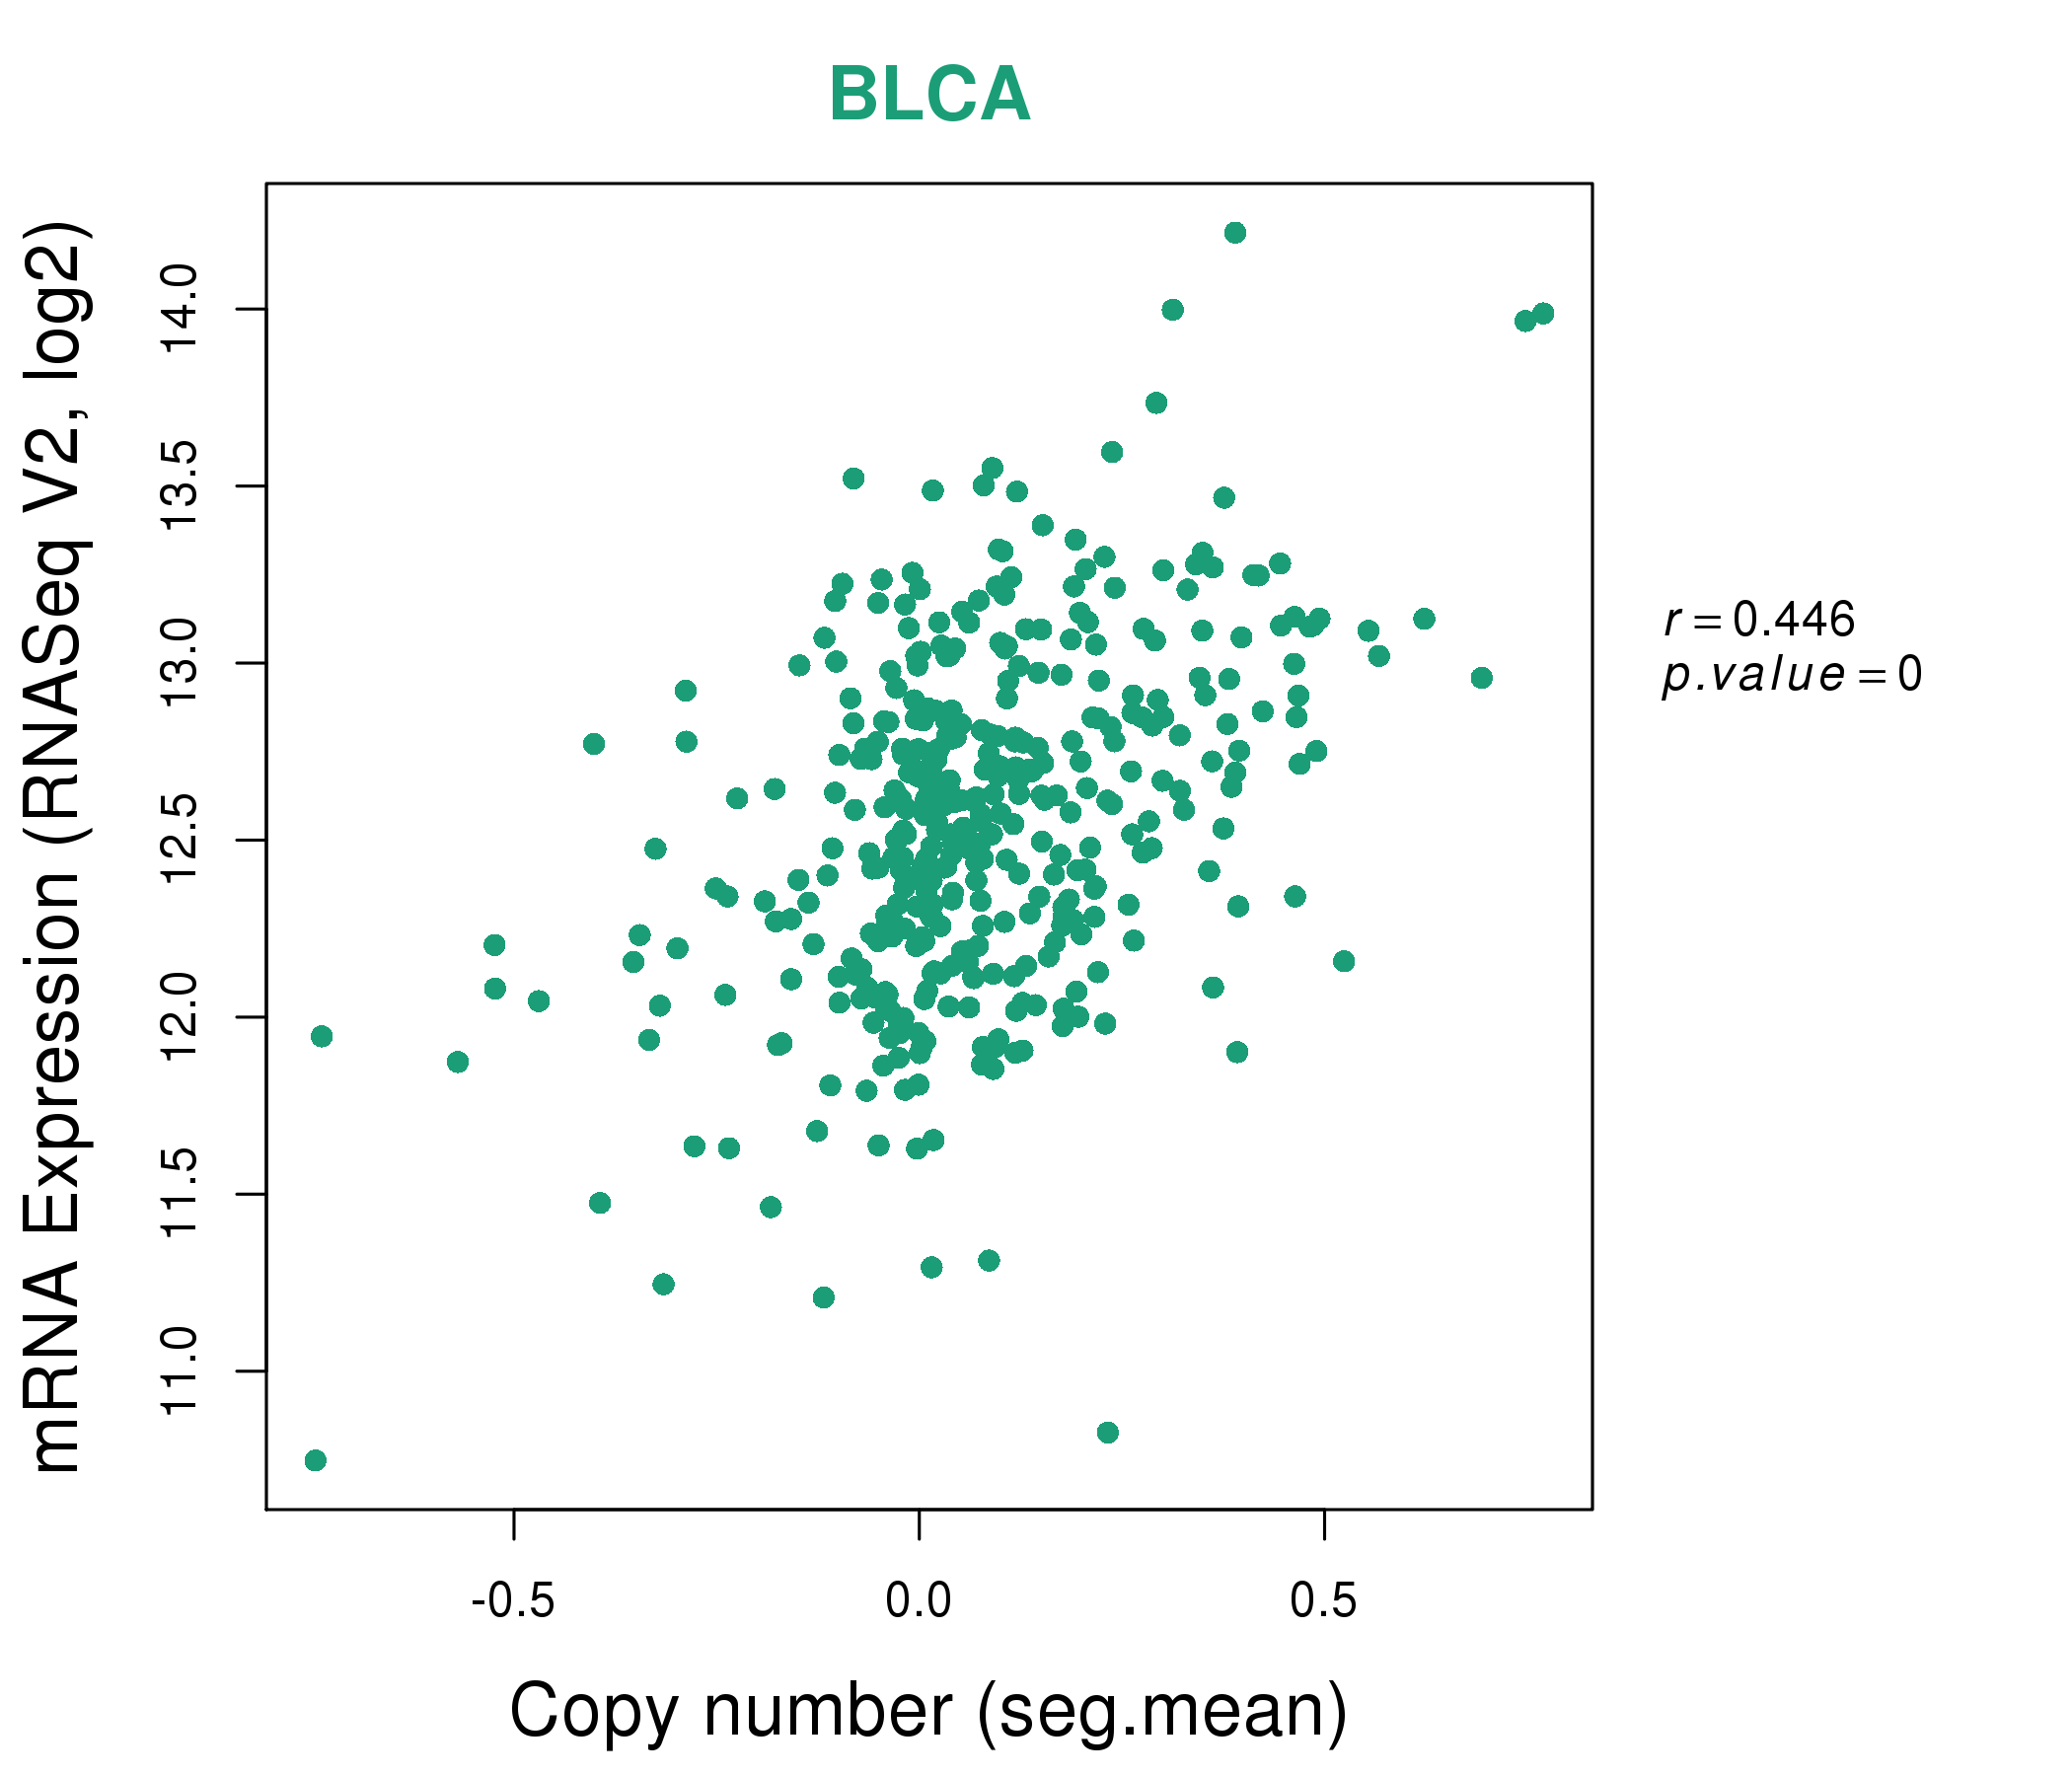
| * This plots show the correlation between CNV and gene expression. |
: Open all plots for all cancer types
 |
|
 |
|


| Top |
| Gene-Gene Network Information |
| * Co-Expression network figures were drawn using R package igraph. Only the top 20 genes with the highest correlations were shown. Red circle: input gene, orange circle: cell metabolism gene, sky circle: other gene |
: Open all plots for all cancer types
 |
| ||||
| AP2S1,BCKDHA,CALM3,CCDC9,EPN1,EXOSC5,GRWD1, GSK3A,LIG1,NOSIP,PAFAH1B3,PPFIA3,PPP5C,PRKD2, RUVBL2,SAE1,SNRPD2,STRN4,SYMPK,TFPT,UBE2S | AP2S1,ARPC1B,ATP6V0D1,KIAA0930,CALM3,CNPY3,CTSD, CTSZ,CYBA,GRN,IFI30,ITGB2,LSP1,MAN2B1, NAGK,NAGPA,PLA2G15,PLD3,PNPLA6,TYROBP,VPS18 | ||||
 |
| ||||
| ALDH16A1,AP2S1,BCAT2,CALM3,CNDP2,GSG2,GYS1, LIG1,MBOAT7,MCM5,PFKP,PFN1,PIH1D1,POLD1, PPP5C,PRKD2,RNF19B,PPP6R1,TYMS,VRK3,YIF1B | APOL1,APOL2,CALM3,CFB,EPSTI1,ETV7,GBP2, GZMA,IRF9,MDK,NUB1,PARP9,PSMB9,PSME1, PSME2,RARRES3,STAT1,TAP1,TAP2,TRAFD1,UBE2L6 |

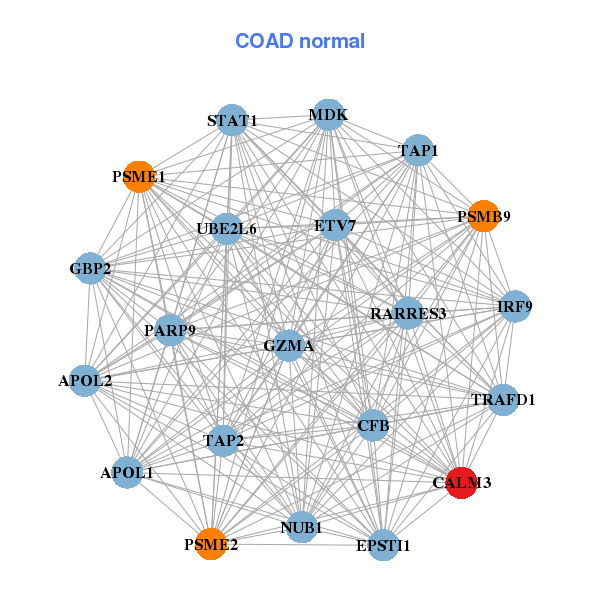
| * Co-Expression network figures were drawn using R package igraph. Only the top 20 genes with the highest correlations were shown. Red circle: input gene, orange circle: cell metabolism gene, sky circle: other gene |
: Open all plots for all cancer types
| Top |
: Open all interacting genes' information including KEGG pathway for all interacting genes from DAVID
| Top |
| Pharmacological Information for CALM3 |
| DB Category | DB Name | DB's ID and Url link |
| * Gene Centered Interaction Network. |
 |
| * Drug Centered Interaction Network. |
| DrugBank ID | Target Name | Drug Groups | Generic Name | Drug Centered Network | Drug Structure |
| DB00360 | calmodulin 3 (phosphorylase kinase, delta) | approved; investigational | Tetrahydrobiopterin | 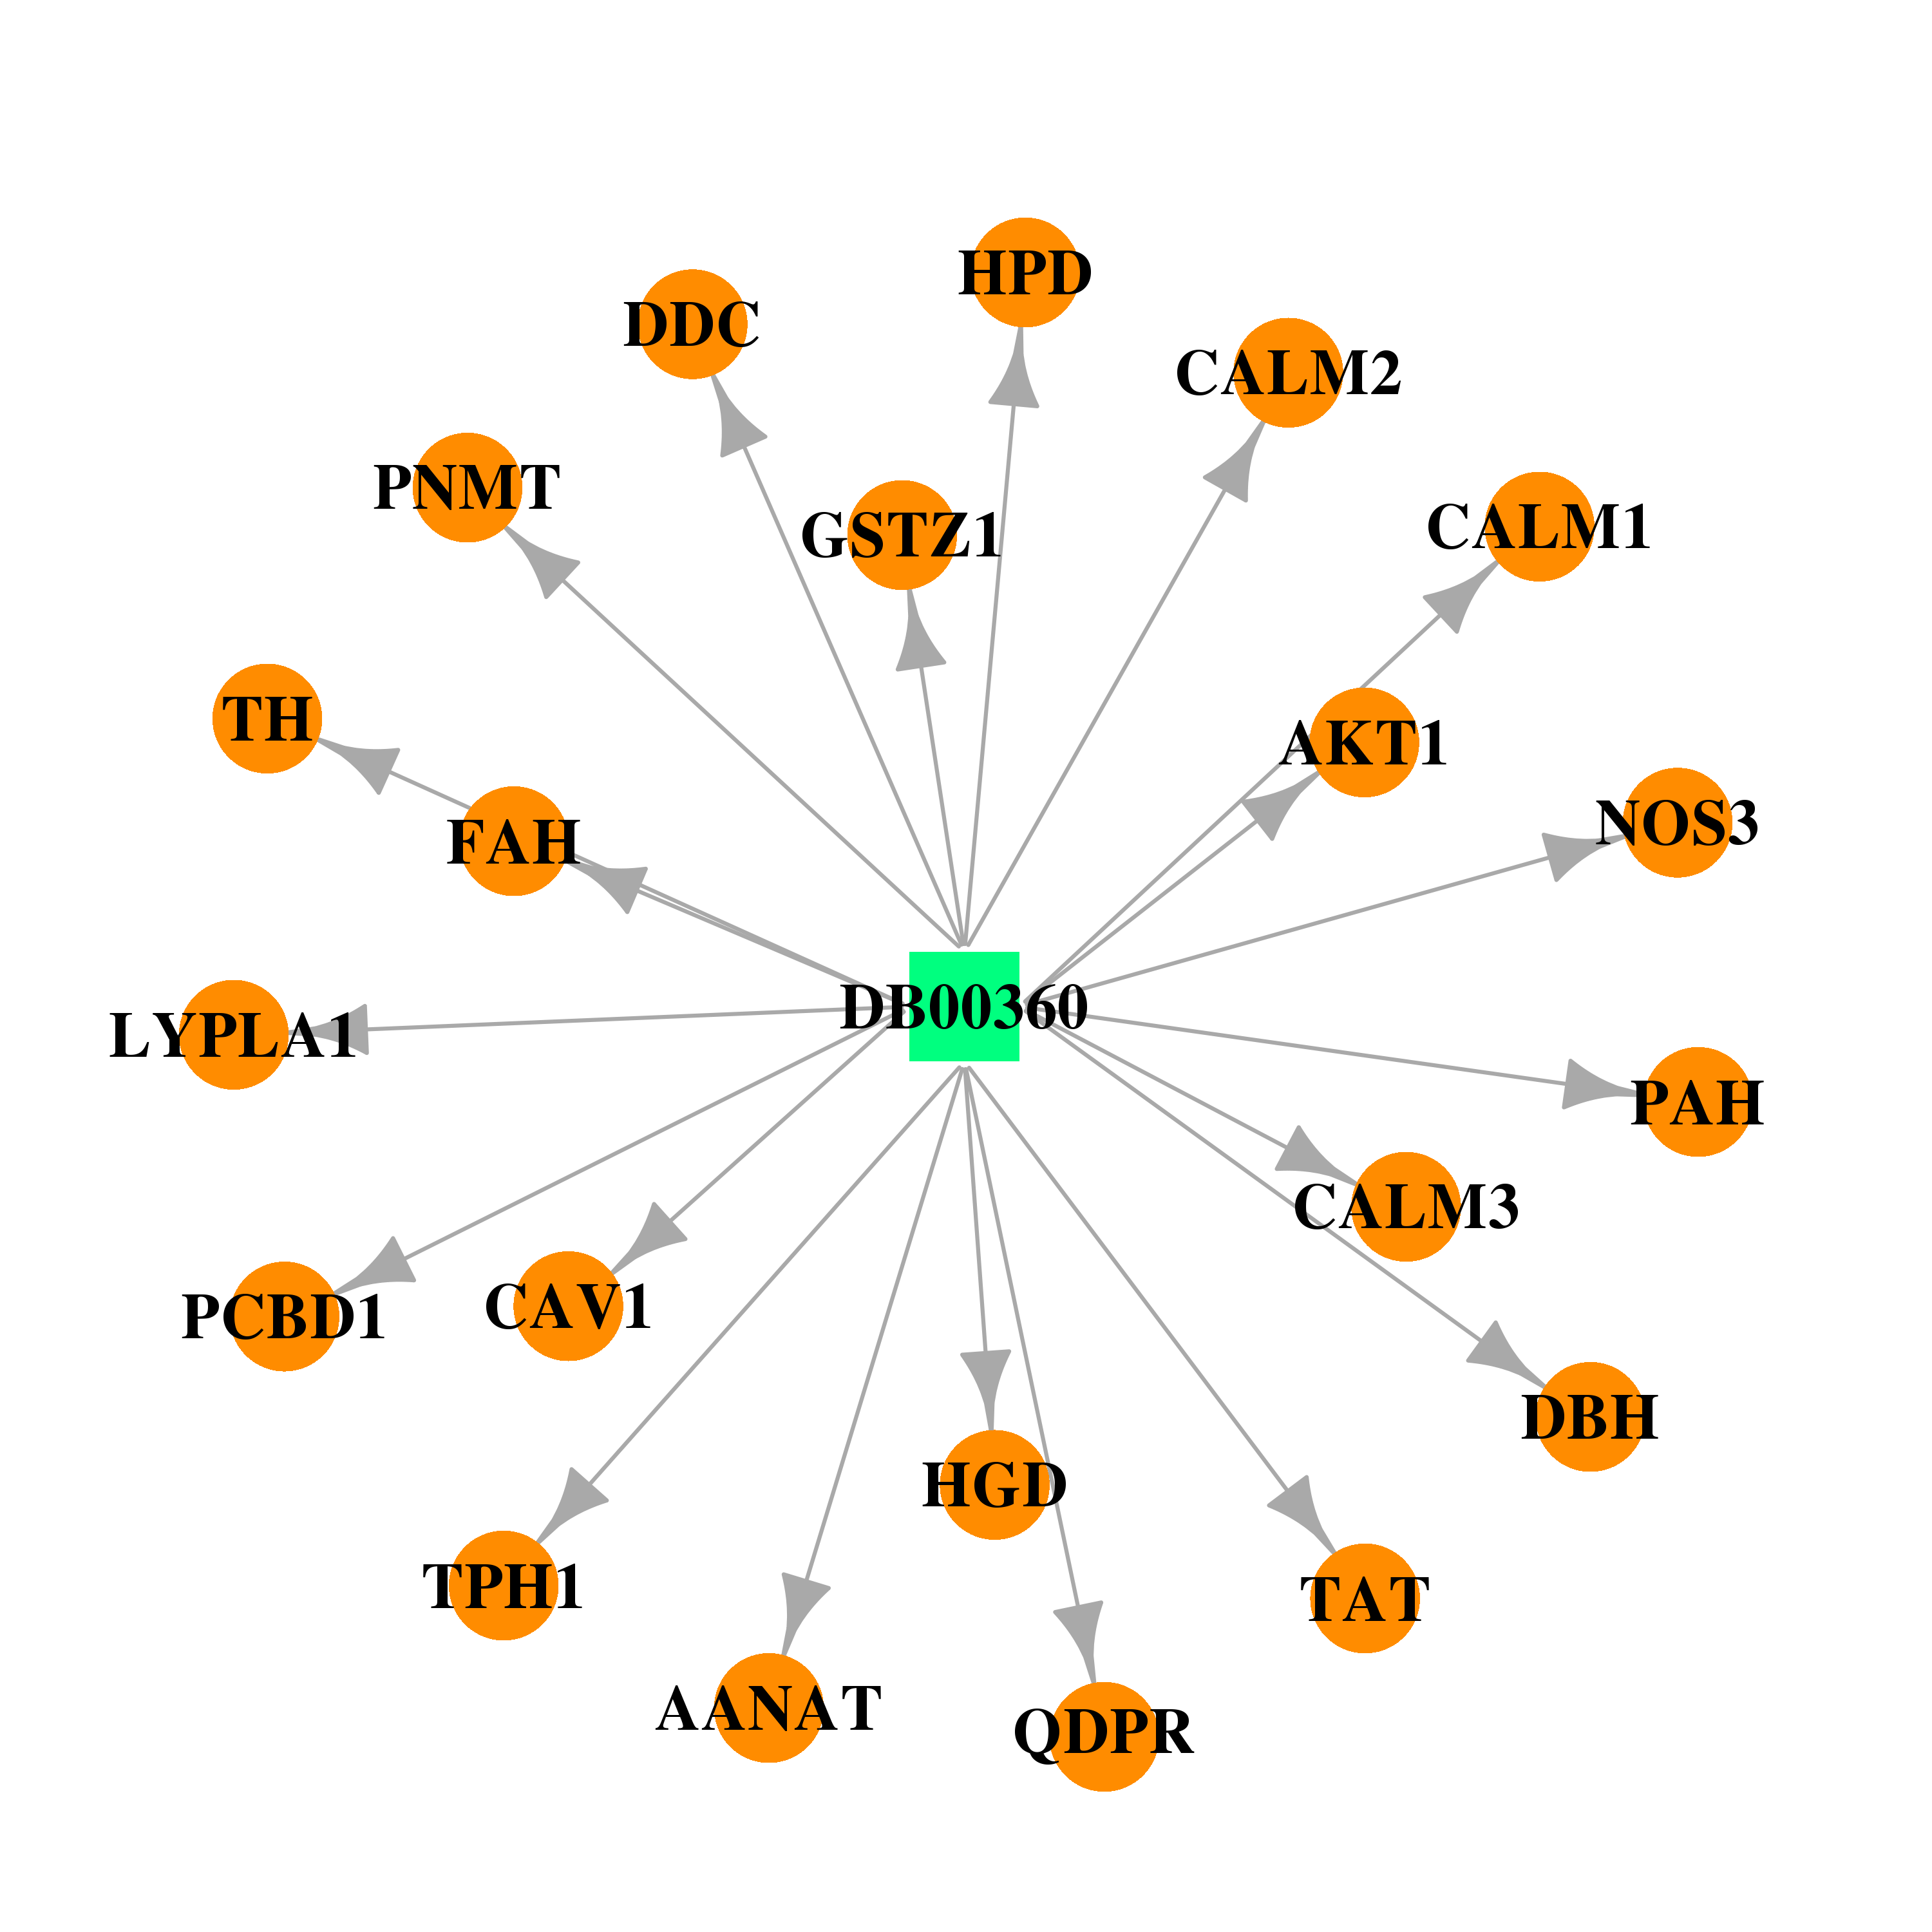 | 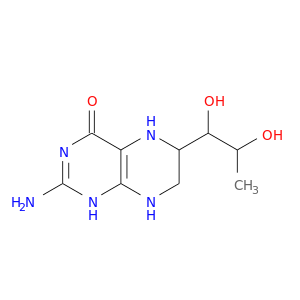 |
| DB00864 | calmodulin 3 (phosphorylase kinase, delta) | approved; investigational | Tacrolimus |  |  |
| DB00125 | calmodulin 3 (phosphorylase kinase, delta) | approved; nutraceutical | L-Arginine |  |  |
| DB00435 | calmodulin 3 (phosphorylase kinase, delta) | approved | Nitric Oxide | 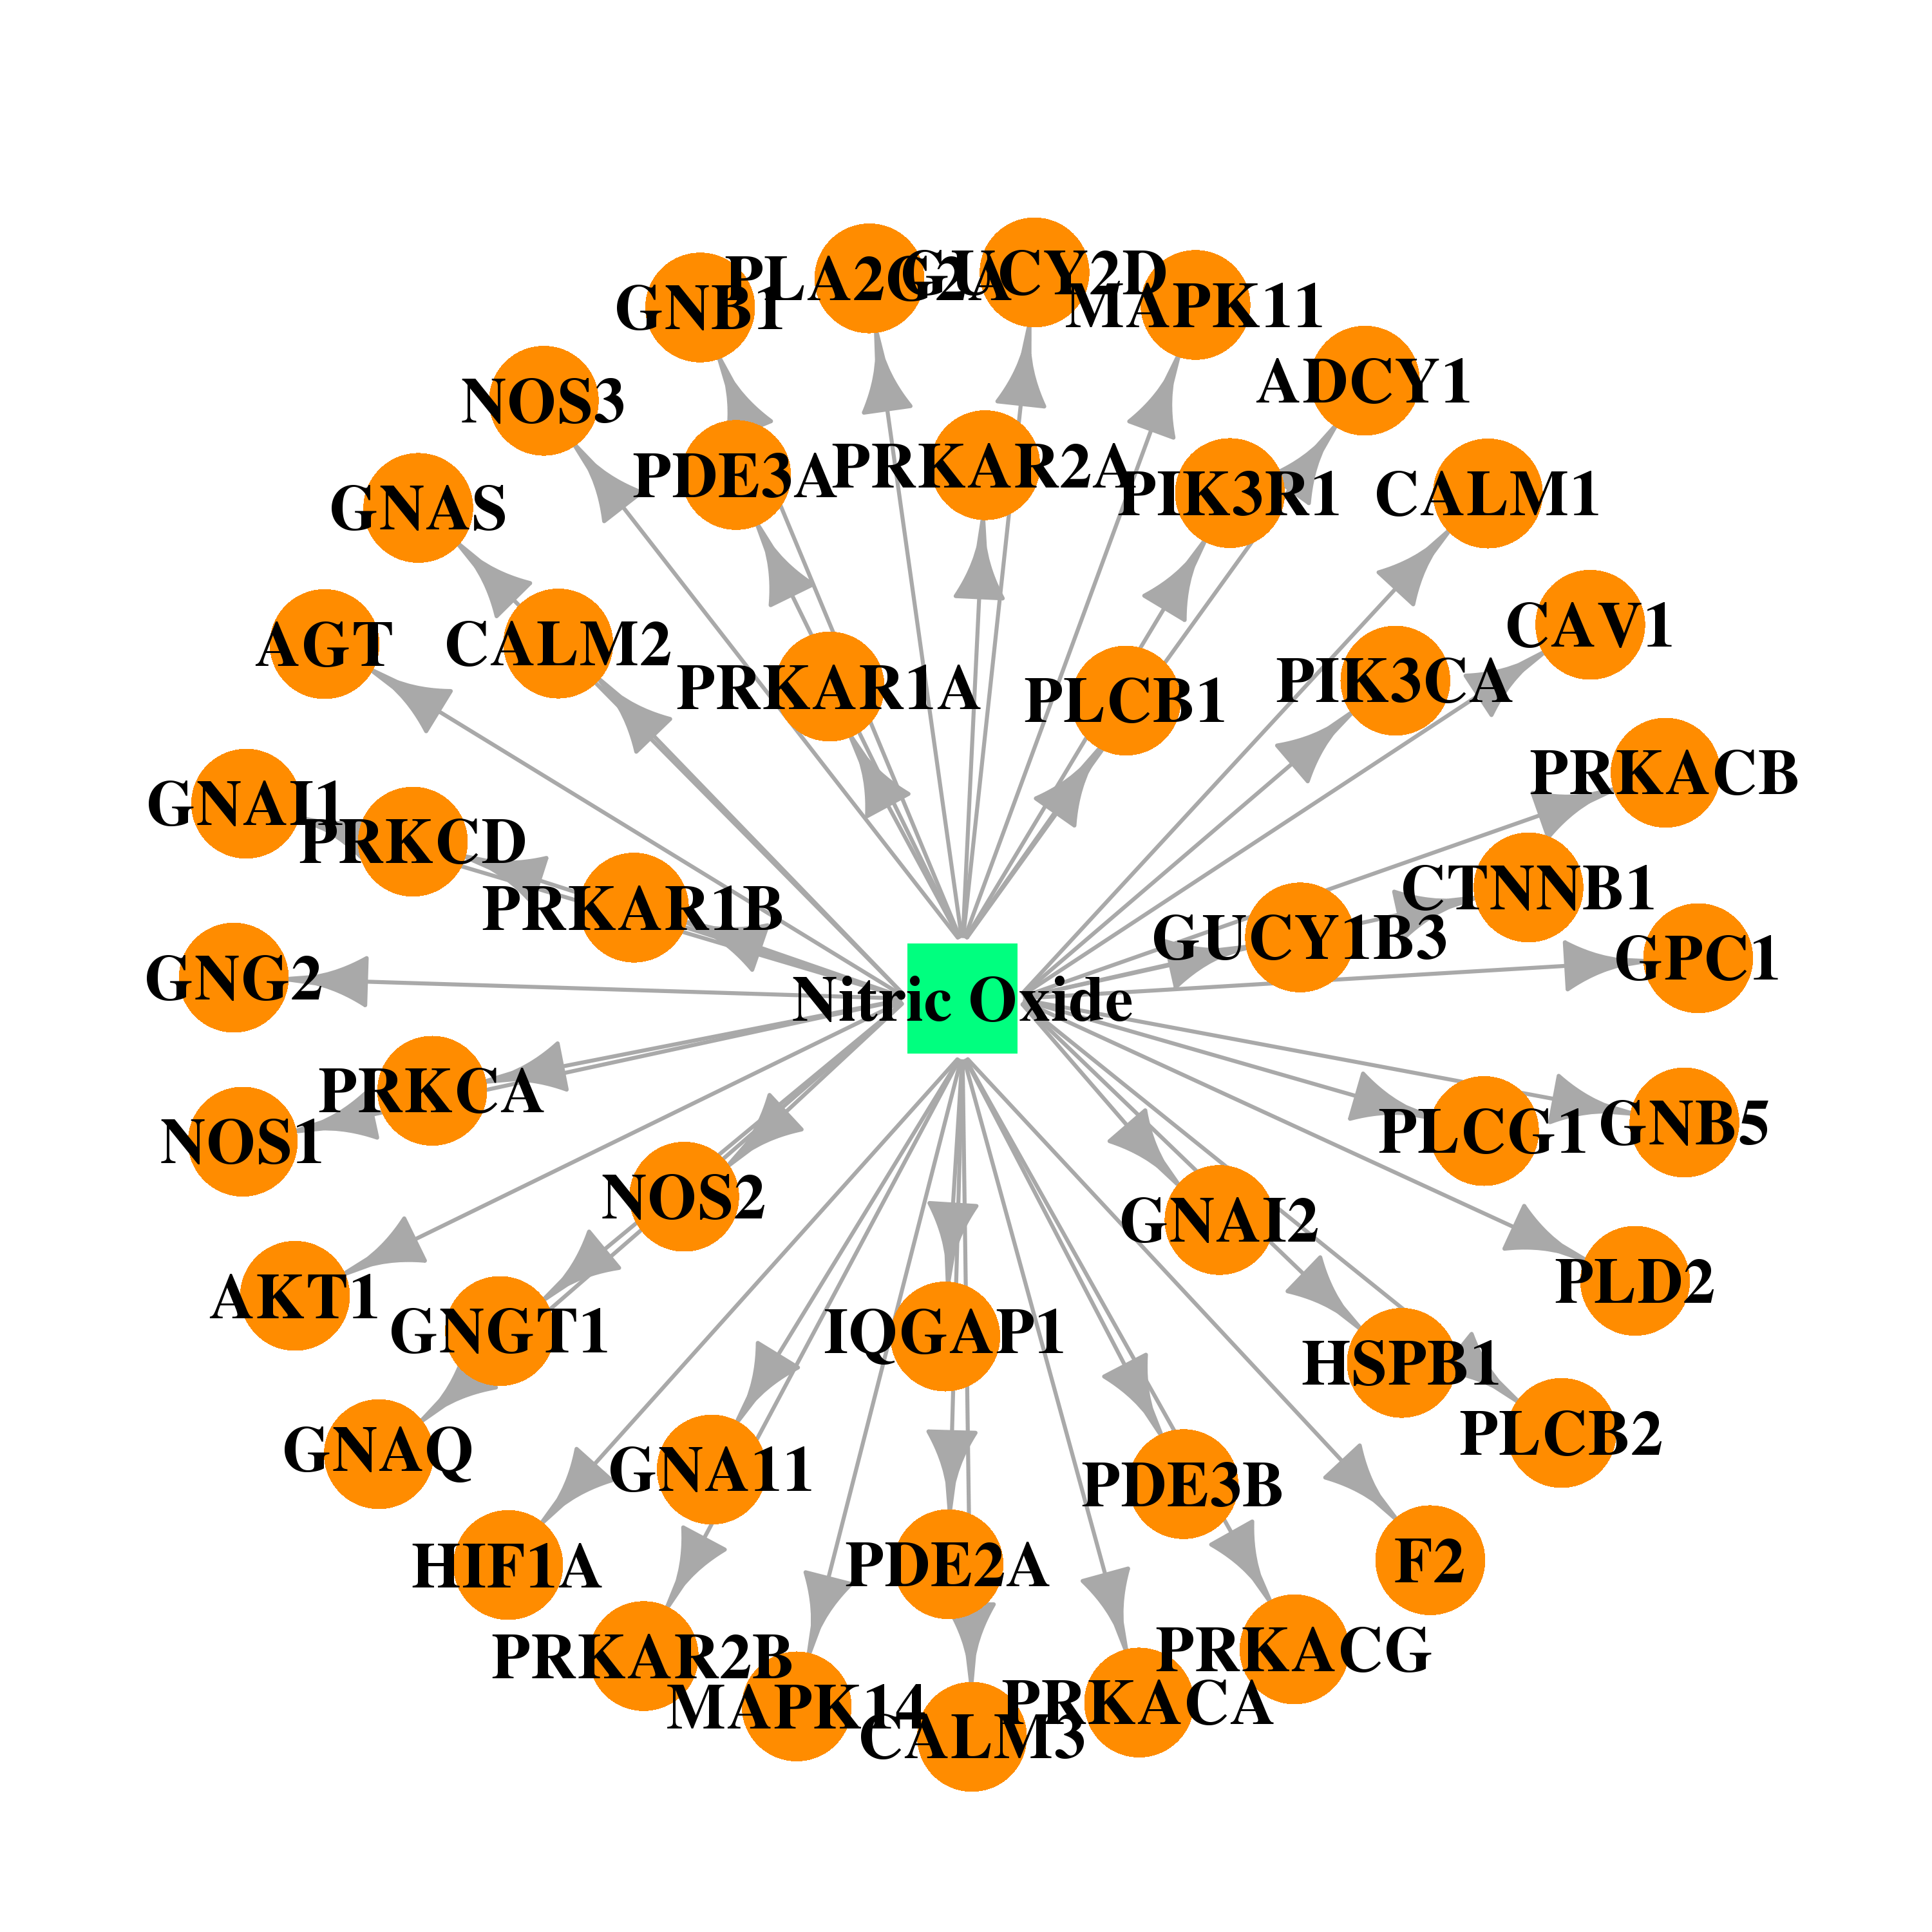 |  |
| Top |
| Cross referenced IDs for CALM3 |
| * We obtained these cross-references from Uniprot database. It covers 150 different DBs, 18 categories. http://www.uniprot.org/help/cross_references_section |
: Open all cross reference information
|
Copyright © 2016-Present - The Univsersity of Texas Health Science Center at Houston @ |