|
||||||||||||||||||||
| |
| Phenotypic Information (metabolism pathway, cancer, disease, phenome) |
| |
| |
| Gene-Gene Network Information: Co-Expression Network, Interacting Genes & KEGG |
| |
|


| Gene Summary for AAAS |
| Top |
| Phenotypic Information for AAAS(metabolism pathway, cancer, disease, phenome) |
| Cancer | CGAP: AAAS |
| Familial Cancer Database: AAAS | |
| * This gene is included in those cancer gene databases. |
|
|
|
|
|
| . | ||||||||||||||
Oncogene 1 | Significant driver gene in | |||||||||||||||||||
| cf) number; DB name 1 Oncogene; http://nar.oxfordjournals.org/content/35/suppl_1/D721.long, 2 Tumor Suppressor gene; https://bioinfo.uth.edu/TSGene/, 3 Cancer Gene Census; http://www.nature.com/nrc/journal/v4/n3/abs/nrc1299.html, 4 CancerGenes; http://nar.oxfordjournals.org/content/35/suppl_1/D721.long, 5 Network of Cancer Gene; http://ncg.kcl.ac.uk/index.php, 1Therapeutic Vulnerabilities in Cancer; http://cbio.mskcc.org/cancergenomics/statius/ |
| REACTOME_METABOLISM_OF_NON_CODING_RNA REACTOME_METABOLISM_OF_RNA REACTOME_METABOLISM_OF_CARBOHYDRATES | |
| OMIM | |
| Orphanet | |
| Disease | KEGG Disease: AAAS |
| MedGen: AAAS (Human Medical Genetics with Condition) | |
| ClinVar: AAAS | |
| Phenotype | MGI: AAAS (International Mouse Phenotyping Consortium) |
| PhenomicDB: AAAS | |
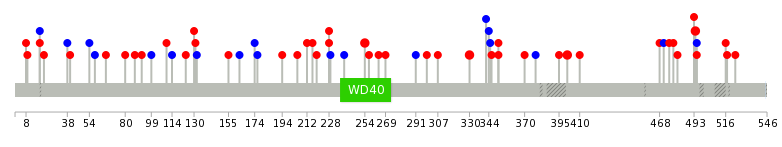
| Mutations for AAAS |
| * Under tables are showing count per each tissue to give us broad intuition about tissue specific mutation patterns.You can go to the detailed page for each mutation database's web site. |
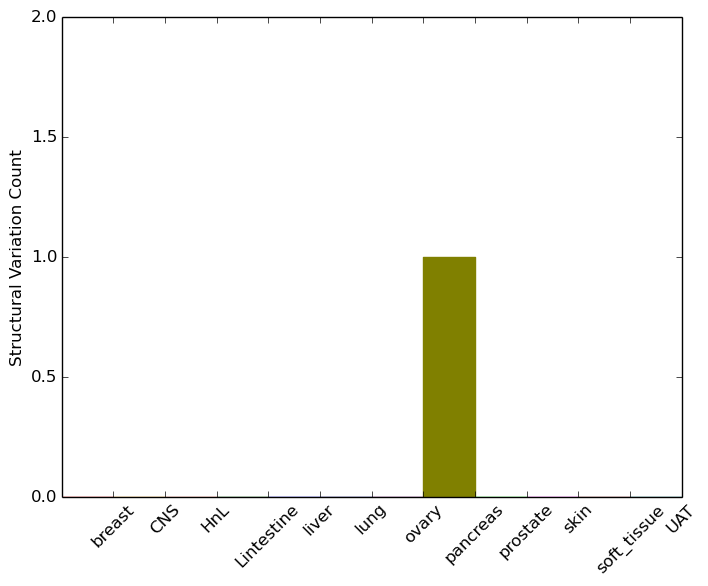
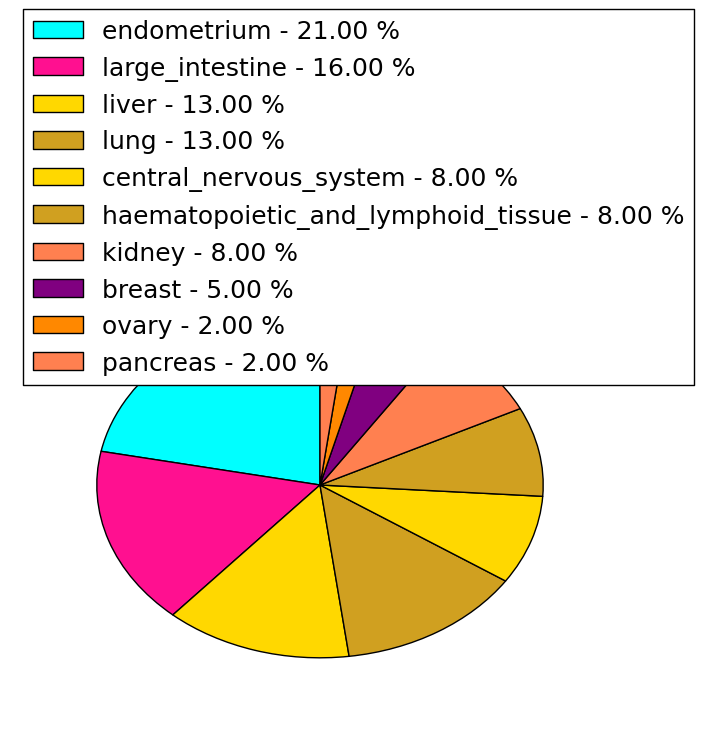
| - Statistics for Tissue and Mutation type | Top |
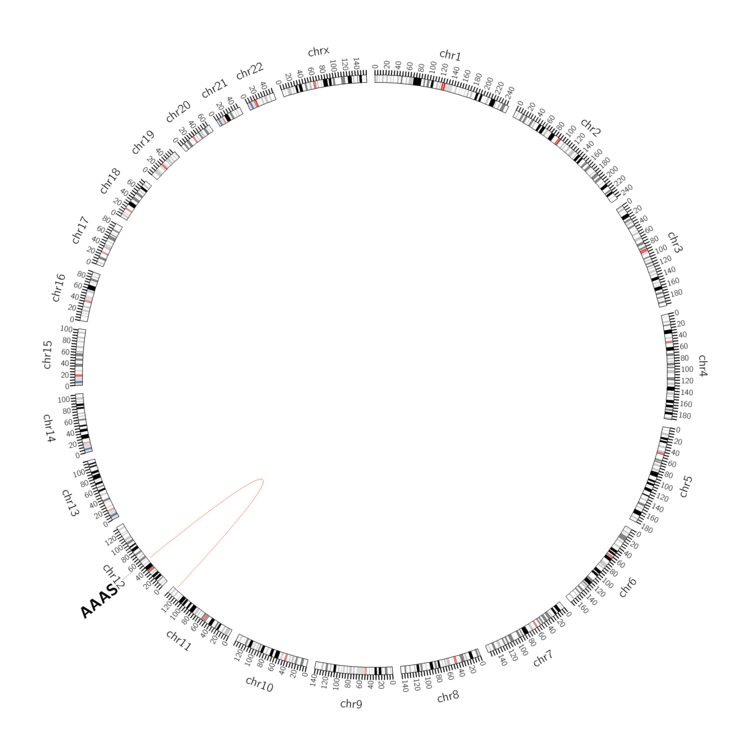 |
| - For Inter-chromosomal Variations |
| * Inter-chromosomal variantions includes 'interchromosomal amplicon to amplicon', 'interchromosomal amplicon to non-amplified dna', 'interchromosomal insertion', 'Interchromosomal unknown type'. |
 |
| - For Intra-chromosomal Variations |
| There's no intra-chromosomal structural variation. |
| Sample | Symbol_a | Chr_a | Start_a | End_a | Symbol_b | Chr_b | Start_b | End_b |
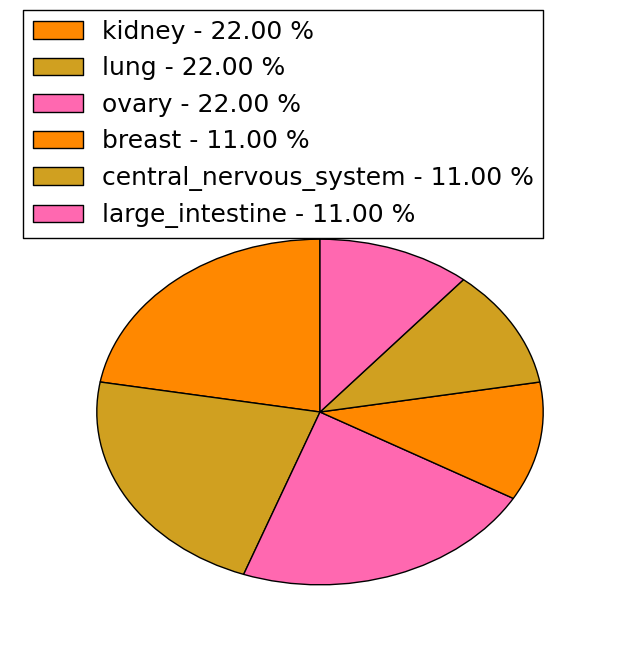
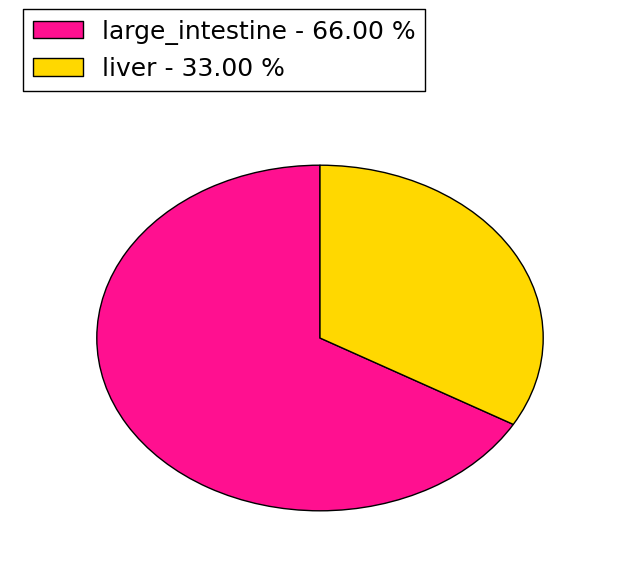
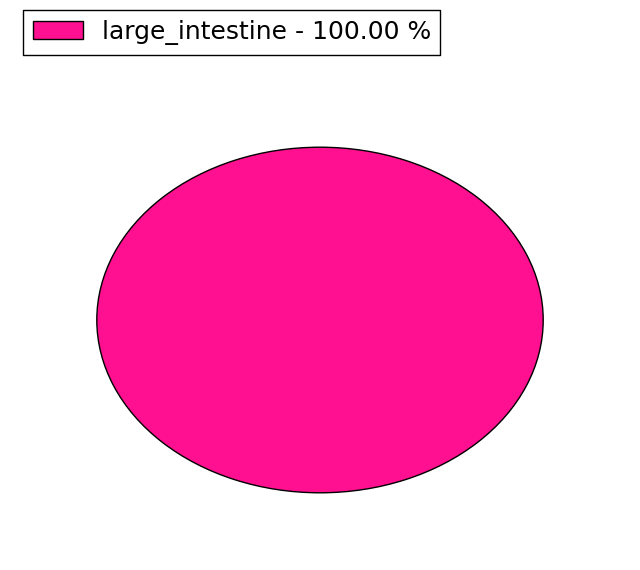
| cf) Tissue number; Tissue name (1;Breast, 2;Central_nervous_system, 3;Haematopoietic_and_lymphoid_tissue, 4;Large_intestine, 5;Liver, 6;Lung, 7;Ovary, 8;Pancreas, 9;Prostate, 10;Skin, 11;Soft_tissue, 12;Upper_aerodigestive_tract) |
| * From mRNA Sanger sequences, Chitars2.0 arranged chimeric transcripts. This table shows AAAS related fusion information. |
| ID | Head Gene | Tail Gene | Accession | Gene_a | qStart_a | qEnd_a | Chromosome_a | tStart_a | tEnd_a | Gene_a | qStart_a | qEnd_a | Chromosome_a | tStart_a | tEnd_a |
| AW205219 | AAAS | 17 | 67 | 12 | 53701240 | 53701290 | FKBP6 | 66 | 382 | 7 | 72738395 | 72738711 | |
| AI755186 | AAAS | 21 | 91 | 12 | 53701244 | 53701314 | C15orf39 | 84 | 406 | 15 | 75498882 | 75499204 | |
| AW794716 | AAAS | 26 | 324 | 12 | 53701363 | 53701914 | MAOB | 316 | 496 | X | 43626252 | 43626432 | |
| AI523835 | AAAS | 8 | 76 | 12 | 53701246 | 53701314 | ZNF414 | 72 | 491 | 19 | 8576625 | 8577581 | |
| BQ301032 | AAAS | 6 | 181 | 12 | 53714824 | 53715001 | KDM2A | 173 | 519 | 11 | 66901279 | 66901623 | |
| BQ327397 | ATP2A2 | 38 | 216 | 12 | 110783843 | 110784104 | AAAS | 201 | 569 | 12 | 53702079 | 53703008 | |
| Top |
| There's no copy number variation information in COSMIC data for this gene. |
| Top |
|
 |
| Top |
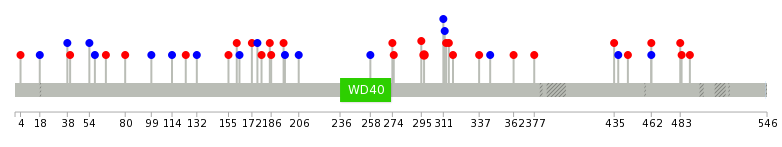
| Stat. for Non-Synonymous SNVs (# total SNVs=37) | (# total SNVs=9) |
 |  |
(# total SNVs=3) | (# total SNVs=1) |
 |  |
| Top |
| * When you move the cursor on each content, you can see more deailed mutation information on the Tooltip. Those are primary_site,primary_histology,mutation(aa),pubmedID. |
| GRCh37 position | Mutation(aa) | Unique sampleID count |
| chr12:53703424-53703424 | p.R258fs*33 | 2 |
| chr12:53703435-53703435 | p.P254S | 2 |
| chr12:53702751-53702751 | p.R330H | 2 |
| chr12:53702114-53702114 | p.S401T | 2 |
| chr12:53701433-53701433 | p.F494C | 2 |
| chr12:53702545-53702545 | p.P351S | 1 |
| chr12:53709127-53709127 | p.H131Y | 1 |
| chr12:53703404-53703404 | p.P264L | 1 |
| chr12:53714403-53714403 | p.R66I | 1 |
| chr12:53701632-53701632 | p.S471S | 1 |
| Top |
|
 |
| Point Mutation/ Tissue ID | 1 | 2 | 3 | 4 | 5 | 6 | 7 | 8 | 9 | 10 | 11 | 12 | 13 | 14 | 15 | 16 | 17 | 18 | 19 | 20 |
| # sample | 3 | 4 | 1 | 3 | 3 | 4 | 2 | 1 | 6 | 5 | 6 | |||||||||
| # mutation | 3 | 4 | 1 | 4 | 3 | 4 | 2 | 1 | 12 | 5 | 6 | |||||||||
| nonsynonymous SNV | 2 | 3 | 4 | 1 | 3 | 1 | 4 | 4 | 6 | |||||||||||
| synonymous SNV | 1 | 1 | 1 | 2 | 1 | 1 | 1 | 8 | 1 |
| cf) Tissue ID; Tissue type (1; BLCA[Bladder Urothelial Carcinoma], 2; BRCA[Breast invasive carcinoma], 3; CESC[Cervical squamous cell carcinoma and endocervical adenocarcinoma], 4; COAD[Colon adenocarcinoma], 5; GBM[Glioblastoma multiforme], 6; Glioma Low Grade, 7; HNSC[Head and Neck squamous cell carcinoma], 8; KICH[Kidney Chromophobe], 9; KIRC[Kidney renal clear cell carcinoma], 10; KIRP[Kidney renal papillary cell carcinoma], 11; LAML[Acute Myeloid Leukemia], 12; LUAD[Lung adenocarcinoma], 13; LUSC[Lung squamous cell carcinoma], 14; OV[Ovarian serous cystadenocarcinoma ], 15; PAAD[Pancreatic adenocarcinoma], 16; PRAD[Prostate adenocarcinoma], 17; SKCM[Skin Cutaneous Melanoma], 18:STAD[Stomach adenocarcinoma], 19:THCA[Thyroid carcinoma], 20:UCEC[Uterine Corpus Endometrial Carcinoma]) |
| Top |
| * We represented just top 10 SNVs. When you move the cursor on each content, you can see more deailed mutation information on the Tooltip. Those are primary_site, primary_histology, mutation(aa), pubmedID. |
| Genomic Position | Mutation(aa) | Unique sampleID count |
| chr12:53702751 | p.R297H,AAAS | 2 |
| chr12:53702957 | p.T313I,AAAS | 1 |
| chr12:53708591 | p.R176R | 1 |
| chr12:53702266 | p.F312F,AAAS | 1 |
| chr12:53715136 | p.T163T | 1 |
| chr12:53703003 | p.P490Q,AAAS | 1 |
| chr12:53701346 | p.L311L,AAAS | 1 |
| chr12:53708616 | p.R155L | 1 |
| chr12:53702291 | p.L484F,AAAS | 1 |
| chr12:53715196 | p.L132L,AAAS | 1 |
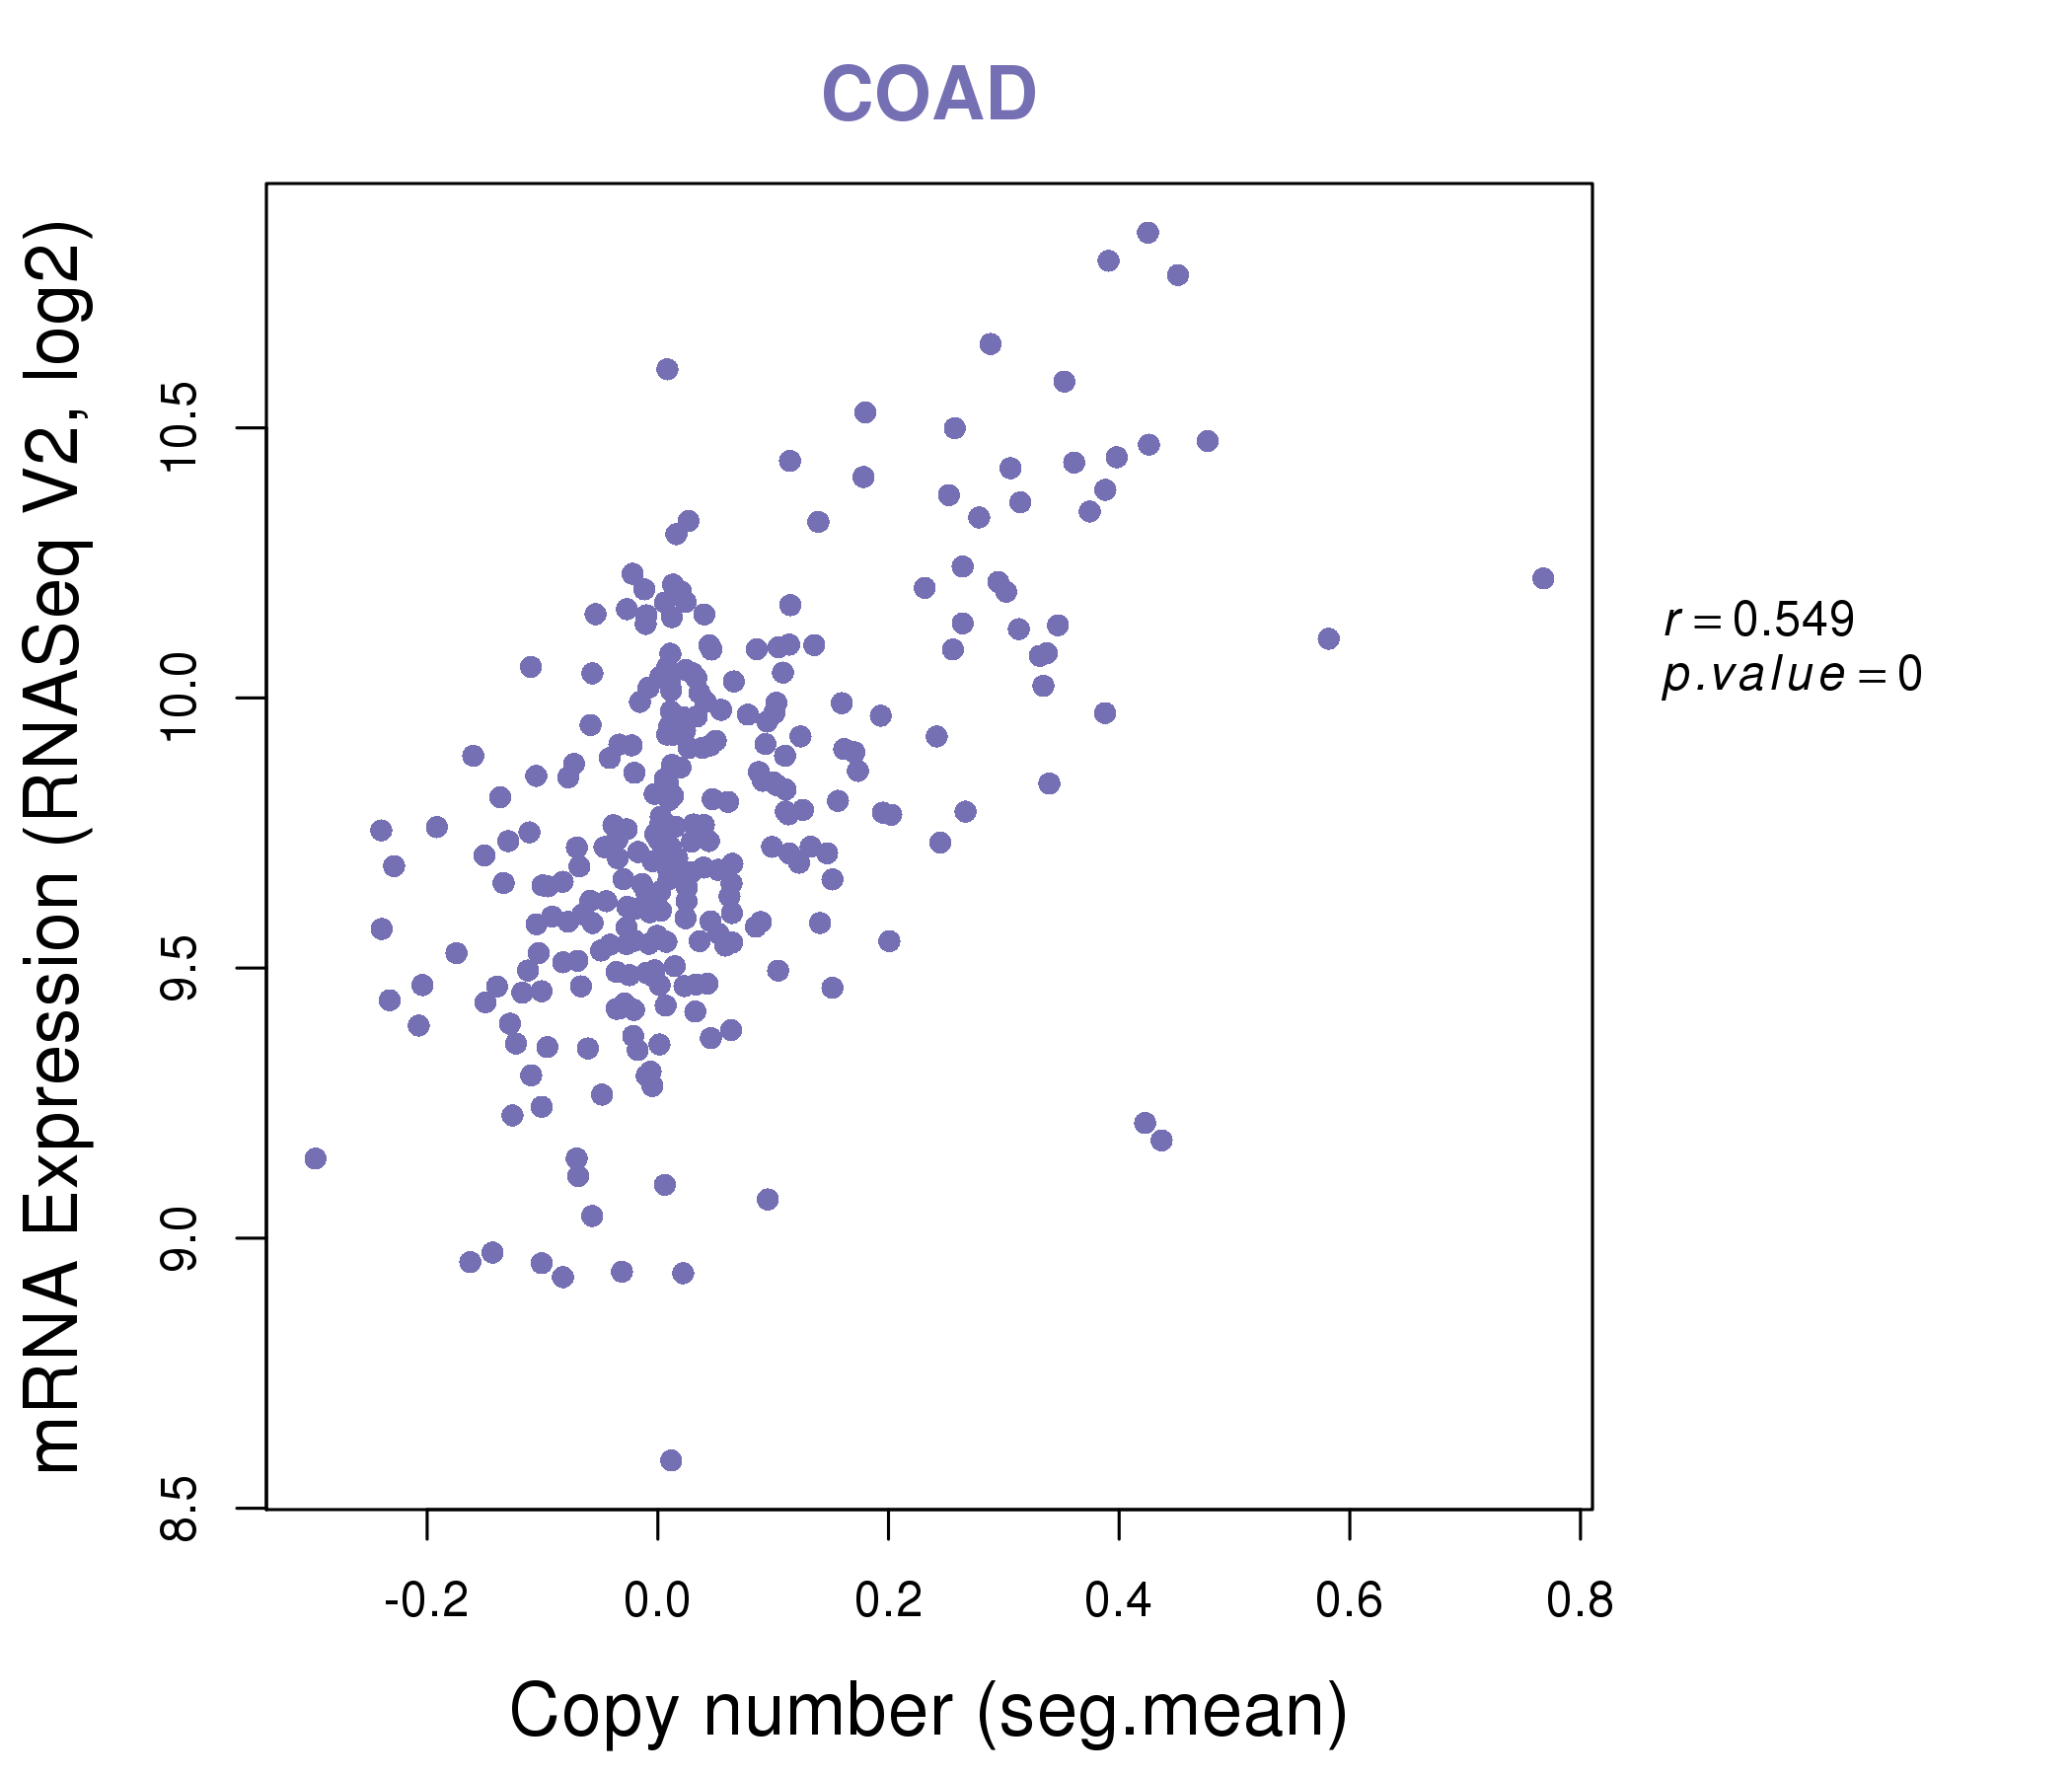
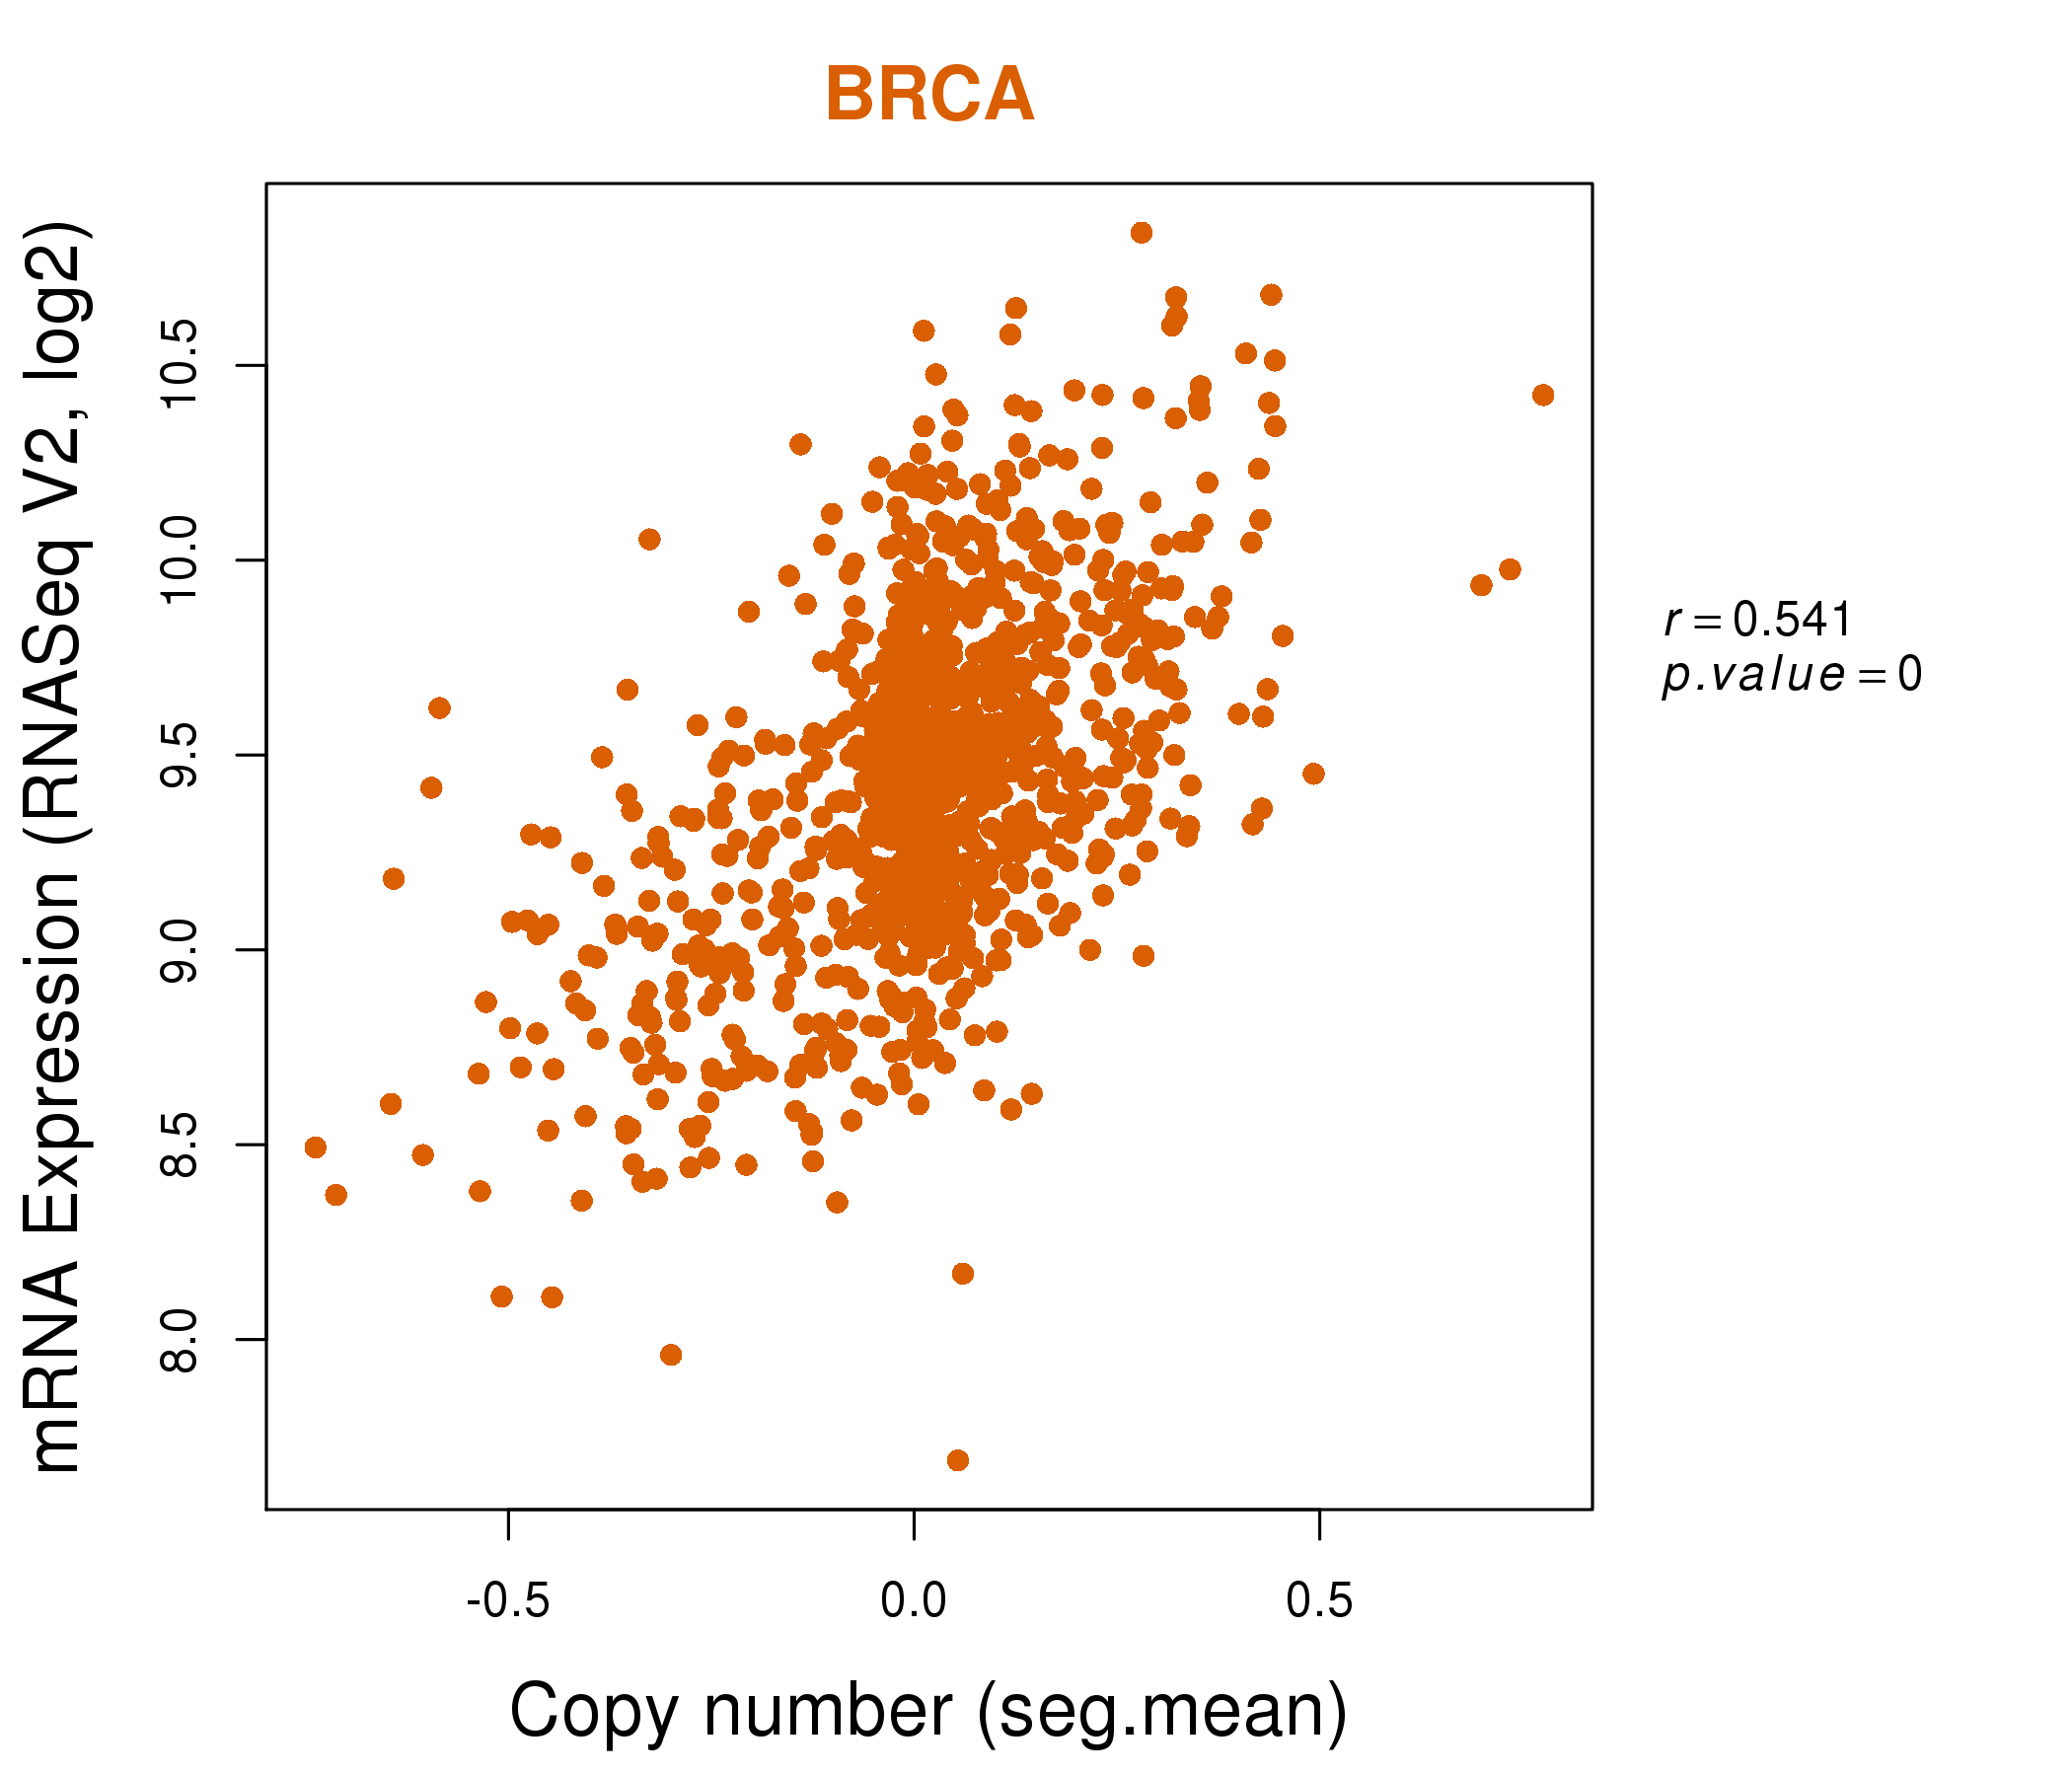
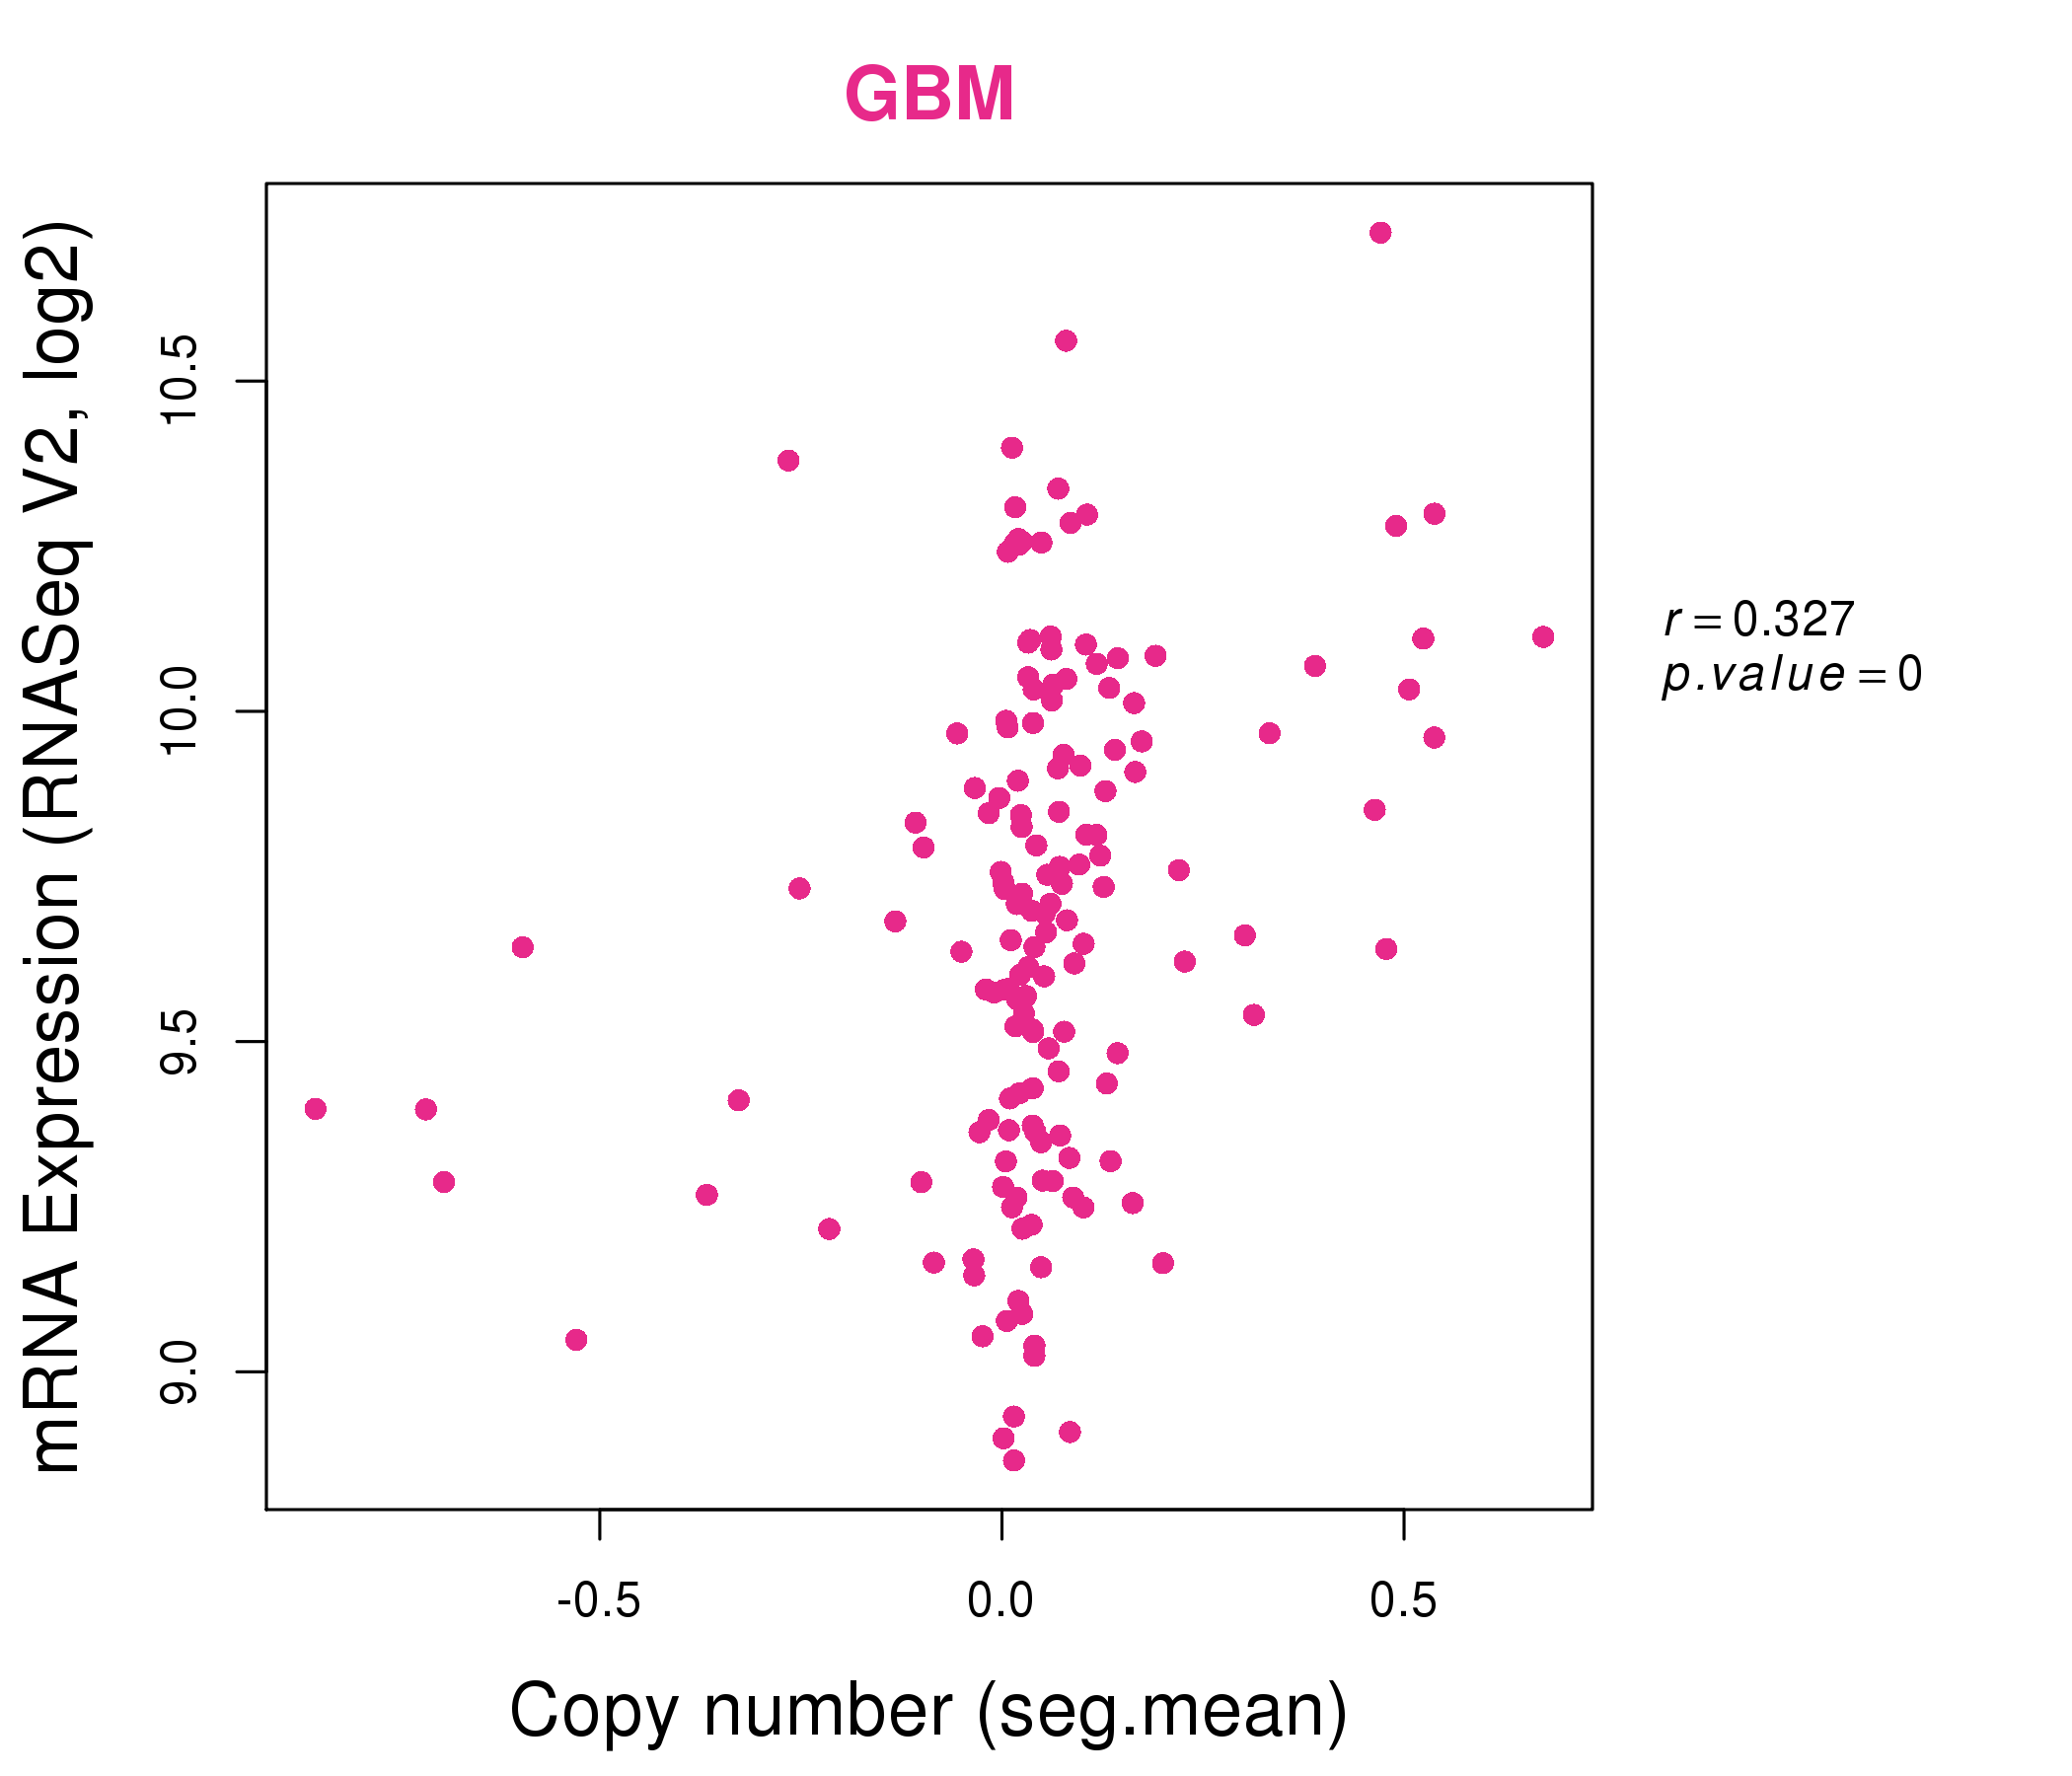
| * Copy number data were extracted from TCGA using R package TCGA-Assembler. The URLs of all public data files on TCGA DCC data server were gathered on Jan-05-2015. Function ProcessCNAData in TCGA-Assembler package was used to obtain gene-level copy number value which is calculated as the average copy number of the genomic region of a gene. |
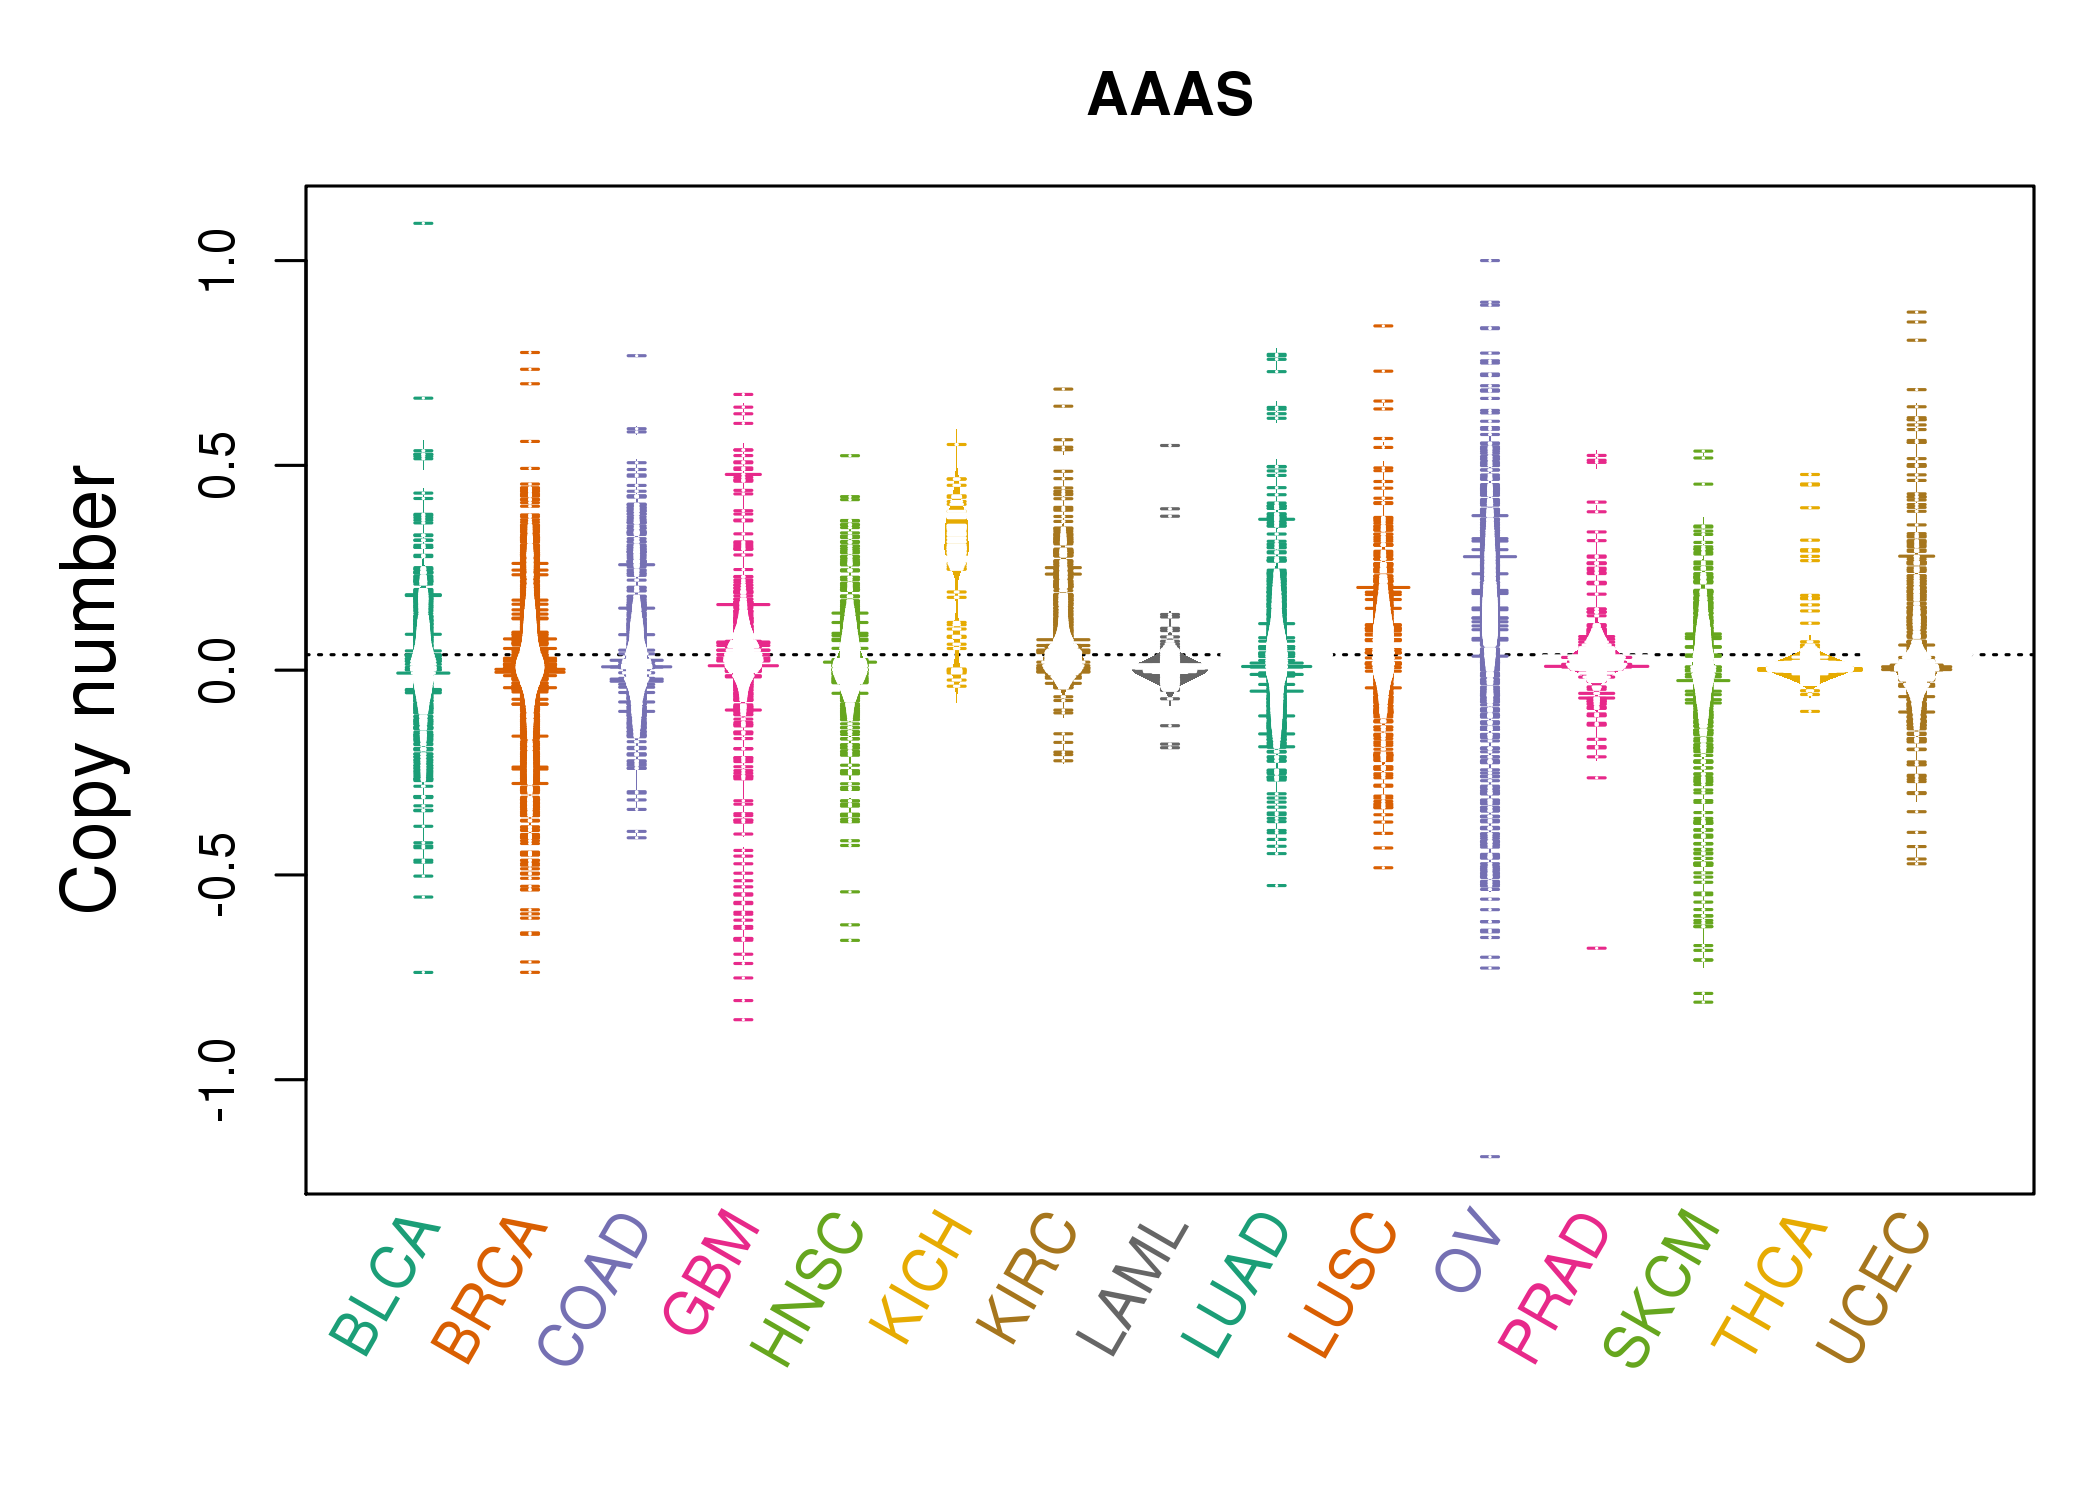 |
| cf) Tissue ID[Tissue type]: BLCA[Bladder Urothelial Carcinoma], BRCA[Breast invasive carcinoma], CESC[Cervical squamous cell carcinoma and endocervical adenocarcinoma], COAD[Colon adenocarcinoma], GBM[Glioblastoma multiforme], Glioma Low Grade, HNSC[Head and Neck squamous cell carcinoma], KICH[Kidney Chromophobe], KIRC[Kidney renal clear cell carcinoma], KIRP[Kidney renal papillary cell carcinoma], LAML[Acute Myeloid Leukemia], LUAD[Lung adenocarcinoma], LUSC[Lung squamous cell carcinoma], OV[Ovarian serous cystadenocarcinoma ], PAAD[Pancreatic adenocarcinoma], PRAD[Prostate adenocarcinoma], SKCM[Skin Cutaneous Melanoma], STAD[Stomach adenocarcinoma], THCA[Thyroid carcinoma], UCEC[Uterine Corpus Endometrial Carcinoma] |
| Top |
| Gene Expression for AAAS |
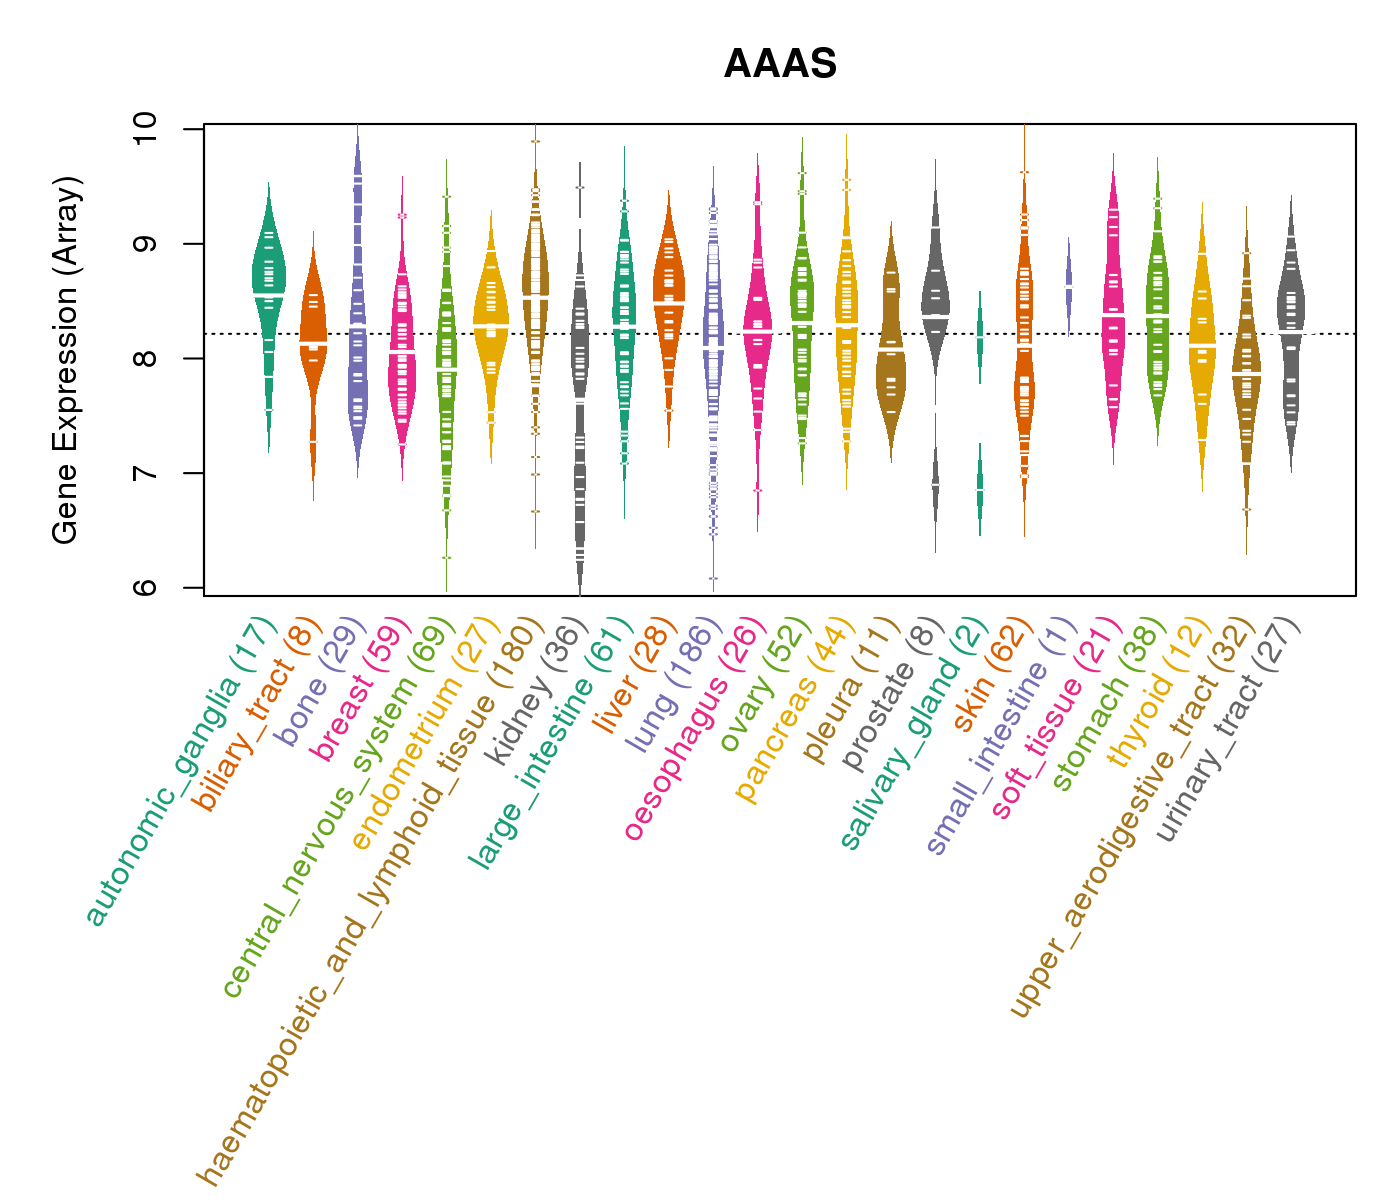
| * CCLE gene expression data were extracted from CCLE_Expression_Entrez_2012-10-18.res: Gene-centric RMA-normalized mRNA expression data. |
 |
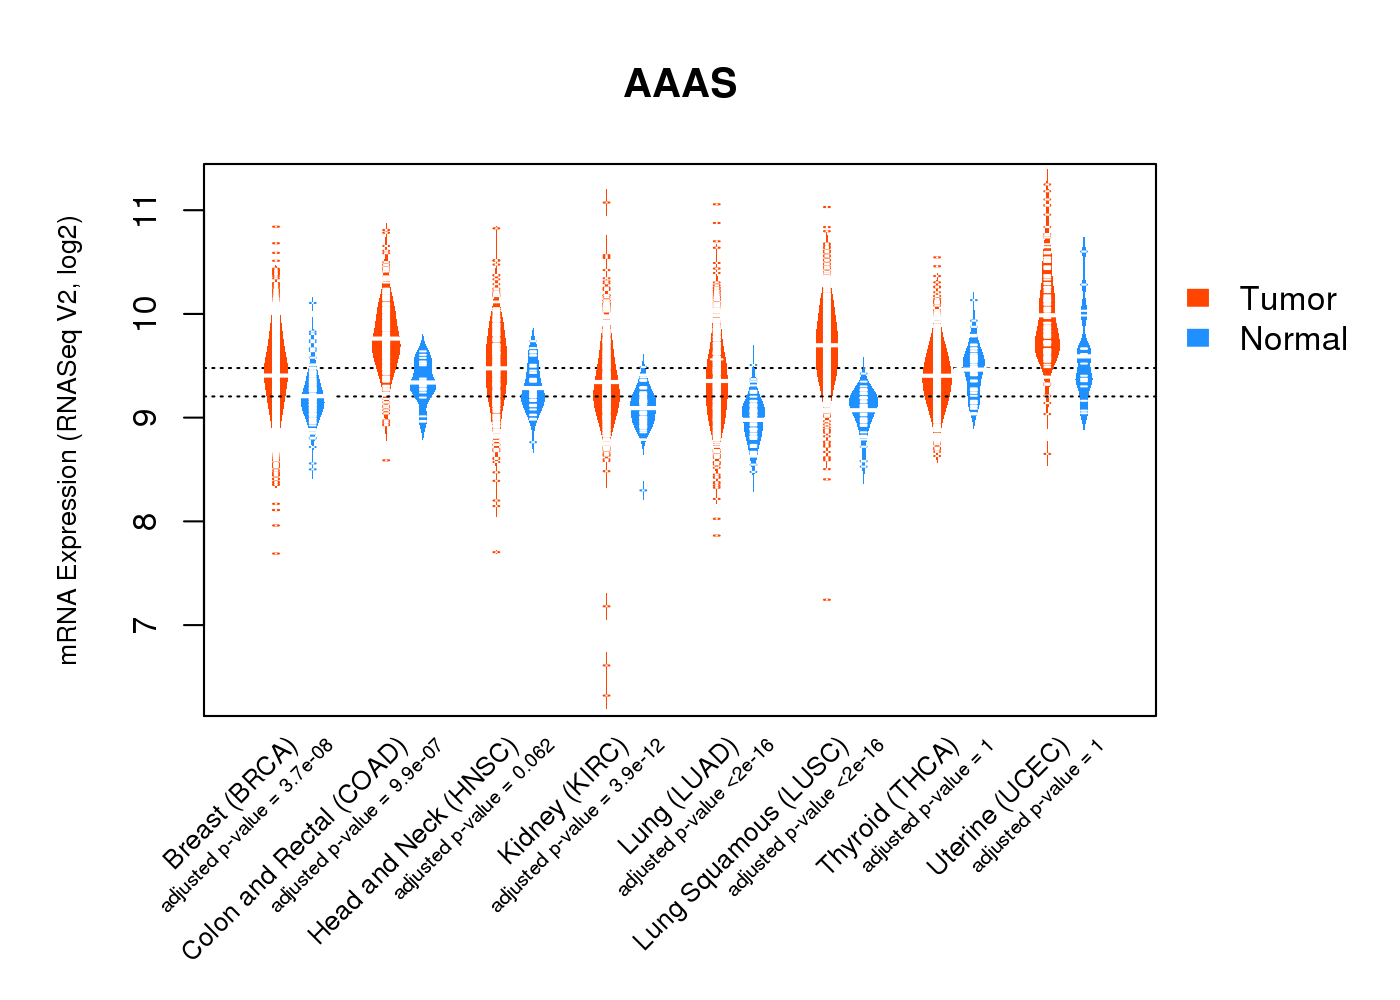
| * Normalized gene expression data of RNASeqV2 was extracted from TCGA using R package TCGA-Assembler. The URLs of all public data files on TCGA DCC data server were gathered at Jan-05-2015. Only eight cancer types have enough normal control samples for differential expression analysis. (t test, adjusted p<0.05 (using Benjamini-Hochberg FDR)) |
 |
| Top |
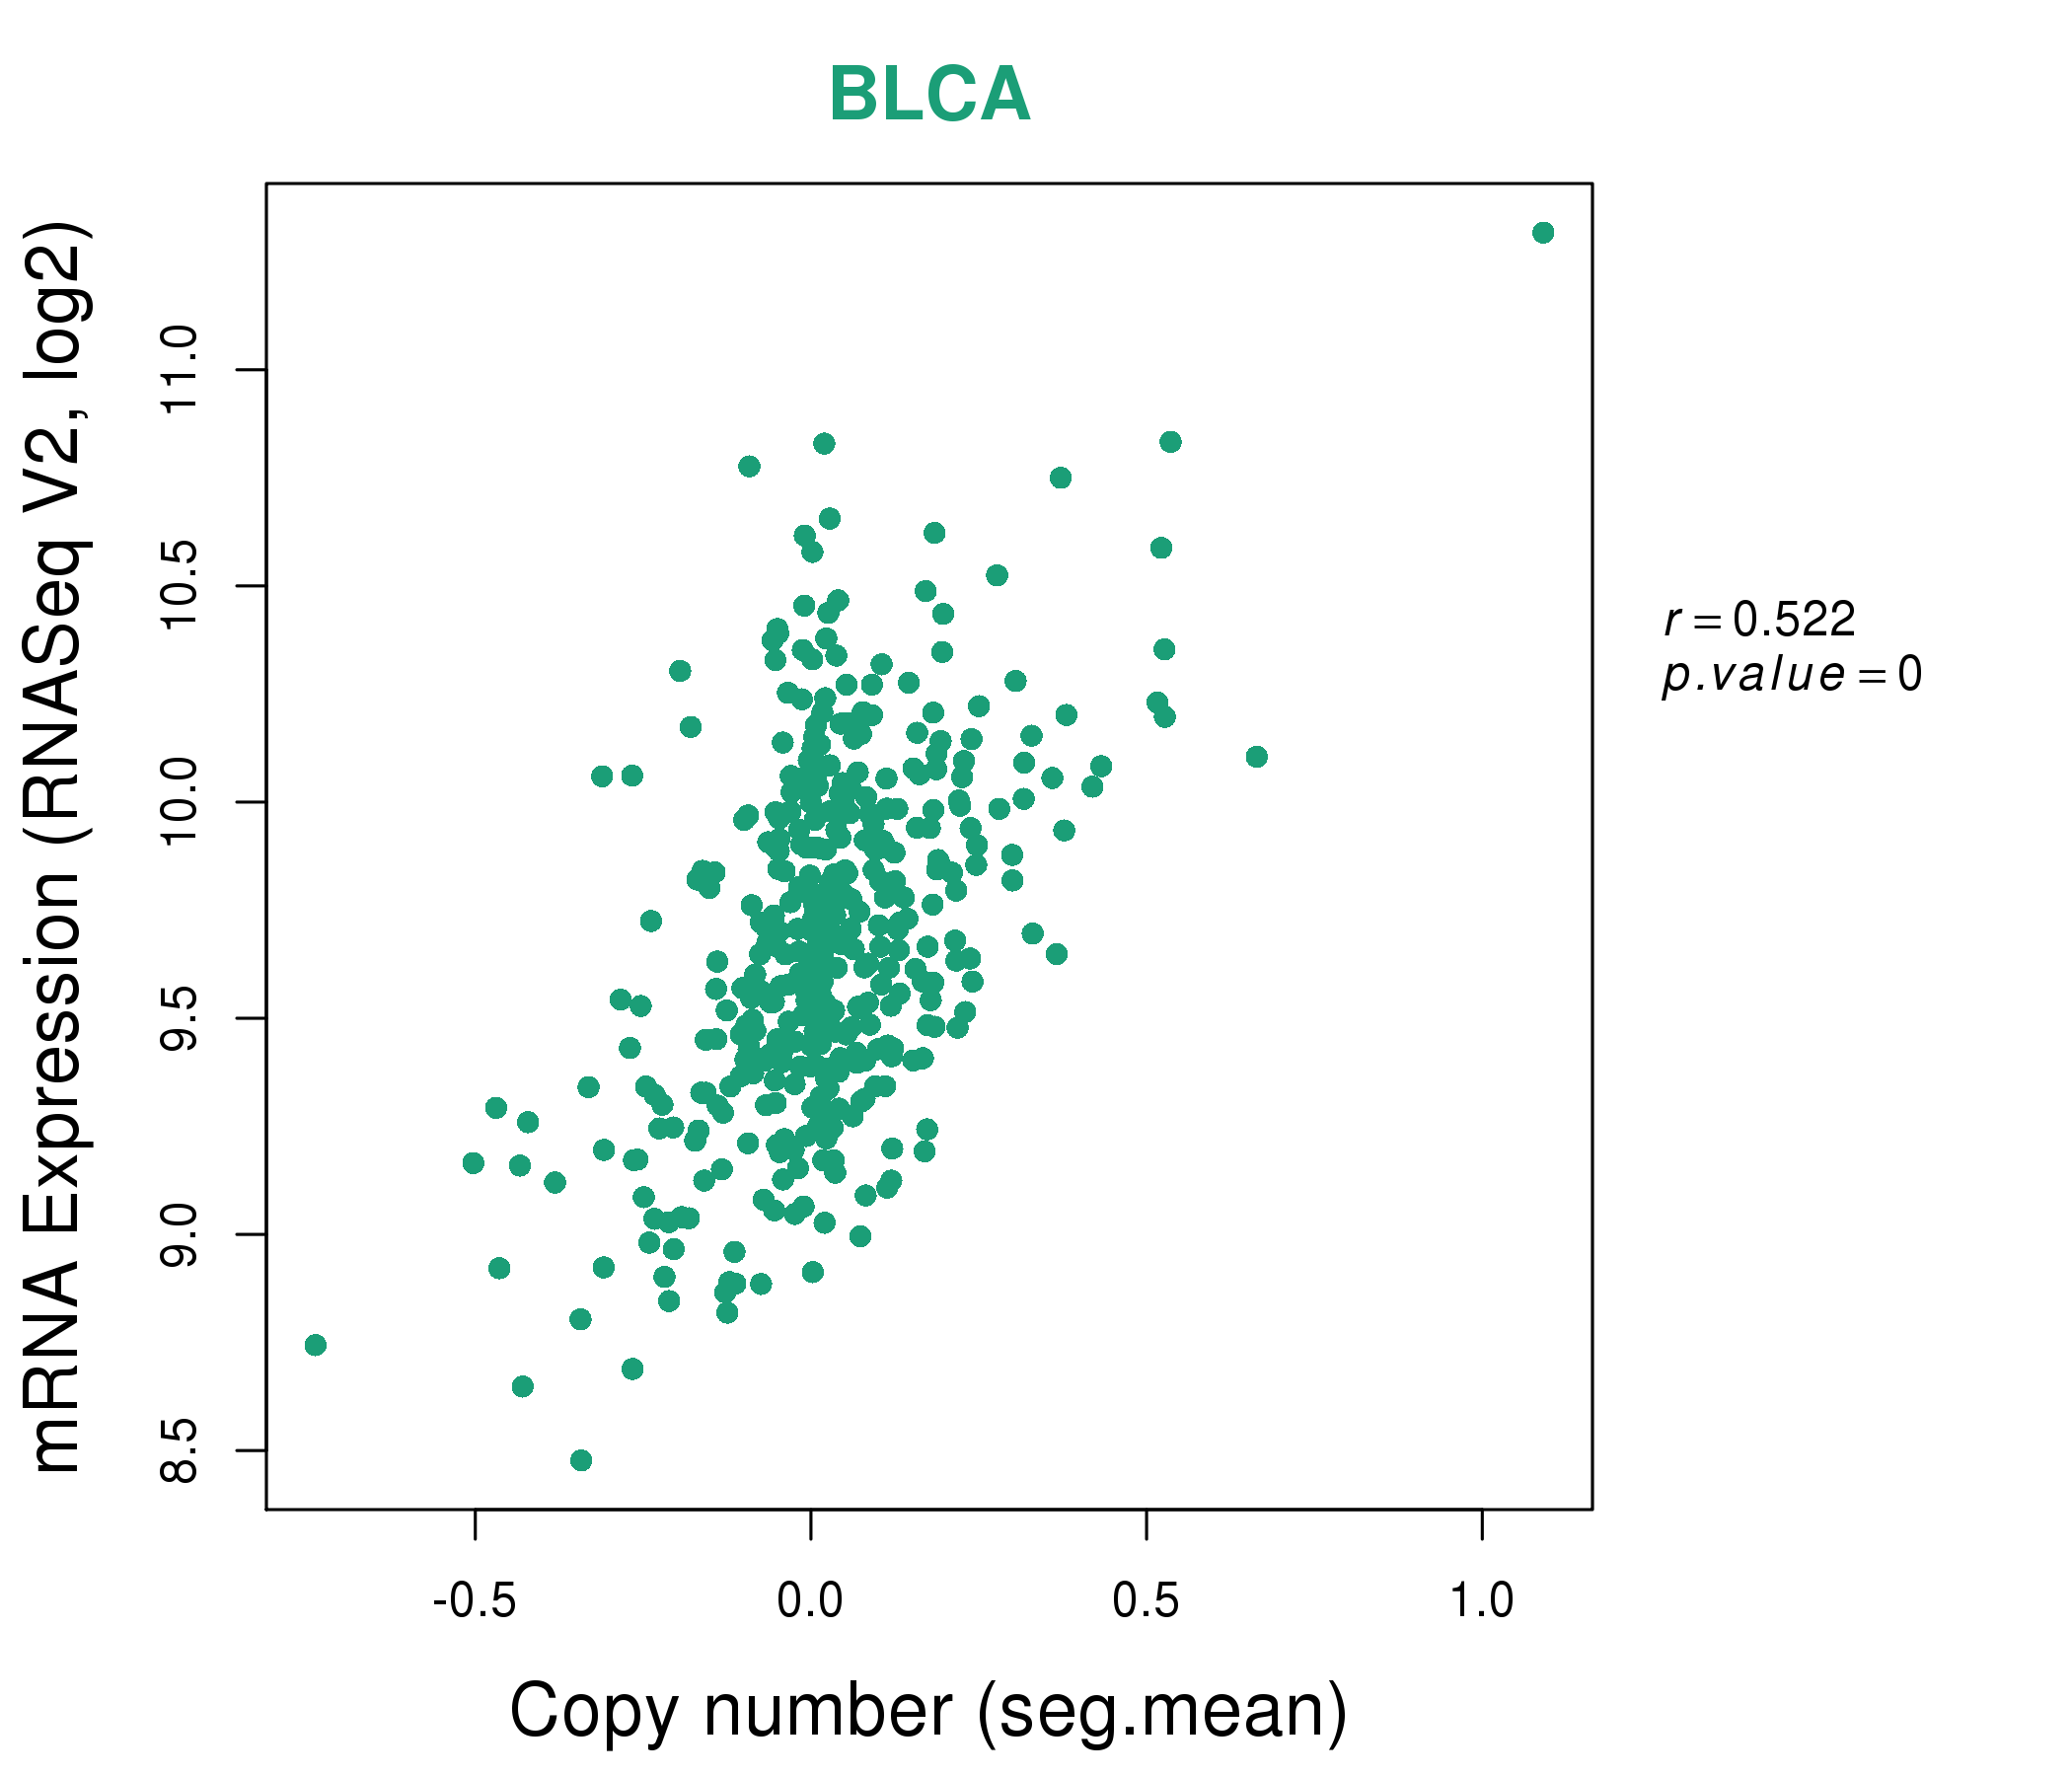
| * This plots show the correlation between CNV and gene expression. |
: Open all plots for all cancer types
 |
|
 |
|
| Top |
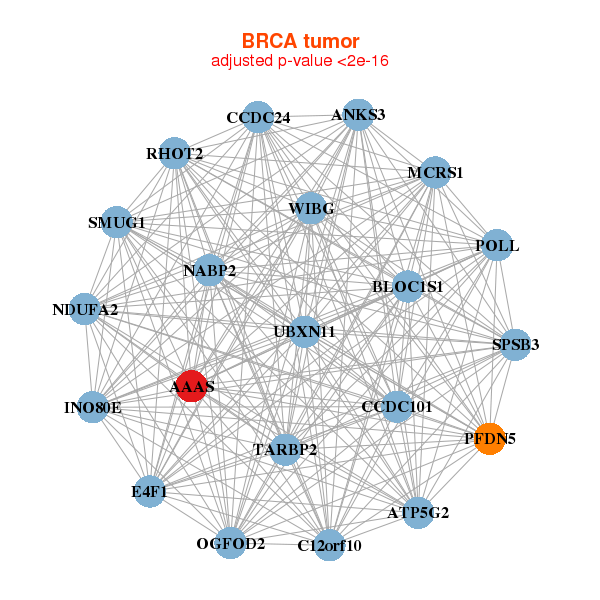
| Gene-Gene Network Information |
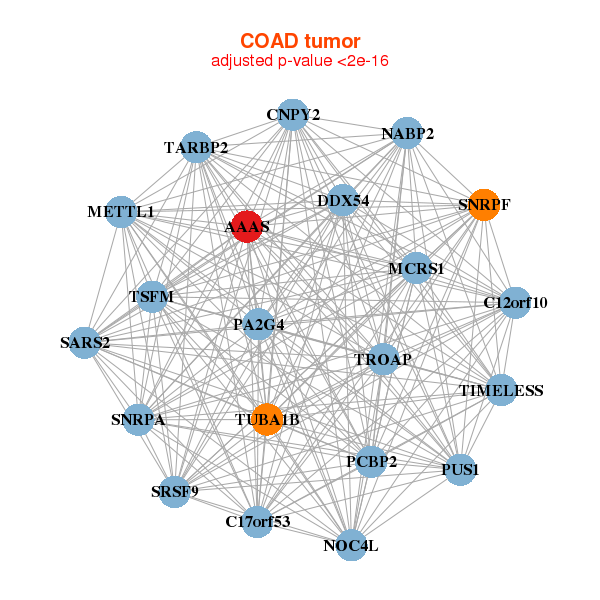
| * Co-Expression network figures were drawn using R package igraph. Only the top 20 genes with the highest correlations were shown. Red circle: input gene, orange circle: cell metabolism gene, sky circle: other gene |
: Open all plots for all cancer types
 |
|
| AAAS,ANKS3,ATP5G2,BLOC1S1,C12orf10,CCDC101,CCDC24, E4F1,INO80E,MCRS1,NDUFA2,NABP2,OGFOD2,PFDN5, POLL,RHOT2,SMUG1,SPSB3,TARBP2,UBXN11,WIBG | AAAS,CARKD,CCDC22,COQ4,CPSF3L,DDX41,DDX56, DMAP1,DNAJC4,DRG2,ERCC1,HMG20B,NPRL2,POMT1, PTOV1,TMEM161A,TMEM186,WBP1,WRAP53,XAB2,ZFYVE19 |
 |
|
| AAAS,C12orf10,C17orf53,CNPY2,DDX54,MCRS1,METTL1, NOC4L,NABP2,PA2G4,PCBP2,PUS1,SARS2,SRSF9, SNRPA,SNRPF,TARBP2,TIMELESS,TROAP,TSFM,TUBA1B | AAAS,ACAD9,C17orf53,ARHGEF39,CDH24,CHTF18,EXOSC10, FOXM1,INTS9,KAT2A,KIF18B,MTHFD1,NCAPD3,POLD2, RAD54L,SNRPA,SSRP1,SUV39H1,TARS2,TELO2,TRAP1 |

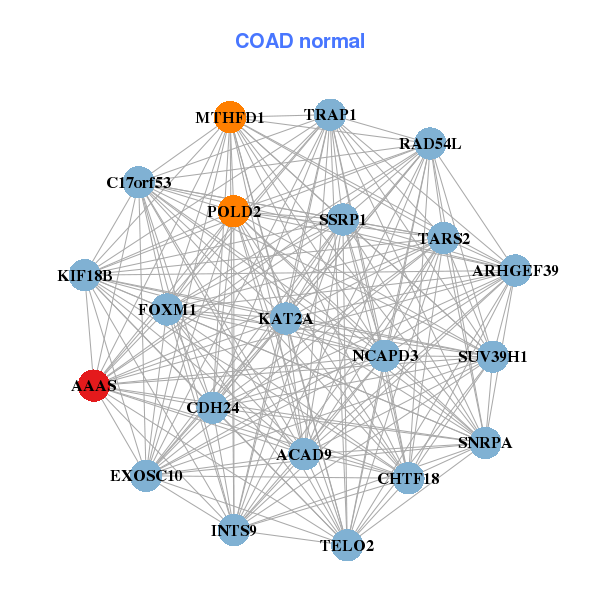
| * Co-Expression network figures were drawn using R package igraph. Only the top 20 genes with the highest correlations were shown. Red circle: input gene, orange circle: cell metabolism gene, sky circle: other gene |
: Open all plots for all cancer types
| Top |
: Open all interacting genes' information including KEGG pathway for all interacting genes from DAVID
| Top |
| Pharmacological Information for AAAS |
| There's no related Drug. |
| Top |
| Cross referenced IDs for AAAS |
| * We obtained these cross-references from Uniprot database. It covers 150 different DBs, 18 categories. http://www.uniprot.org/help/cross_references_section |
: Open all cross reference information
|
Copyright © 2016-Present - The Univsersity of Texas Health Science Center at Houston @ |