|
||||||||||||||||||||||||||||||||||||||||||||||||||||||||||||||||||||||||||||||||||||||||||||||||||||||||||||||||||||||||||||||||||||||||||||||||||||||||||||||||||||||||||||||||||||||||||||||||||||||||||||||||||||||||||||||||||||||||||||||||||||||||||||||||||||||||||||||||||||||||||||||||||||||||||||||||||||||||||
| |
| Phenotypic Information (metabolism pathway, cancer, disease, phenome) |
| |
| |
| Gene-Gene Network Information: Co-Expression Network, Interacting Genes & KEGG |
| |
|


| Gene Summary for NPL |
| Basic gene info. | Gene symbol | NPL |
| Gene name | N-acetylneuraminate pyruvate lyase (dihydrodipicolinate synthase) | |
| Synonyms | C112|C1orf13|NAL|NPL1 | |
| Cytomap | UCSC genome browser: 1q25 | |
| Genomic location | chr1 :182758583-182799519 | |
| Type of gene | protein-coding | |
| RefGenes | NM_001200050.1, NM_001200051.1,NM_001200052.1,NM_001200056.1,NM_030769.2, | |
| Ensembl id | ENSG00000135838 | |
| Description | N-acetylneuraminate lyaseN-acetylneuraminic acid aldolaseNALasedihydrodipicolinate synthetase homolog 1sialate-pyruvate lyasesialic acid aldolase | |
| Modification date | 20141207 | |
| dbXrefs | MIM : 611412 | |
| HGNC : HGNC | ||
| Ensembl : ENSG00000135838 | ||
| HPRD : 14836 | ||
| Vega : OTTHUMG00000035321 | ||
| Protein | UniProt: go to UniProt's Cross Reference DB Table | |
| Expression | CleanEX: HS_NPL | |
| BioGPS: 80896 | ||
| Gene Expression Atlas: ENSG00000135838 | ||
| The Human Protein Atlas: ENSG00000135838 | ||
| Pathway | NCI Pathway Interaction Database: NPL | |
| KEGG: NPL | ||
| REACTOME: NPL | ||
| ConsensusPathDB | ||
| Pathway Commons: NPL | ||
| Metabolism | MetaCyc: NPL | |
| HUMANCyc: NPL | ||
| Regulation | Ensembl's Regulation: ENSG00000135838 | |
| miRBase: chr1 :182,758,583-182,799,519 | ||
| TargetScan: NM_001200050 | ||
| cisRED: ENSG00000135838 | ||
| Context | iHOP: NPL | |
| cancer metabolism search in PubMed: NPL | ||
| UCL Cancer Institute: NPL | ||
| Assigned class in ccmGDB | C | |
| Top |
| Phenotypic Information for NPL(metabolism pathway, cancer, disease, phenome) |
| Cancer | CGAP: NPL |
| Familial Cancer Database: NPL | |
| * This gene is included in those cancer gene databases. |
|
|
|
|
|
| . | ||||||||||||||||||||||||||||||||||||||||||||||||||||||||||||||||||||||||||||||||||||||||||||||||||||||||||||||||||||||||||||||||||||||||||||||||||||||||||||||||||||||||||||||||||||||||||||||||||||||||||||||||||||||||||||||||||||||||||||||||||||||||||||||||||||||||||||||||||||||||||||||||||||||||||||||||||||
Oncogene 1 | Significant driver gene in | |||||||||||||||||||||||||||||||||||||||||||||||||||||||||||||||||||||||||||||||||||||||||||||||||||||||||||||||||||||||||||||||||||||||||||||||||||||||||||||||||||||||||||||||||||||||||||||||||||||||||||||||||||||||||||||||||||||||||||||||||||||||||||||||||||||||||||||||||||||||||||||||||||||||||||||||||||||||||
| cf) number; DB name 1 Oncogene; http://nar.oxfordjournals.org/content/35/suppl_1/D721.long, 2 Tumor Suppressor gene; https://bioinfo.uth.edu/TSGene/, 3 Cancer Gene Census; http://www.nature.com/nrc/journal/v4/n3/abs/nrc1299.html, 4 CancerGenes; http://nar.oxfordjournals.org/content/35/suppl_1/D721.long, 5 Network of Cancer Gene; http://ncg.kcl.ac.uk/index.php, 1Therapeutic Vulnerabilities in Cancer; http://cbio.mskcc.org/cancergenomics/statius/ |
| KEGG_AMINO_SUGAR_AND_NUCLEOTIDE_SUGAR_METABOLISM | |
| OMIM | |
| Orphanet | |
| Disease | KEGG Disease: NPL |
| MedGen: NPL (Human Medical Genetics with Condition) | |
| ClinVar: NPL | |
| Phenotype | MGI: NPL (International Mouse Phenotyping Consortium) |
| PhenomicDB: NPL | |
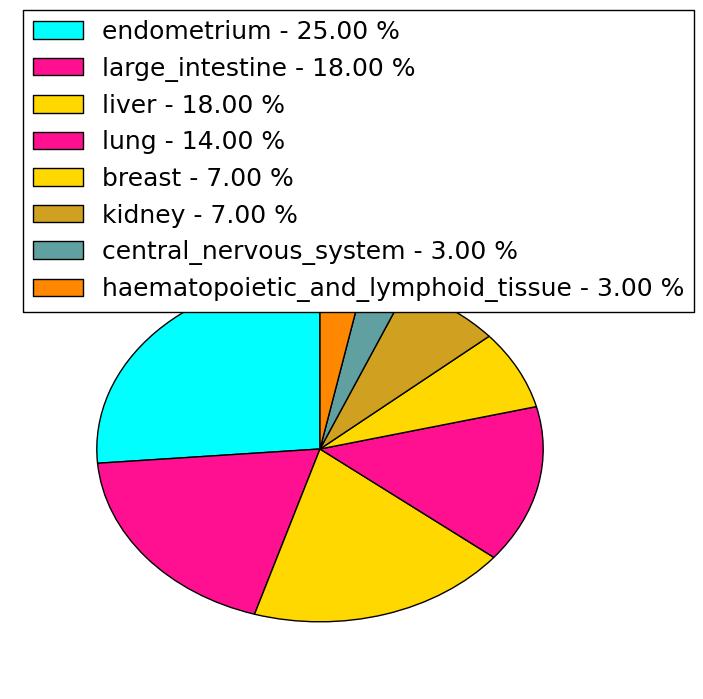
| Mutations for NPL |
| * Under tables are showing count per each tissue to give us broad intuition about tissue specific mutation patterns.You can go to the detailed page for each mutation database's web site. |
| - Statistics for Tissue and Mutation type | Top |
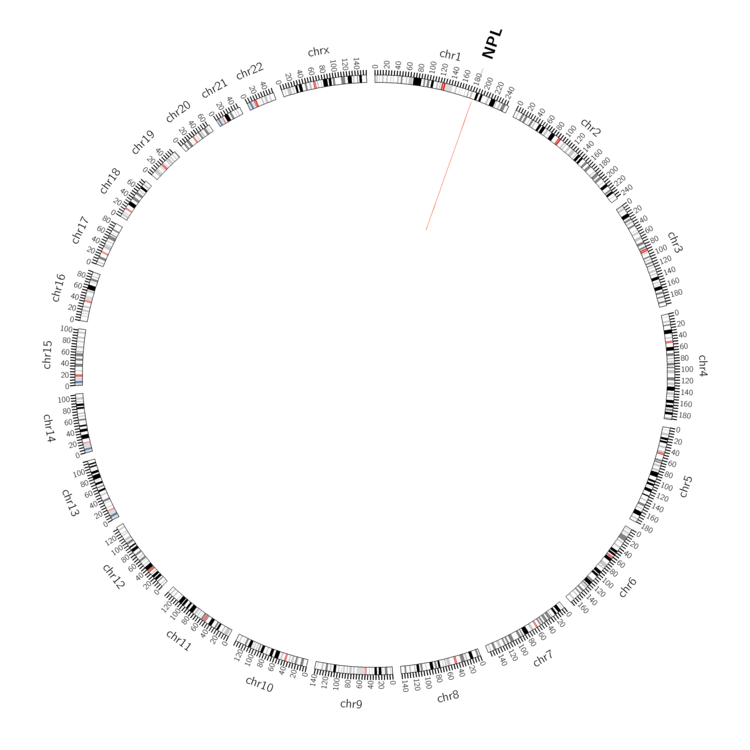 |
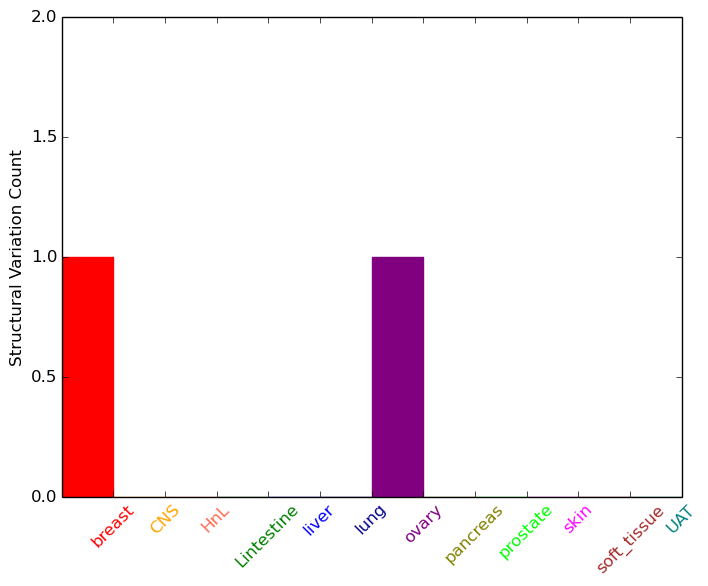
| - For Inter-chromosomal Variations |
| There's no inter-chromosomal structural variation. |
| - For Intra-chromosomal Variations |
| * Intra-chromosomal variantions includes 'intrachromosomal amplicon to amplicon', 'intrachromosomal amplicon to non-amplified dna', 'intrachromosomal deletion', 'intrachromosomal fold-back inversion', 'intrachromosomal inversion', 'intrachromosomal tandem duplication', 'Intrachromosomal unknown type', 'intrachromosomal with inverted orientation', 'intrachromosomal with non-inverted orientation'. |
 |
| Sample | Symbol_a | Chr_a | Start_a | End_a | Symbol_b | Chr_b | Start_b | End_b |
| breast | NPL | chr1 | 182790677 | 182790677 | chr1 | 182865383 | 182865383 | |
| ovary | NPL | chr1 | 182776068 | 182776088 | chr1 | 182704606 | 182704626 |
| cf) Tissue number; Tissue name (1;Breast, 2;Central_nervous_system, 3;Haematopoietic_and_lymphoid_tissue, 4;Large_intestine, 5;Liver, 6;Lung, 7;Ovary, 8;Pancreas, 9;Prostate, 10;Skin, 11;Soft_tissue, 12;Upper_aerodigestive_tract) |
| * From mRNA Sanger sequences, Chitars2.0 arranged chimeric transcripts. This table shows NPL related fusion information. |
| ID | Head Gene | Tail Gene | Accession | Gene_a | qStart_a | qEnd_a | Chromosome_a | tStart_a | tEnd_a | Gene_a | qStart_a | qEnd_a | Chromosome_a | tStart_a | tEnd_a |
| BU181747 | CERS5 | 1 | 214 | 12 | 50560884 | 50561097 | NPL | 214 | 856 | 1 | 182791249 | 182799251 | |
| Top |
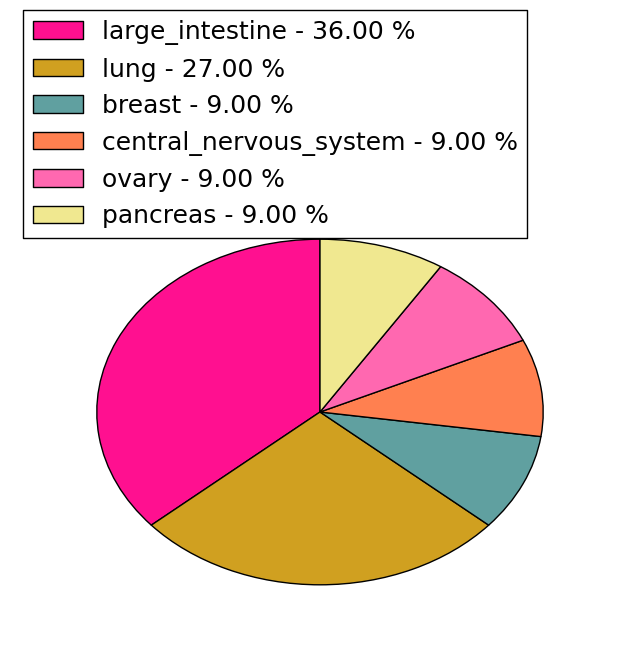
| Mutation type/ Tissue ID | brca | cns | cerv | endome | haematopo | kidn | Lintest | liver | lung | ns | ovary | pancre | prost | skin | stoma | thyro | urina | |||
| Total # sample | 1 | 1 | ||||||||||||||||||
| GAIN (# sample) | ||||||||||||||||||||
| LOSS (# sample) | 1 | 1 |
| cf) Tissue ID; Tissue type (1; Breast, 2; Central_nervous_system, 3; Cervix, 4; Endometrium, 5; Haematopoietic_and_lymphoid_tissue, 6; Kidney, 7; Large_intestine, 8; Liver, 9; Lung, 10; NS, 11; Ovary, 12; Pancreas, 13; Prostate, 14; Skin, 15; Stomach, 16; Thyroid, 17; Urinary_tract) |
| Top |
|
 |
| Top |
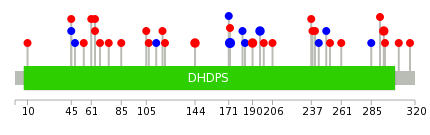
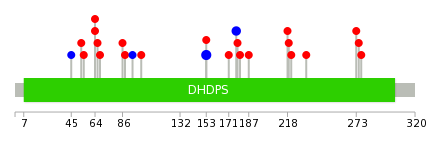
| Stat. for Non-Synonymous SNVs (# total SNVs=27) | (# total SNVs=11) |
 |  |
(# total SNVs=0) | (# total SNVs=0) |
| Top |
| * When you move the cursor on each content, you can see more deailed mutation information on the Tooltip. Those are primary_site,primary_histology,mutation(aa),pubmedID. |
| GRCh37 position | Mutation(aa) | Unique sampleID count |
| chr1:182787734-182787734 | p.L172L | 3 |
| chr1:182787806-182787806 | p.F196F | 2 |
| chr1:182797964-182797964 | p.S295N | 2 |
| chr1:182785915-182785915 | p.H144R | 2 |
| chr1:182794914-182794914 | p.? | 2 |
| chr1:182787787-182787787 | p.R190H | 2 |
| chr1:182783968-182783968 | p.P113P | 1 |
| chr1:182797935-182797935 | p.L285L | 1 |
| chr1:182775294-182775294 | p.G53* | 1 |
| chr1:182783982-182783982 | p.P118Q | 1 |
| Top |
|
 |
| Point Mutation/ Tissue ID | 1 | 2 | 3 | 4 | 5 | 6 | 7 | 8 | 9 | 10 | 11 | 12 | 13 | 14 | 15 | 16 | 17 | 18 | 19 | 20 |
| # sample | 8 | 1 | 1 | 4 | 2 | 1 | 3 | 1 | 6 | |||||||||||
| # mutation | 7 | 1 | 1 | 4 | 2 | 1 | 2 | 1 | 7 | |||||||||||
| nonsynonymous SNV | 4 | 1 | 1 | 4 | 2 | 1 | 1 | 7 | ||||||||||||
| synonymous SNV | 3 | 1 | 1 |
| cf) Tissue ID; Tissue type (1; BLCA[Bladder Urothelial Carcinoma], 2; BRCA[Breast invasive carcinoma], 3; CESC[Cervical squamous cell carcinoma and endocervical adenocarcinoma], 4; COAD[Colon adenocarcinoma], 5; GBM[Glioblastoma multiforme], 6; Glioma Low Grade, 7; HNSC[Head and Neck squamous cell carcinoma], 8; KICH[Kidney Chromophobe], 9; KIRC[Kidney renal clear cell carcinoma], 10; KIRP[Kidney renal papillary cell carcinoma], 11; LAML[Acute Myeloid Leukemia], 12; LUAD[Lung adenocarcinoma], 13; LUSC[Lung squamous cell carcinoma], 14; OV[Ovarian serous cystadenocarcinoma ], 15; PAAD[Pancreatic adenocarcinoma], 16; PRAD[Prostate adenocarcinoma], 17; SKCM[Skin Cutaneous Melanoma], 18:STAD[Stomach adenocarcinoma], 19:THCA[Thyroid carcinoma], 20:UCEC[Uterine Corpus Endometrial Carcinoma]) |
| Top |
| * We represented just top 10 SNVs. When you move the cursor on each content, you can see more deailed mutation information on the Tooltip. Those are primary_site, primary_histology, mutation(aa), pubmedID. |
| Genomic Position | Mutation(aa) | Unique sampleID count |
| chr1:182787734 | p.L153L,NPL | 3 |
| chr1:182787806 | p.F177F,NPL | 2 |
| chr1:182775328 | p.F233C,NPL | 1 |
| chr1:182787807 | p.E68D,NPL | 1 |
| chr1:182775341 | p.F273C,NPL | 1 |
| chr1:182787814 | p.V66L,NPL | 1 |
| chr1:182781313 | p.D275N,NPL | 1 |
| chr1:182787959 | p.A86V,NPL | 1 |
| chr1:182783943 | p.A277V,NPL | 1 |
| chr1:182791305 | p.G88D,NPL | 1 |
| * Copy number data were extracted from TCGA using R package TCGA-Assembler. The URLs of all public data files on TCGA DCC data server were gathered on Jan-05-2015. Function ProcessCNAData in TCGA-Assembler package was used to obtain gene-level copy number value which is calculated as the average copy number of the genomic region of a gene. |
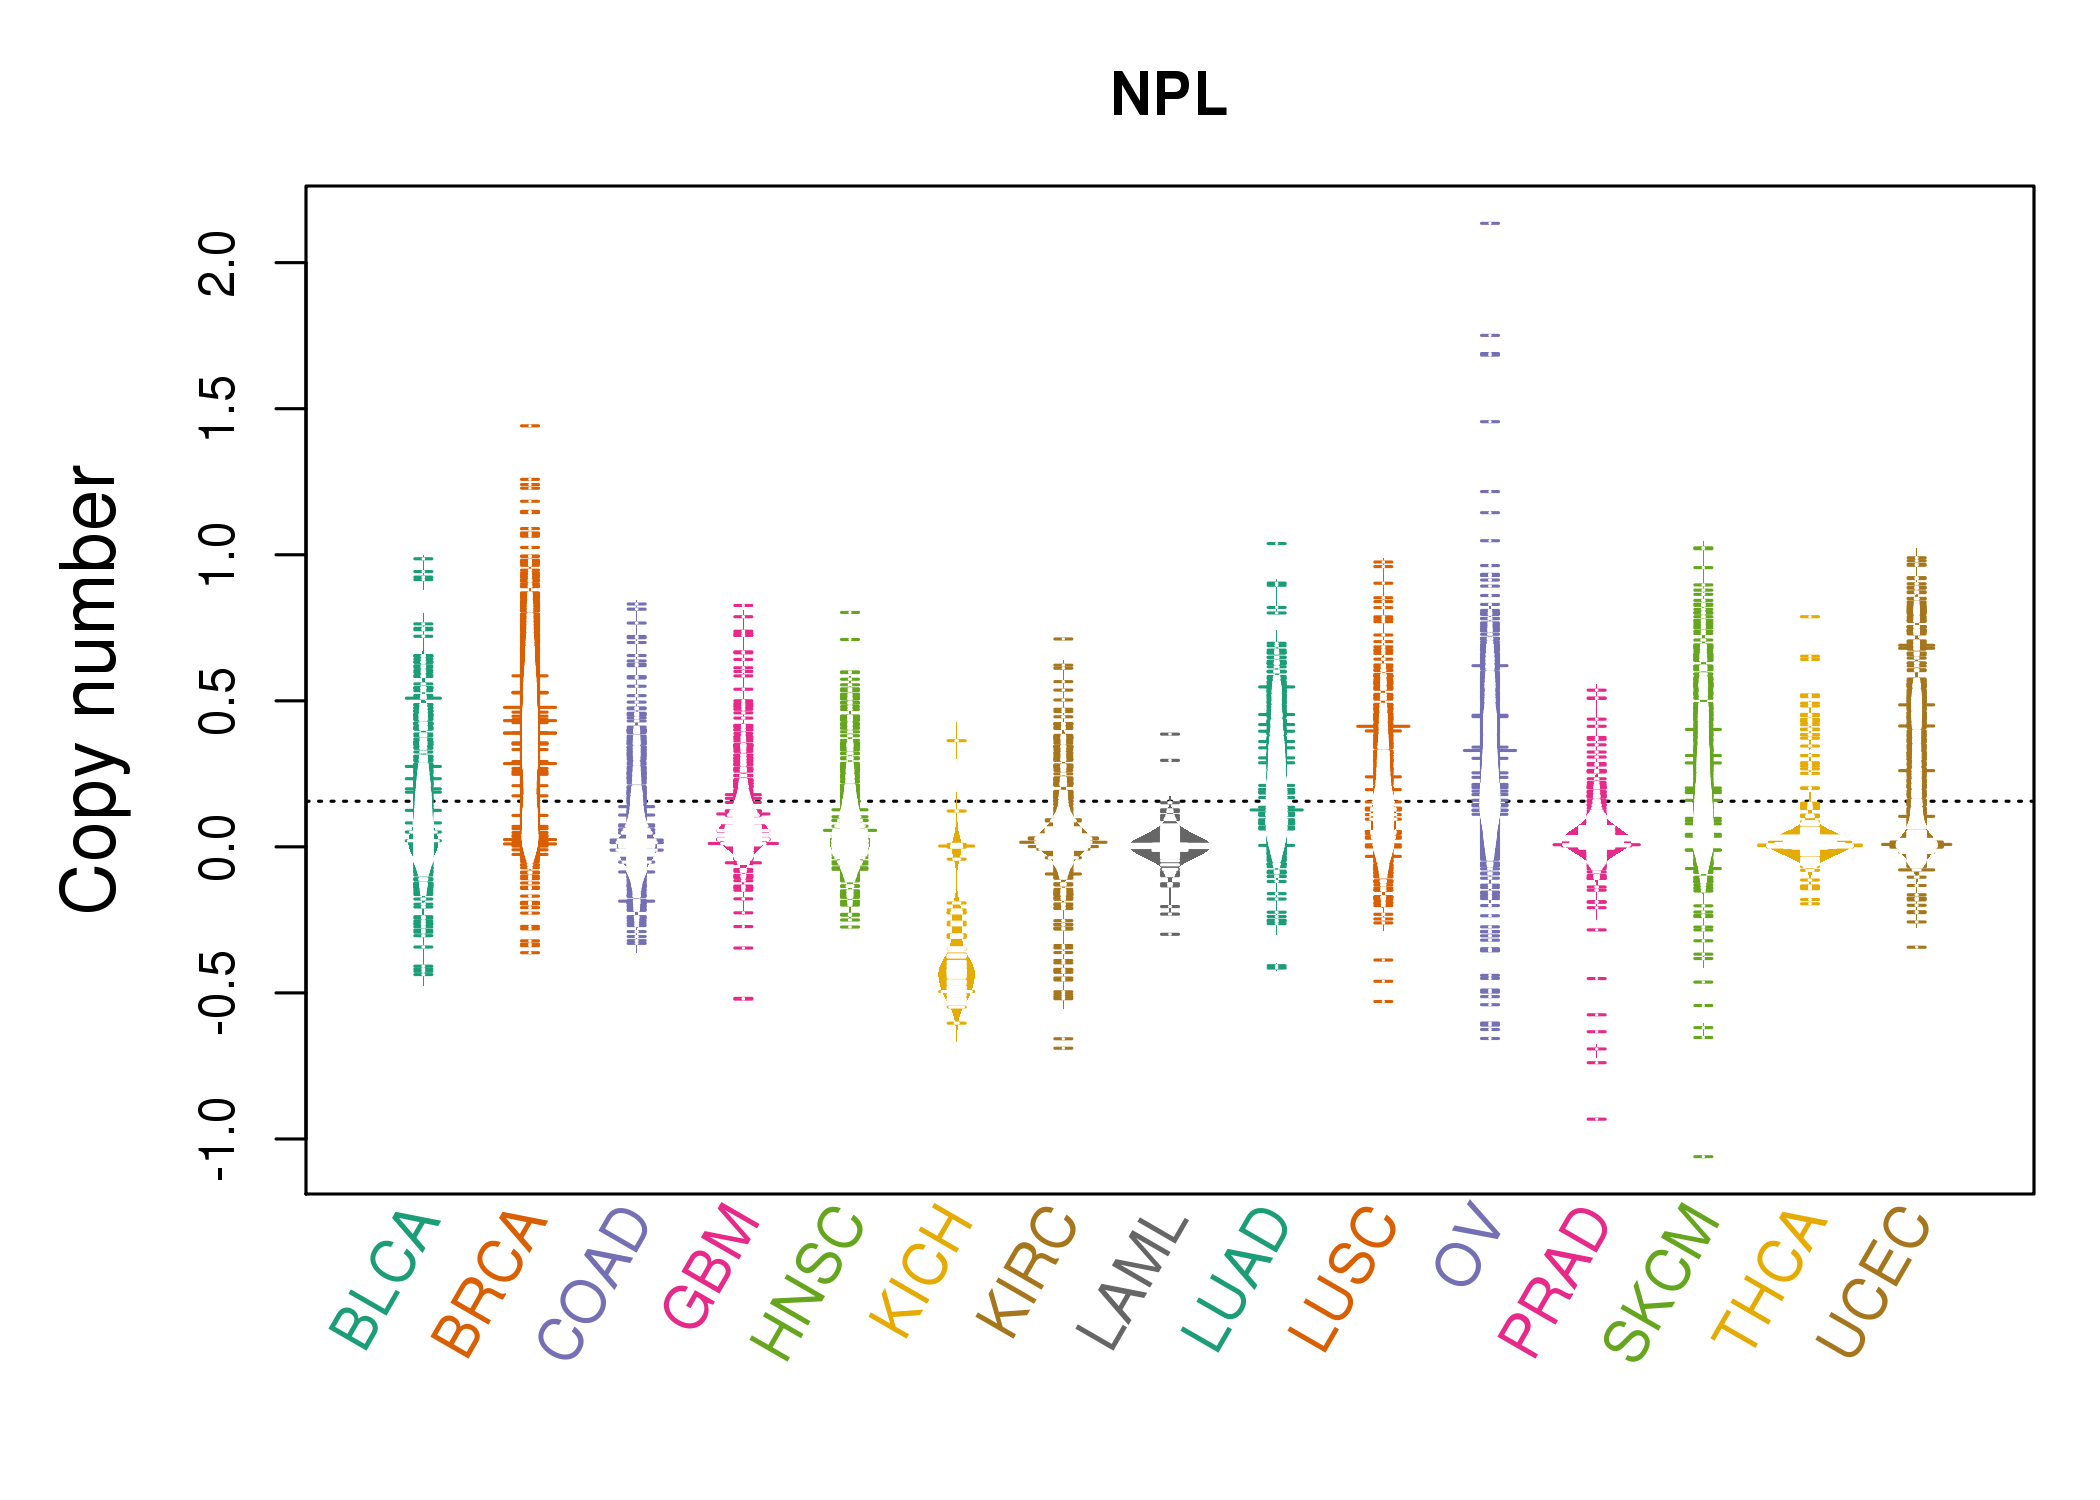 |
| cf) Tissue ID[Tissue type]: BLCA[Bladder Urothelial Carcinoma], BRCA[Breast invasive carcinoma], CESC[Cervical squamous cell carcinoma and endocervical adenocarcinoma], COAD[Colon adenocarcinoma], GBM[Glioblastoma multiforme], Glioma Low Grade, HNSC[Head and Neck squamous cell carcinoma], KICH[Kidney Chromophobe], KIRC[Kidney renal clear cell carcinoma], KIRP[Kidney renal papillary cell carcinoma], LAML[Acute Myeloid Leukemia], LUAD[Lung adenocarcinoma], LUSC[Lung squamous cell carcinoma], OV[Ovarian serous cystadenocarcinoma ], PAAD[Pancreatic adenocarcinoma], PRAD[Prostate adenocarcinoma], SKCM[Skin Cutaneous Melanoma], STAD[Stomach adenocarcinoma], THCA[Thyroid carcinoma], UCEC[Uterine Corpus Endometrial Carcinoma] |
| Top |
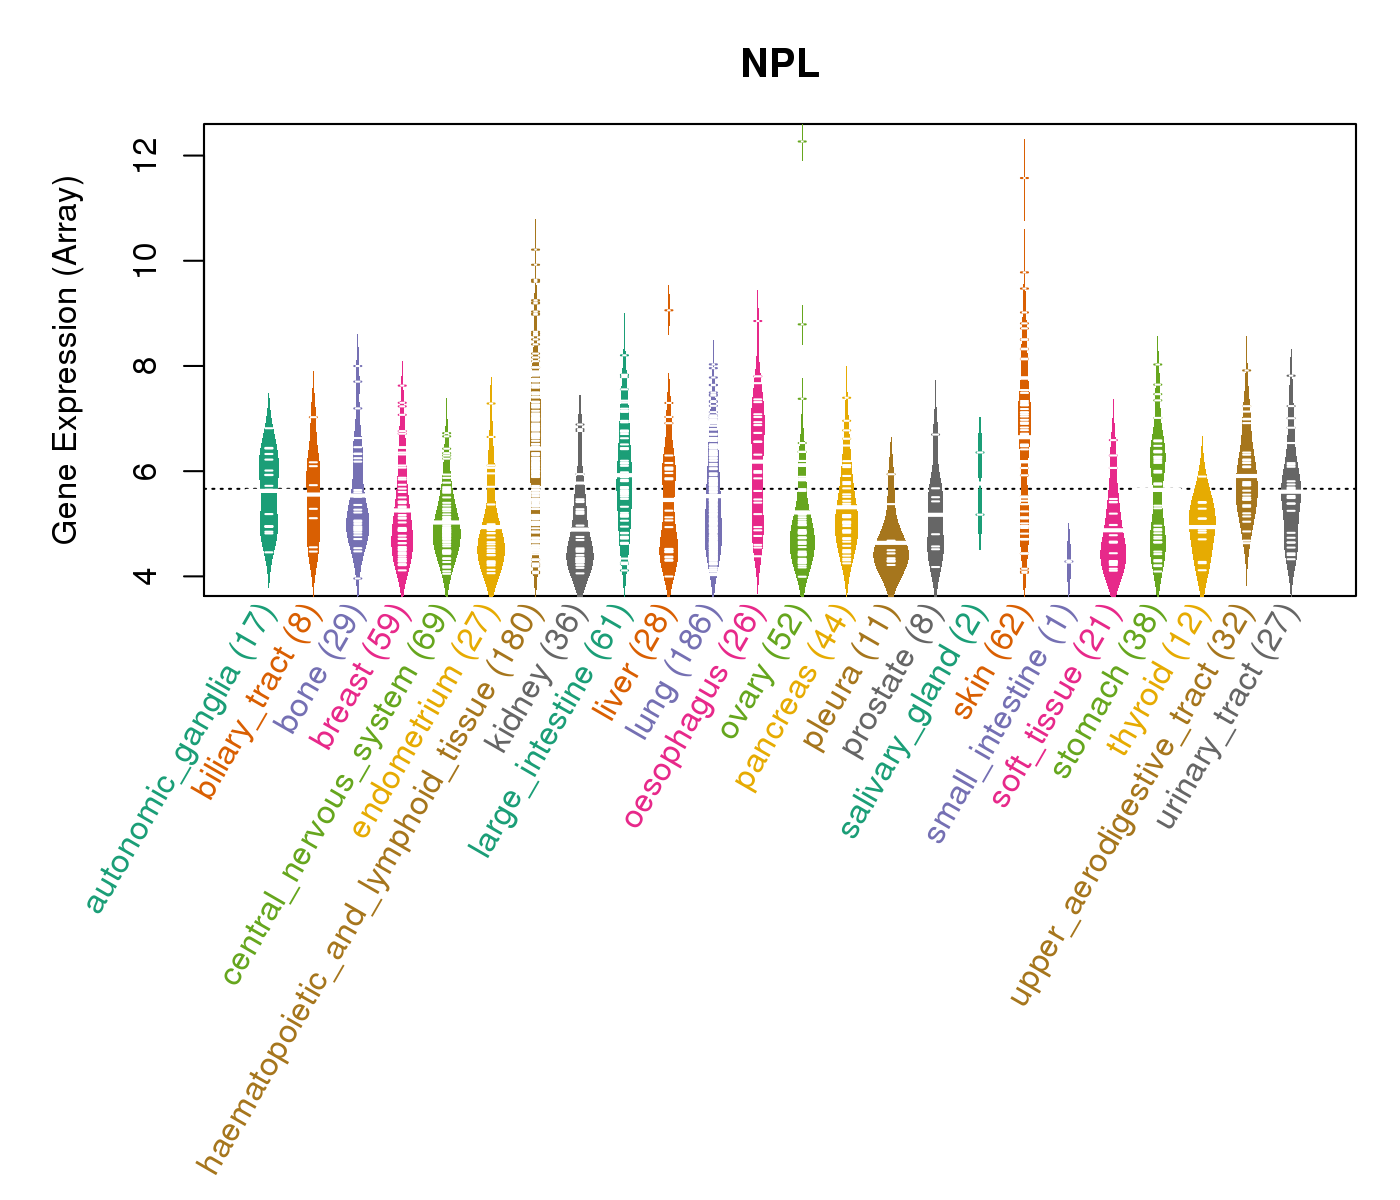
| Gene Expression for NPL |
| * CCLE gene expression data were extracted from CCLE_Expression_Entrez_2012-10-18.res: Gene-centric RMA-normalized mRNA expression data. |
 |
| * Normalized gene expression data of RNASeqV2 was extracted from TCGA using R package TCGA-Assembler. The URLs of all public data files on TCGA DCC data server were gathered at Jan-05-2015. Only eight cancer types have enough normal control samples for differential expression analysis. (t test, adjusted p<0.05 (using Benjamini-Hochberg FDR)) |
 |
| Top |
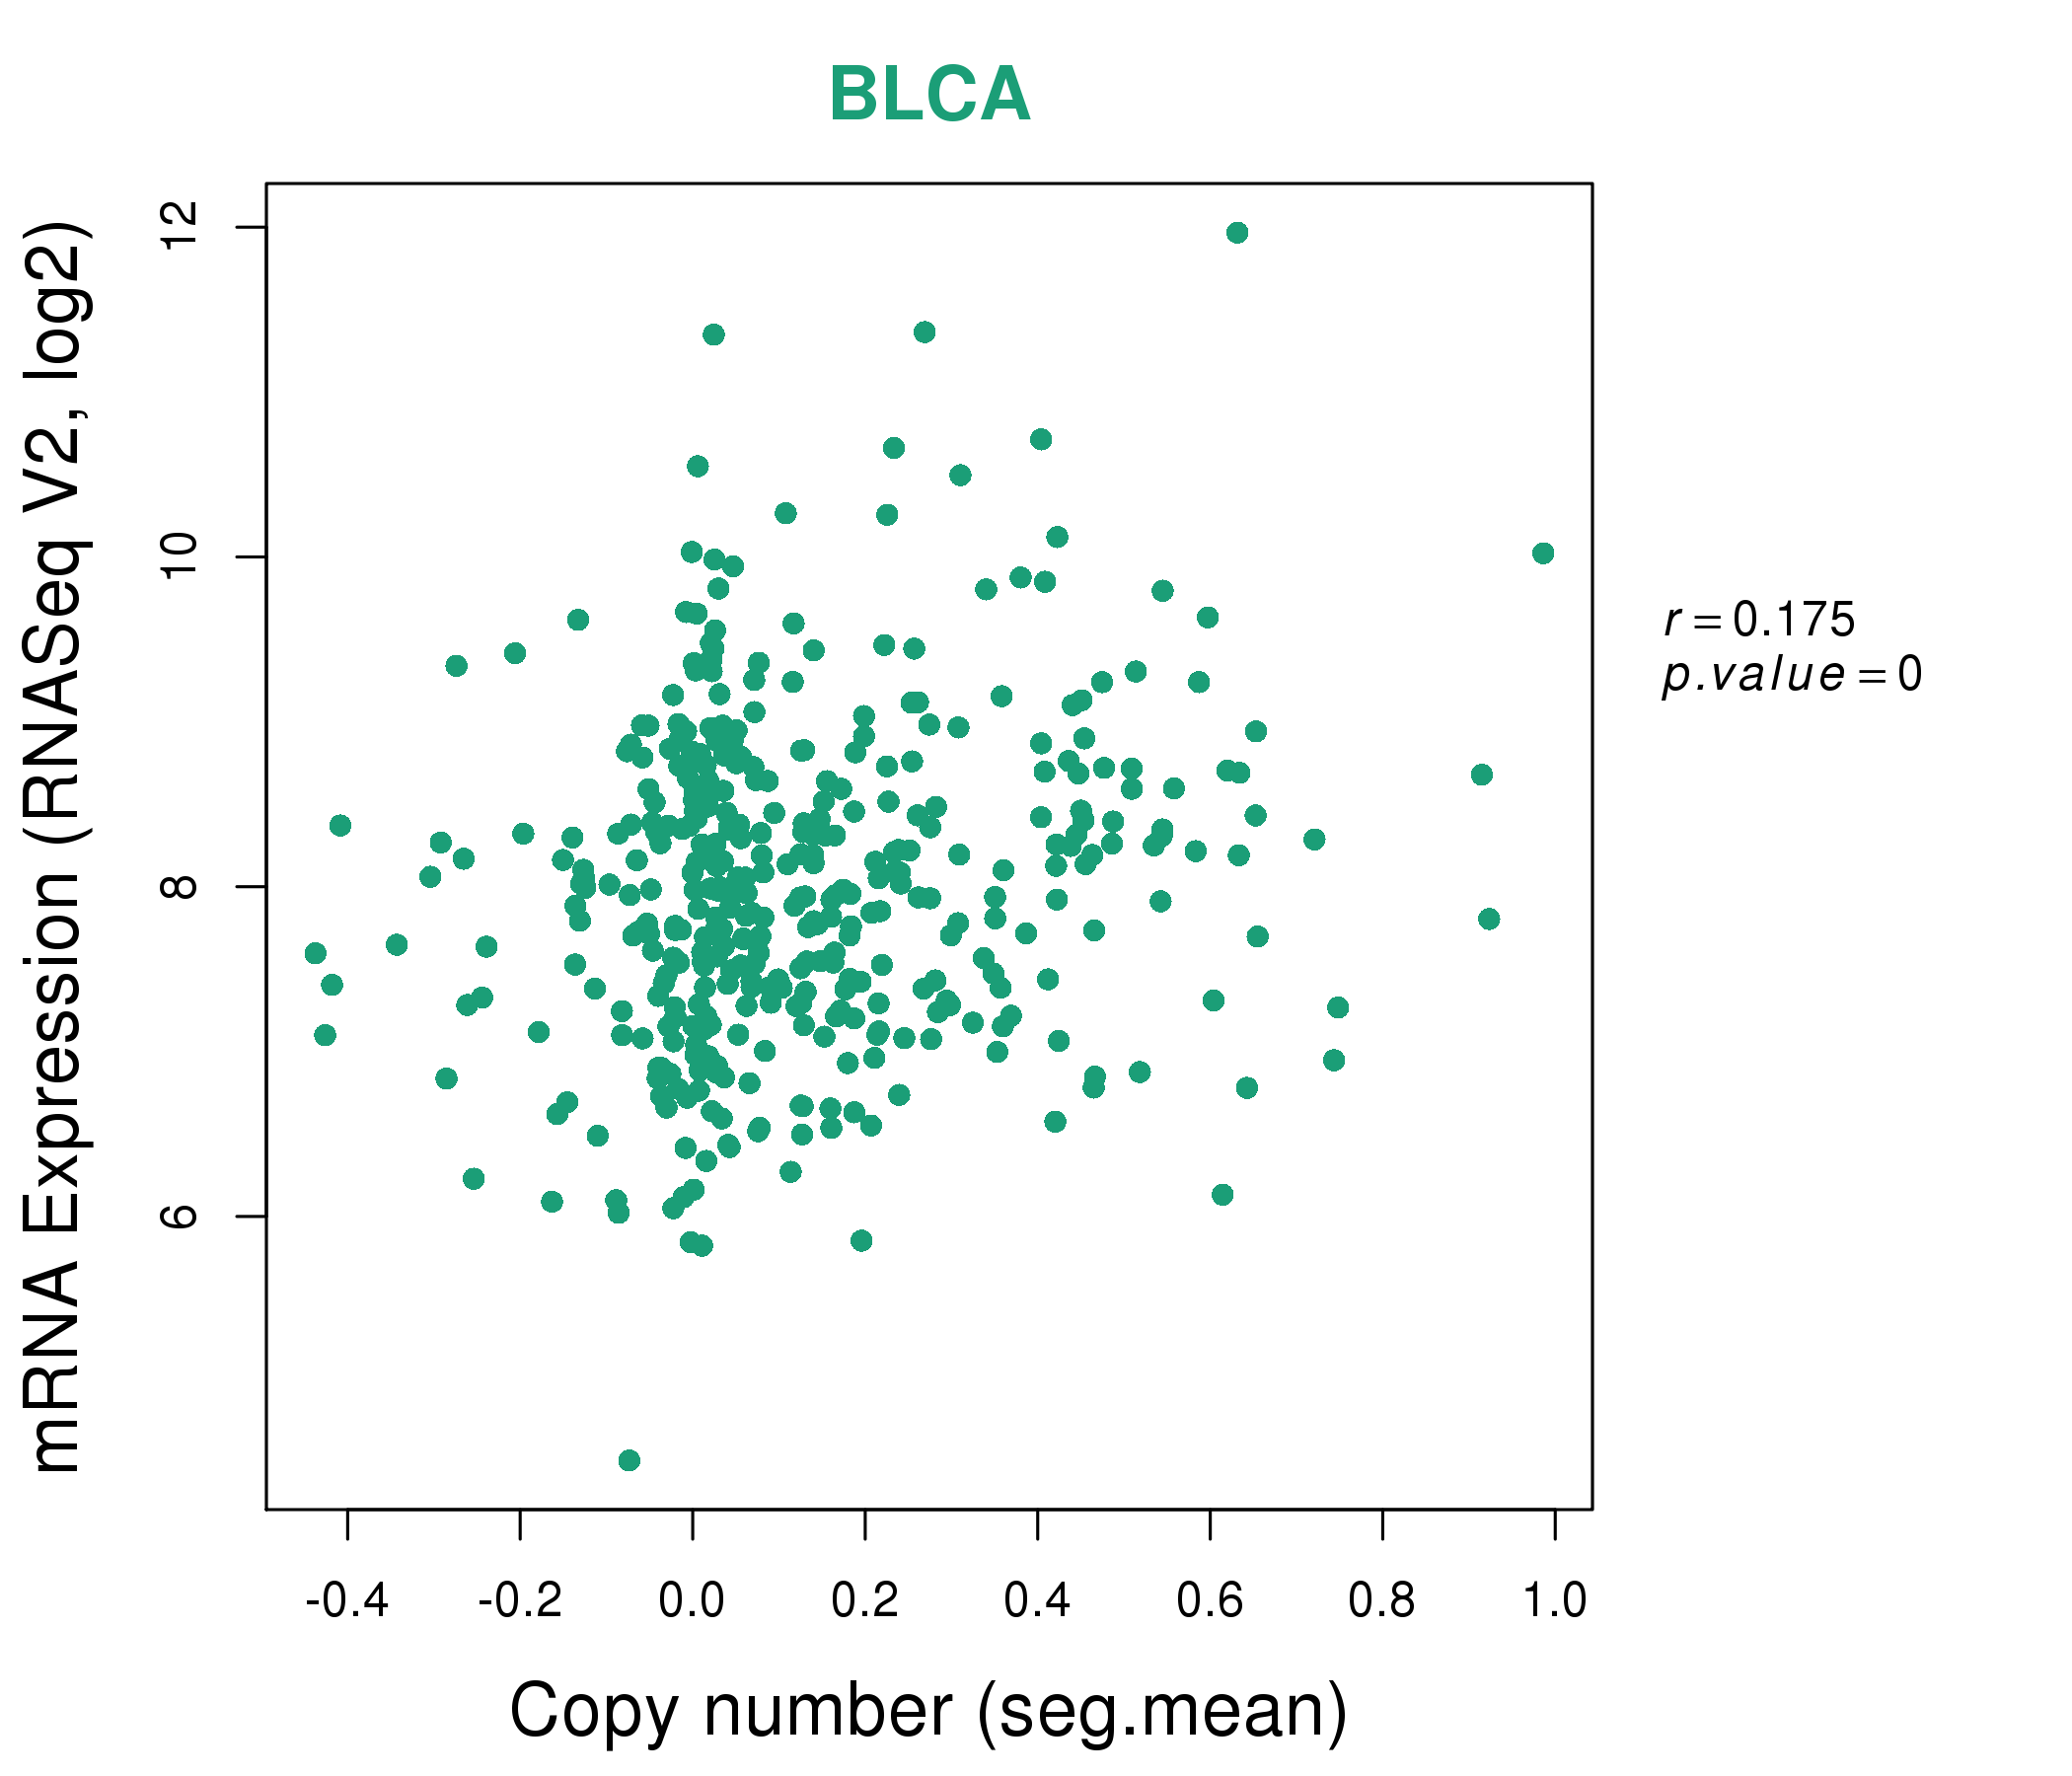
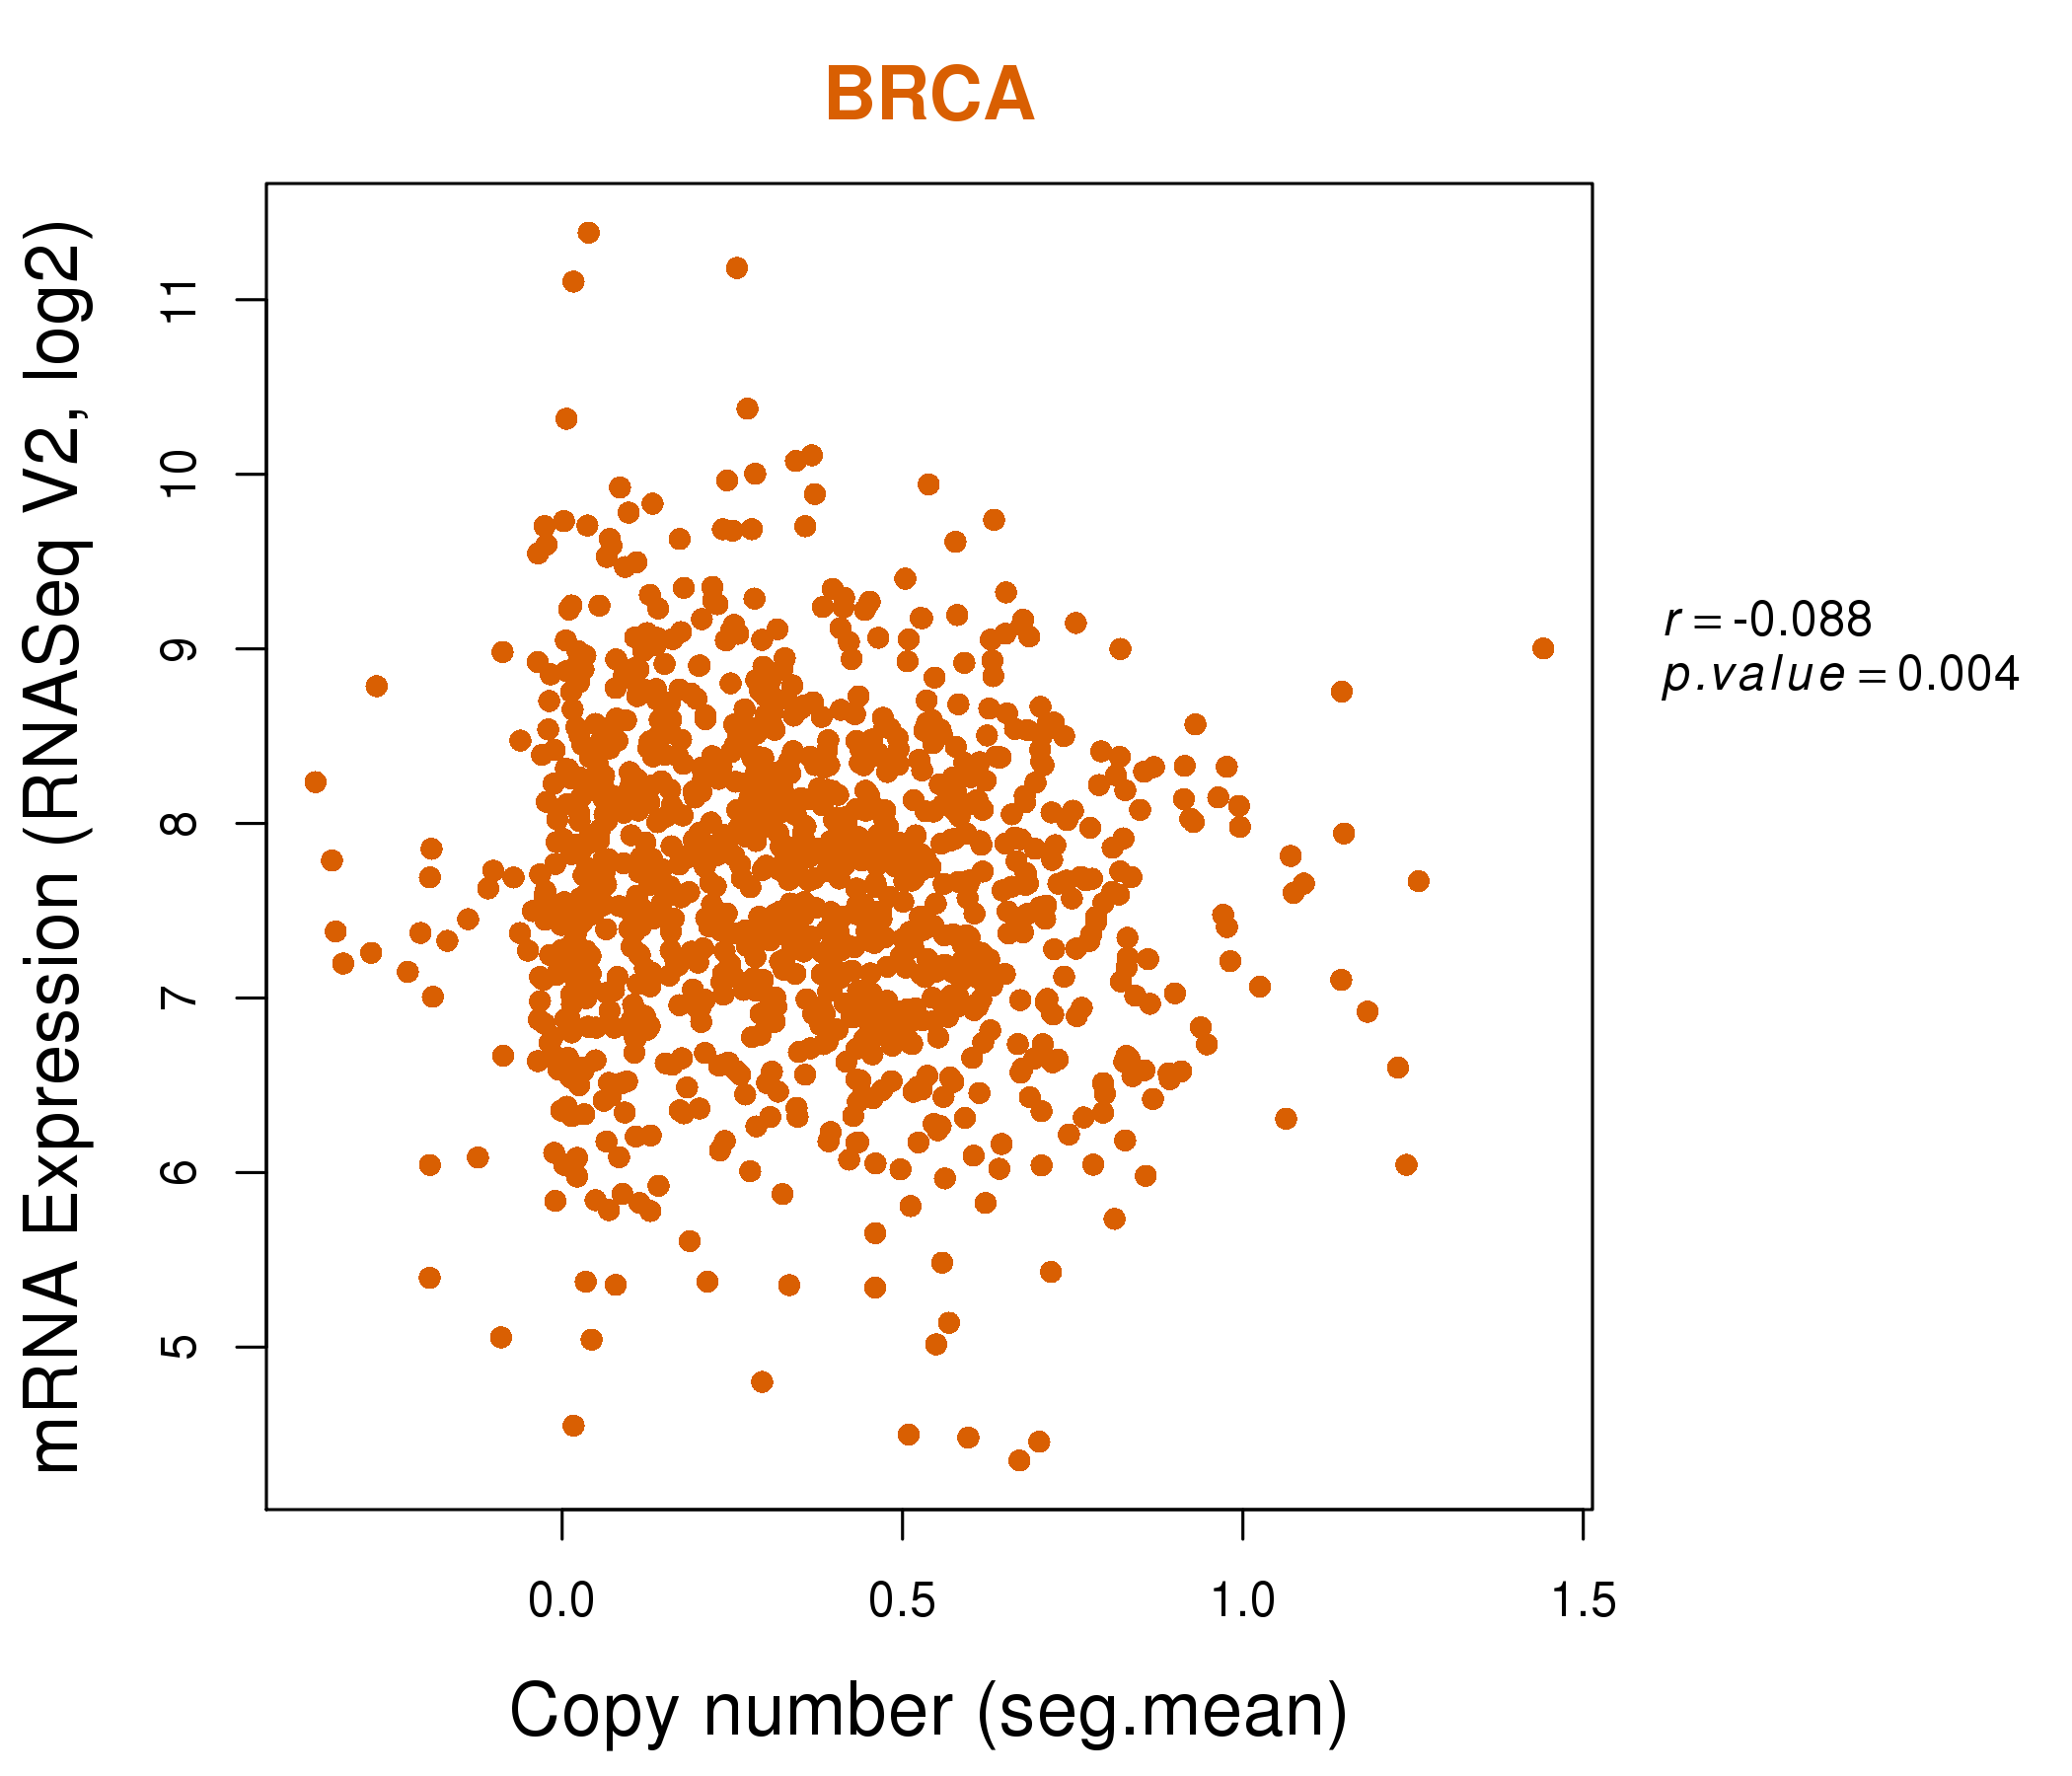
| * This plots show the correlation between CNV and gene expression. |
: Open all plots for all cancer types
 |
|
 |
|

| Top |
| Gene-Gene Network Information |
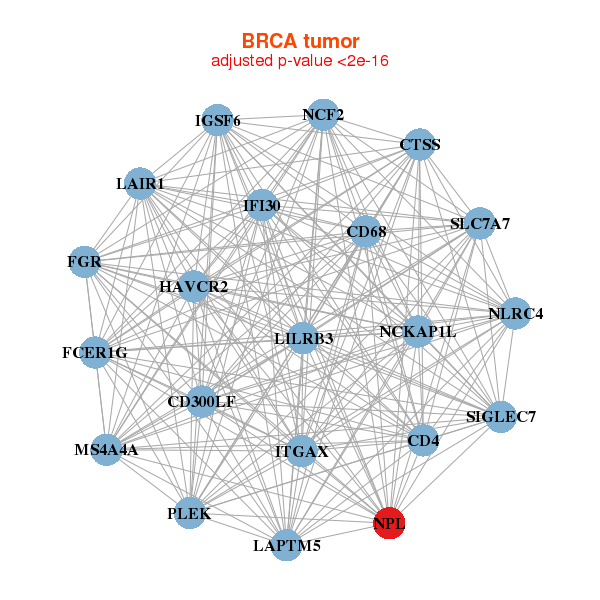
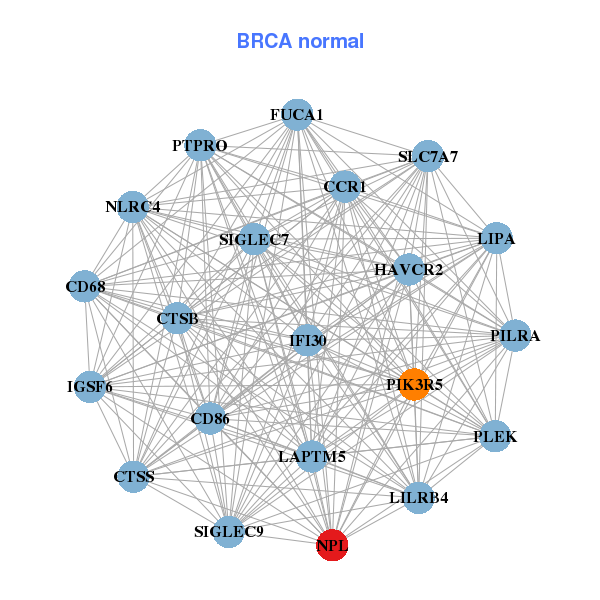
| * Co-Expression network figures were drawn using R package igraph. Only the top 20 genes with the highest correlations were shown. Red circle: input gene, orange circle: cell metabolism gene, sky circle: other gene |
: Open all plots for all cancer types
 |
|
| CD300LF,CD4,CD68,CTSS,FCER1G,FGR,HAVCR2, IFI30,IGSF6,ITGAX,LAIR1,LAPTM5,LILRB3,MS4A4A, NCF2,NCKAP1L,NLRC4,NPL,PLEK,SIGLEC7,SLC7A7 | CCR1,CD68,CD86,CTSB,CTSS,FUCA1,HAVCR2, IFI30,IGSF6,LAPTM5,LILRB4,LIPA,NLRC4,NPL, PIK3R5,PILRA,PLEK,PTPRO,SIGLEC7,SIGLEC9,SLC7A7 |
 |
|
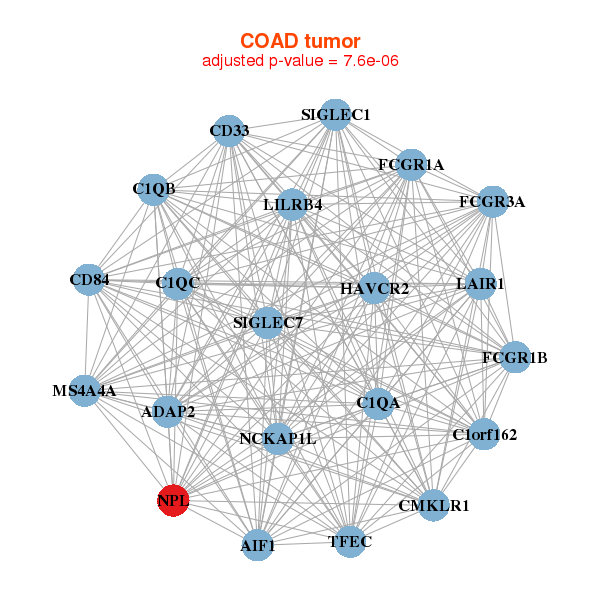
| ADAP2,AIF1,C1orf162,C1QA,C1QB,C1QC,CD33, CD84,CMKLR1,FCGR1A,FCGR1B,FCGR3A,HAVCR2,LAIR1, LILRB4,MS4A4A,NCKAP1L,NPL,SIGLEC1,SIGLEC7,TFEC | ADAP2,ATP8B4,C1QA,C1QB,C1QC,C3AR1,CD200R1, CD33,CD4,FOLR2,GGTA1P,HAVCR2,LAIR1,LILRB4, LRRC25,MS4A4A,NFAM1,NPL,PILRA,RNASE1,TMEM86A |
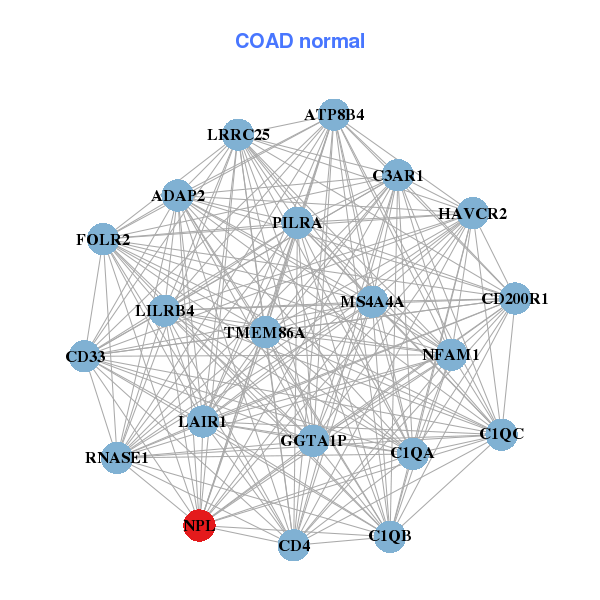
| * Co-Expression network figures were drawn using R package igraph. Only the top 20 genes with the highest correlations were shown. Red circle: input gene, orange circle: cell metabolism gene, sky circle: other gene |
: Open all plots for all cancer types
| Top |
: Open all interacting genes' information including KEGG pathway for all interacting genes from DAVID
| Top |
| Pharmacological Information for NPL |
| There's no related Drug. |
| Top |
| Cross referenced IDs for NPL |
| * We obtained these cross-references from Uniprot database. It covers 150 different DBs, 18 categories. http://www.uniprot.org/help/cross_references_section |
: Open all cross reference information
|
Copyright © 2016-Present - The Univsersity of Texas Health Science Center at Houston @ |