|
||||||||||||||||||||
| |
| Phenotypic Information (metabolism pathway, cancer, disease, phenome) |
| |
| |
| Gene-Gene Network Information: Co-Expression Network, Interacting Genes & KEGG |
| |
|


| Gene Summary for ANP32A |
| Basic gene info. | Gene symbol | ANP32A |
| Gene name | acidic (leucine-rich) nuclear phosphoprotein 32 family, member A | |
| Synonyms | C15orf1|HPPCn|I1PP2A|LANP|MAPM|PHAP1|PHAPI|PP32 | |
| Cytomap | UCSC genome browser: 15q23 | |
| Genomic location | chr15 :69070874-69113261 | |
| Type of gene | protein-coding | |
| RefGenes | NM_006305.3, | |
| Ensembl id | ENSG00000140350 | |
| Description | acidic leucine-rich nuclear phosphoprotein 32 family member Aacidic nuclear phosphoprotein pp32cerebellar leucine rich acidic nuclear proteinhepatopoietin Cninhibitor-1 of protein phosphatase-2Aleucine-rich acidic nuclear proteinmapmodulinpotent he | |
| Modification date | 20141207 | |
| dbXrefs | MIM : 600832 | |
| HGNC : HGNC | ||
| Ensembl : ENSG00000140350 | ||
| HPRD : 09014 | ||
| Vega : OTTHUMG00000154502 | ||
| Protein | UniProt: P39687 go to UniProt's Cross Reference DB Table | |
| Expression | CleanEX: HS_ANP32A | |
| BioGPS: 8125 | ||
| Gene Expression Atlas: ENSG00000140350 | ||
| The Human Protein Atlas: ENSG00000140350 | ||
| Pathway | NCI Pathway Interaction Database: ANP32A | |
| KEGG: ANP32A | ||
| REACTOME: ANP32A | ||
| ConsensusPathDB | ||
| Pathway Commons: ANP32A | ||
| Metabolism | MetaCyc: ANP32A | |
| HUMANCyc: ANP32A | ||
| Regulation | Ensembl's Regulation: ENSG00000140350 | |
| miRBase: chr15 :69,070,874-69,113,261 | ||
| TargetScan: NM_006305 | ||
| cisRED: ENSG00000140350 | ||
| Context | iHOP: ANP32A | |
| cancer metabolism search in PubMed: ANP32A | ||
| UCL Cancer Institute: ANP32A | ||
| Assigned class in ccmGDB | B - This gene belongs to cancer gene. | |
| Top |
| Phenotypic Information for ANP32A(metabolism pathway, cancer, disease, phenome) |
| Cancer | CGAP: ANP32A |
| Familial Cancer Database: ANP32A | |
| * This gene is included in those cancer gene databases. |
|
|
|
|
|
| . | ||||||||||||||
Oncogene 1 | Significant driver gene in | |||||||||||||||||||
| cf) number; DB name 1 Oncogene; http://nar.oxfordjournals.org/content/35/suppl_1/D721.long, 2 Tumor Suppressor gene; https://bioinfo.uth.edu/TSGene/, 3 Cancer Gene Census; http://www.nature.com/nrc/journal/v4/n3/abs/nrc1299.html, 4 CancerGenes; http://nar.oxfordjournals.org/content/35/suppl_1/D721.long, 5 Network of Cancer Gene; http://ncg.kcl.ac.uk/index.php, 1Therapeutic Vulnerabilities in Cancer; http://cbio.mskcc.org/cancergenomics/statius/ |
| REACTOME_METABOLISM_OF_MRNA REACTOME_METABOLISM_OF_RNA | |
| OMIM | 600832; gene. |
| Orphanet | |
| Disease | KEGG Disease: ANP32A |
| MedGen: ANP32A (Human Medical Genetics with Condition) | |
| ClinVar: ANP32A | |
| Phenotype | MGI: ANP32A (International Mouse Phenotyping Consortium) |
| PhenomicDB: ANP32A | |
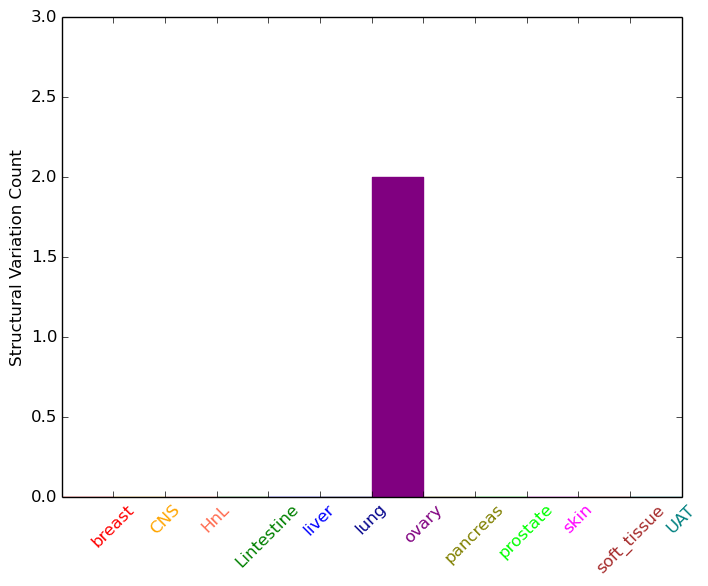
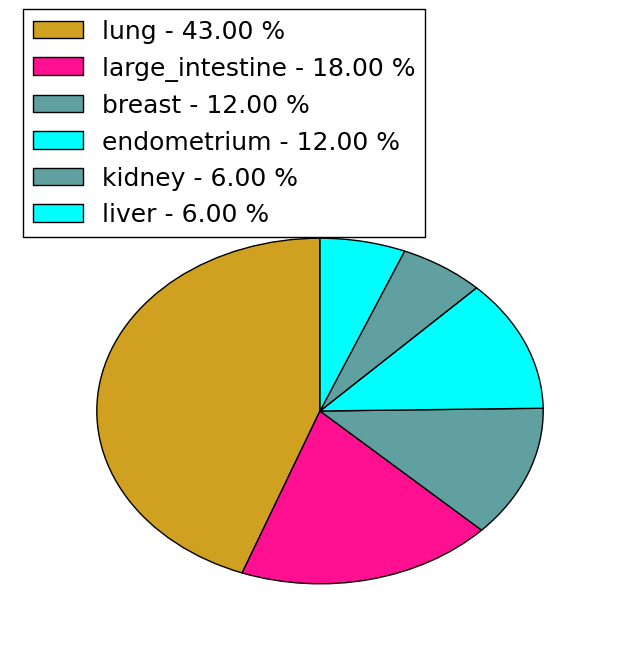
| Mutations for ANP32A |
| * Under tables are showing count per each tissue to give us broad intuition about tissue specific mutation patterns.You can go to the detailed page for each mutation database's web site. |
| - Statistics for Tissue and Mutation type | Top |
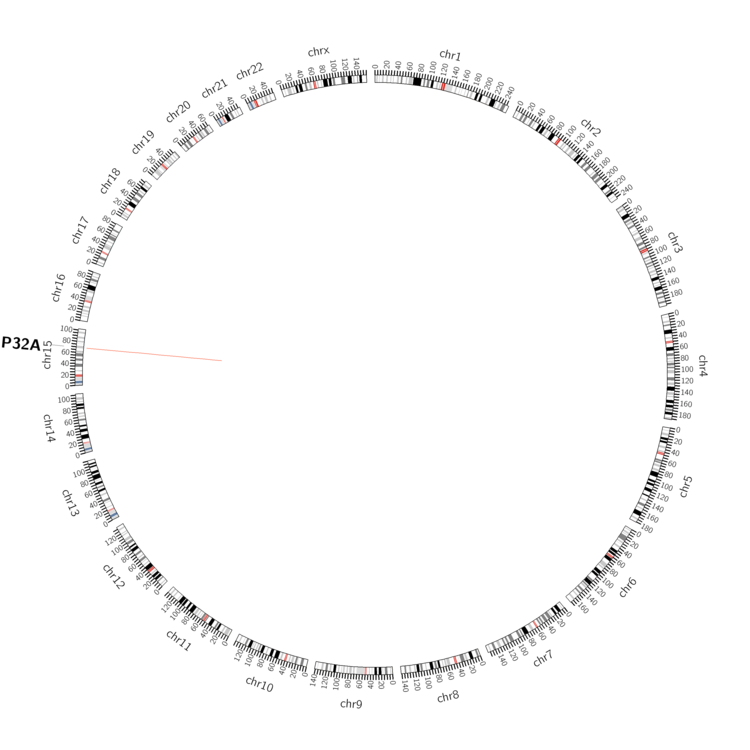 |
| - For Inter-chromosomal Variations |
| There's no inter-chromosomal structural variation. |
| - For Intra-chromosomal Variations |
| * Intra-chromosomal variantions includes 'intrachromosomal amplicon to amplicon', 'intrachromosomal amplicon to non-amplified dna', 'intrachromosomal deletion', 'intrachromosomal fold-back inversion', 'intrachromosomal inversion', 'intrachromosomal tandem duplication', 'Intrachromosomal unknown type', 'intrachromosomal with inverted orientation', 'intrachromosomal with non-inverted orientation'. |
 |
| Sample | Symbol_a | Chr_a | Start_a | End_a | Symbol_b | Chr_b | Start_b | End_b |
| ovary | ANP32A | chr15 | 69103657 | 69103677 | ANP32A | chr15 | 69110856 | 69110876 |
| cf) Tissue number; Tissue name (1;Breast, 2;Central_nervous_system, 3;Haematopoietic_and_lymphoid_tissue, 4;Large_intestine, 5;Liver, 6;Lung, 7;Ovary, 8;Pancreas, 9;Prostate, 10;Skin, 11;Soft_tissue, 12;Upper_aerodigestive_tract) |
| * From mRNA Sanger sequences, Chitars2.0 arranged chimeric transcripts. This table shows ANP32A related fusion information. |
| ID | Head Gene | Tail Gene | Accession | Gene_a | qStart_a | qEnd_a | Chromosome_a | tStart_a | tEnd_a | Gene_a | qStart_a | qEnd_a | Chromosome_a | tStart_a | tEnd_a |
| AA634993 | ANP32A | 1 | 341 | 15 | 69072759 | 69076924 | ANKRD12 | 336 | 389 | 18 | 9256041 | 9256094 | |
| AI990804 | ANP32A | 5 | 195 | 15 | 69076744 | 69076935 | MIR548F1 | 188 | 299 | 1 | 186283023 | 186283134 | |
| BG002858 | ANP32A | 11 | 154 | 15 | 69103700 | 69103844 | HES2 | 150 | 323 | 1 | 6476149 | 6476322 | |
| T20169 | ANP32A | 187 | 413 | 15 | 69071722 | 69071952 | C1orf87 | 404 | 423 | 1 | 60458727 | 60458746 | |
| AA173919 | POMT1 | 1 | 290 | 9 | 134398890 | 134399180 | ANP32A | 286 | 486 | 15 | 69072041 | 69072241 | |
| Top |
| There's no copy number variation information in COSMIC data for this gene. |
| Top |
|
 |
| Top |
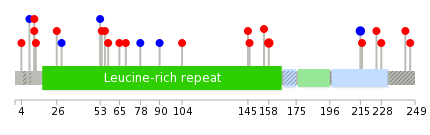
| Stat. for Non-Synonymous SNVs (# total SNVs=16) | (# total SNVs=3) |
 | 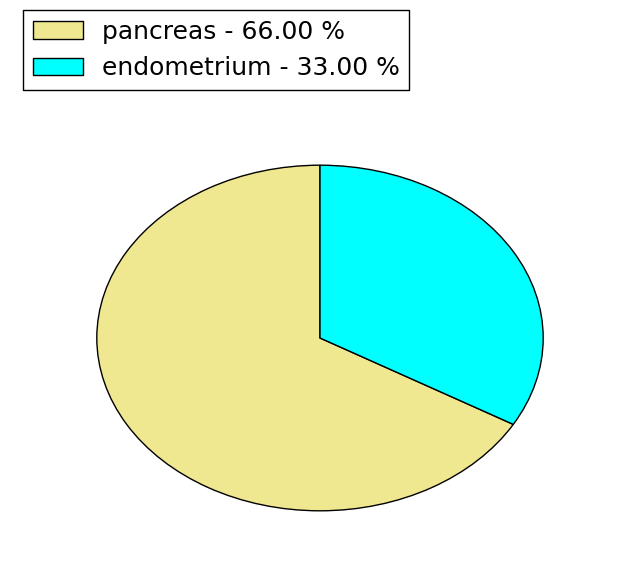 |
(# total SNVs=0) | (# total SNVs=0) |
| Top |
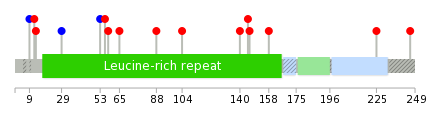
| * When you move the cursor on each content, you can see more deailed mutation information on the Tooltip. Those are primary_site,primary_histology,mutation(aa),pubmedID. |
| GRCh37 position | Mutation(aa) | Unique sampleID count |
| chr15:69072792-69072792 | p.N215N | 2 |
| chr15:69076789-69076789 | p.S158L | 2 |
| chr15:69113080-69113080 | p.G4D | 1 |
| chr15:69076799-69076799 | p.A155S | 1 |
| chr15:69080146-69080146 | p.S56L | 1 |
| chr15:69076826-69076826 | p.D146N | 1 |
| chr15:69080153-69080153 | p.L54V | 1 |
| chr15:69076829-69076829 | p.L145F | 1 |
| chr15:69080154-69080154 | p.G53G | 1 |
| chr15:69076865-69076865 | p.E133* | 1 |
| Top |
|
 |
| Point Mutation/ Tissue ID | 1 | 2 | 3 | 4 | 5 | 6 | 7 | 8 | 9 | 10 | 11 | 12 | 13 | 14 | 15 | 16 | 17 | 18 | 19 | 20 |
| # sample | 2 | 1 | 1 | 4 | 1 | 2 | 1 | 1 | 3 | |||||||||||
| # mutation | 2 | 1 | 1 | 4 | 1 | 2 | 1 | 1 | 3 | |||||||||||
| nonsynonymous SNV | 1 | 1 | 1 | 4 | 1 | 2 | 1 | 2 | ||||||||||||
| synonymous SNV | 1 | 1 | 1 |
| cf) Tissue ID; Tissue type (1; BLCA[Bladder Urothelial Carcinoma], 2; BRCA[Breast invasive carcinoma], 3; CESC[Cervical squamous cell carcinoma and endocervical adenocarcinoma], 4; COAD[Colon adenocarcinoma], 5; GBM[Glioblastoma multiforme], 6; Glioma Low Grade, 7; HNSC[Head and Neck squamous cell carcinoma], 8; KICH[Kidney Chromophobe], 9; KIRC[Kidney renal clear cell carcinoma], 10; KIRP[Kidney renal papillary cell carcinoma], 11; LAML[Acute Myeloid Leukemia], 12; LUAD[Lung adenocarcinoma], 13; LUSC[Lung squamous cell carcinoma], 14; OV[Ovarian serous cystadenocarcinoma ], 15; PAAD[Pancreatic adenocarcinoma], 16; PRAD[Prostate adenocarcinoma], 17; SKCM[Skin Cutaneous Melanoma], 18:STAD[Stomach adenocarcinoma], 19:THCA[Thyroid carcinoma], 20:UCEC[Uterine Corpus Endometrial Carcinoma]) |
| Top |
| * We represented just top 10 SNVs. When you move the cursor on each content, you can see more deailed mutation information on the Tooltip. Those are primary_site, primary_histology, mutation(aa), pubmedID. |
| Genomic Position | Mutation(aa) | Unique sampleID count |
| chr15:69079816 | p.K65T | 1 |
| chr15:69080119 | p.A58T | 1 |
| chr15:69080141 | p.S56L | 1 |
| chr15:69080146 | p.G53G | 1 |
| chr15:69072434 | p.S29S | 1 |
| chr15:69080154 | p.N13K | 1 |
| chr15:69072764 | p.R12L | 1 |
| chr15:69080226 | p.L9L | 1 |
| chr15:69076789 | p.E246Q | 1 |
| chr15:69113052 | p.E225K | 1 |
| * Copy number data were extracted from TCGA using R package TCGA-Assembler. The URLs of all public data files on TCGA DCC data server were gathered on Jan-05-2015. Function ProcessCNAData in TCGA-Assembler package was used to obtain gene-level copy number value which is calculated as the average copy number of the genomic region of a gene. |
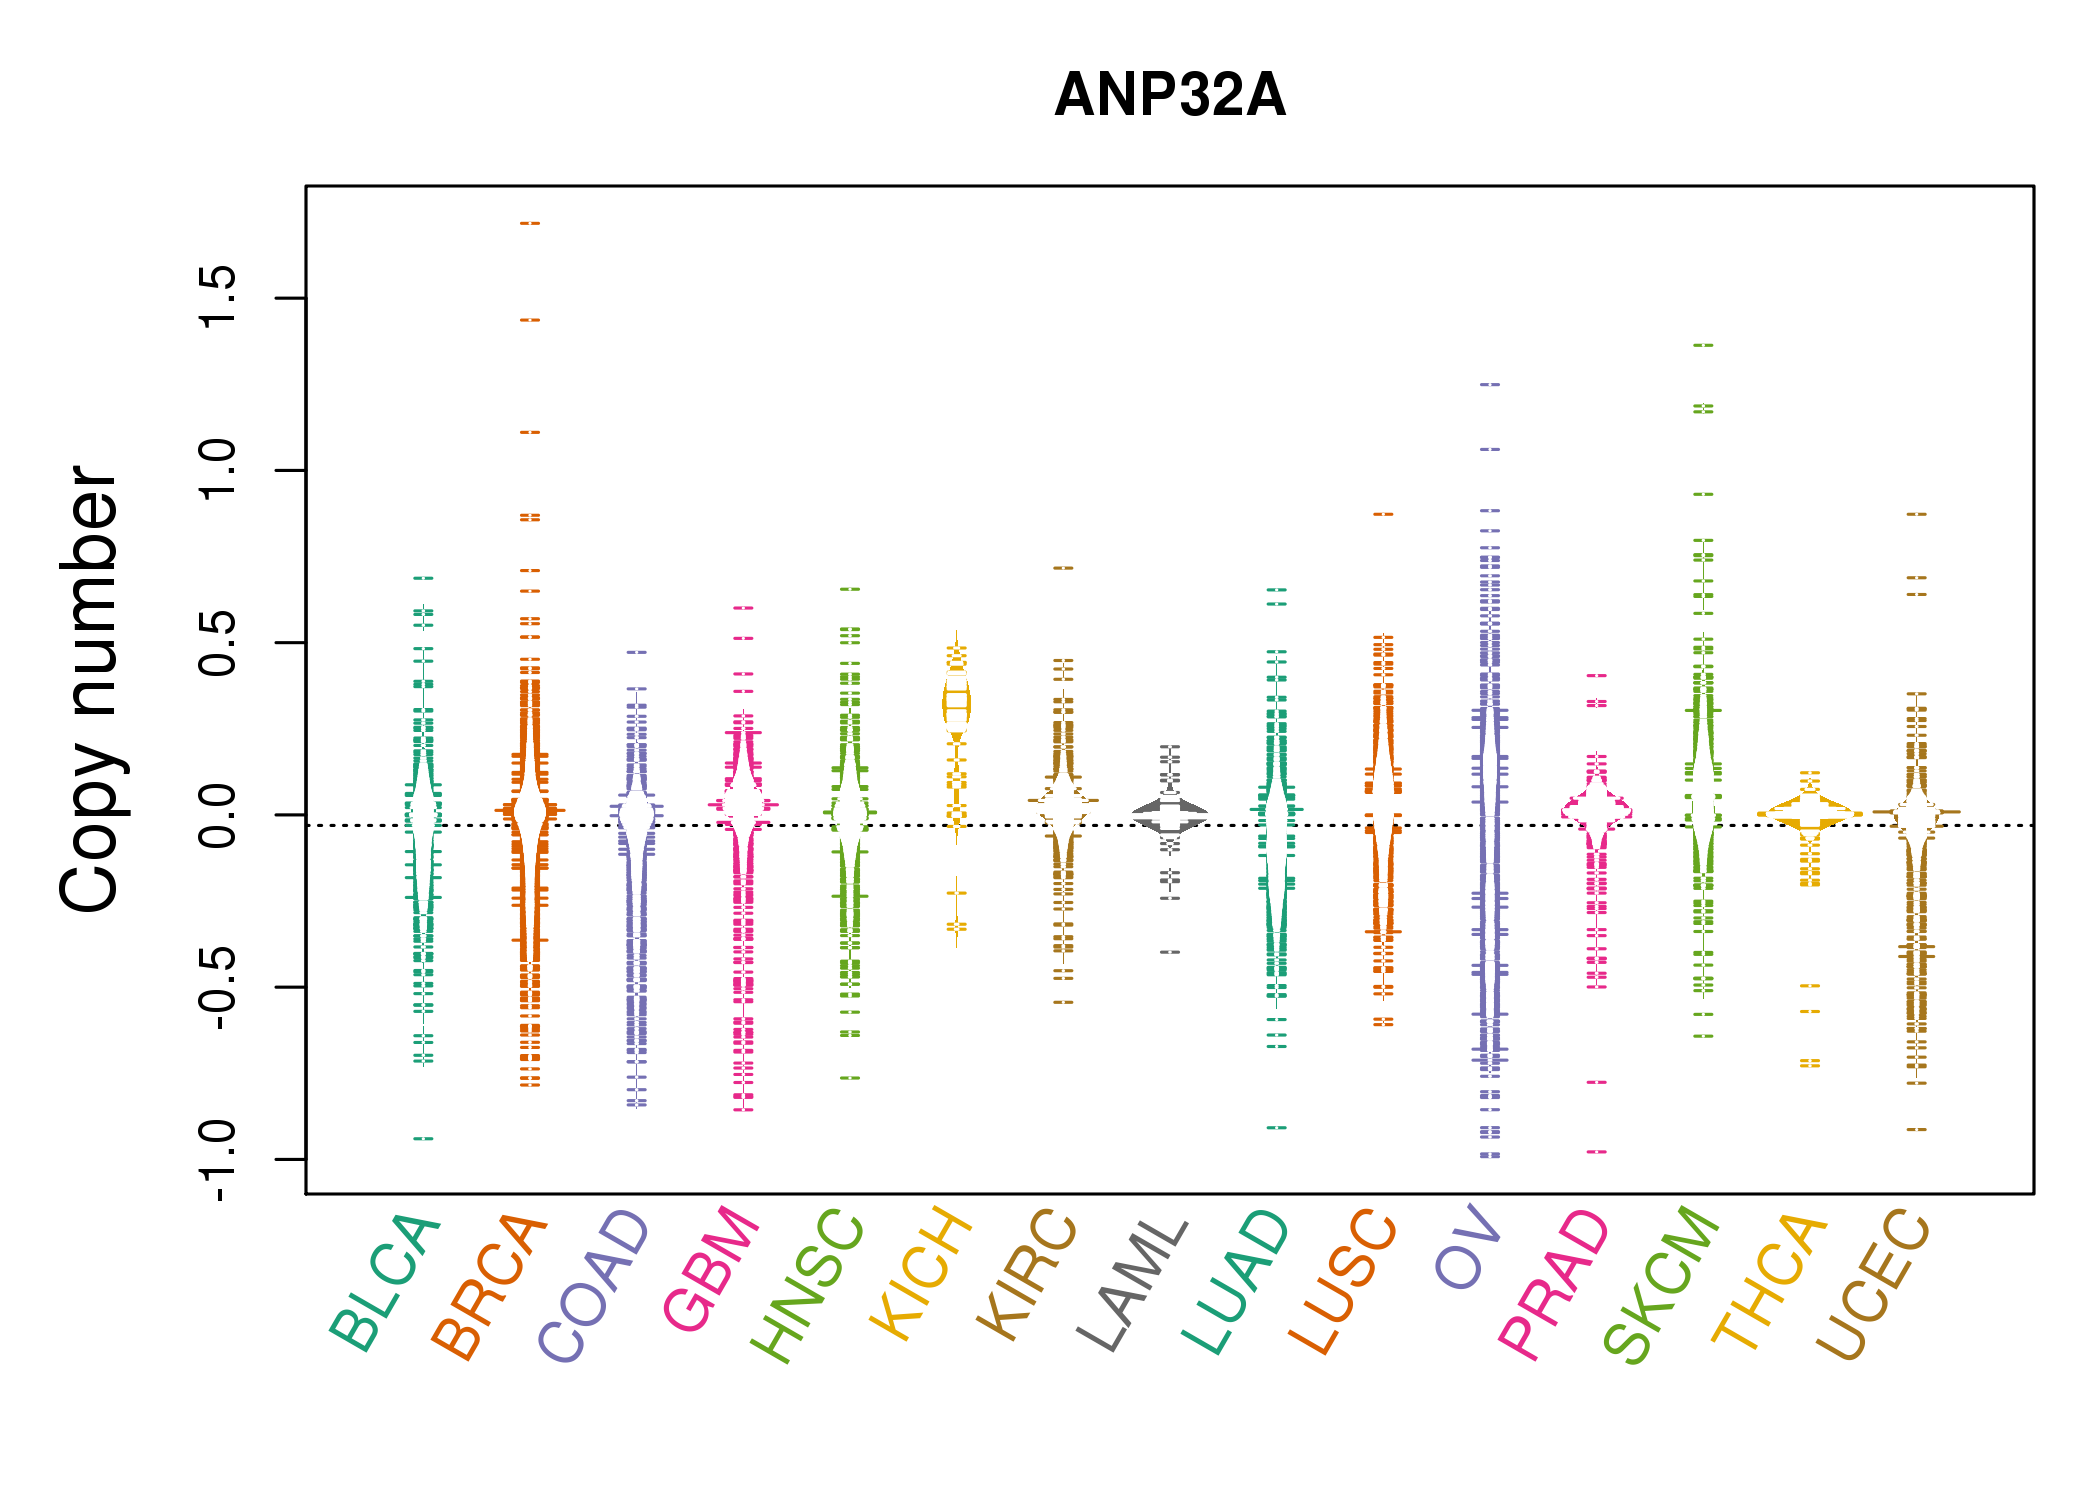 |
| cf) Tissue ID[Tissue type]: BLCA[Bladder Urothelial Carcinoma], BRCA[Breast invasive carcinoma], CESC[Cervical squamous cell carcinoma and endocervical adenocarcinoma], COAD[Colon adenocarcinoma], GBM[Glioblastoma multiforme], Glioma Low Grade, HNSC[Head and Neck squamous cell carcinoma], KICH[Kidney Chromophobe], KIRC[Kidney renal clear cell carcinoma], KIRP[Kidney renal papillary cell carcinoma], LAML[Acute Myeloid Leukemia], LUAD[Lung adenocarcinoma], LUSC[Lung squamous cell carcinoma], OV[Ovarian serous cystadenocarcinoma ], PAAD[Pancreatic adenocarcinoma], PRAD[Prostate adenocarcinoma], SKCM[Skin Cutaneous Melanoma], STAD[Stomach adenocarcinoma], THCA[Thyroid carcinoma], UCEC[Uterine Corpus Endometrial Carcinoma] |
| Top |
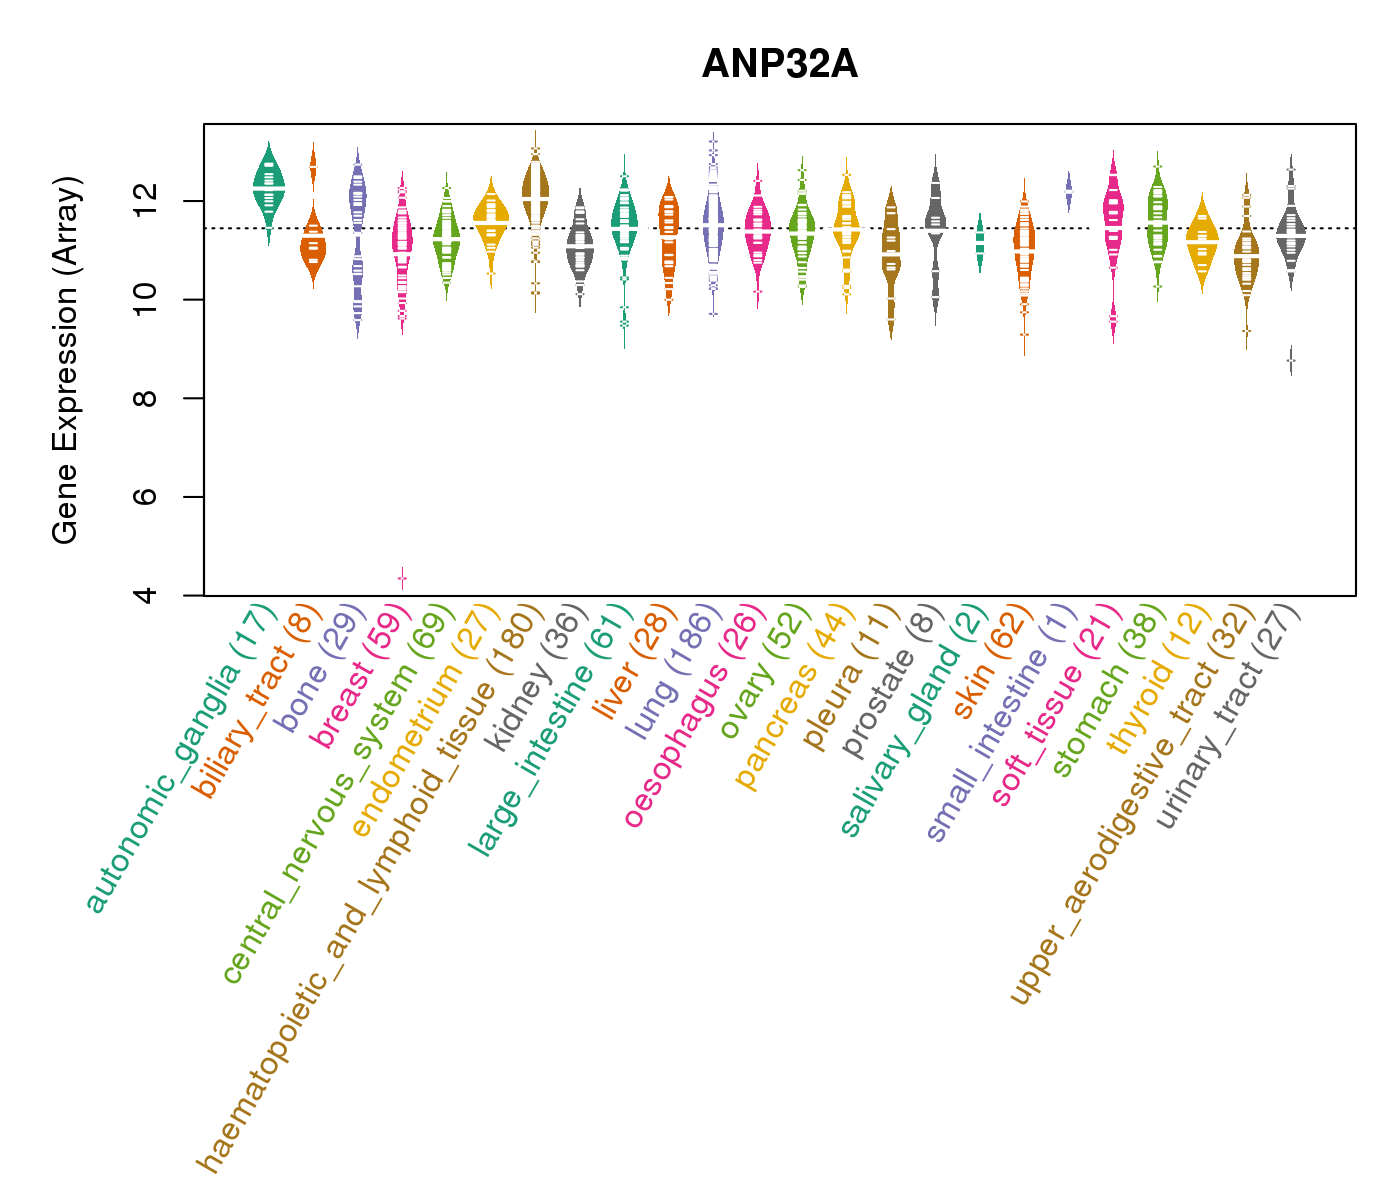
| Gene Expression for ANP32A |
| * CCLE gene expression data were extracted from CCLE_Expression_Entrez_2012-10-18.res: Gene-centric RMA-normalized mRNA expression data. |
 |
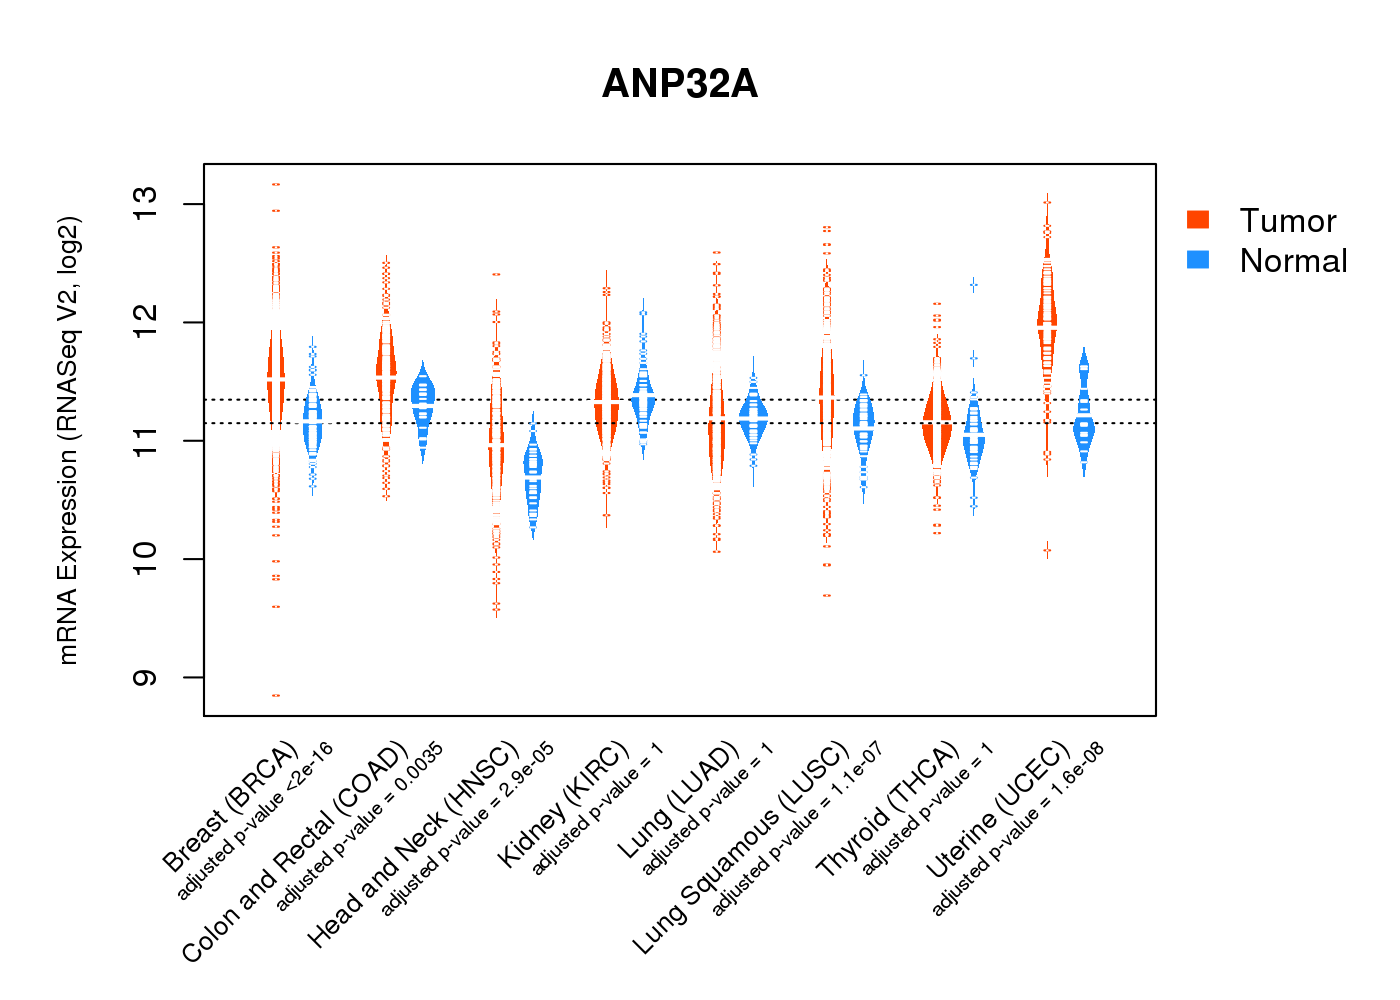
| * Normalized gene expression data of RNASeqV2 was extracted from TCGA using R package TCGA-Assembler. The URLs of all public data files on TCGA DCC data server were gathered at Jan-05-2015. Only eight cancer types have enough normal control samples for differential expression analysis. (t test, adjusted p<0.05 (using Benjamini-Hochberg FDR)) |
 |
| Top |
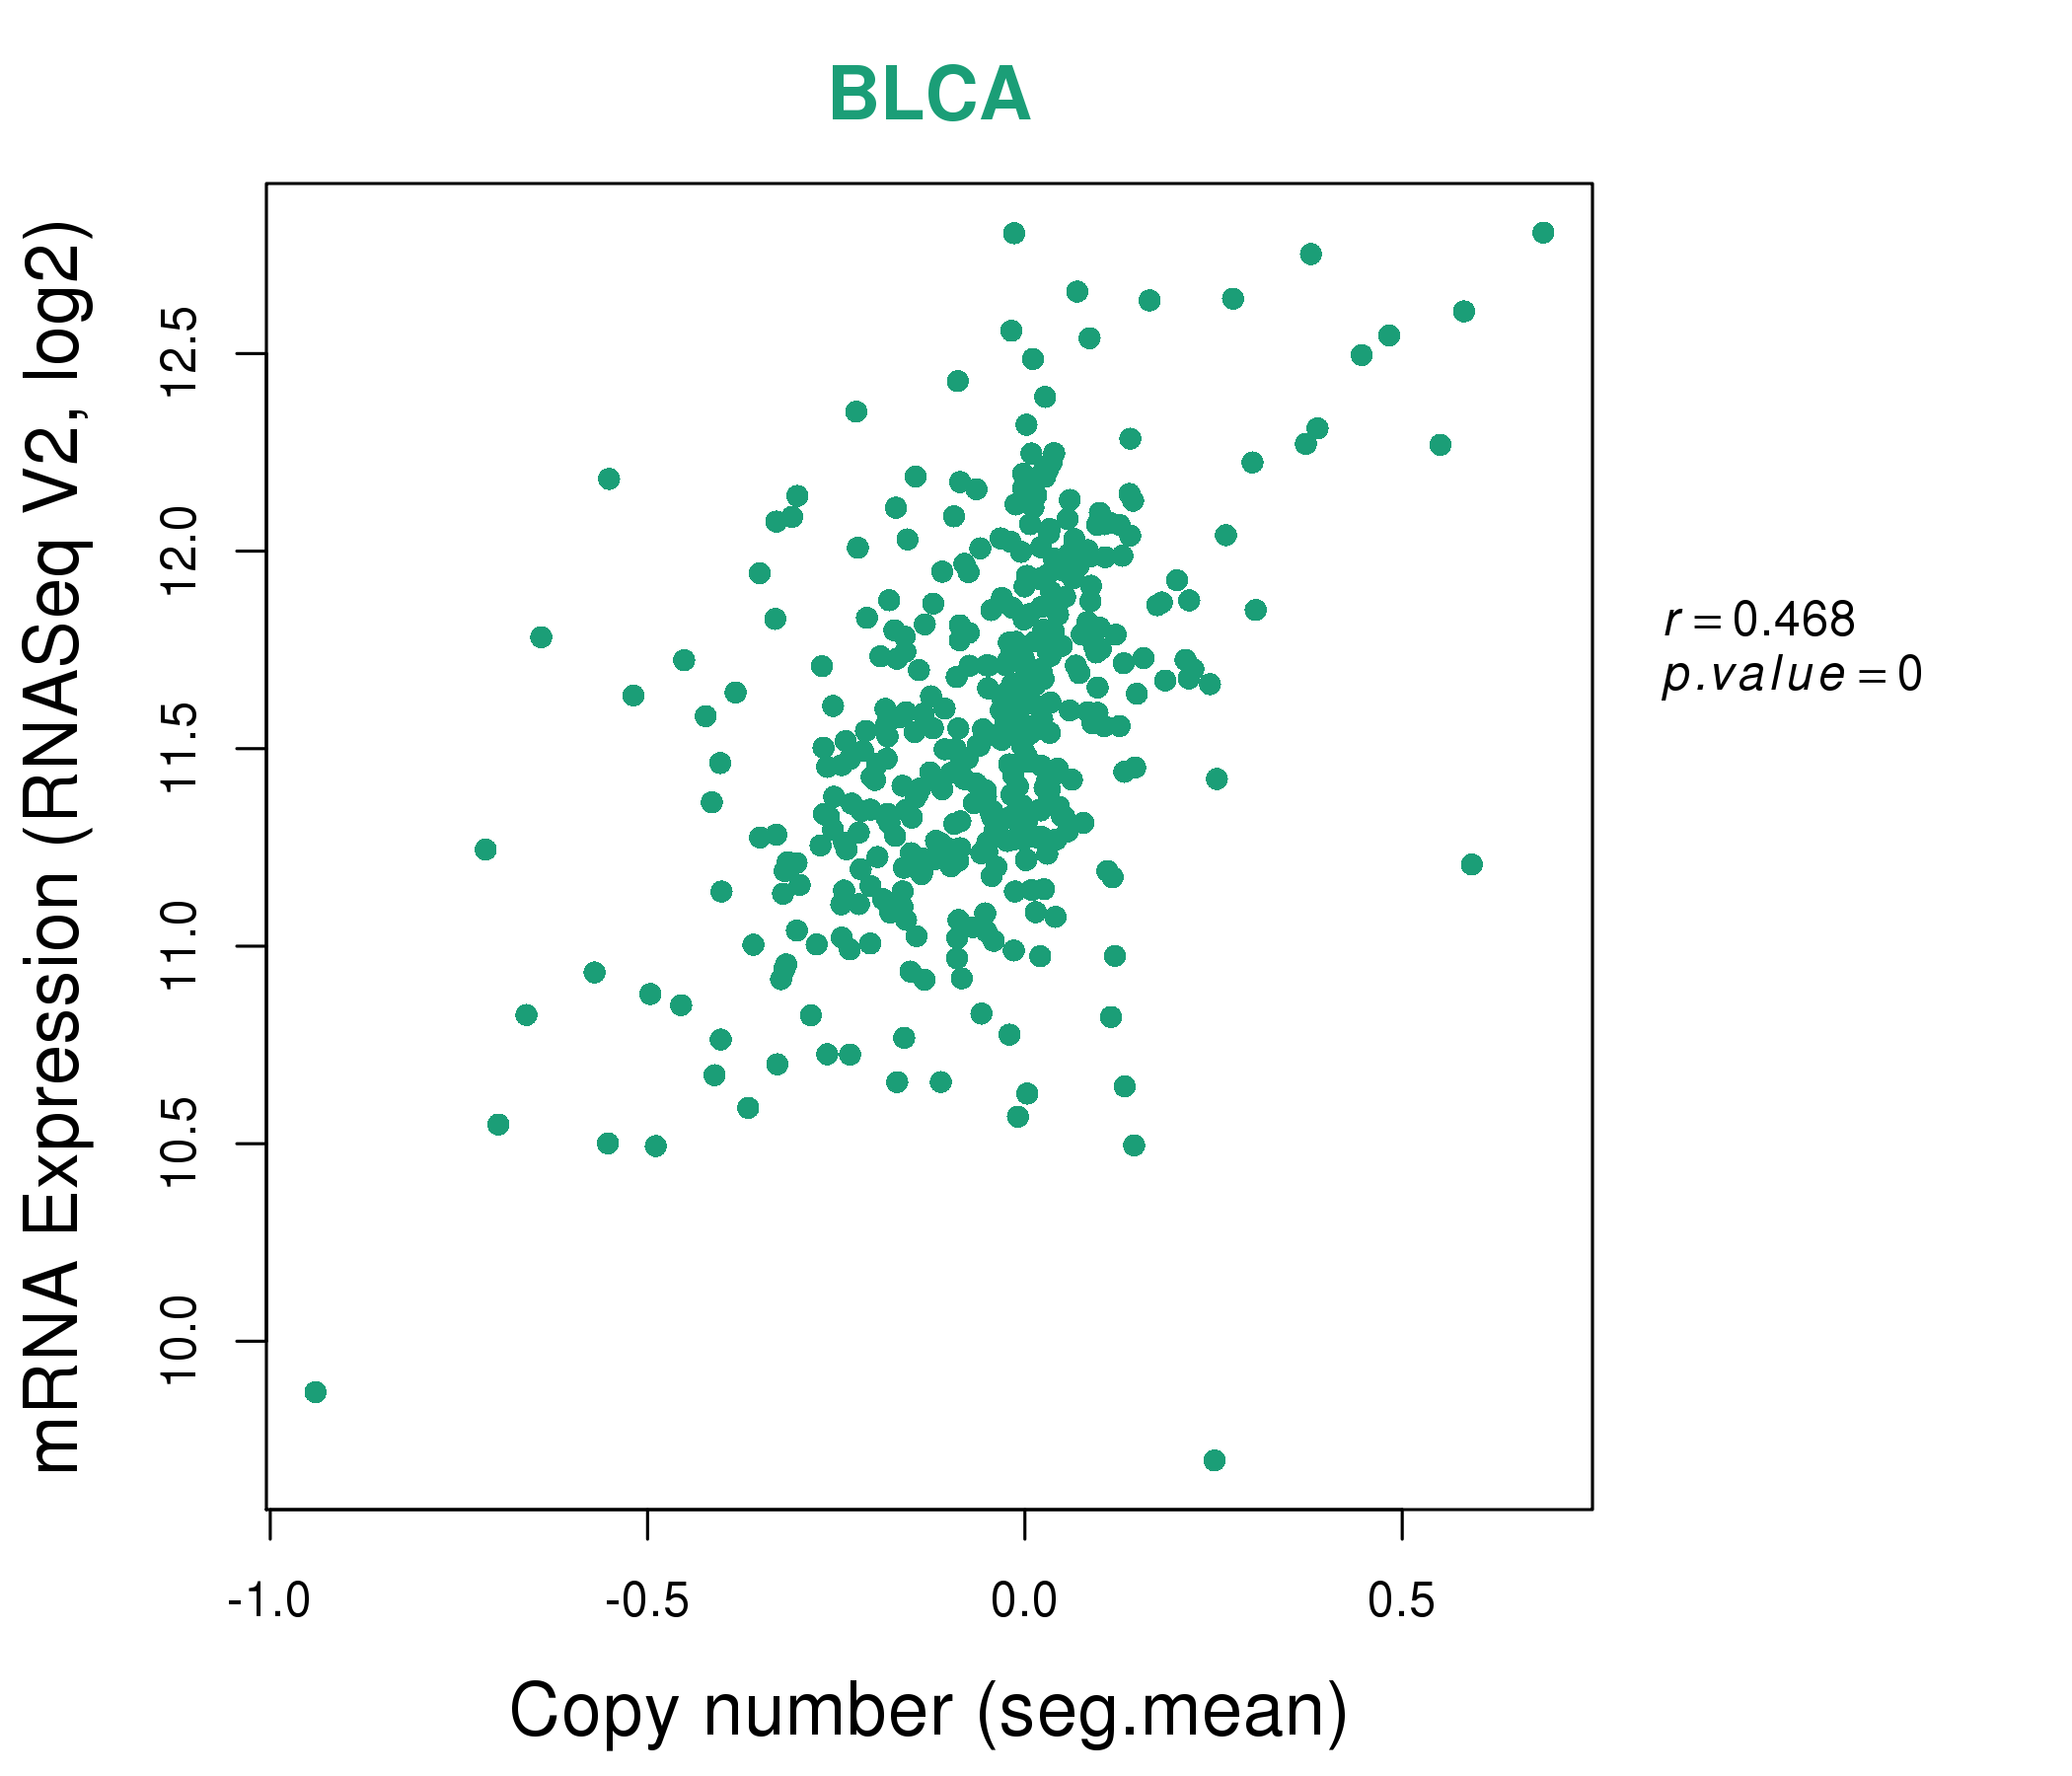
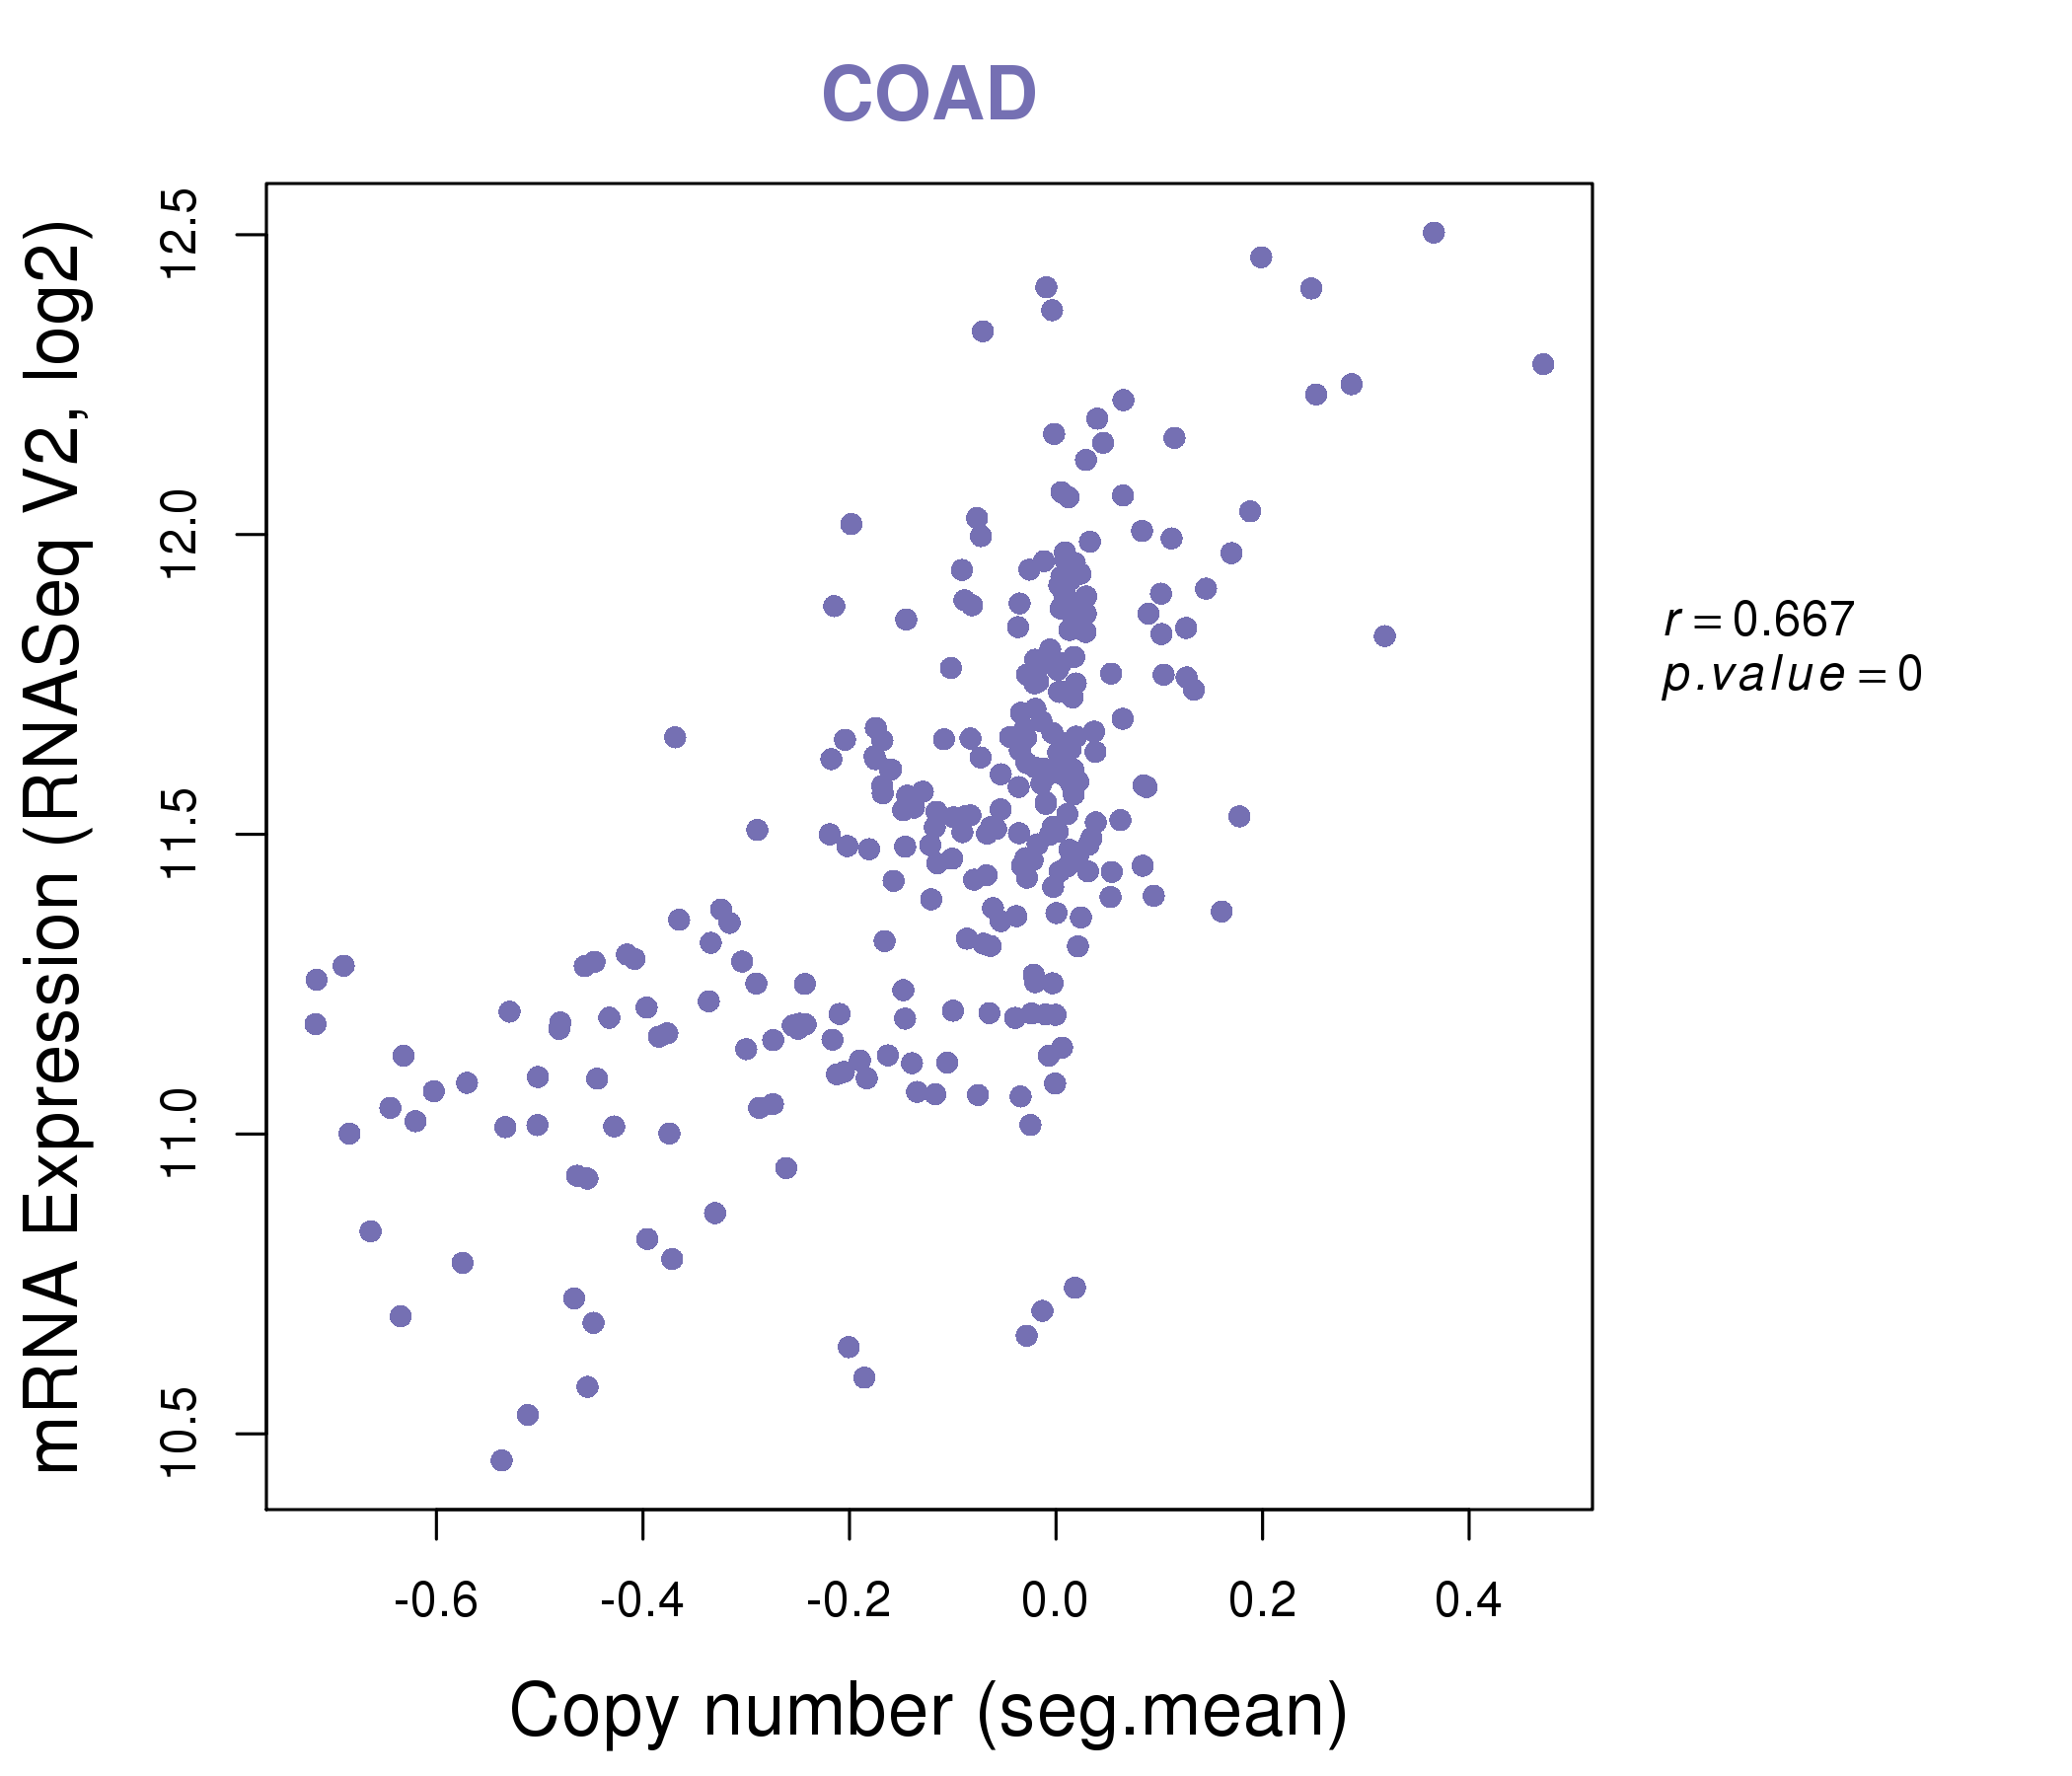
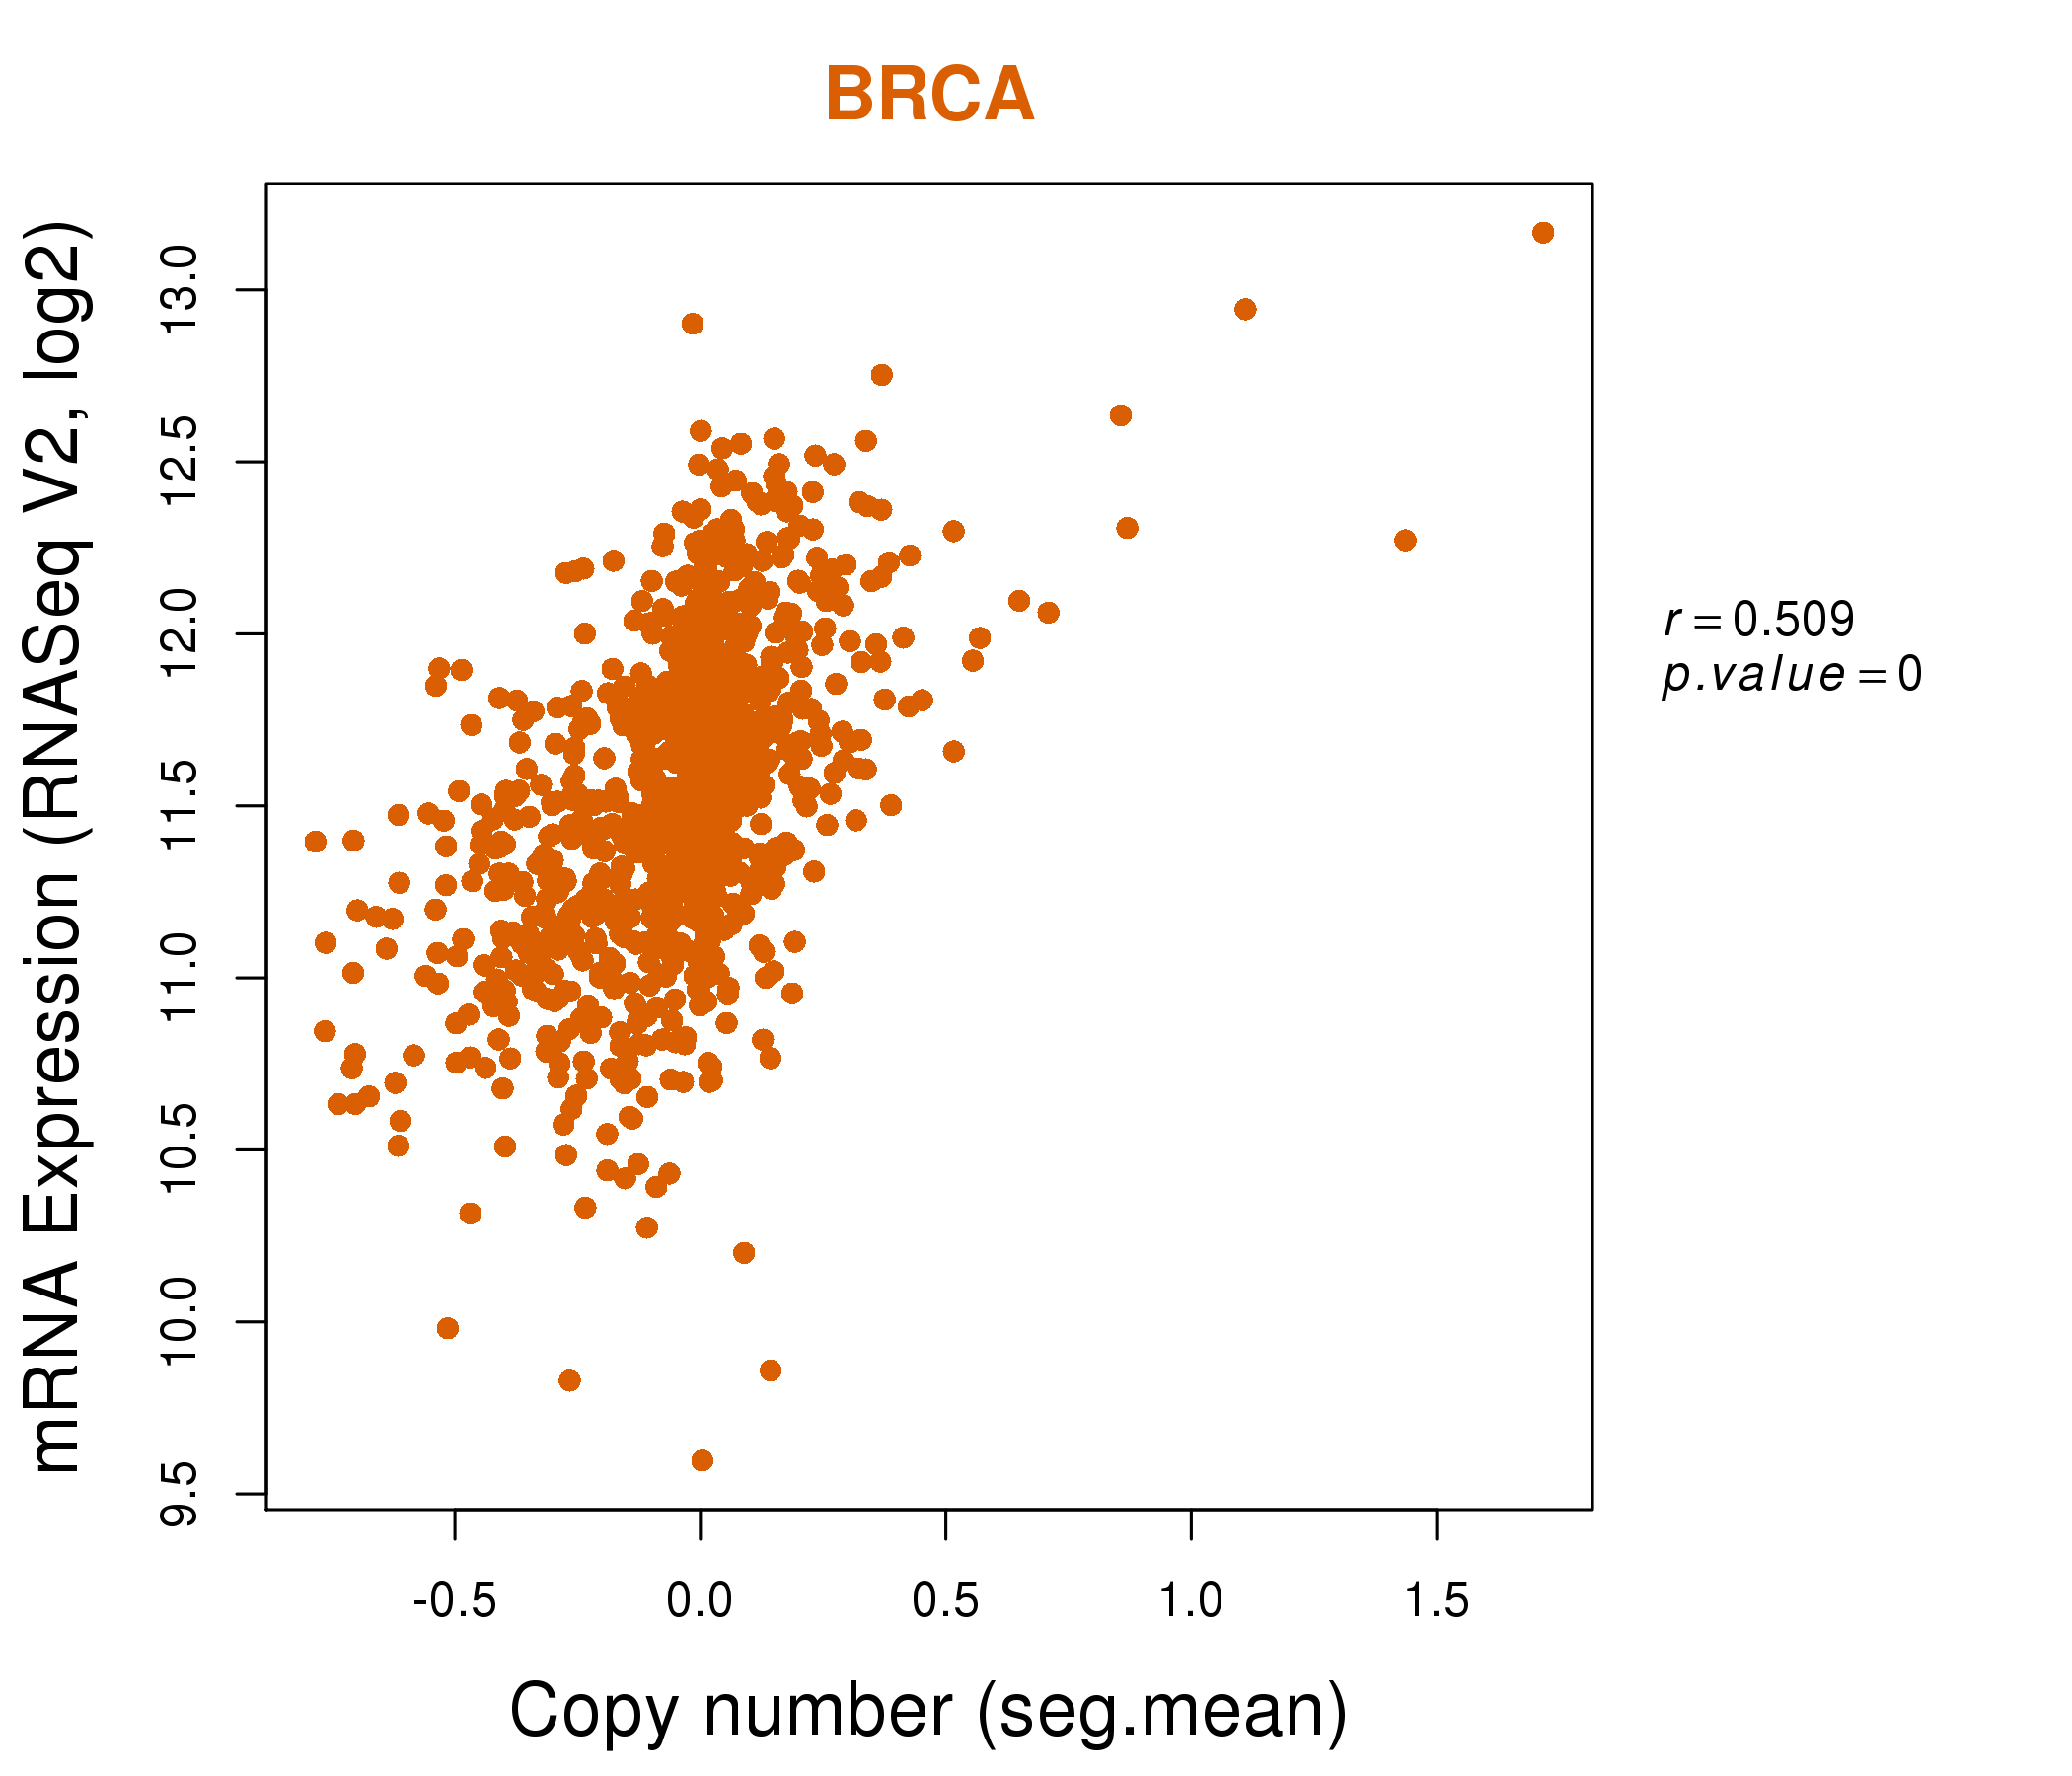
| * This plots show the correlation between CNV and gene expression. |
: Open all plots for all cancer types
 |
|
 |
|

| Top |
| Gene-Gene Network Information |
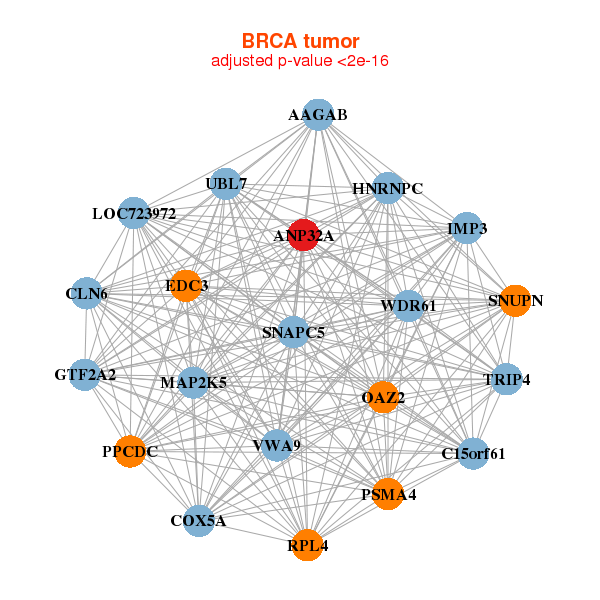
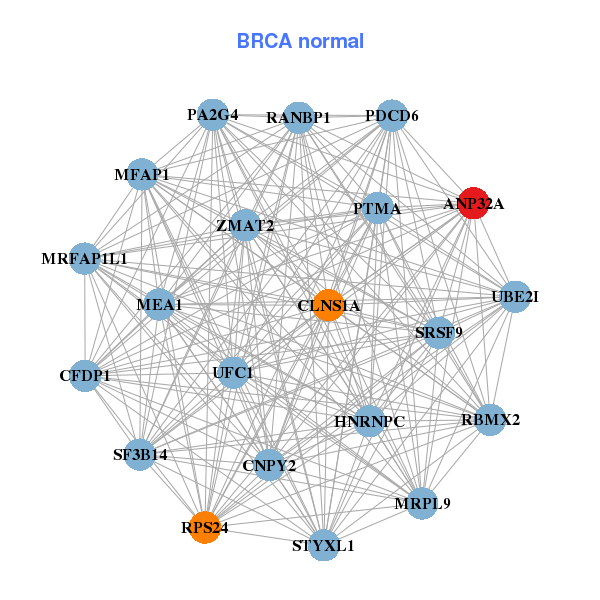
| * Co-Expression network figures were drawn using R package igraph. Only the top 20 genes with the highest correlations were shown. Red circle: input gene, orange circle: cell metabolism gene, sky circle: other gene |
: Open all plots for all cancer types
 |
|
| AAGAB,ANP32A,VWA9,C15orf61,CLN6,COX5A,EDC3, GTF2A2,HNRNPC,IMP3,LOC723972,MAP2K5,OAZ2,PPCDC, PSMA4,RPL4,SNAPC5,SNUPN,TRIP4,UBL7,WDR61 | ANP32A,CFDP1,CLNS1A,CNPY2,HNRNPC,MEA1,MFAP1, MRFAP1L1,MRPL9,PA2G4,PDCD6,PTMA,RANBP1,RBMX2, RPS24,SF3B14,SRSF9,STYXL1,UBE2I,UFC1,ZMAT2 |
 |
|
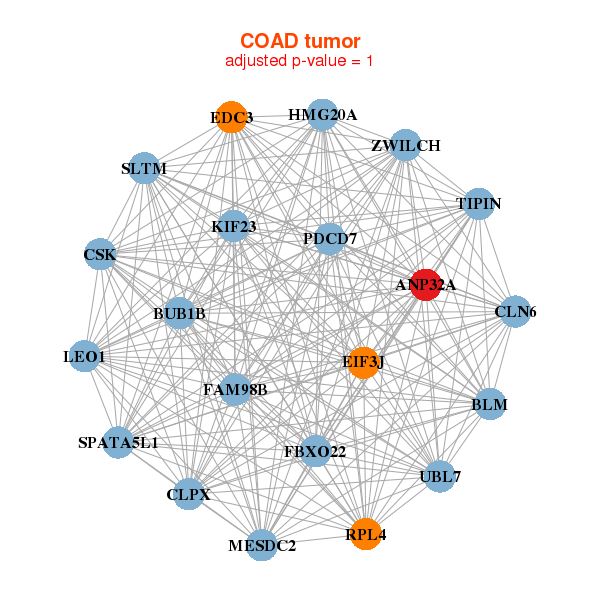
| ANP32A,BLM,BUB1B,CLN6,CLPX,CSK,EDC3, EIF3J,FAM98B,FBXO22,HMG20A,KIF23,LEO1,MESDC2, PDCD7,RPL4,SLTM,SPATA5L1,TIPIN,UBL7,ZWILCH | ANP32A,ANP32B,ATP2C1,BCL11A,CAPRIN1,CCDC15,CRLF2, DCP2,GPHN,HNRNPA1,HNRNPH3,L3MBTL3,MED17,MEX3C, NPAT,PHF6,RHOV,SBK1,STX6,SUDS3,USP48 |
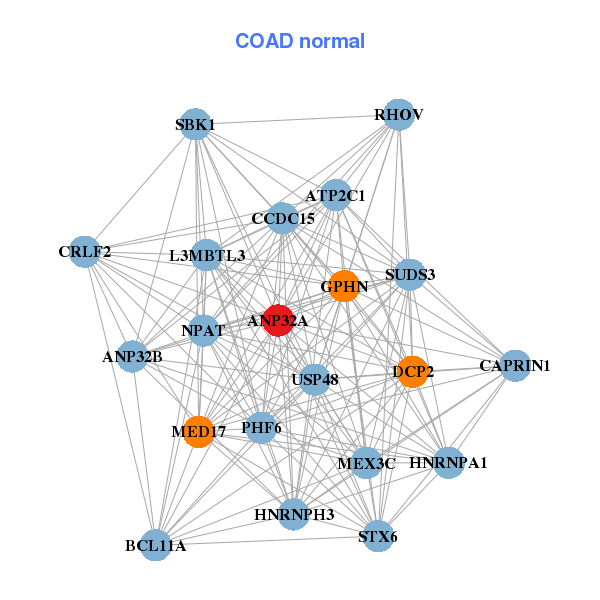
| * Co-Expression network figures were drawn using R package igraph. Only the top 20 genes with the highest correlations were shown. Red circle: input gene, orange circle: cell metabolism gene, sky circle: other gene |
: Open all plots for all cancer types
| Top |
: Open all interacting genes' information including KEGG pathway for all interacting genes from DAVID
| Top |
| Pharmacological Information for ANP32A |
| There's no related Drug. |
| Top |
| Cross referenced IDs for ANP32A |
| * We obtained these cross-references from Uniprot database. It covers 150 different DBs, 18 categories. http://www.uniprot.org/help/cross_references_section |
: Open all cross reference information
|
Copyright © 2016-Present - The Univsersity of Texas Health Science Center at Houston @ |