|
||||||||||||||||||||
| |
| Phenotypic Information (metabolism pathway, cancer, disease, phenome) |
| |
| |
| Gene-Gene Network Information: Co-Expression Network, Interacting Genes & KEGG |
| |
|


| Gene Summary for PTDSS2 |
| Basic gene info. | Gene symbol | PTDSS2 |
| Gene name | phosphatidylserine synthase 2 | |
| Synonyms | PSS2 | |
| Cytomap | UCSC genome browser: 11p15.5 | |
| Genomic location | chr11 :450279-491387 | |
| Type of gene | protein-coding | |
| RefGenes | NM_030783.1, | |
| Ensembl id | ENSG00000174915 | |
| Description | PSS-2ptdSer synthase 2serine-exchange enzyme II | |
| Modification date | 20141207 | |
| dbXrefs | MIM : 612793 | |
| HGNC : HGNC | ||
| Ensembl : ENSG00000174915 | ||
| HPRD : 17927 | ||
| Vega : OTTHUMG00000119087 | ||
| Protein | UniProt: go to UniProt's Cross Reference DB Table | |
| Expression | CleanEX: HS_PTDSS2 | |
| BioGPS: 81490 | ||
| Gene Expression Atlas: ENSG00000174915 | ||
| The Human Protein Atlas: ENSG00000174915 | ||
| Pathway | NCI Pathway Interaction Database: PTDSS2 | |
| KEGG: PTDSS2 | ||
| REACTOME: PTDSS2 | ||
| ConsensusPathDB | ||
| Pathway Commons: PTDSS2 | ||
| Metabolism | MetaCyc: PTDSS2 | |
| HUMANCyc: PTDSS2 | ||
| Regulation | Ensembl's Regulation: ENSG00000174915 | |
| miRBase: chr11 :450,279-491,387 | ||
| TargetScan: NM_030783 | ||
| cisRED: ENSG00000174915 | ||
| Context | iHOP: PTDSS2 | |
| cancer metabolism search in PubMed: PTDSS2 | ||
| UCL Cancer Institute: PTDSS2 | ||
| Assigned class in ccmGDB | C | |
| Top |
| Phenotypic Information for PTDSS2(metabolism pathway, cancer, disease, phenome) |
| Cancer | CGAP: PTDSS2 |
| Familial Cancer Database: PTDSS2 | |
| * This gene is included in those cancer gene databases. |
|
|
|
|
|
| . | ||||||||||||||
Oncogene 1 | Significant driver gene in | |||||||||||||||||||
| cf) number; DB name 1 Oncogene; http://nar.oxfordjournals.org/content/35/suppl_1/D721.long, 2 Tumor Suppressor gene; https://bioinfo.uth.edu/TSGene/, 3 Cancer Gene Census; http://www.nature.com/nrc/journal/v4/n3/abs/nrc1299.html, 4 CancerGenes; http://nar.oxfordjournals.org/content/35/suppl_1/D721.long, 5 Network of Cancer Gene; http://ncg.kcl.ac.uk/index.php, 1Therapeutic Vulnerabilities in Cancer; http://cbio.mskcc.org/cancergenomics/statius/ |
| KEGG_GLYCEROPHOSPHOLIPID_METABOLISM REACTOME_PHOSPHOLIPID_METABOLISM REACTOME_METABOLISM_OF_LIPIDS_AND_LIPOPROTEINS | |
| OMIM | |
| Orphanet | |
| Disease | KEGG Disease: PTDSS2 |
| MedGen: PTDSS2 (Human Medical Genetics with Condition) | |
| ClinVar: PTDSS2 | |
| Phenotype | MGI: PTDSS2 (International Mouse Phenotyping Consortium) |
| PhenomicDB: PTDSS2 | |
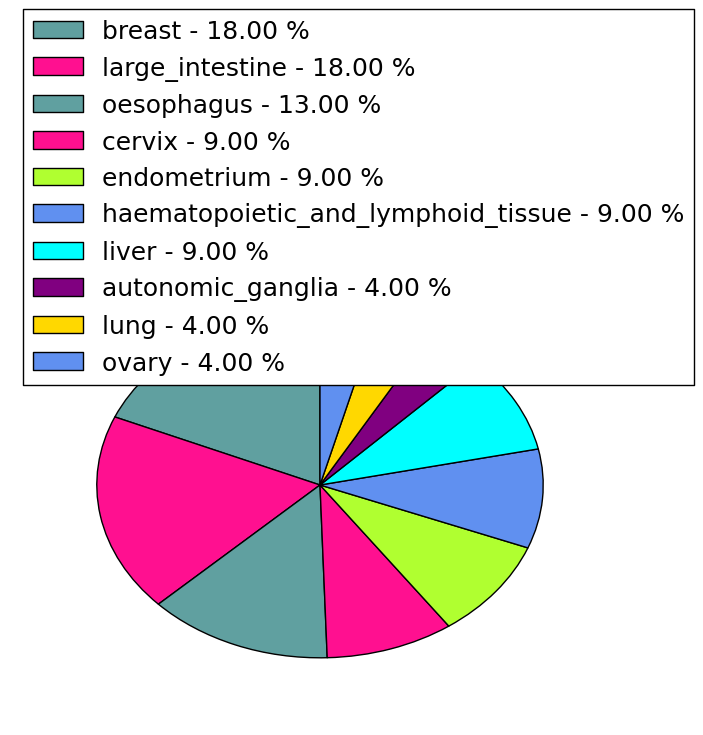
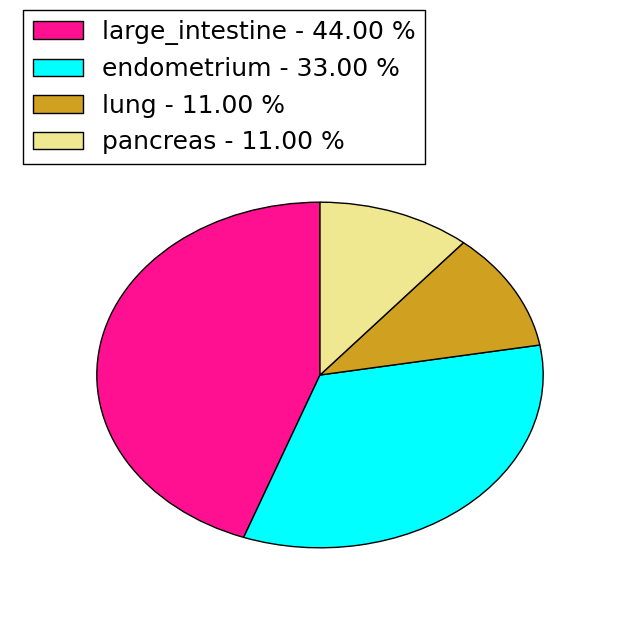
| Mutations for PTDSS2 |
| * Under tables are showing count per each tissue to give us broad intuition about tissue specific mutation patterns.You can go to the detailed page for each mutation database's web site. |
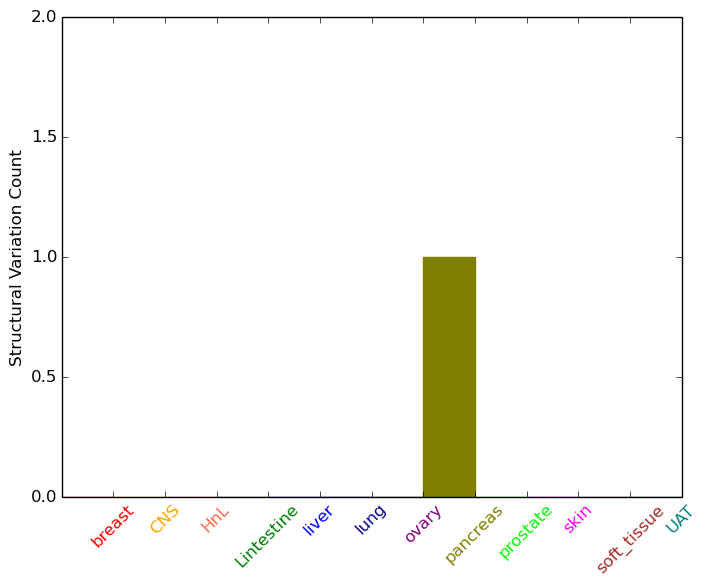
| - Statistics for Tissue and Mutation type | Top |
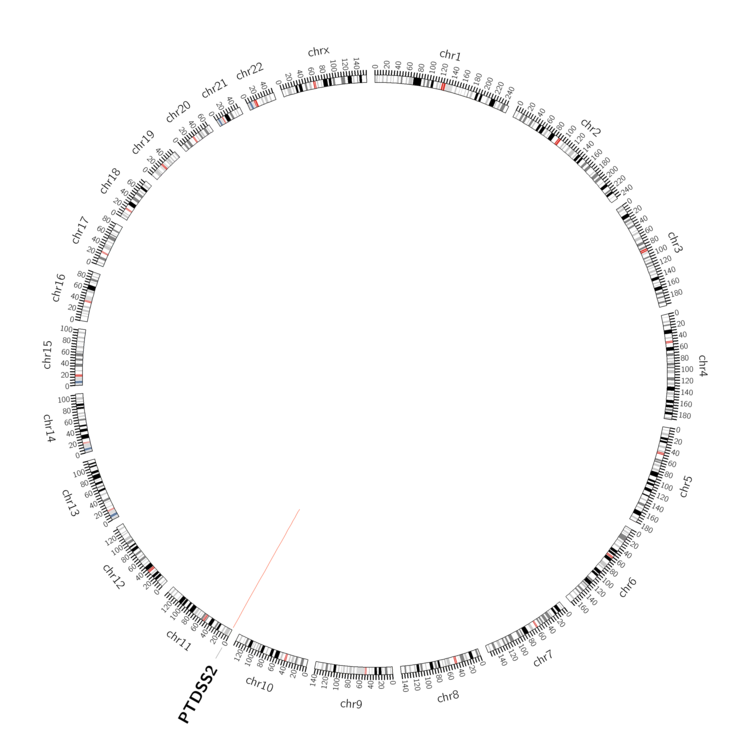 |
| - For Inter-chromosomal Variations |
| There's no inter-chromosomal structural variation. |
| - For Intra-chromosomal Variations |
| * Intra-chromosomal variantions includes 'intrachromosomal amplicon to amplicon', 'intrachromosomal amplicon to non-amplified dna', 'intrachromosomal deletion', 'intrachromosomal fold-back inversion', 'intrachromosomal inversion', 'intrachromosomal tandem duplication', 'Intrachromosomal unknown type', 'intrachromosomal with inverted orientation', 'intrachromosomal with non-inverted orientation'. |
 |
| Sample | Symbol_a | Chr_a | Start_a | End_a | Symbol_b | Chr_b | Start_b | End_b |
| pancreas | PTDSS2 | chr11 | 475283 | 475303 | PTDSS2 | chr11 | 474996 | 475016 |
| cf) Tissue number; Tissue name (1;Breast, 2;Central_nervous_system, 3;Haematopoietic_and_lymphoid_tissue, 4;Large_intestine, 5;Liver, 6;Lung, 7;Ovary, 8;Pancreas, 9;Prostate, 10;Skin, 11;Soft_tissue, 12;Upper_aerodigestive_tract) |
| * From mRNA Sanger sequences, Chitars2.0 arranged chimeric transcripts. This table shows PTDSS2 related fusion information. |
| ID | Head Gene | Tail Gene | Accession | Gene_a | qStart_a | qEnd_a | Chromosome_a | tStart_a | tEnd_a | Gene_a | qStart_a | qEnd_a | Chromosome_a | tStart_a | tEnd_a |
| Top |
| There's no copy number variation information in COSMIC data for this gene. |
| Top |
|
 |
| Top |
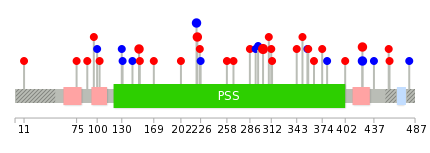
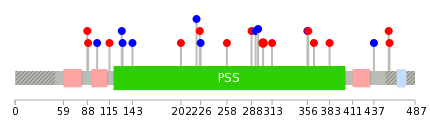
| Stat. for Non-Synonymous SNVs (# total SNVs=22) | (# total SNVs=9) |
 |  |
(# total SNVs=0) | (# total SNVs=0) |
| Top |
| * When you move the cursor on each content, you can see more deailed mutation information on the Tooltip. Those are primary_site,primary_histology,mutation(aa),pubmedID. |
| GRCh37 position | Mutation(aa) | Unique sampleID count |
| chr11:489449-489449 | p.R302C | 3 |
| chr11:486954-486954 | p.R151W | 2 |
| chr11:488240-488240 | p.S221S | 2 |
| chr11:490034-490034 | p.A423S | 2 |
| chr11:488241-488241 | p.V222L | 2 |
| chr11:490036-490036 | p.A423A | 2 |
| chr11:488255-488255 | p.F226F | 1 |
| chr11:489647-489647 | p.E343D | 1 |
| chr11:479122-479122 | p.Y135* | 1 |
| chr11:490481-490481 | p.G455R | 1 |
| Top |
|
 |
| Point Mutation/ Tissue ID | 1 | 2 | 3 | 4 | 5 | 6 | 7 | 8 | 9 | 10 | 11 | 12 | 13 | 14 | 15 | 16 | 17 | 18 | 19 | 20 |
| # sample | 2 | 2 | 1 | 2 | 3 | 1 | 4 | 4 | 1 | 3 | ||||||||||
| # mutation | 2 | 2 | 1 | 2 | 3 | 1 | 3 | 4 | 1 | 5 | ||||||||||
| nonsynonymous SNV | 2 | 2 | 1 | 3 | 1 | 2 | 1 | 2 | ||||||||||||
| synonymous SNV | 1 | 1 | 1 | 2 | 2 | 3 |
| cf) Tissue ID; Tissue type (1; BLCA[Bladder Urothelial Carcinoma], 2; BRCA[Breast invasive carcinoma], 3; CESC[Cervical squamous cell carcinoma and endocervical adenocarcinoma], 4; COAD[Colon adenocarcinoma], 5; GBM[Glioblastoma multiforme], 6; Glioma Low Grade, 7; HNSC[Head and Neck squamous cell carcinoma], 8; KICH[Kidney Chromophobe], 9; KIRC[Kidney renal clear cell carcinoma], 10; KIRP[Kidney renal papillary cell carcinoma], 11; LAML[Acute Myeloid Leukemia], 12; LUAD[Lung adenocarcinoma], 13; LUSC[Lung squamous cell carcinoma], 14; OV[Ovarian serous cystadenocarcinoma ], 15; PAAD[Pancreatic adenocarcinoma], 16; PRAD[Prostate adenocarcinoma], 17; SKCM[Skin Cutaneous Melanoma], 18:STAD[Stomach adenocarcinoma], 19:THCA[Thyroid carcinoma], 20:UCEC[Uterine Corpus Endometrial Carcinoma]) |
| Top |
| * We represented just top 10 SNVs. When you move the cursor on each content, you can see more deailed mutation information on the Tooltip. Those are primary_site, primary_histology, mutation(aa), pubmedID. |
| Genomic Position | Mutation(aa) | Unique sampleID count |
| chr11:489449 | p.R302C | 2 |
| chr11:489687 | p.I258M | 1 |
| chr11:488240 | p.M288L | 1 |
| chr11:489708 | p.F293F | 1 |
| chr11:488250 | p.T296T | 1 |
| chr11:489914 | p.R313C | 1 |
| chr11:488255 | p.D88N | 1 |
| chr11:490429 | p.N356N | 1 |
| chr11:460266 | p.T89S | 1 |
| chr11:488567 | p.V357M | 1 |
| * Copy number data were extracted from TCGA using R package TCGA-Assembler. The URLs of all public data files on TCGA DCC data server were gathered on Jan-05-2015. Function ProcessCNAData in TCGA-Assembler package was used to obtain gene-level copy number value which is calculated as the average copy number of the genomic region of a gene. |
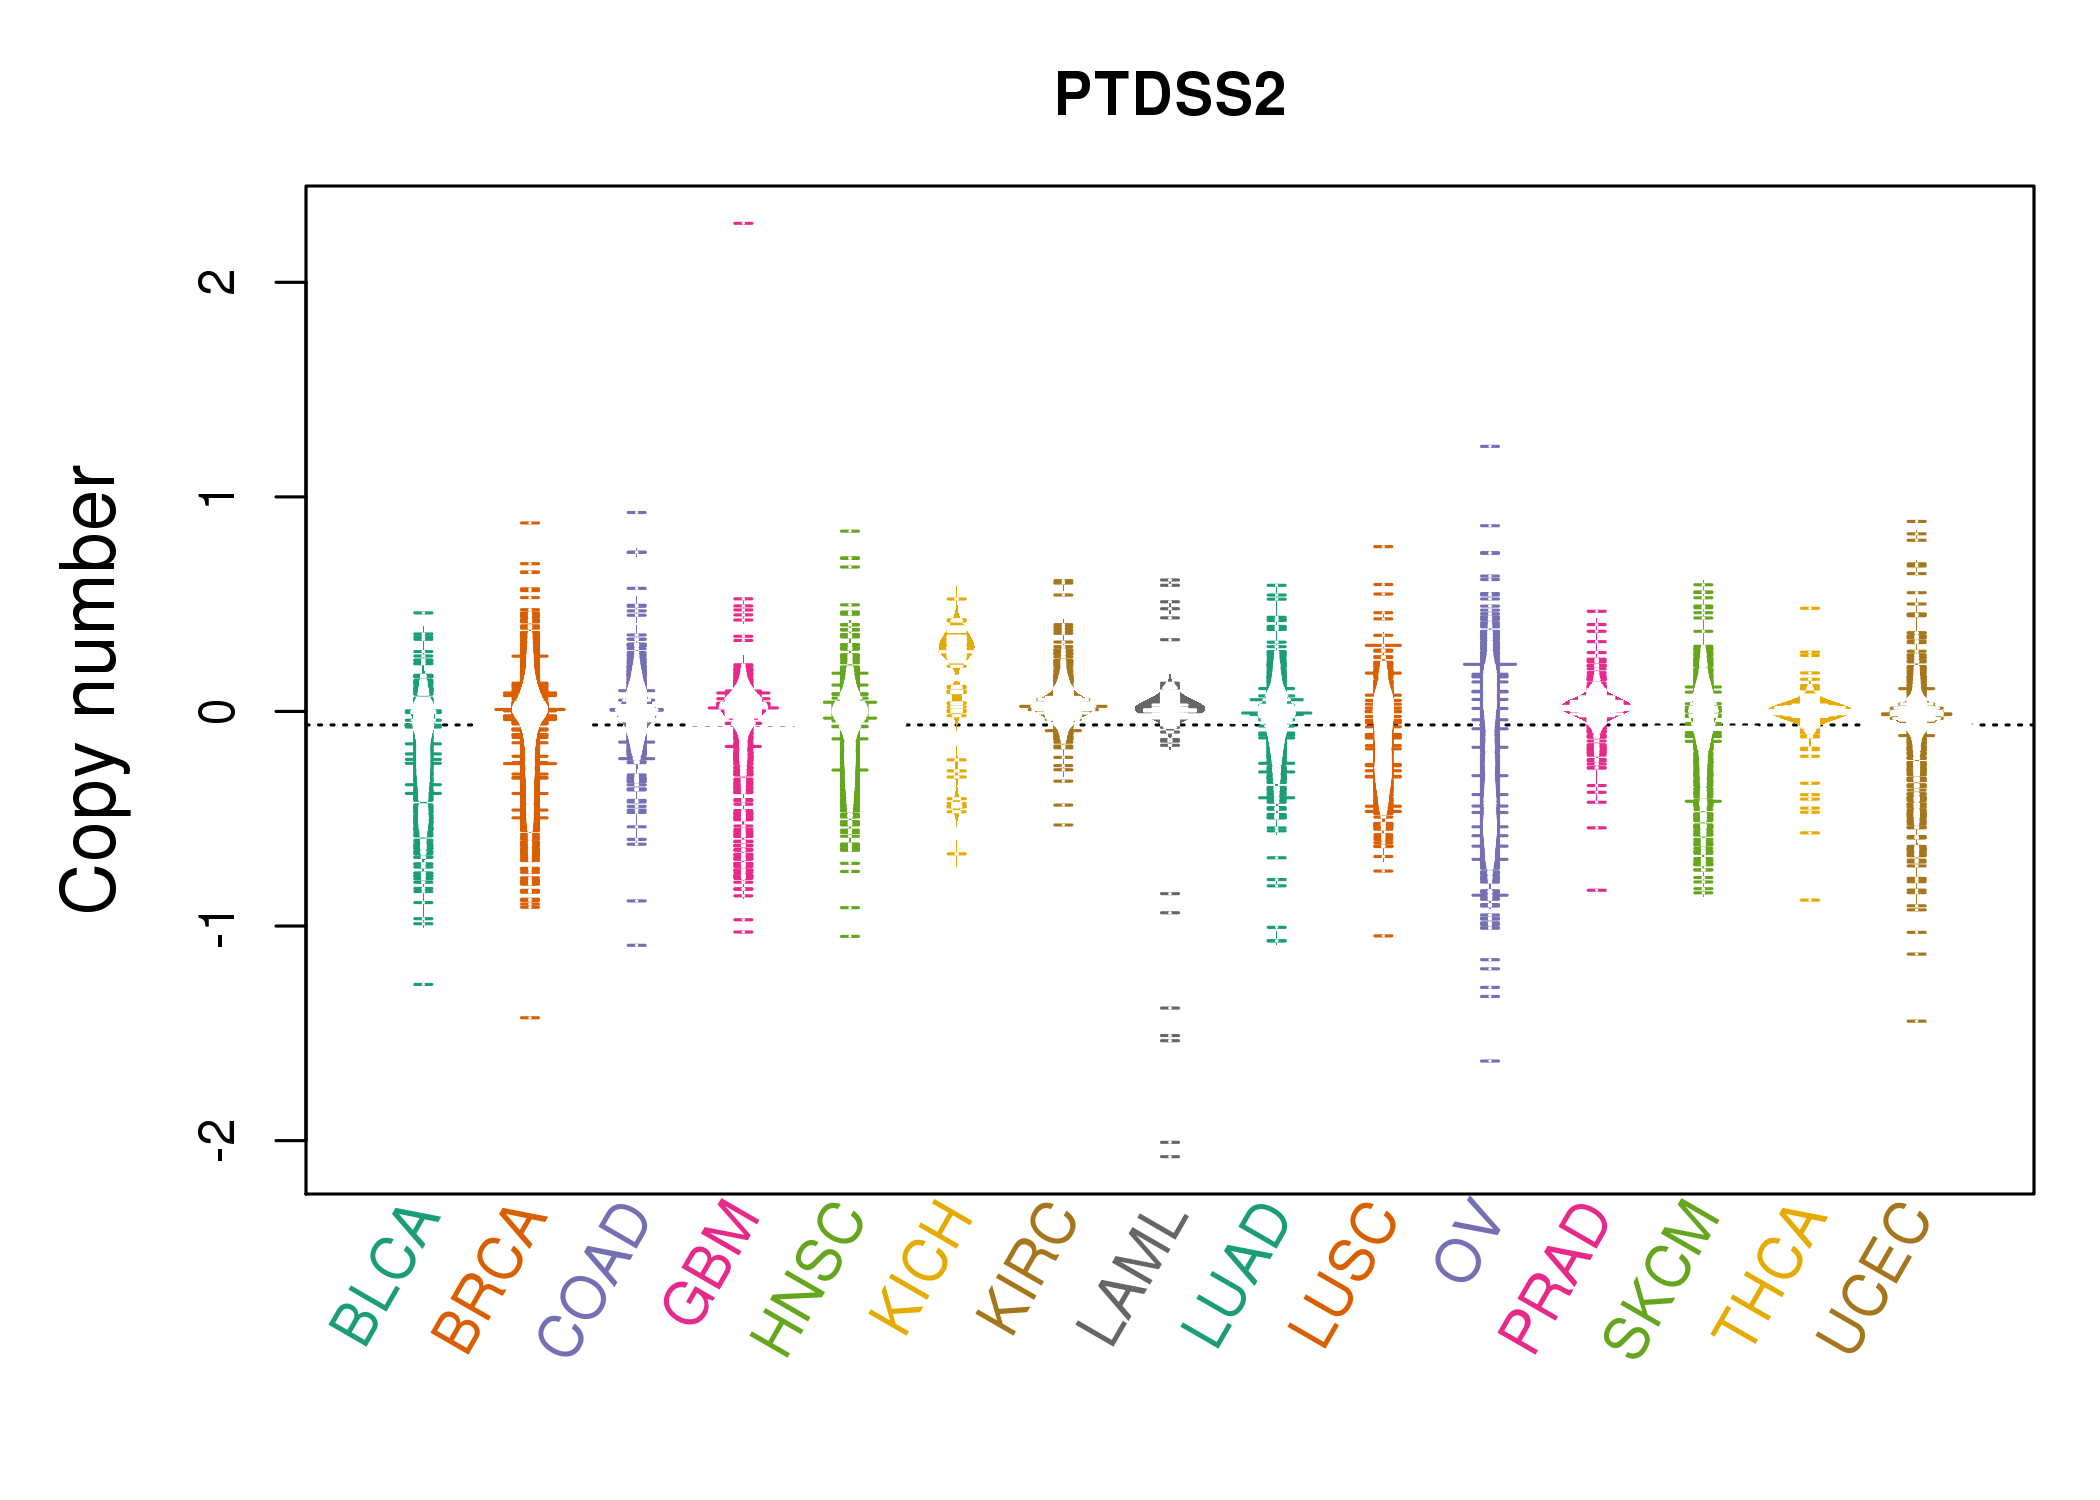 |
| cf) Tissue ID[Tissue type]: BLCA[Bladder Urothelial Carcinoma], BRCA[Breast invasive carcinoma], CESC[Cervical squamous cell carcinoma and endocervical adenocarcinoma], COAD[Colon adenocarcinoma], GBM[Glioblastoma multiforme], Glioma Low Grade, HNSC[Head and Neck squamous cell carcinoma], KICH[Kidney Chromophobe], KIRC[Kidney renal clear cell carcinoma], KIRP[Kidney renal papillary cell carcinoma], LAML[Acute Myeloid Leukemia], LUAD[Lung adenocarcinoma], LUSC[Lung squamous cell carcinoma], OV[Ovarian serous cystadenocarcinoma ], PAAD[Pancreatic adenocarcinoma], PRAD[Prostate adenocarcinoma], SKCM[Skin Cutaneous Melanoma], STAD[Stomach adenocarcinoma], THCA[Thyroid carcinoma], UCEC[Uterine Corpus Endometrial Carcinoma] |
| Top |
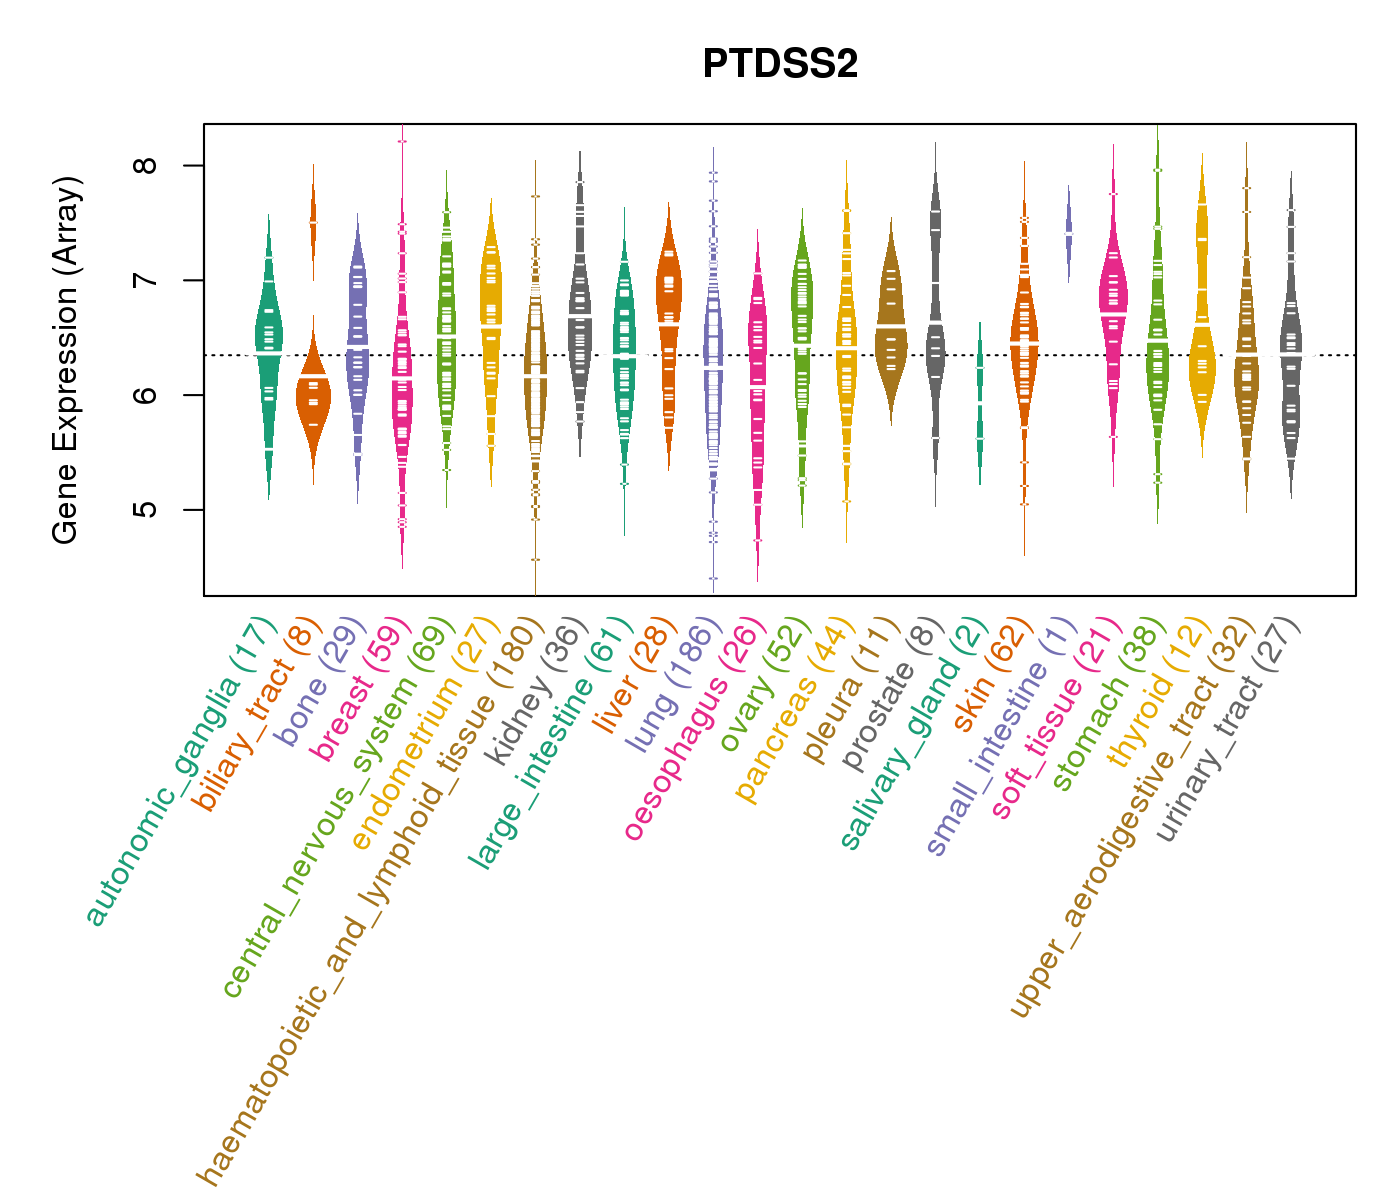
| Gene Expression for PTDSS2 |
| * CCLE gene expression data were extracted from CCLE_Expression_Entrez_2012-10-18.res: Gene-centric RMA-normalized mRNA expression data. |
 |
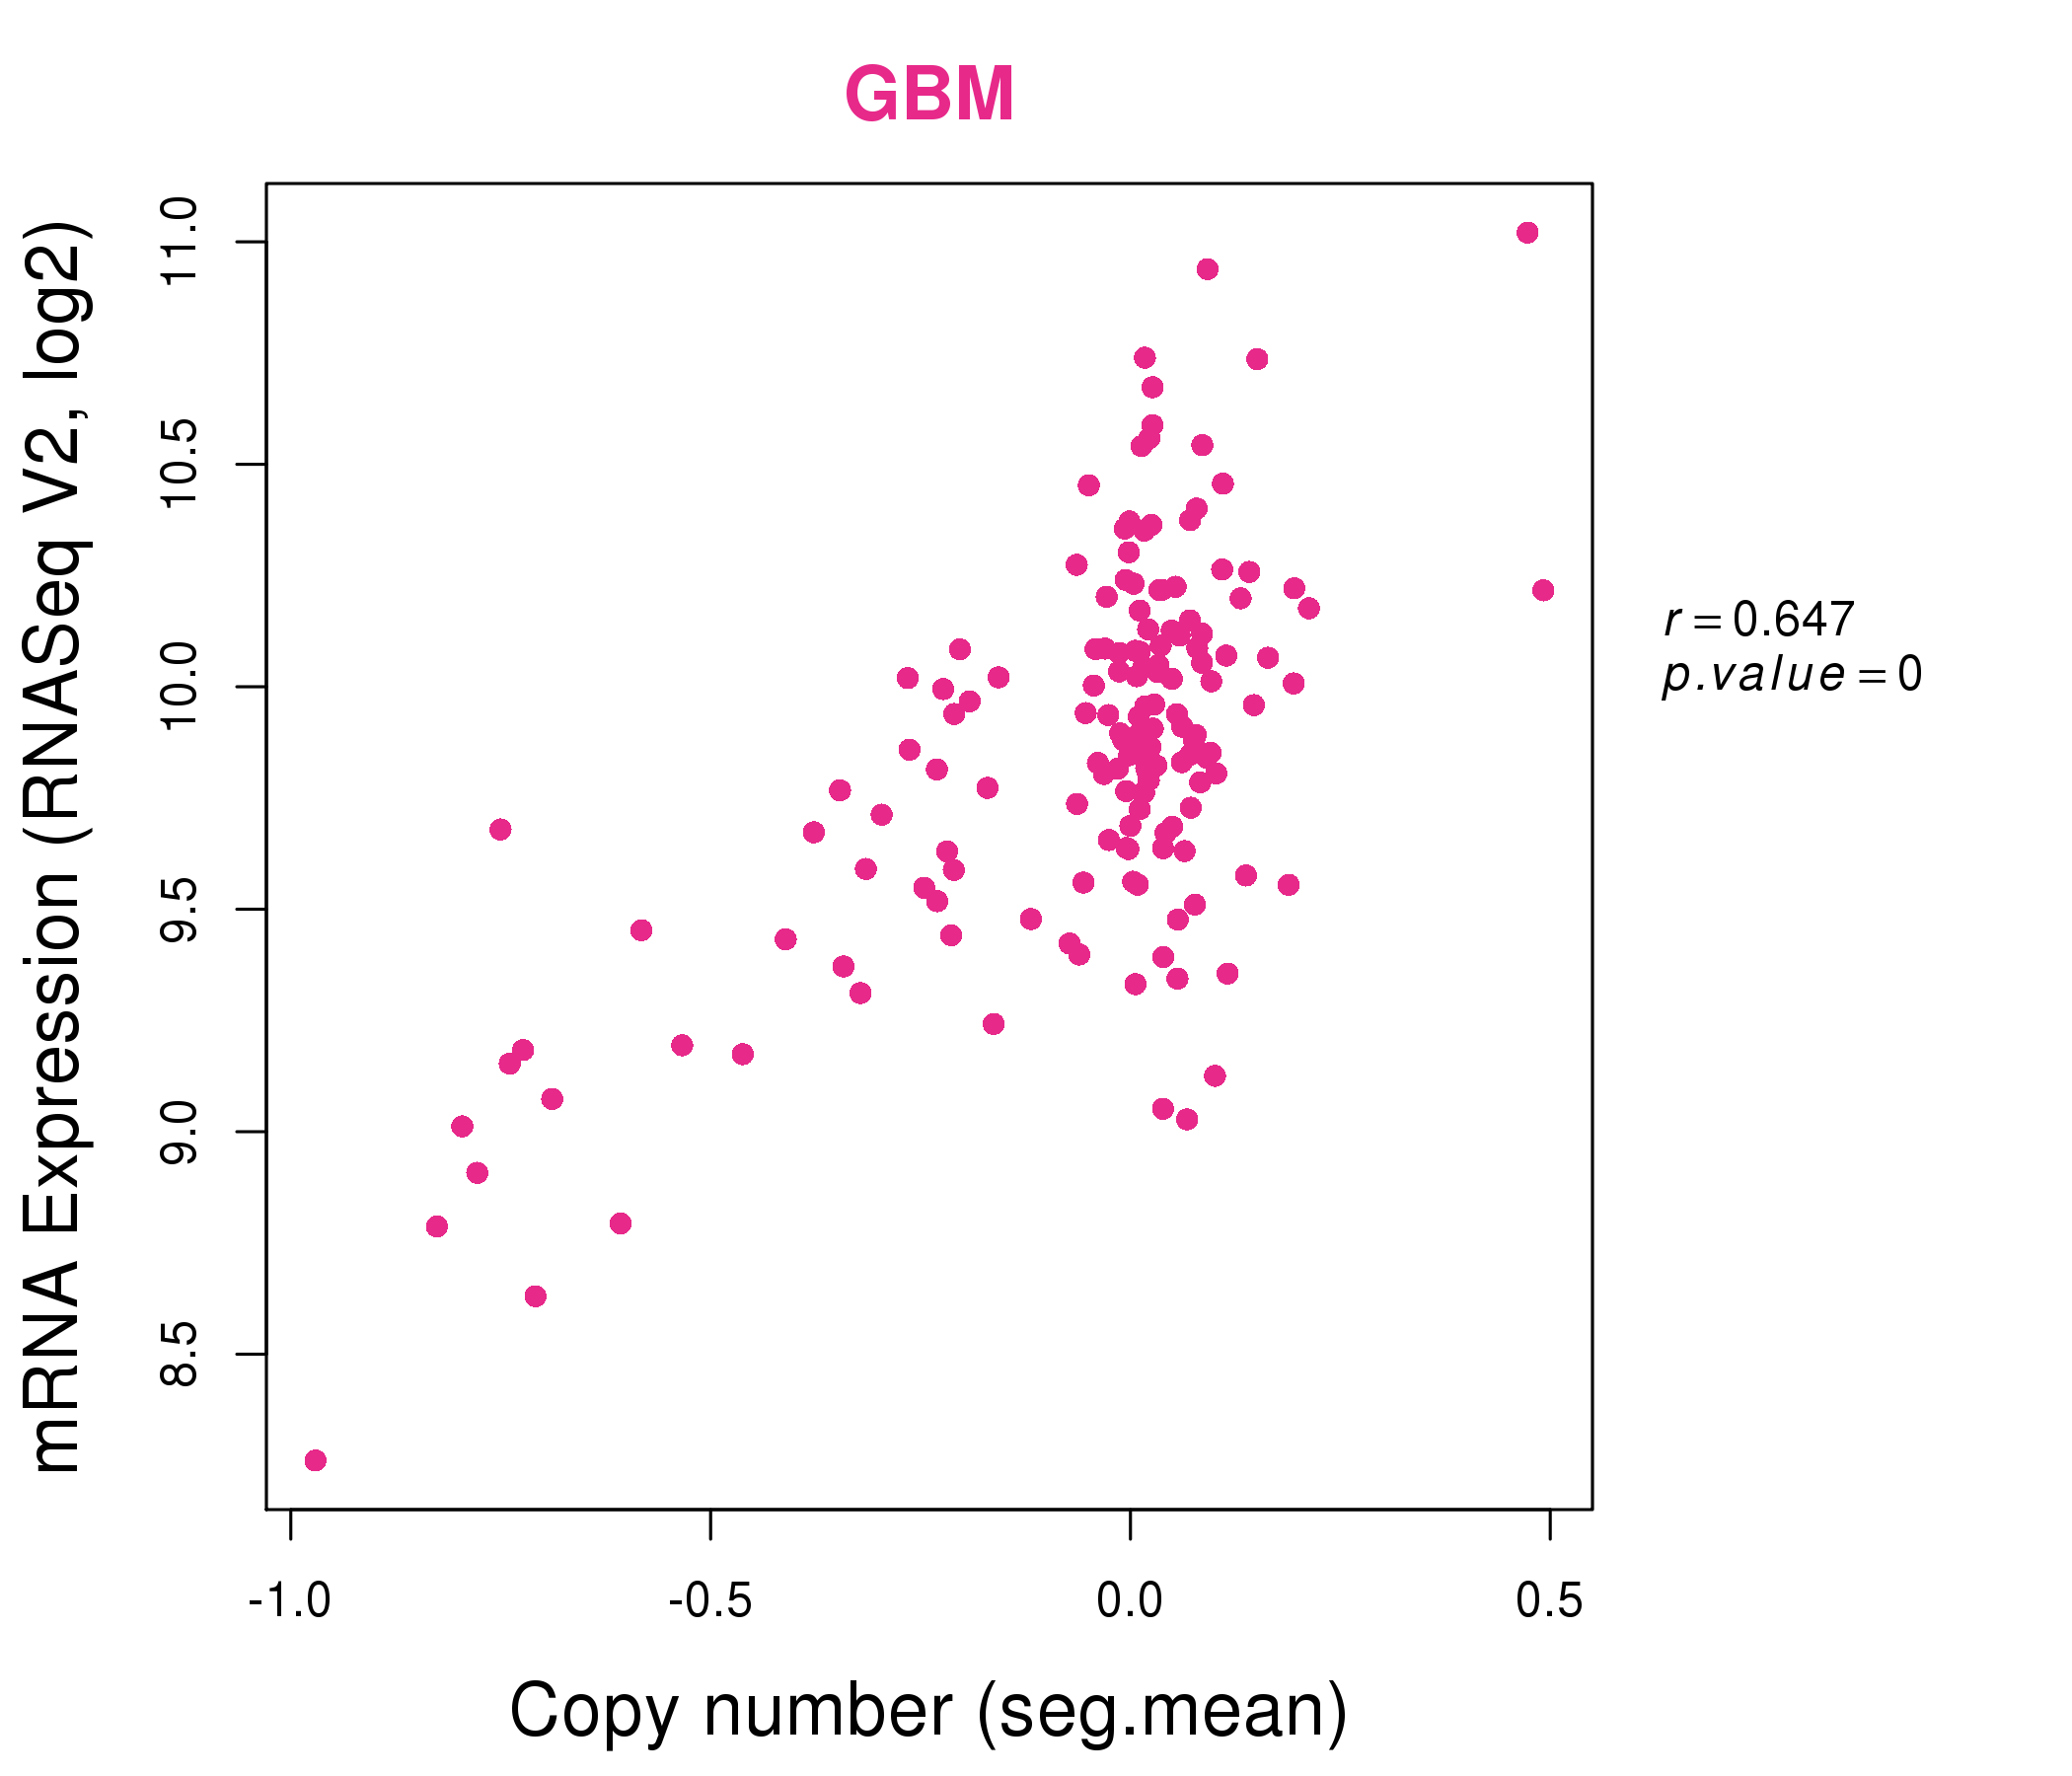
| * Normalized gene expression data of RNASeqV2 was extracted from TCGA using R package TCGA-Assembler. The URLs of all public data files on TCGA DCC data server were gathered at Jan-05-2015. Only eight cancer types have enough normal control samples for differential expression analysis. (t test, adjusted p<0.05 (using Benjamini-Hochberg FDR)) |
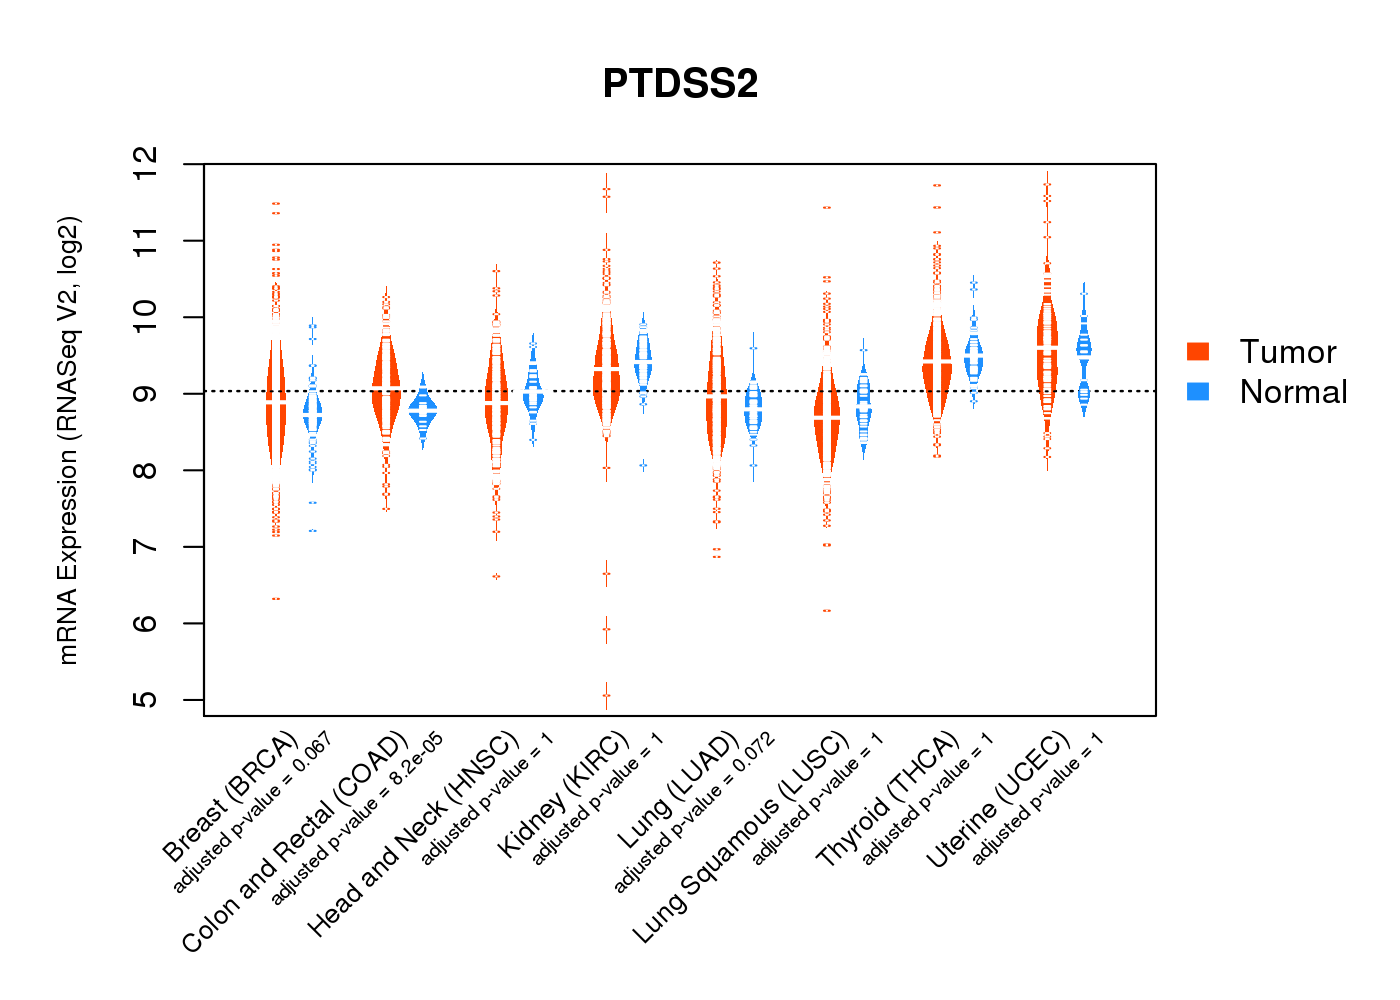 |
| Top |
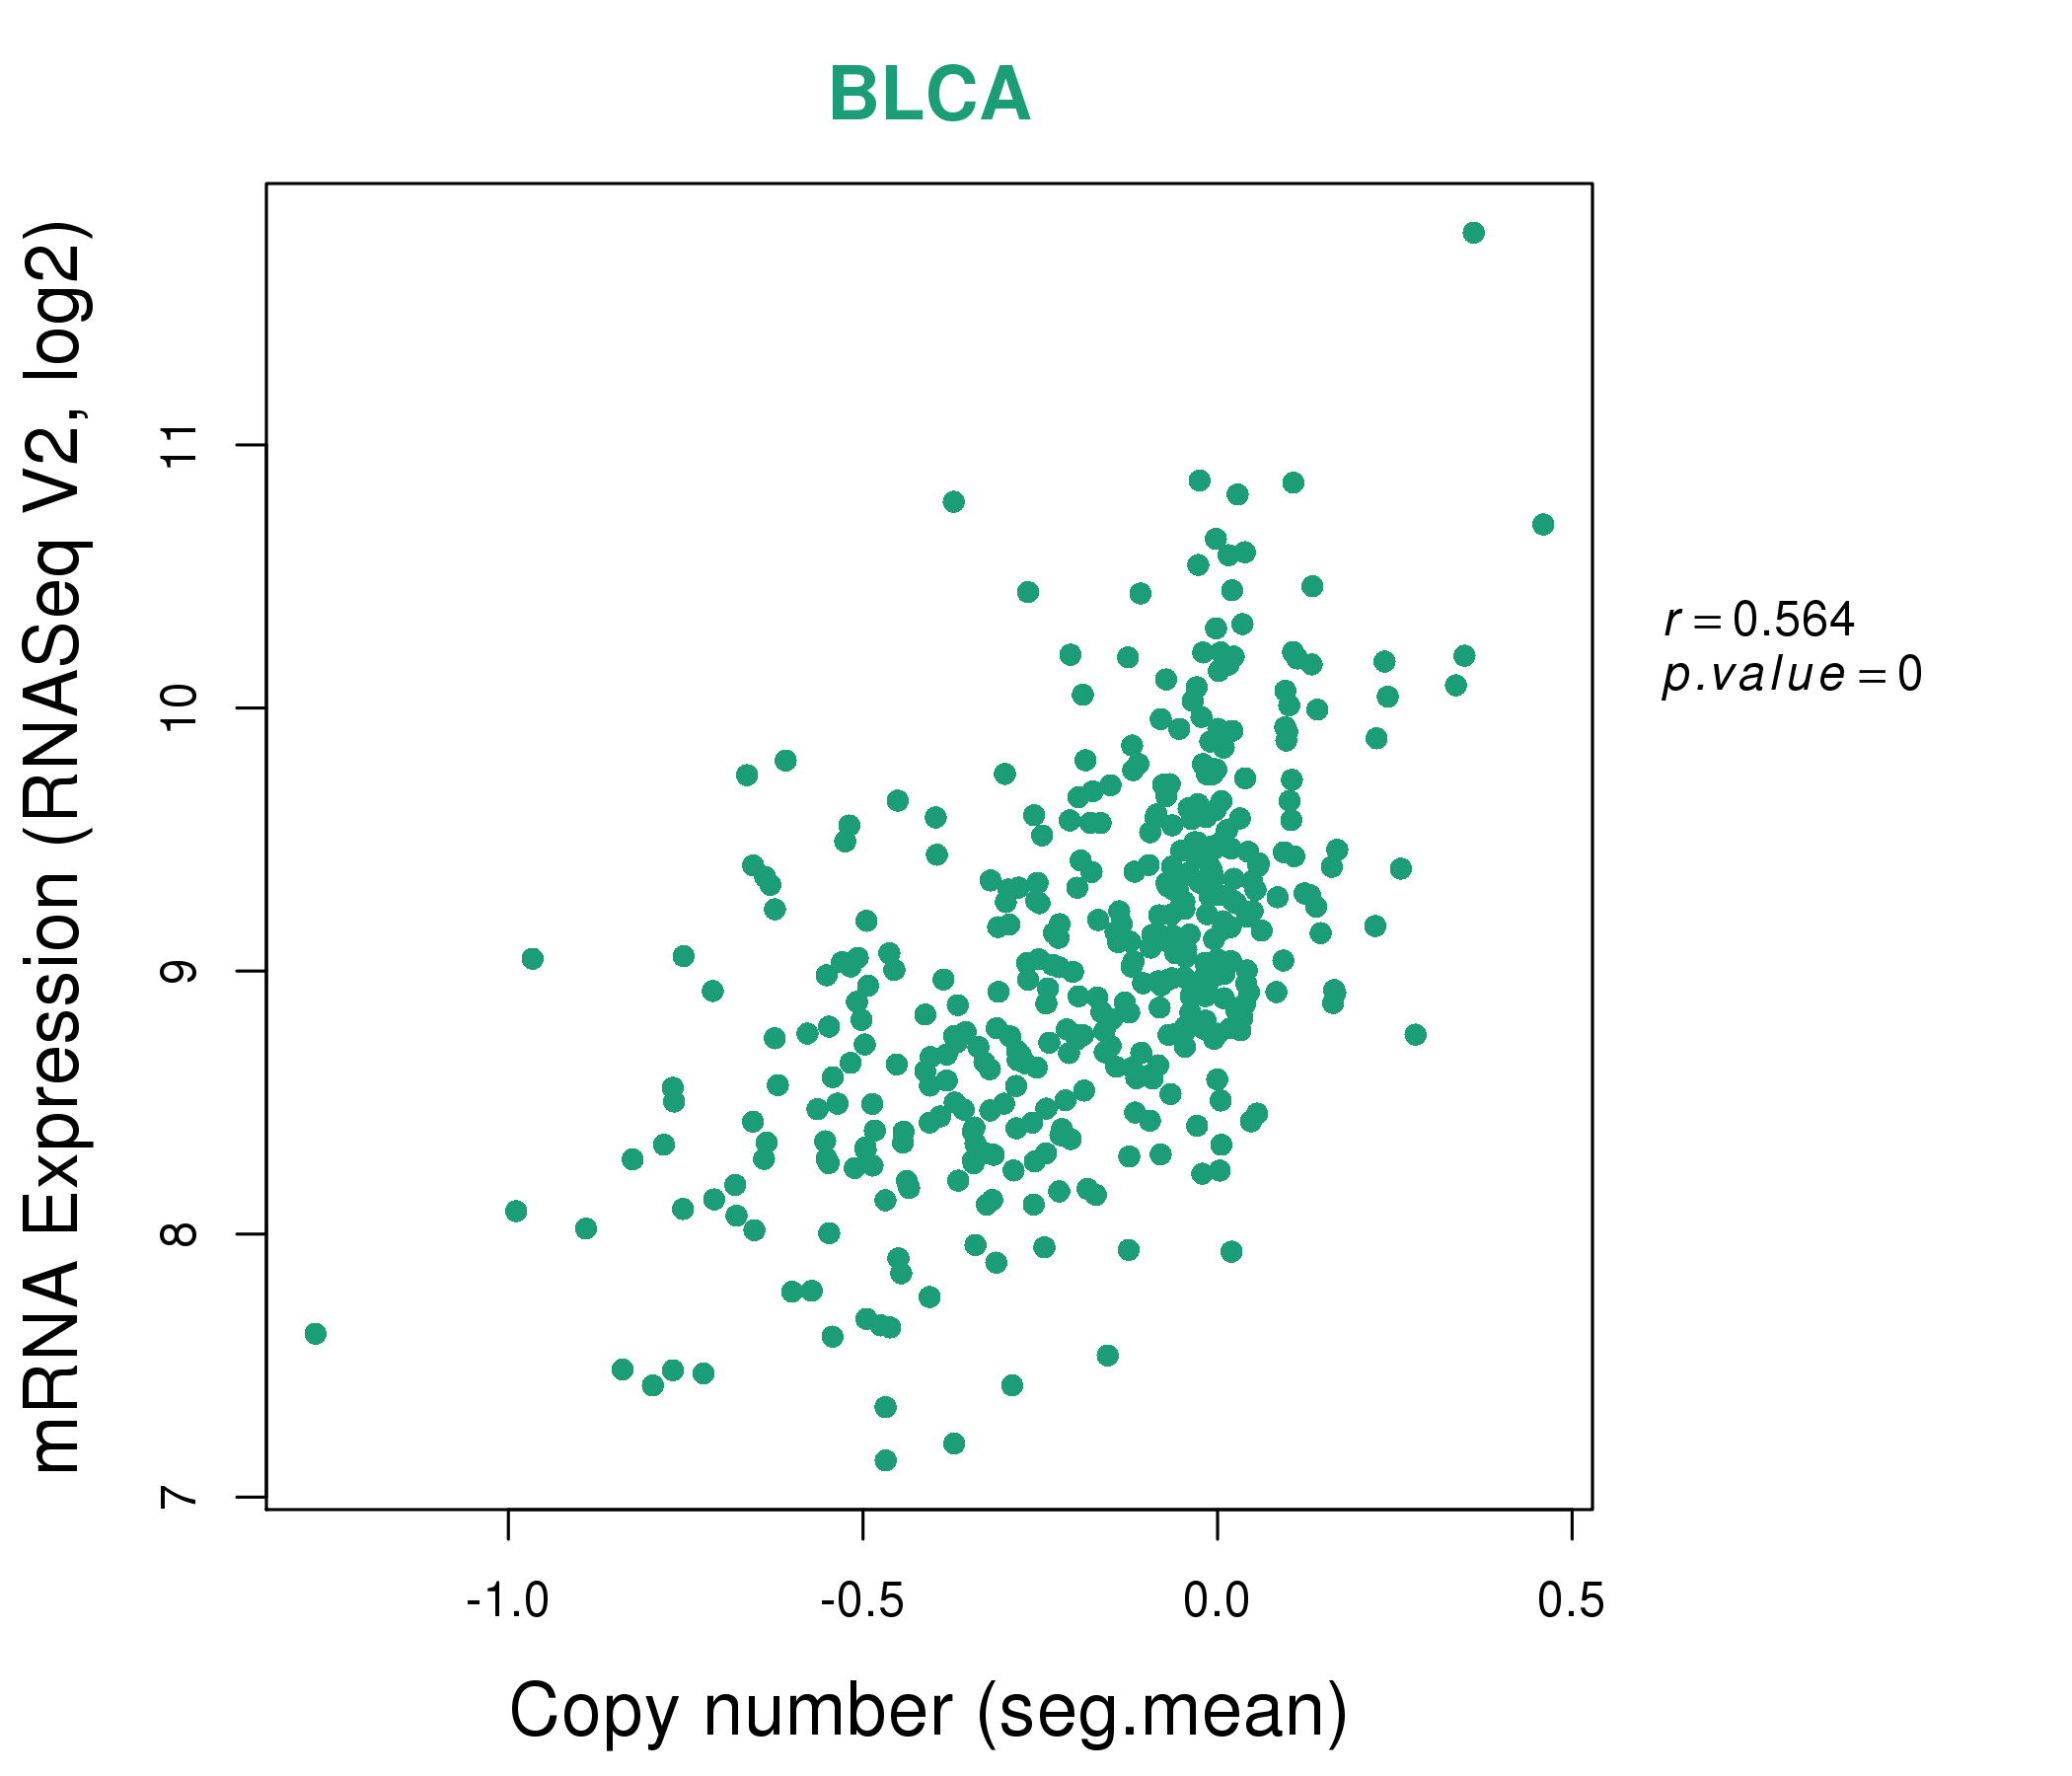
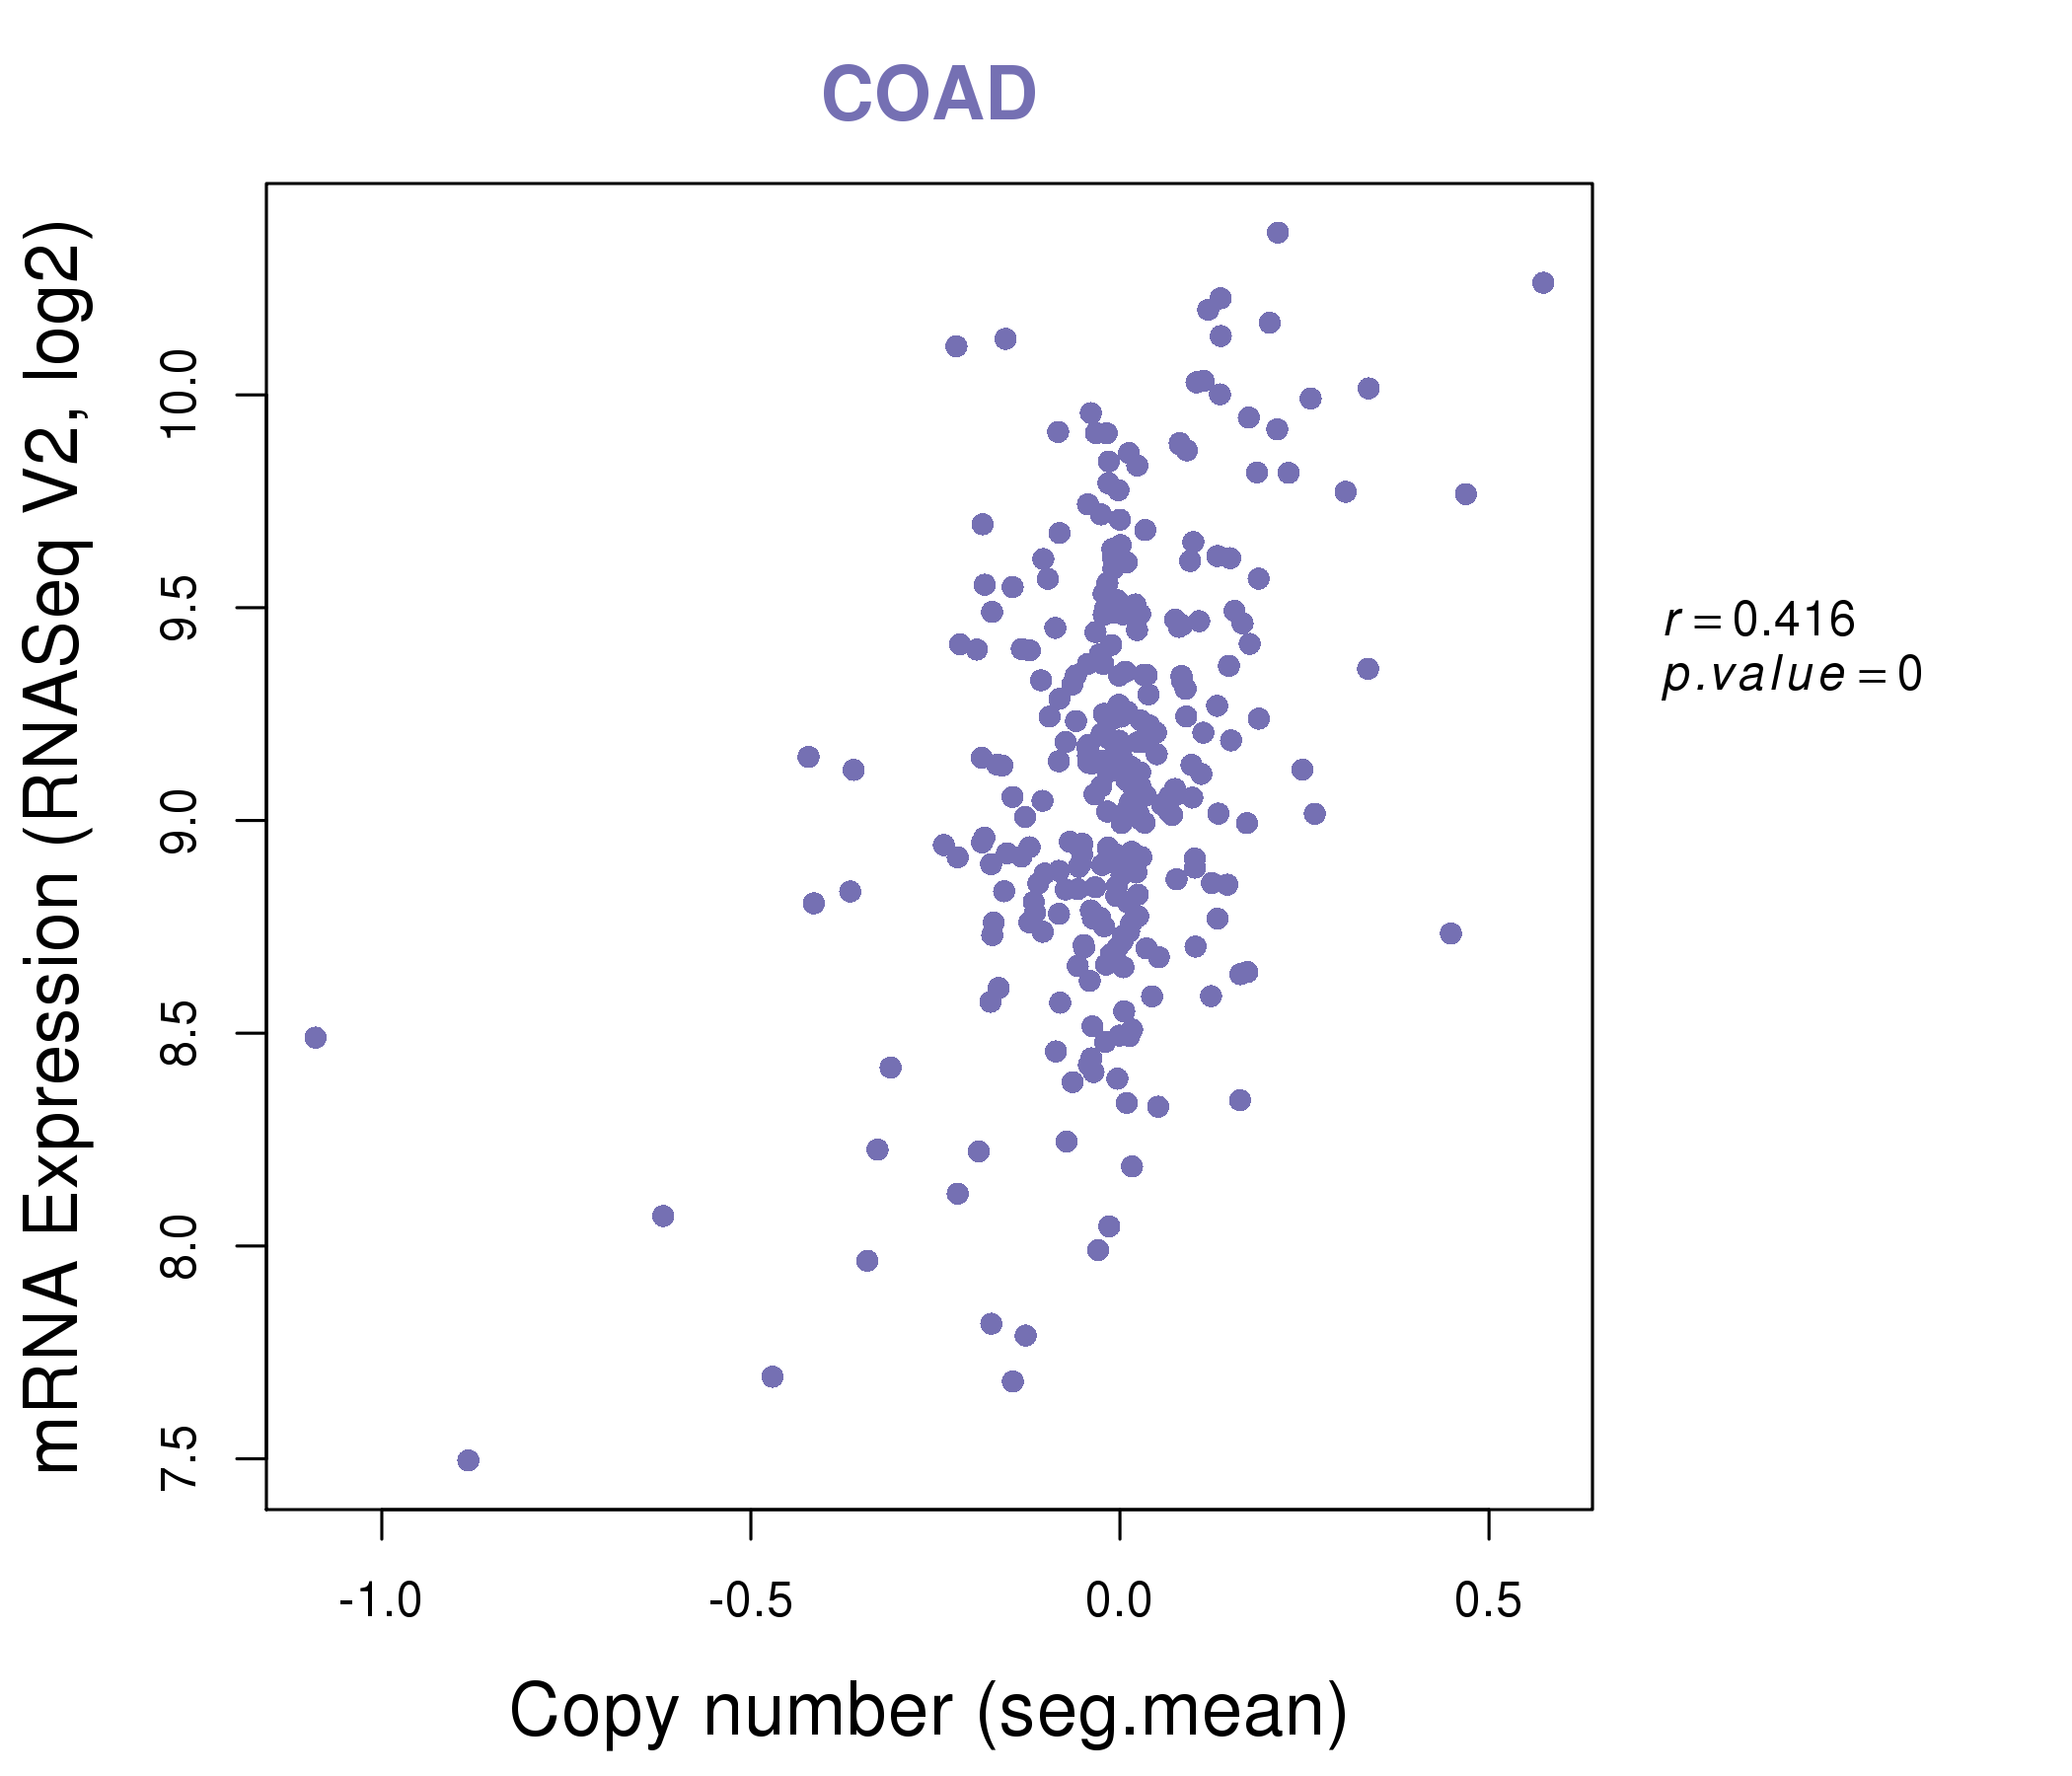
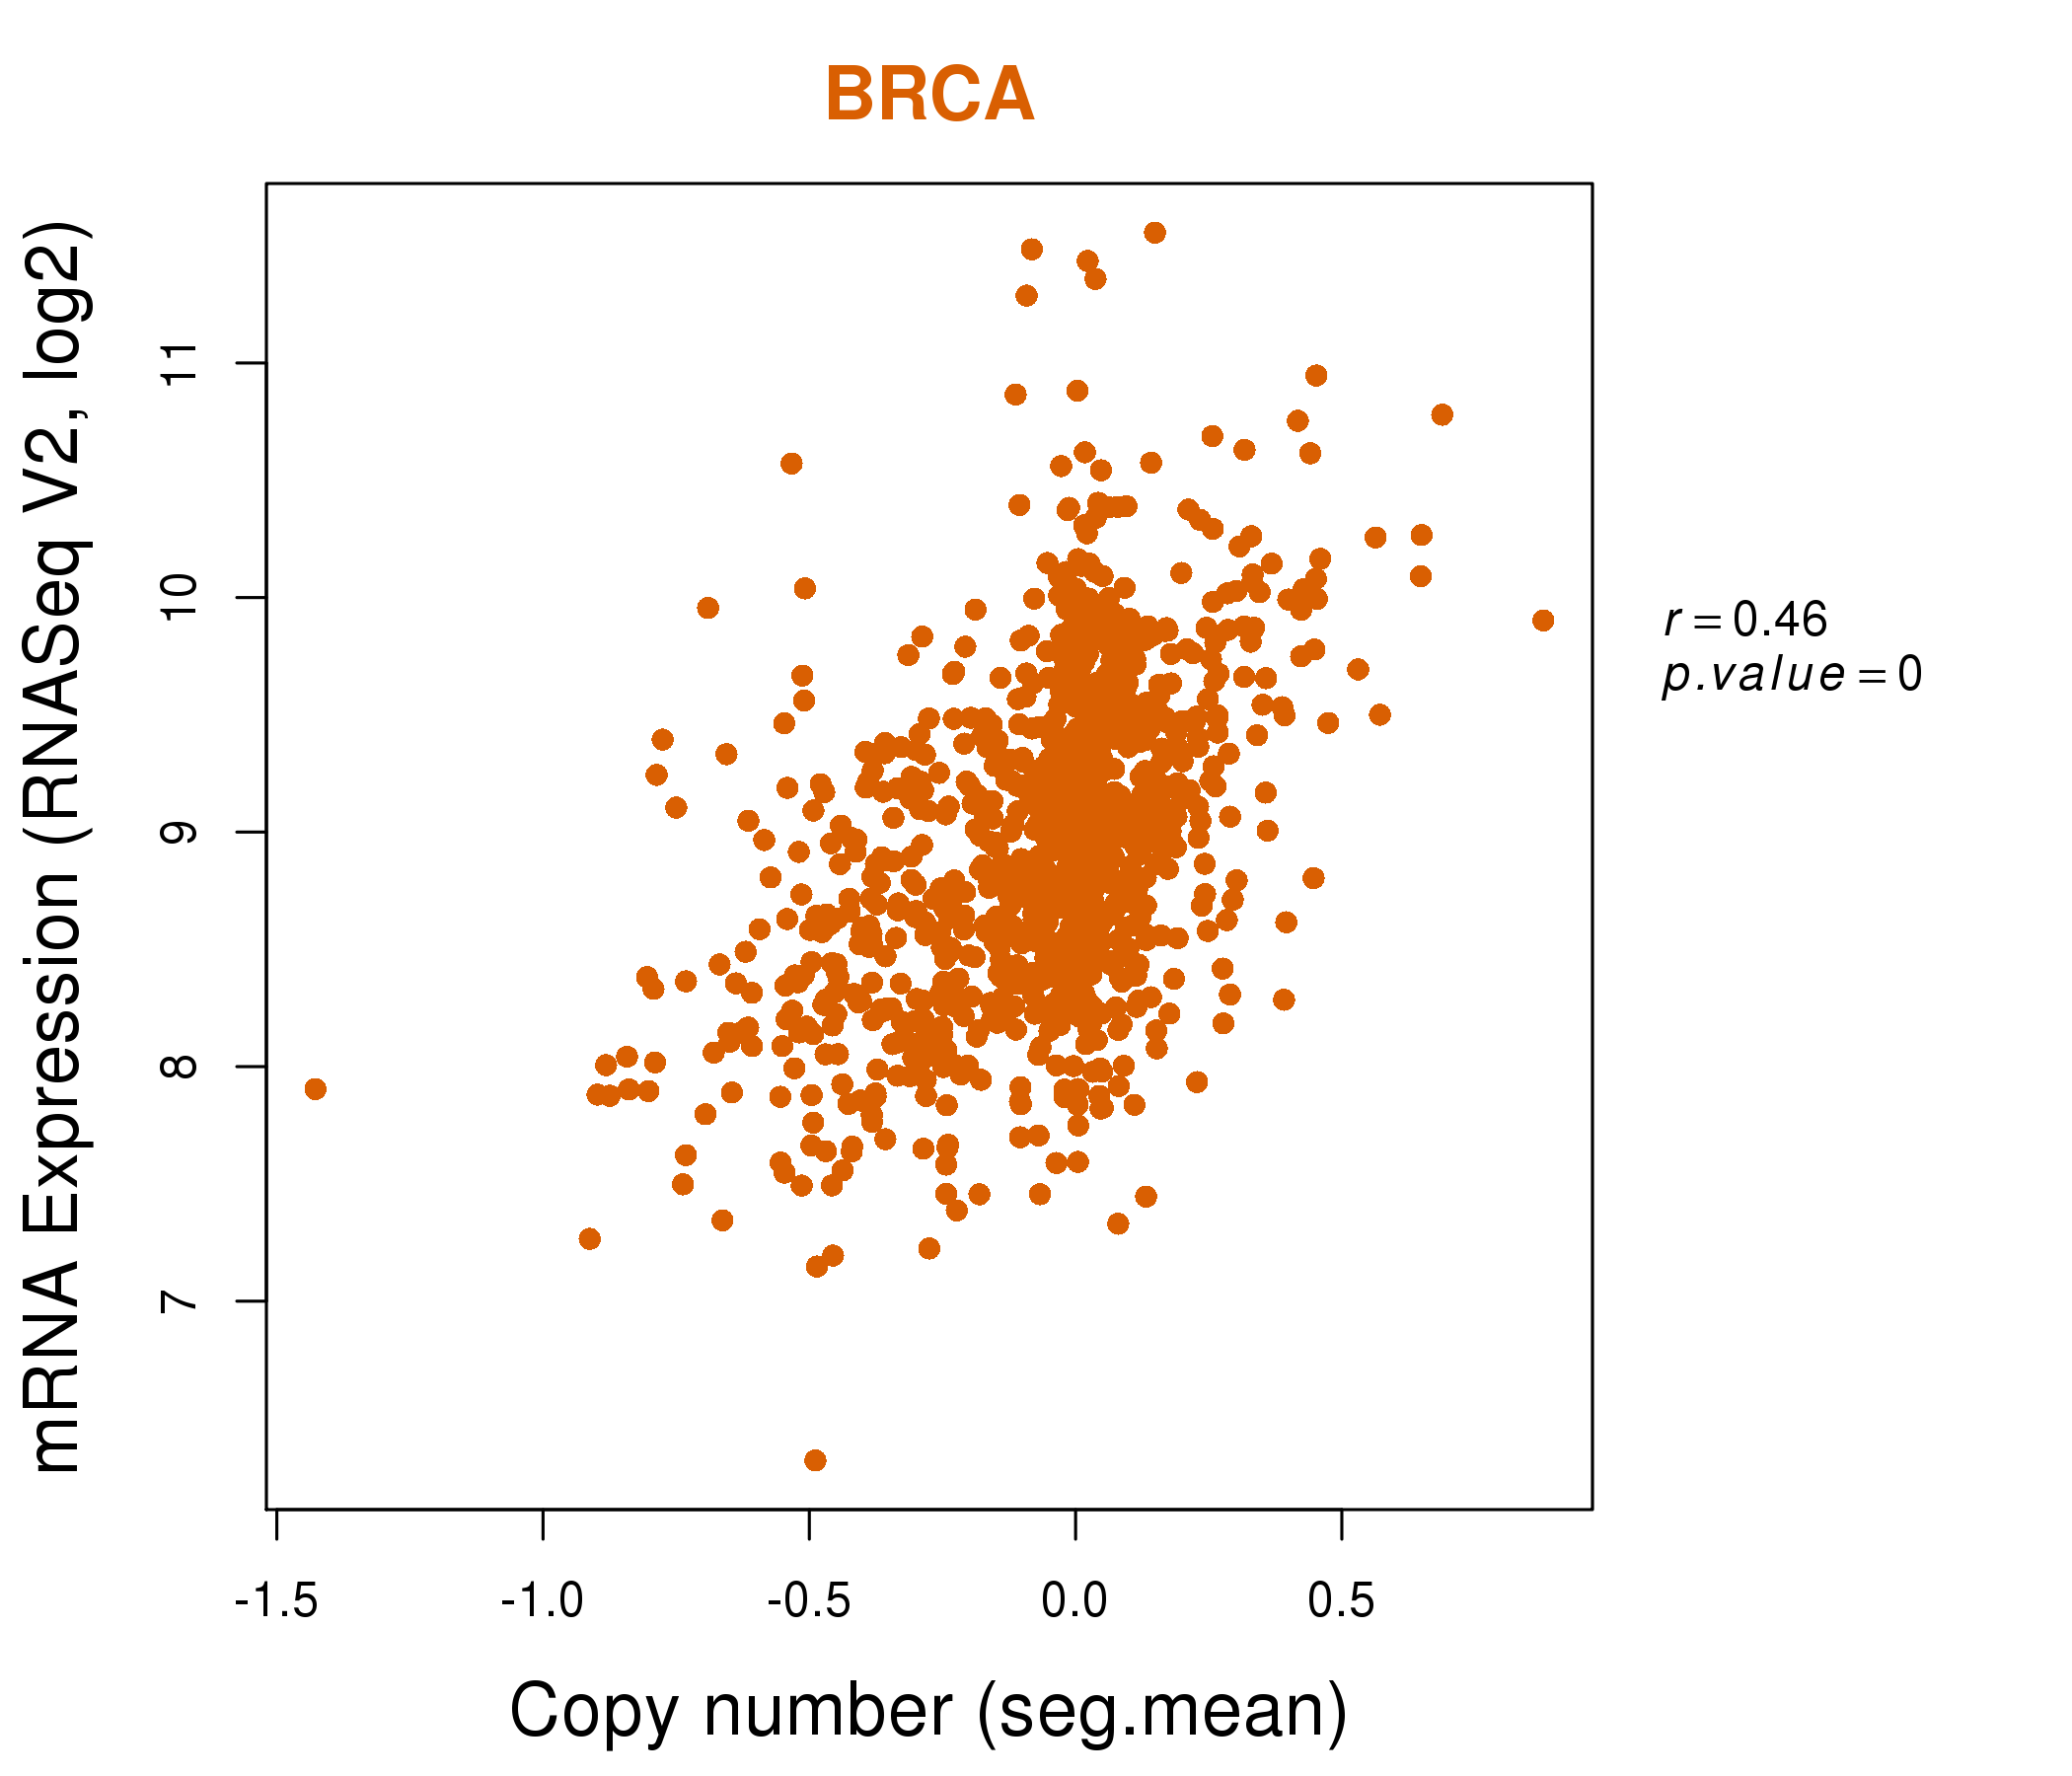
| * This plots show the correlation between CNV and gene expression. |
: Open all plots for all cancer types
 |
|
 |
|
| Top |
| Gene-Gene Network Information |
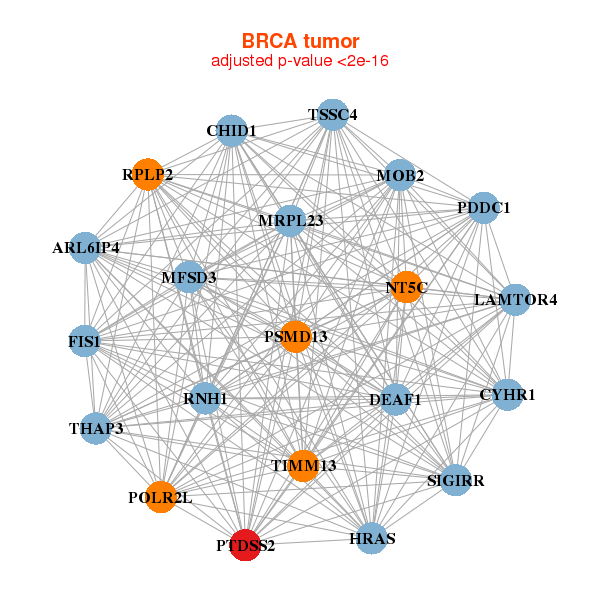
| * Co-Expression network figures were drawn using R package igraph. Only the top 20 genes with the highest correlations were shown. Red circle: input gene, orange circle: cell metabolism gene, sky circle: other gene |
: Open all plots for all cancer types
 |
| ||||
| ARL6IP4,LAMTOR4,CHID1,CYHR1,DEAF1,FIS1,HRAS, MFSD3,MOB2,MRPL23,NT5C,PDDC1,POLR2L,PSMD13, PTDSS2,RNH1,RPLP2,SIGIRR,THAP3,TIMM13,TSSC4 | B4GALT7,C7orf50,NELFB,CYHR1,DGCR6L,DRG2,EDF1, FLYWCH2,HRAS,KIAA2013,MPG,MRPL28,MRPL55,MRPS34, NUBP2,PRPF31,PTDSS2,R3HCC1,RAB1B,TMED1,UBE2J2 | ||||
 |
| ||||
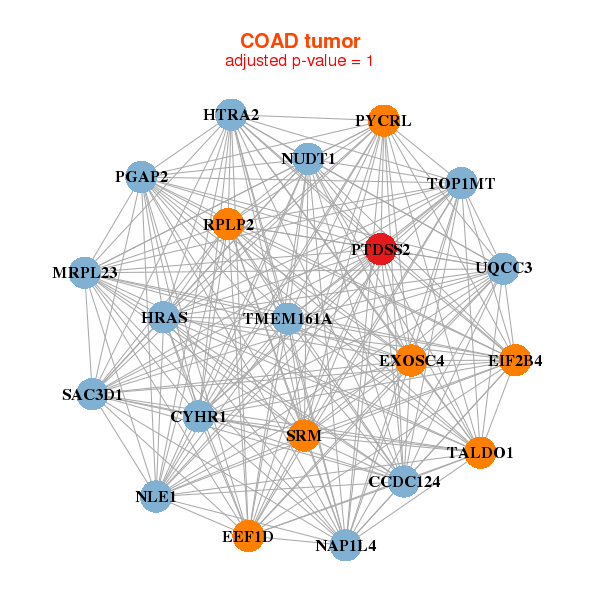
| UQCC3,CCDC124,CYHR1,EEF1D,EIF2B4,EXOSC4,HRAS, HTRA2,MRPL23,NAP1L4,NLE1,NUDT1,PGAP2,PTDSS2, PYCRL,RPLP2,SAC3D1,SRM,TALDO1,TMEM161A,TOP1MT | BCKDK,TSR3,CCDC94,CPXCR1,DEFB125,ABHD17A,HRAS, HSF1,KRTAP10-1,KRTAP10-5,LOC390858,MRPL41,MUL1,PTDSS2, RBPJL,RFNG,SCAND1,SHARPIN,SNORA14A,SPINK8,UBE2M |
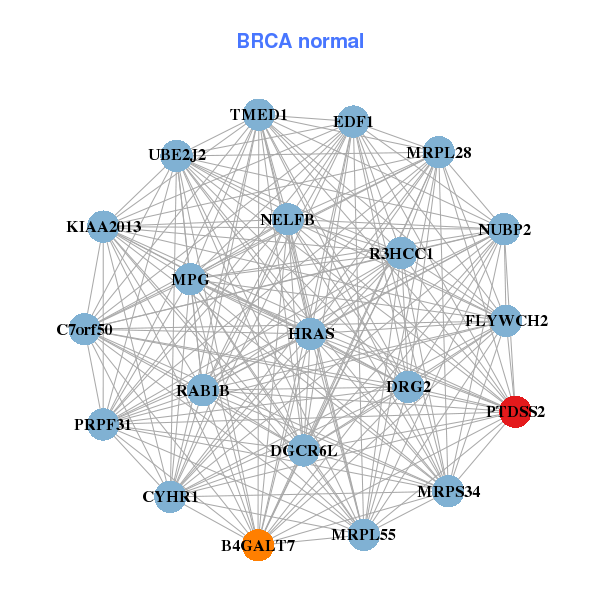
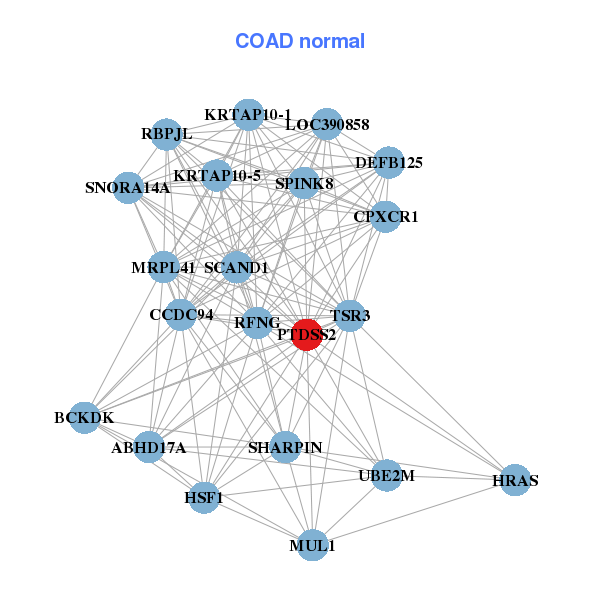
| * Co-Expression network figures were drawn using R package igraph. Only the top 20 genes with the highest correlations were shown. Red circle: input gene, orange circle: cell metabolism gene, sky circle: other gene |
: Open all plots for all cancer types
| Top |
: Open all interacting genes' information including KEGG pathway for all interacting genes from DAVID
| Top |
| Pharmacological Information for PTDSS2 |
| DB Category | DB Name | DB's ID and Url link |
| * Gene Centered Interaction Network. |
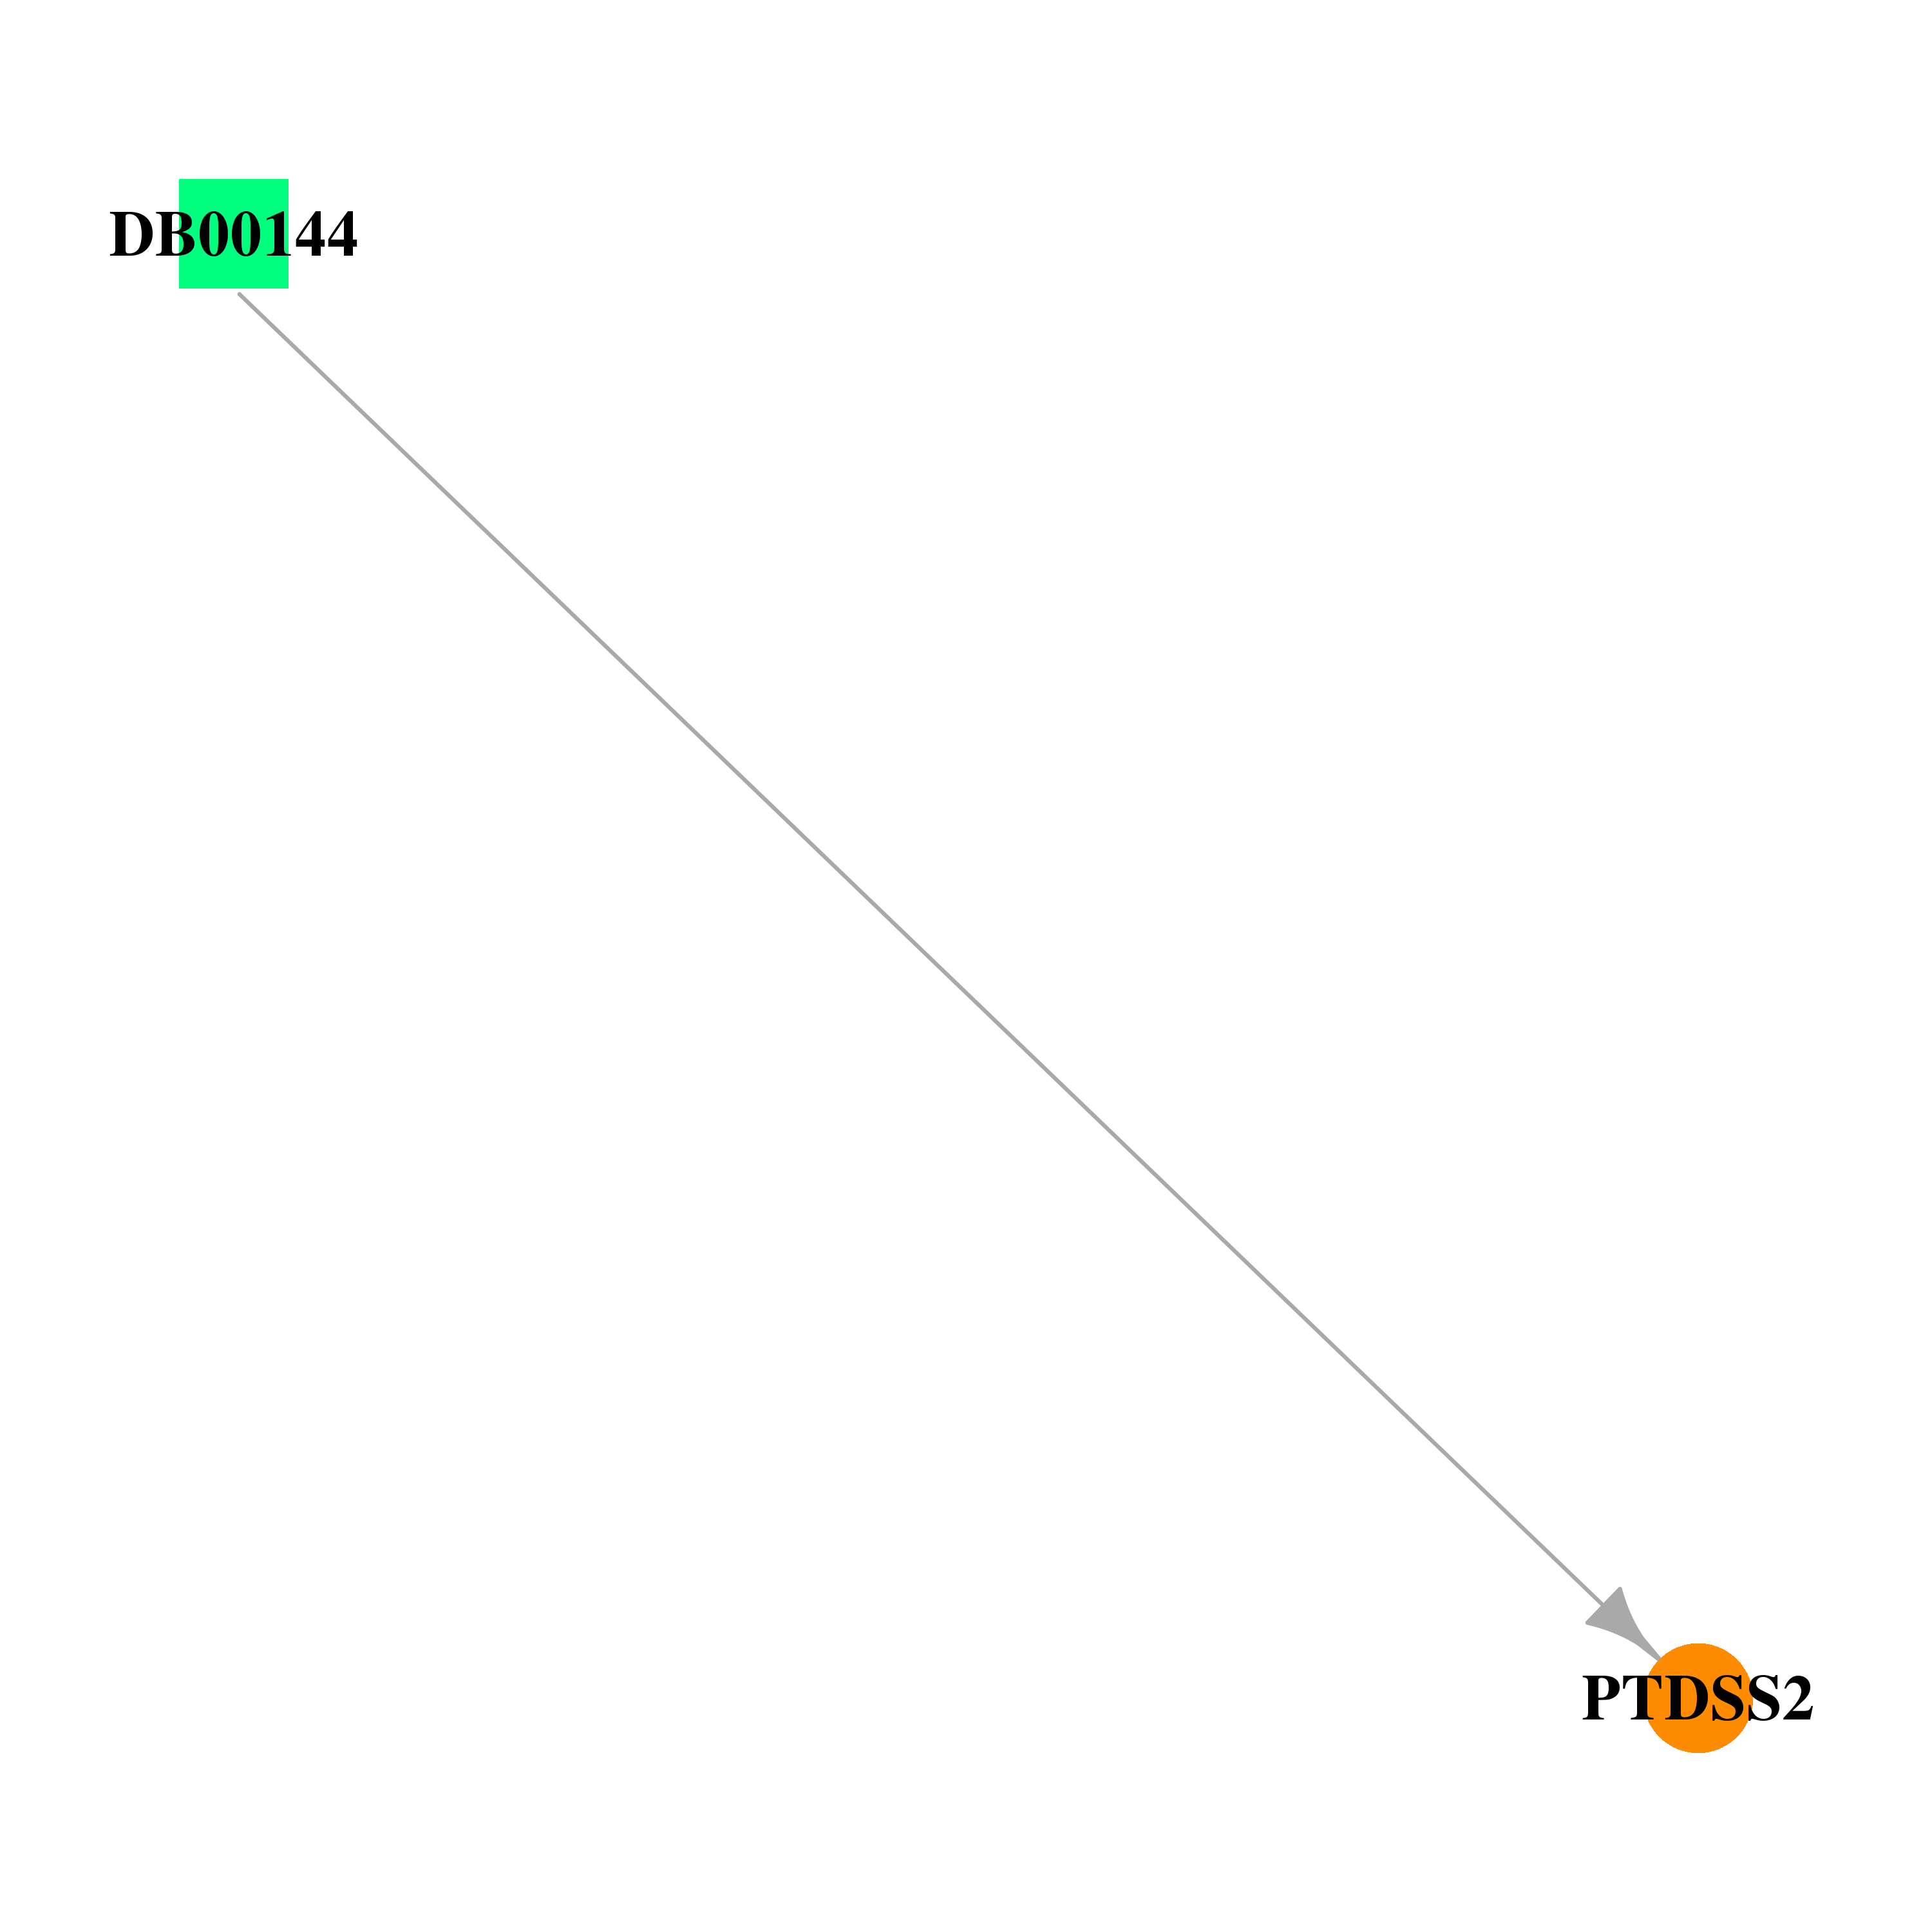 |
| * Drug Centered Interaction Network. |
| DrugBank ID | Target Name | Drug Groups | Generic Name | Drug Centered Network | Drug Structure |
| DB00144 | phosphatidylserine synthase 2 | approved; nutraceutical | Phosphatidylserine |  |  |
| Top |
| Cross referenced IDs for PTDSS2 |
| * We obtained these cross-references from Uniprot database. It covers 150 different DBs, 18 categories. http://www.uniprot.org/help/cross_references_section |
: Open all cross reference information
|
Copyright © 2016-Present - The Univsersity of Texas Health Science Center at Houston @ |