|
||||||||||||||||||||||||||||||||||||||||||||||||||||||||||||||||||||||||||||||||||||||||||||||||||||||||||||||||||||||||||||||||||||||||||||||||||||||||||||||||||||||||||||||||||||||||||||||||||||||||||||||||||||||||||||||||||||||||||||||||||||||||||||||||||||||||||||||||||||||||||||||||||||||||||||||||||||||||||
| |
| Phenotypic Information (metabolism pathway, cancer, disease, phenome) |
| |
| |
| Gene-Gene Network Information: Co-Expression Network, Interacting Genes & KEGG |
| |
|


| Gene Summary for SGPP1 |
| Basic gene info. | Gene symbol | SGPP1 |
| Gene name | sphingosine-1-phosphate phosphatase 1 | |
| Synonyms | SPPase1 | |
| Cytomap | UCSC genome browser: 14q23.2 | |
| Genomic location | chr14 :64150934-64194756 | |
| Type of gene | protein-coding | |
| RefGenes | NM_030791.2, | |
| Ensembl id | ENSG00000126821 | |
| Description | hSPP1hSPPase1sphingosine-1-phosphatase 1spp1 | |
| Modification date | 20141211 | |
| dbXrefs | MIM : 612826 | |
| HGNC : HGNC | ||
| Ensembl : ENSG00000126821 | ||
| HPRD : 10226 | ||
| Vega : OTTHUMG00000029080 | ||
| Protein | UniProt: go to UniProt's Cross Reference DB Table | |
| Expression | CleanEX: HS_SGPP1 | |
| BioGPS: 81537 | ||
| Gene Expression Atlas: ENSG00000126821 | ||
| The Human Protein Atlas: ENSG00000126821 | ||
| Pathway | NCI Pathway Interaction Database: SGPP1 | |
| KEGG: SGPP1 | ||
| REACTOME: SGPP1 | ||
| ConsensusPathDB | ||
| Pathway Commons: SGPP1 | ||
| Metabolism | MetaCyc: SGPP1 | |
| HUMANCyc: SGPP1 | ||
| Regulation | Ensembl's Regulation: ENSG00000126821 | |
| miRBase: chr14 :64,150,934-64,194,756 | ||
| TargetScan: NM_030791 | ||
| cisRED: ENSG00000126821 | ||
| Context | iHOP: SGPP1 | |
| cancer metabolism search in PubMed: SGPP1 | ||
| UCL Cancer Institute: SGPP1 | ||
| Assigned class in ccmGDB | C | |
| Top |
| Phenotypic Information for SGPP1(metabolism pathway, cancer, disease, phenome) |
| Cancer | CGAP: SGPP1 |
| Familial Cancer Database: SGPP1 | |
| * This gene is included in those cancer gene databases. |
|
|
|
|
|
|
| ||||||||||||||||||||||||||||||||||||||||||||||||||||||||||||||||||||||||||||||||||||||||||||||||||||||||||||||||||||||||||||||||||||||||||||||||||||||||||||||||||||||||||||||||||||||||||||||||||||||||||||||||||||||||||||||||||||||||||||||||||||||||||||||||||||||||||||||||||||||||||||||||||||||||||||||||||||
Oncogene 1 | Significant driver gene in | |||||||||||||||||||||||||||||||||||||||||||||||||||||||||||||||||||||||||||||||||||||||||||||||||||||||||||||||||||||||||||||||||||||||||||||||||||||||||||||||||||||||||||||||||||||||||||||||||||||||||||||||||||||||||||||||||||||||||||||||||||||||||||||||||||||||||||||||||||||||||||||||||||||||||||||||||||||||||
| cf) number; DB name 1 Oncogene; http://nar.oxfordjournals.org/content/35/suppl_1/D721.long, 2 Tumor Suppressor gene; https://bioinfo.uth.edu/TSGene/, 3 Cancer Gene Census; http://www.nature.com/nrc/journal/v4/n3/abs/nrc1299.html, 4 CancerGenes; http://nar.oxfordjournals.org/content/35/suppl_1/D721.long, 5 Network of Cancer Gene; http://ncg.kcl.ac.uk/index.php, 1Therapeutic Vulnerabilities in Cancer; http://cbio.mskcc.org/cancergenomics/statius/ |
| KEGG_SPHINGOLIPID_METABOLISM REACTOME_PHOSPHOLIPID_METABOLISM REACTOME_SPHINGOLIPID_METABOLISM REACTOME_METABOLISM_OF_LIPIDS_AND_LIPOPROTEINS | |
| OMIM | |
| Orphanet | |
| Disease | KEGG Disease: SGPP1 |
| MedGen: SGPP1 (Human Medical Genetics with Condition) | |
| ClinVar: SGPP1 | |
| Phenotype | MGI: SGPP1 (International Mouse Phenotyping Consortium) |
| PhenomicDB: SGPP1 | |
| Mutations for SGPP1 |
| * Under tables are showing count per each tissue to give us broad intuition about tissue specific mutation patterns.You can go to the detailed page for each mutation database's web site. |
| - Statistics for Tissue and Mutation type | Top |
 |
| - For Inter-chromosomal Variations |
| * Inter-chromosomal variantions includes 'interchromosomal amplicon to amplicon', 'interchromosomal amplicon to non-amplified dna', 'interchromosomal insertion', 'Interchromosomal unknown type'. |
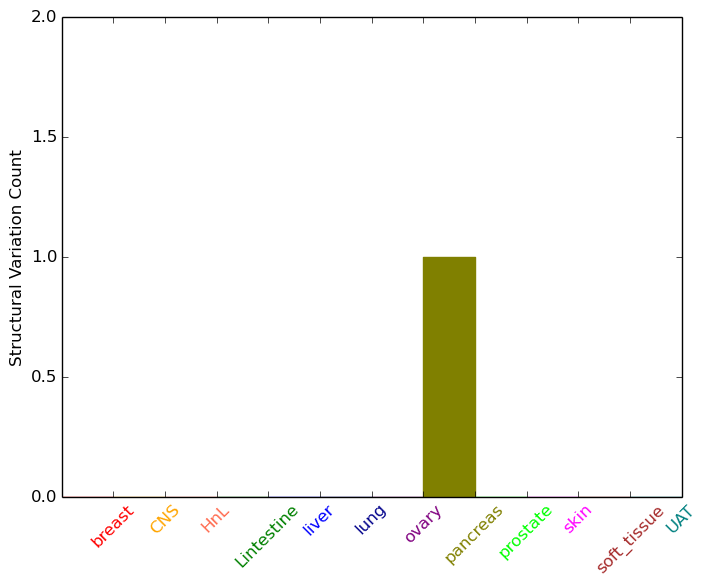 |
| - For Intra-chromosomal Variations |
| There's no intra-chromosomal structural variation. |
| Sample | Symbol_a | Chr_a | Start_a | End_a | Symbol_b | Chr_b | Start_b | End_b |
| pancreas | SGPP1 | chr14 | 64160996 | 64161016 | chr22 | 47704561 | 47704581 |
| cf) Tissue number; Tissue name (1;Breast, 2;Central_nervous_system, 3;Haematopoietic_and_lymphoid_tissue, 4;Large_intestine, 5;Liver, 6;Lung, 7;Ovary, 8;Pancreas, 9;Prostate, 10;Skin, 11;Soft_tissue, 12;Upper_aerodigestive_tract) |
| * From mRNA Sanger sequences, Chitars2.0 arranged chimeric transcripts. This table shows SGPP1 related fusion information. |
| ID | Head Gene | Tail Gene | Accession | Gene_a | qStart_a | qEnd_a | Chromosome_a | tStart_a | tEnd_a | Gene_a | qStart_a | qEnd_a | Chromosome_a | tStart_a | tEnd_a |
| Top |
| Mutation type/ Tissue ID | brca | cns | cerv | endome | haematopo | kidn | Lintest | liver | lung | ns | ovary | pancre | prost | skin | stoma | thyro | urina | |||
| Total # sample | 1 | |||||||||||||||||||
| GAIN (# sample) | 1 | |||||||||||||||||||
| LOSS (# sample) |
| cf) Tissue ID; Tissue type (1; Breast, 2; Central_nervous_system, 3; Cervix, 4; Endometrium, 5; Haematopoietic_and_lymphoid_tissue, 6; Kidney, 7; Large_intestine, 8; Liver, 9; Lung, 10; NS, 11; Ovary, 12; Pancreas, 13; Prostate, 14; Skin, 15; Stomach, 16; Thyroid, 17; Urinary_tract) |
| Top |
|
 |
| Top |
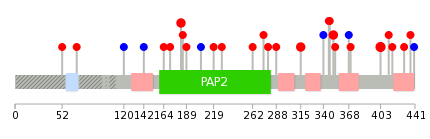
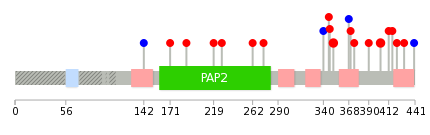
| Stat. for Non-Synonymous SNVs (# total SNVs=26) | (# total SNVs=5) |
 |  |
(# total SNVs=1) | (# total SNVs=0) |
 |
| Top |
| * When you move the cursor on each content, you can see more deailed mutation information on the Tooltip. Those are primary_site,primary_histology,mutation(aa),pubmedID. |
| GRCh37 position | Mutation(aa) | Unique sampleID count |
| chr14:64152941-64152941 | p.R403Q | 3 |
| chr14:64153205-64153205 | p.S315F | 2 |
| chr14:64194115-64194115 | p.W183S | 2 |
| chr14:64153098-64153098 | p.P351S | 2 |
| chr14:64194048-64194048 | p.P205P | 1 |
| chr14:64152902-64152902 | p.R416P | 1 |
| chr14:64153129-64153129 | p.G340G | 1 |
| chr14:64194098-64194098 | p.P189S | 1 |
| chr14:64152913-64152913 | p.E412D | 1 |
| chr14:64194110-64194110 | p.R185W | 1 |
| Top |
|
 |
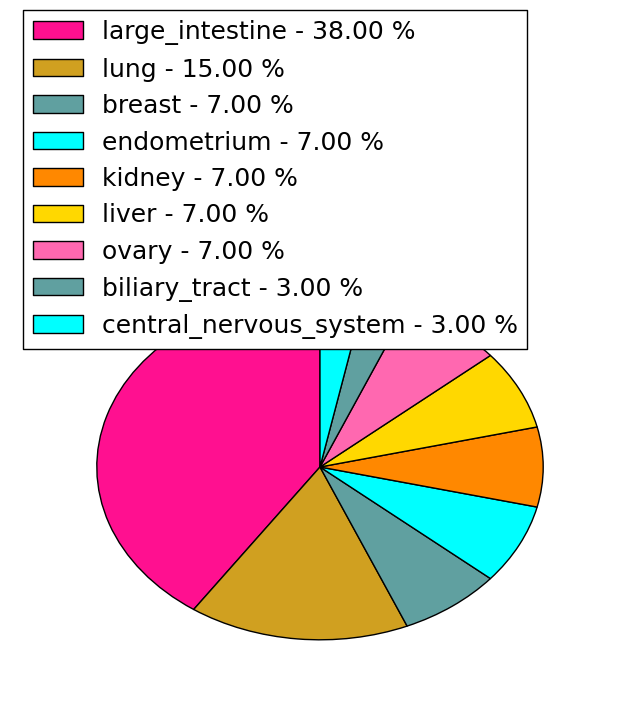
| Point Mutation/ Tissue ID | 1 | 2 | 3 | 4 | 5 | 6 | 7 | 8 | 9 | 10 | 11 | 12 | 13 | 14 | 15 | 16 | 17 | 18 | 19 | 20 |
| # sample | 1 | 1 | 7 | 2 | 2 | 2 | 1 | 1 | 1 | 4 | ||||||||||
| # mutation | 1 | 1 | 7 | 2 | 2 | 2 | 1 | 1 | 1 | 4 | ||||||||||
| nonsynonymous SNV | 1 | 6 | 2 | 2 | 2 | 1 | 1 | 1 | 2 | |||||||||||
| synonymous SNV | 1 | 1 | 2 |
| cf) Tissue ID; Tissue type (1; BLCA[Bladder Urothelial Carcinoma], 2; BRCA[Breast invasive carcinoma], 3; CESC[Cervical squamous cell carcinoma and endocervical adenocarcinoma], 4; COAD[Colon adenocarcinoma], 5; GBM[Glioblastoma multiforme], 6; Glioma Low Grade, 7; HNSC[Head and Neck squamous cell carcinoma], 8; KICH[Kidney Chromophobe], 9; KIRC[Kidney renal clear cell carcinoma], 10; KIRP[Kidney renal papillary cell carcinoma], 11; LAML[Acute Myeloid Leukemia], 12; LUAD[Lung adenocarcinoma], 13; LUSC[Lung squamous cell carcinoma], 14; OV[Ovarian serous cystadenocarcinoma ], 15; PAAD[Pancreatic adenocarcinoma], 16; PRAD[Prostate adenocarcinoma], 17; SKCM[Skin Cutaneous Melanoma], 18:STAD[Stomach adenocarcinoma], 19:THCA[Thyroid carcinoma], 20:UCEC[Uterine Corpus Endometrial Carcinoma]) |
| Top |
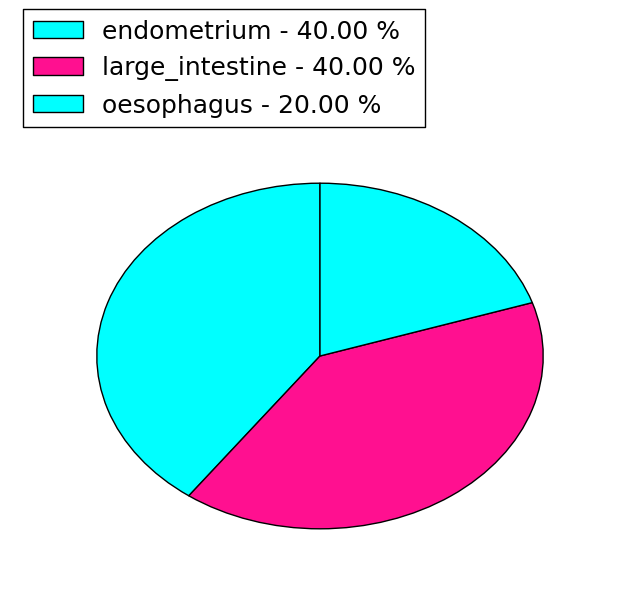
| * We represented just top 10 SNVs. When you move the cursor on each content, you can see more deailed mutation information on the Tooltip. Those are primary_site, primary_histology, mutation(aa), pubmedID. |
| Genomic Position | Mutation(aa) | Unique sampleID count |
| chr14:64152941 | p.R403Q | 2 |
| chr14:64153098 | p.P351S | 2 |
| chr14:64152902 | p.E412D | 1 |
| chr14:64153328 | p.L142L | 1 |
| chr14:64152913 | p.L390F | 1 |
| chr14:64153364 | p.V374L | 1 |
| chr14:64193979 | p.L370P | 1 |
| chr14:64152979 | p.R368R | 1 |
| chr14:64194007 | p.L347V | 1 |
| chr14:64153029 | p.S346C | 1 |
| * Copy number data were extracted from TCGA using R package TCGA-Assembler. The URLs of all public data files on TCGA DCC data server were gathered on Jan-05-2015. Function ProcessCNAData in TCGA-Assembler package was used to obtain gene-level copy number value which is calculated as the average copy number of the genomic region of a gene. |
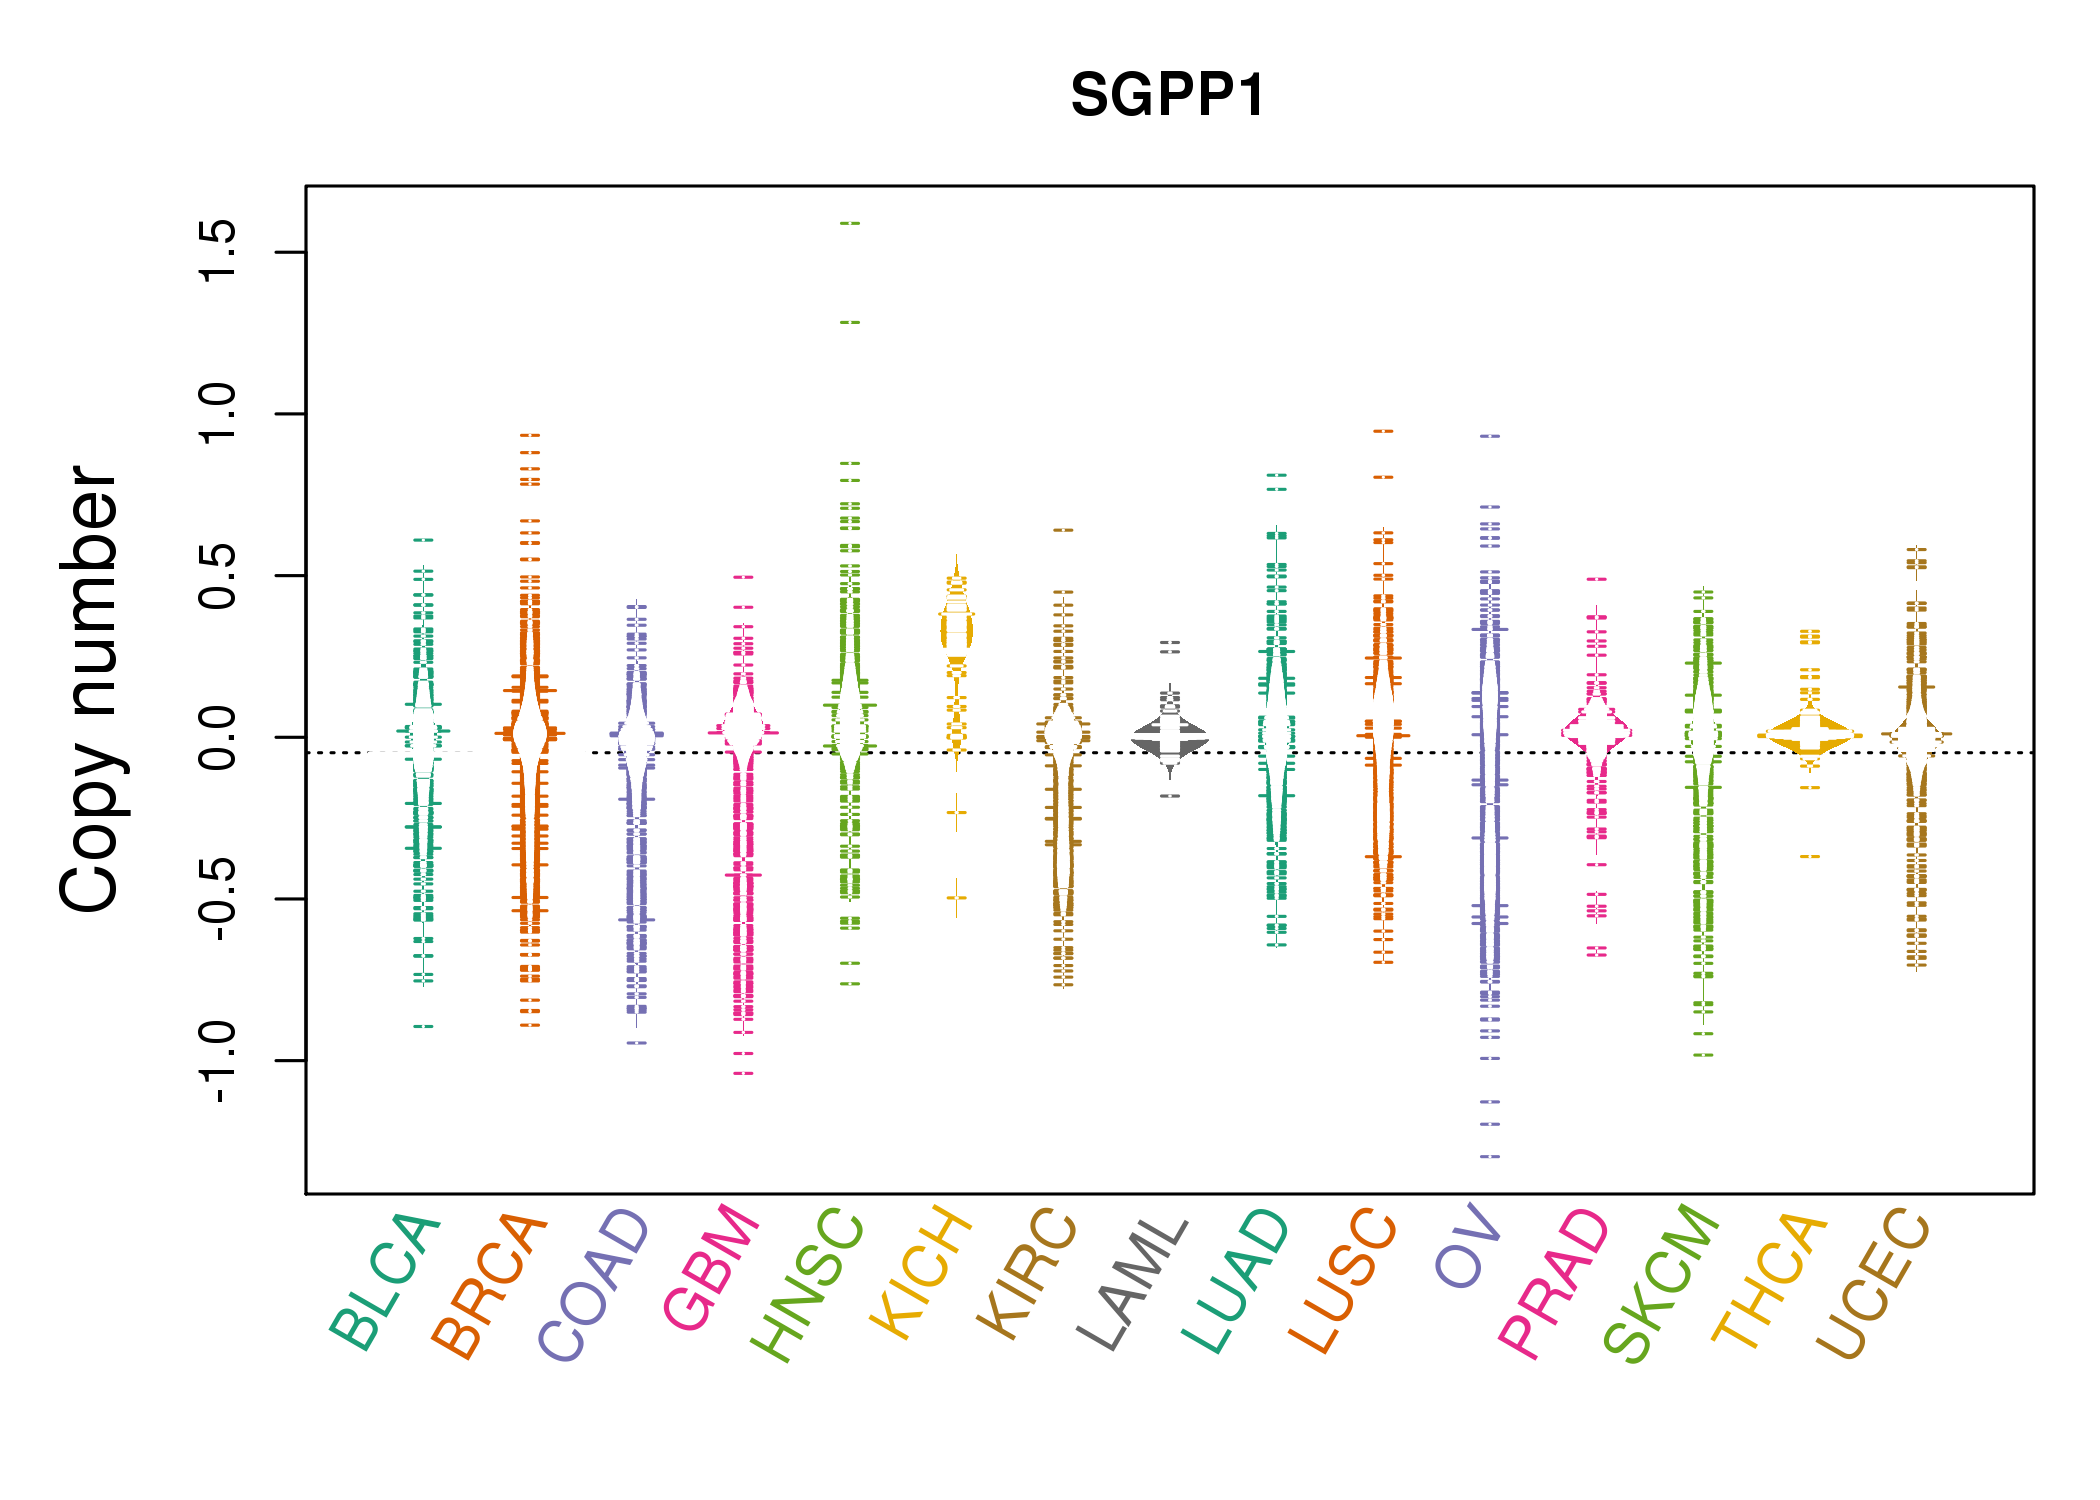 |
| cf) Tissue ID[Tissue type]: BLCA[Bladder Urothelial Carcinoma], BRCA[Breast invasive carcinoma], CESC[Cervical squamous cell carcinoma and endocervical adenocarcinoma], COAD[Colon adenocarcinoma], GBM[Glioblastoma multiforme], Glioma Low Grade, HNSC[Head and Neck squamous cell carcinoma], KICH[Kidney Chromophobe], KIRC[Kidney renal clear cell carcinoma], KIRP[Kidney renal papillary cell carcinoma], LAML[Acute Myeloid Leukemia], LUAD[Lung adenocarcinoma], LUSC[Lung squamous cell carcinoma], OV[Ovarian serous cystadenocarcinoma ], PAAD[Pancreatic adenocarcinoma], PRAD[Prostate adenocarcinoma], SKCM[Skin Cutaneous Melanoma], STAD[Stomach adenocarcinoma], THCA[Thyroid carcinoma], UCEC[Uterine Corpus Endometrial Carcinoma] |
| Top |
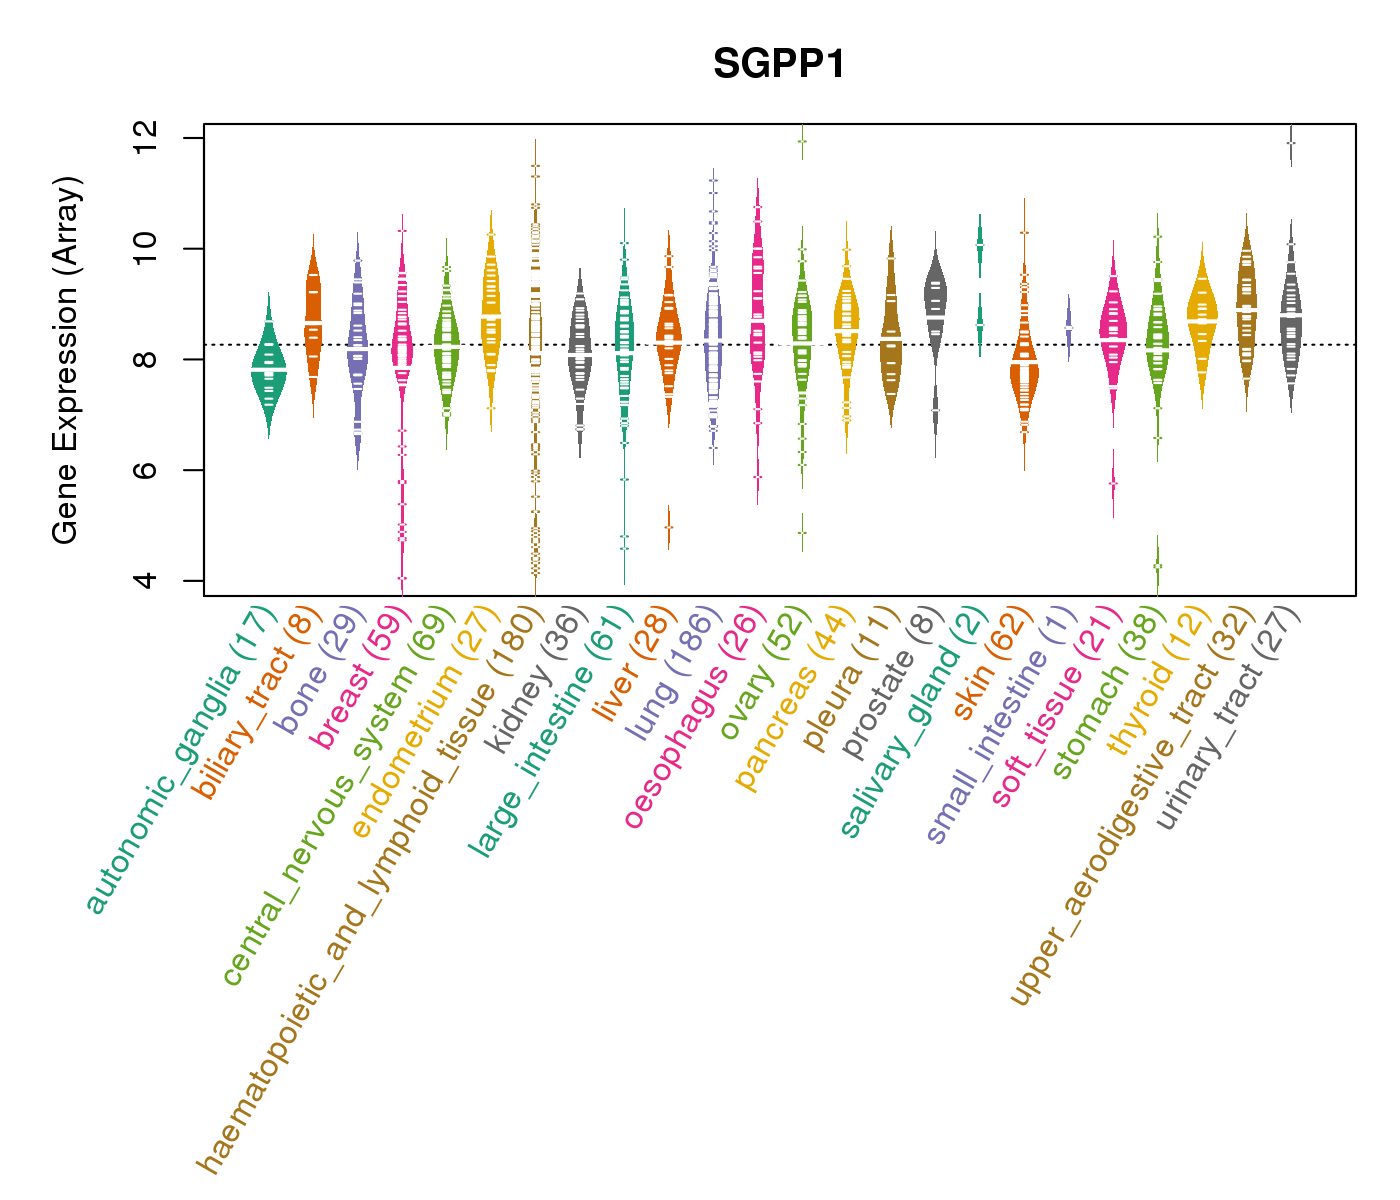
| Gene Expression for SGPP1 |
| * CCLE gene expression data were extracted from CCLE_Expression_Entrez_2012-10-18.res: Gene-centric RMA-normalized mRNA expression data. |
 |
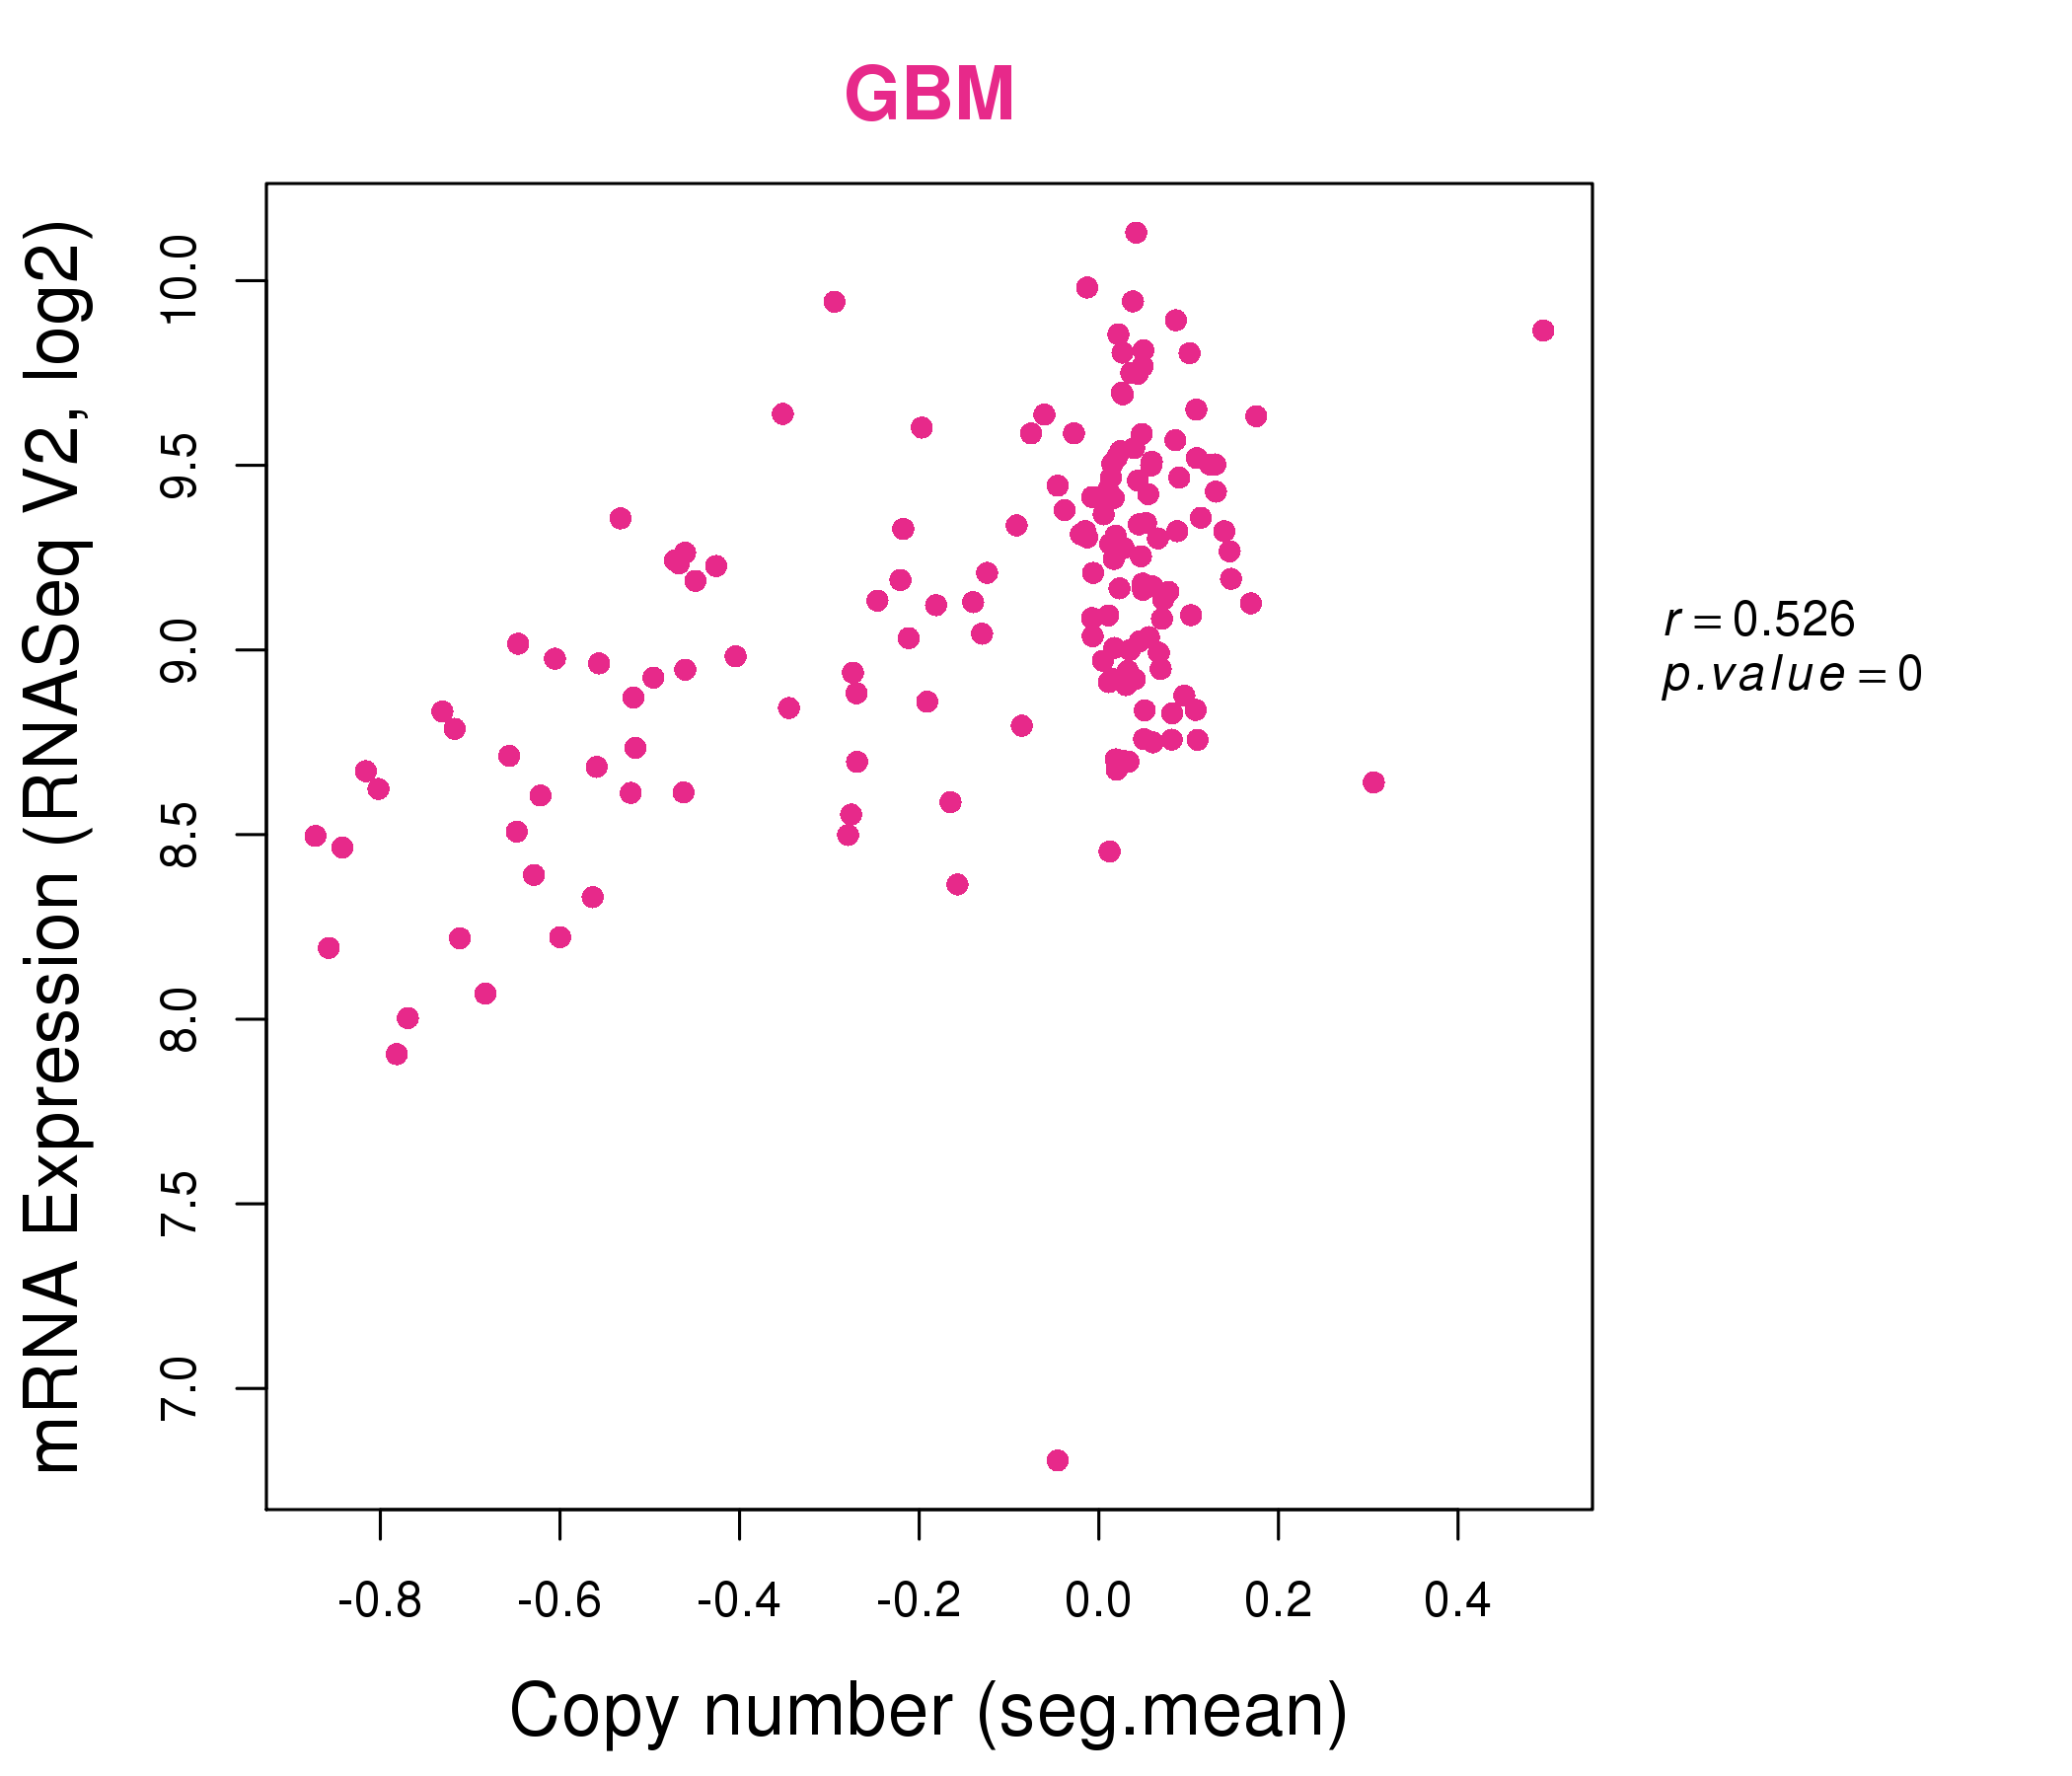
| * Normalized gene expression data of RNASeqV2 was extracted from TCGA using R package TCGA-Assembler. The URLs of all public data files on TCGA DCC data server were gathered at Jan-05-2015. Only eight cancer types have enough normal control samples for differential expression analysis. (t test, adjusted p<0.05 (using Benjamini-Hochberg FDR)) |
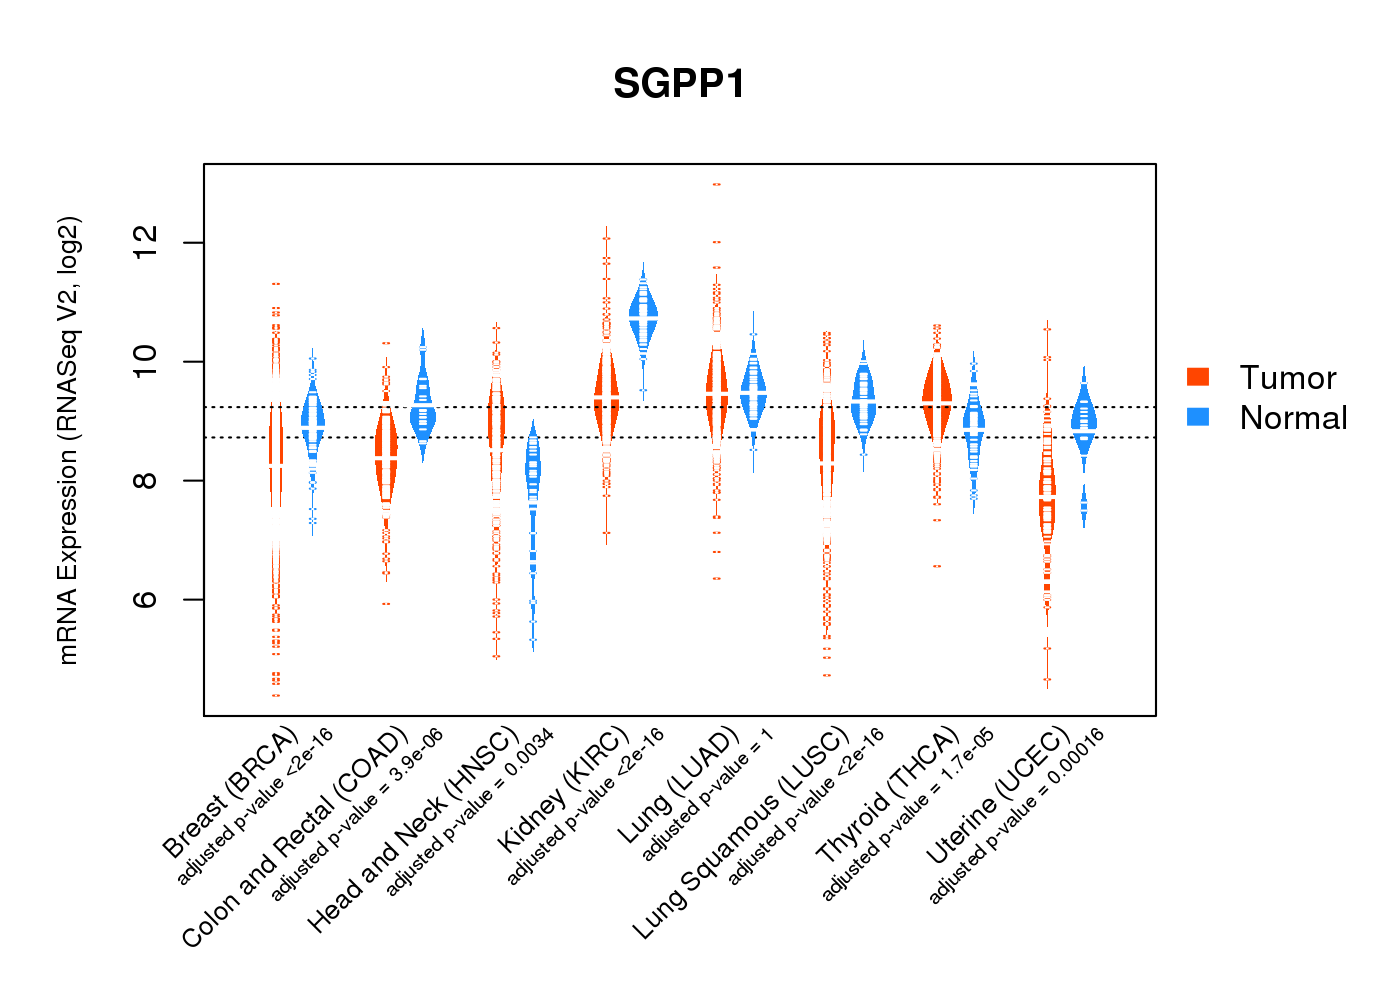 |
| Top |
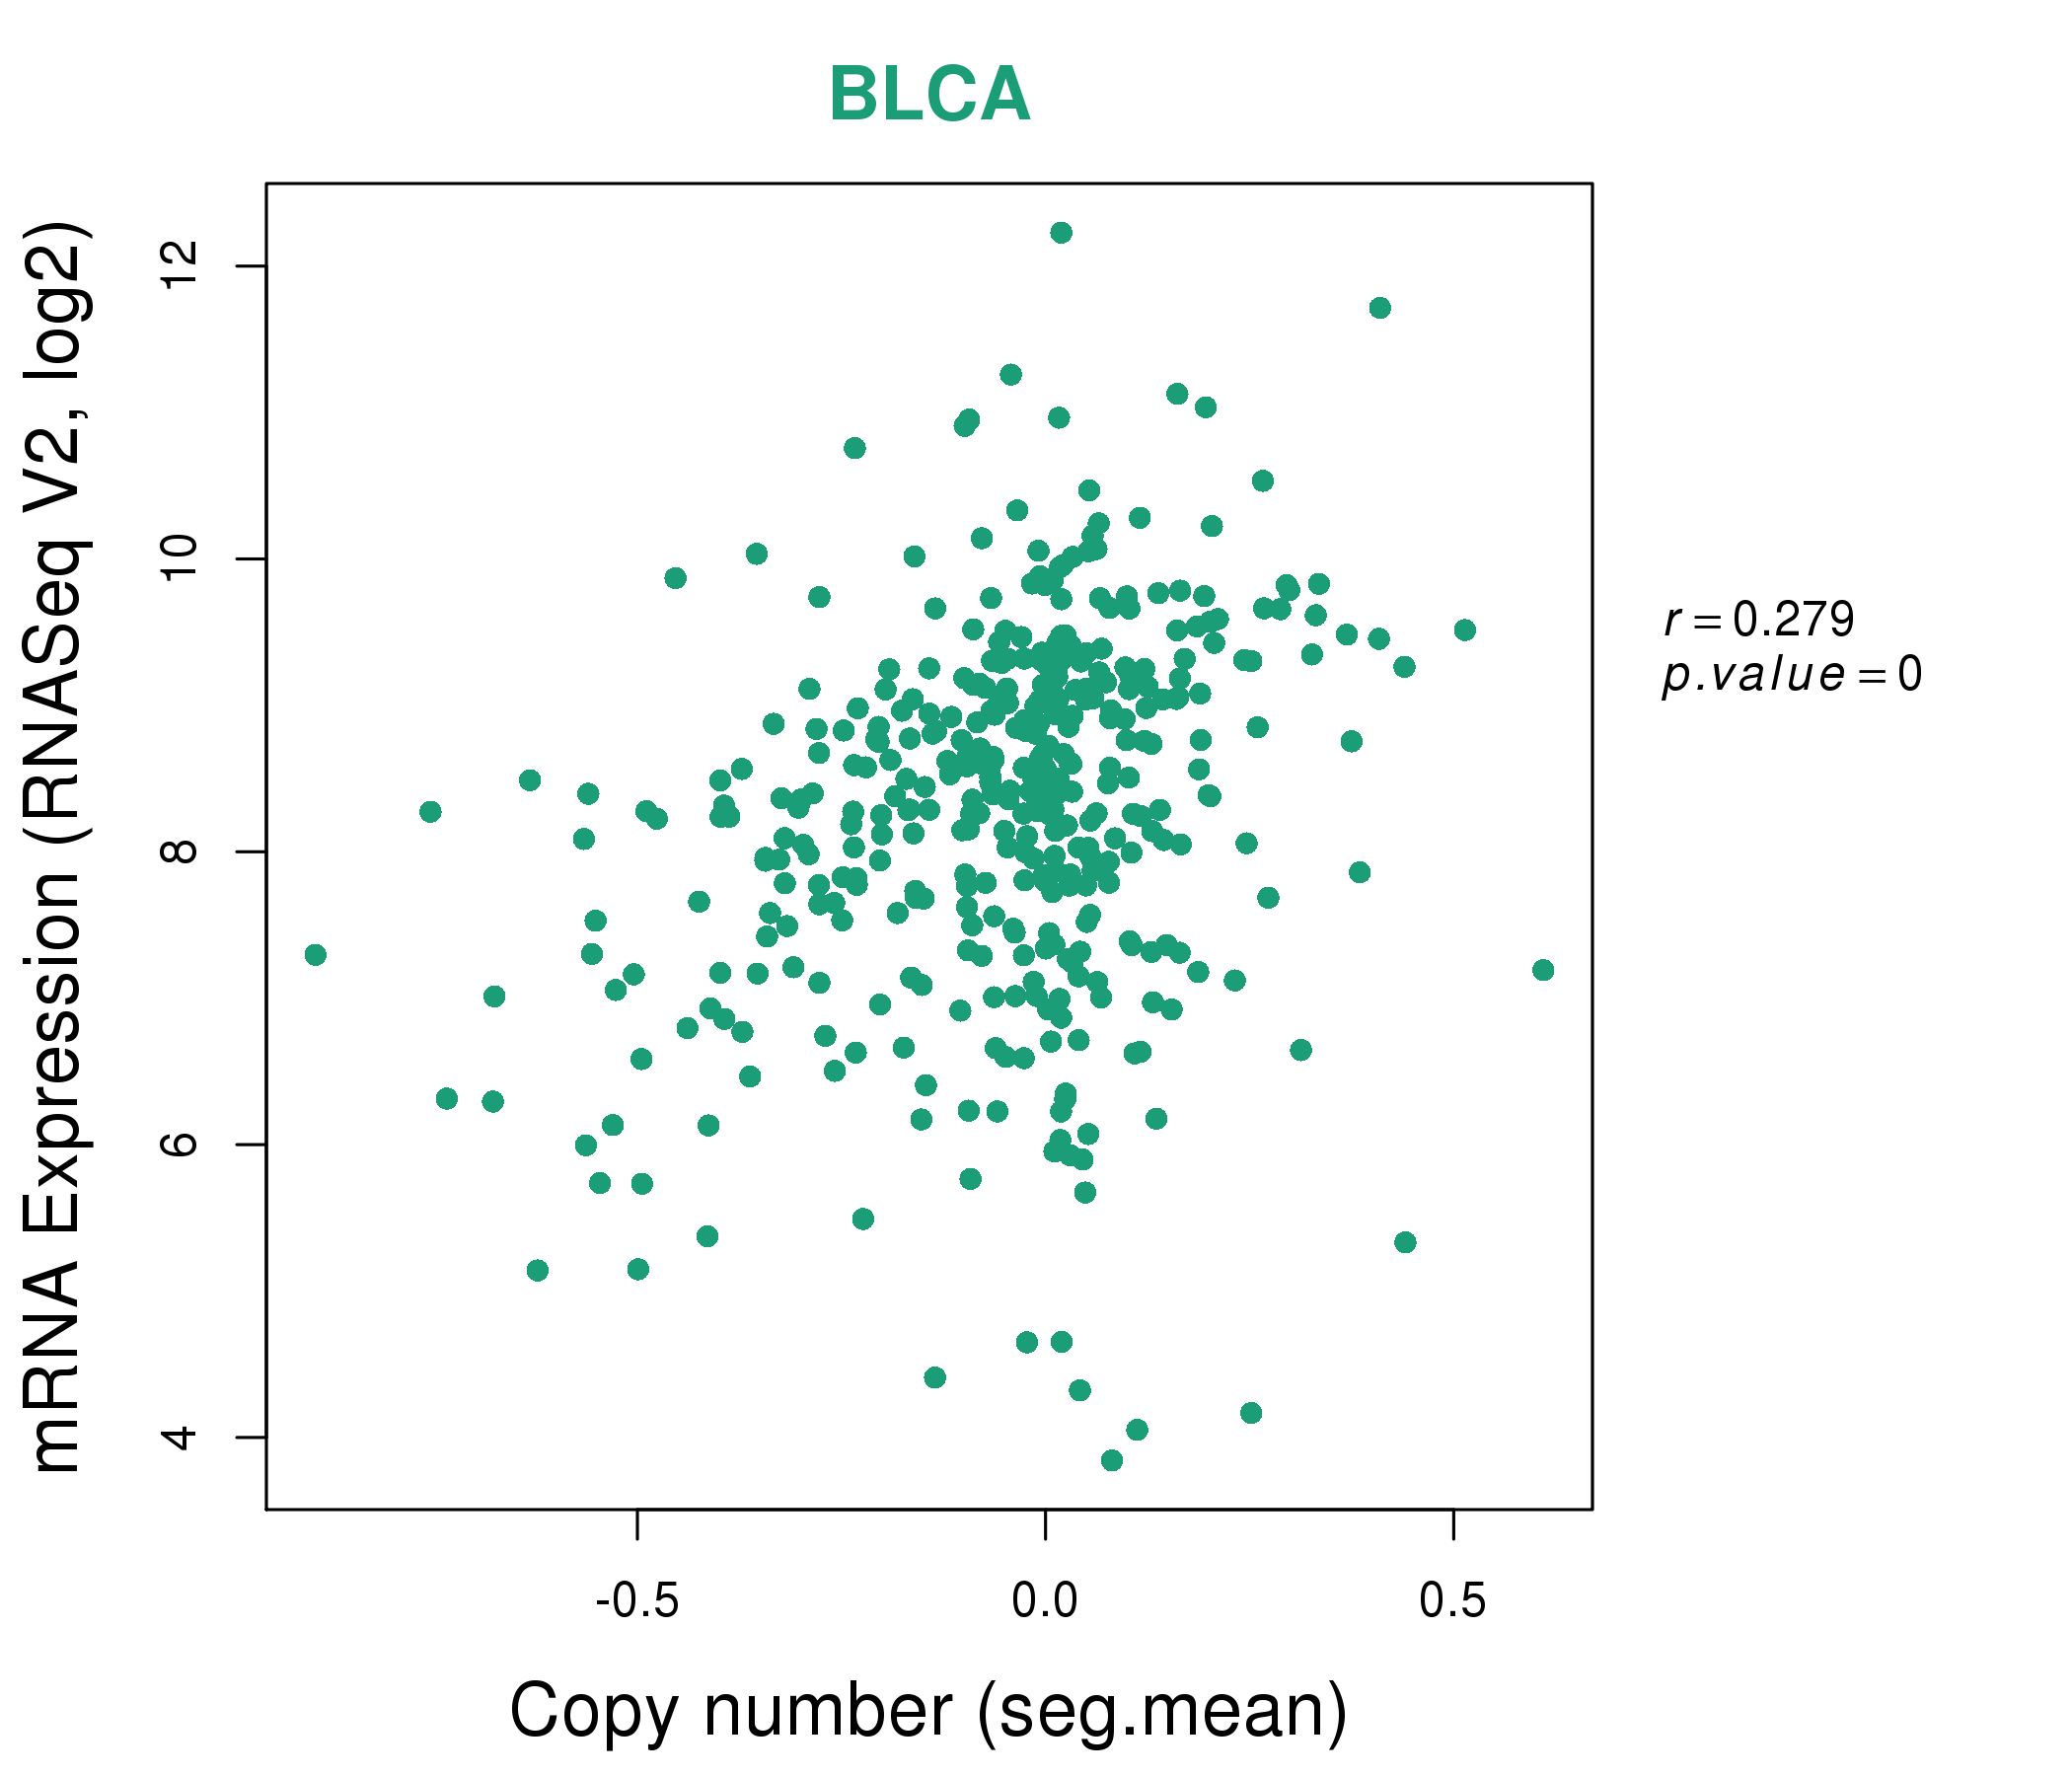
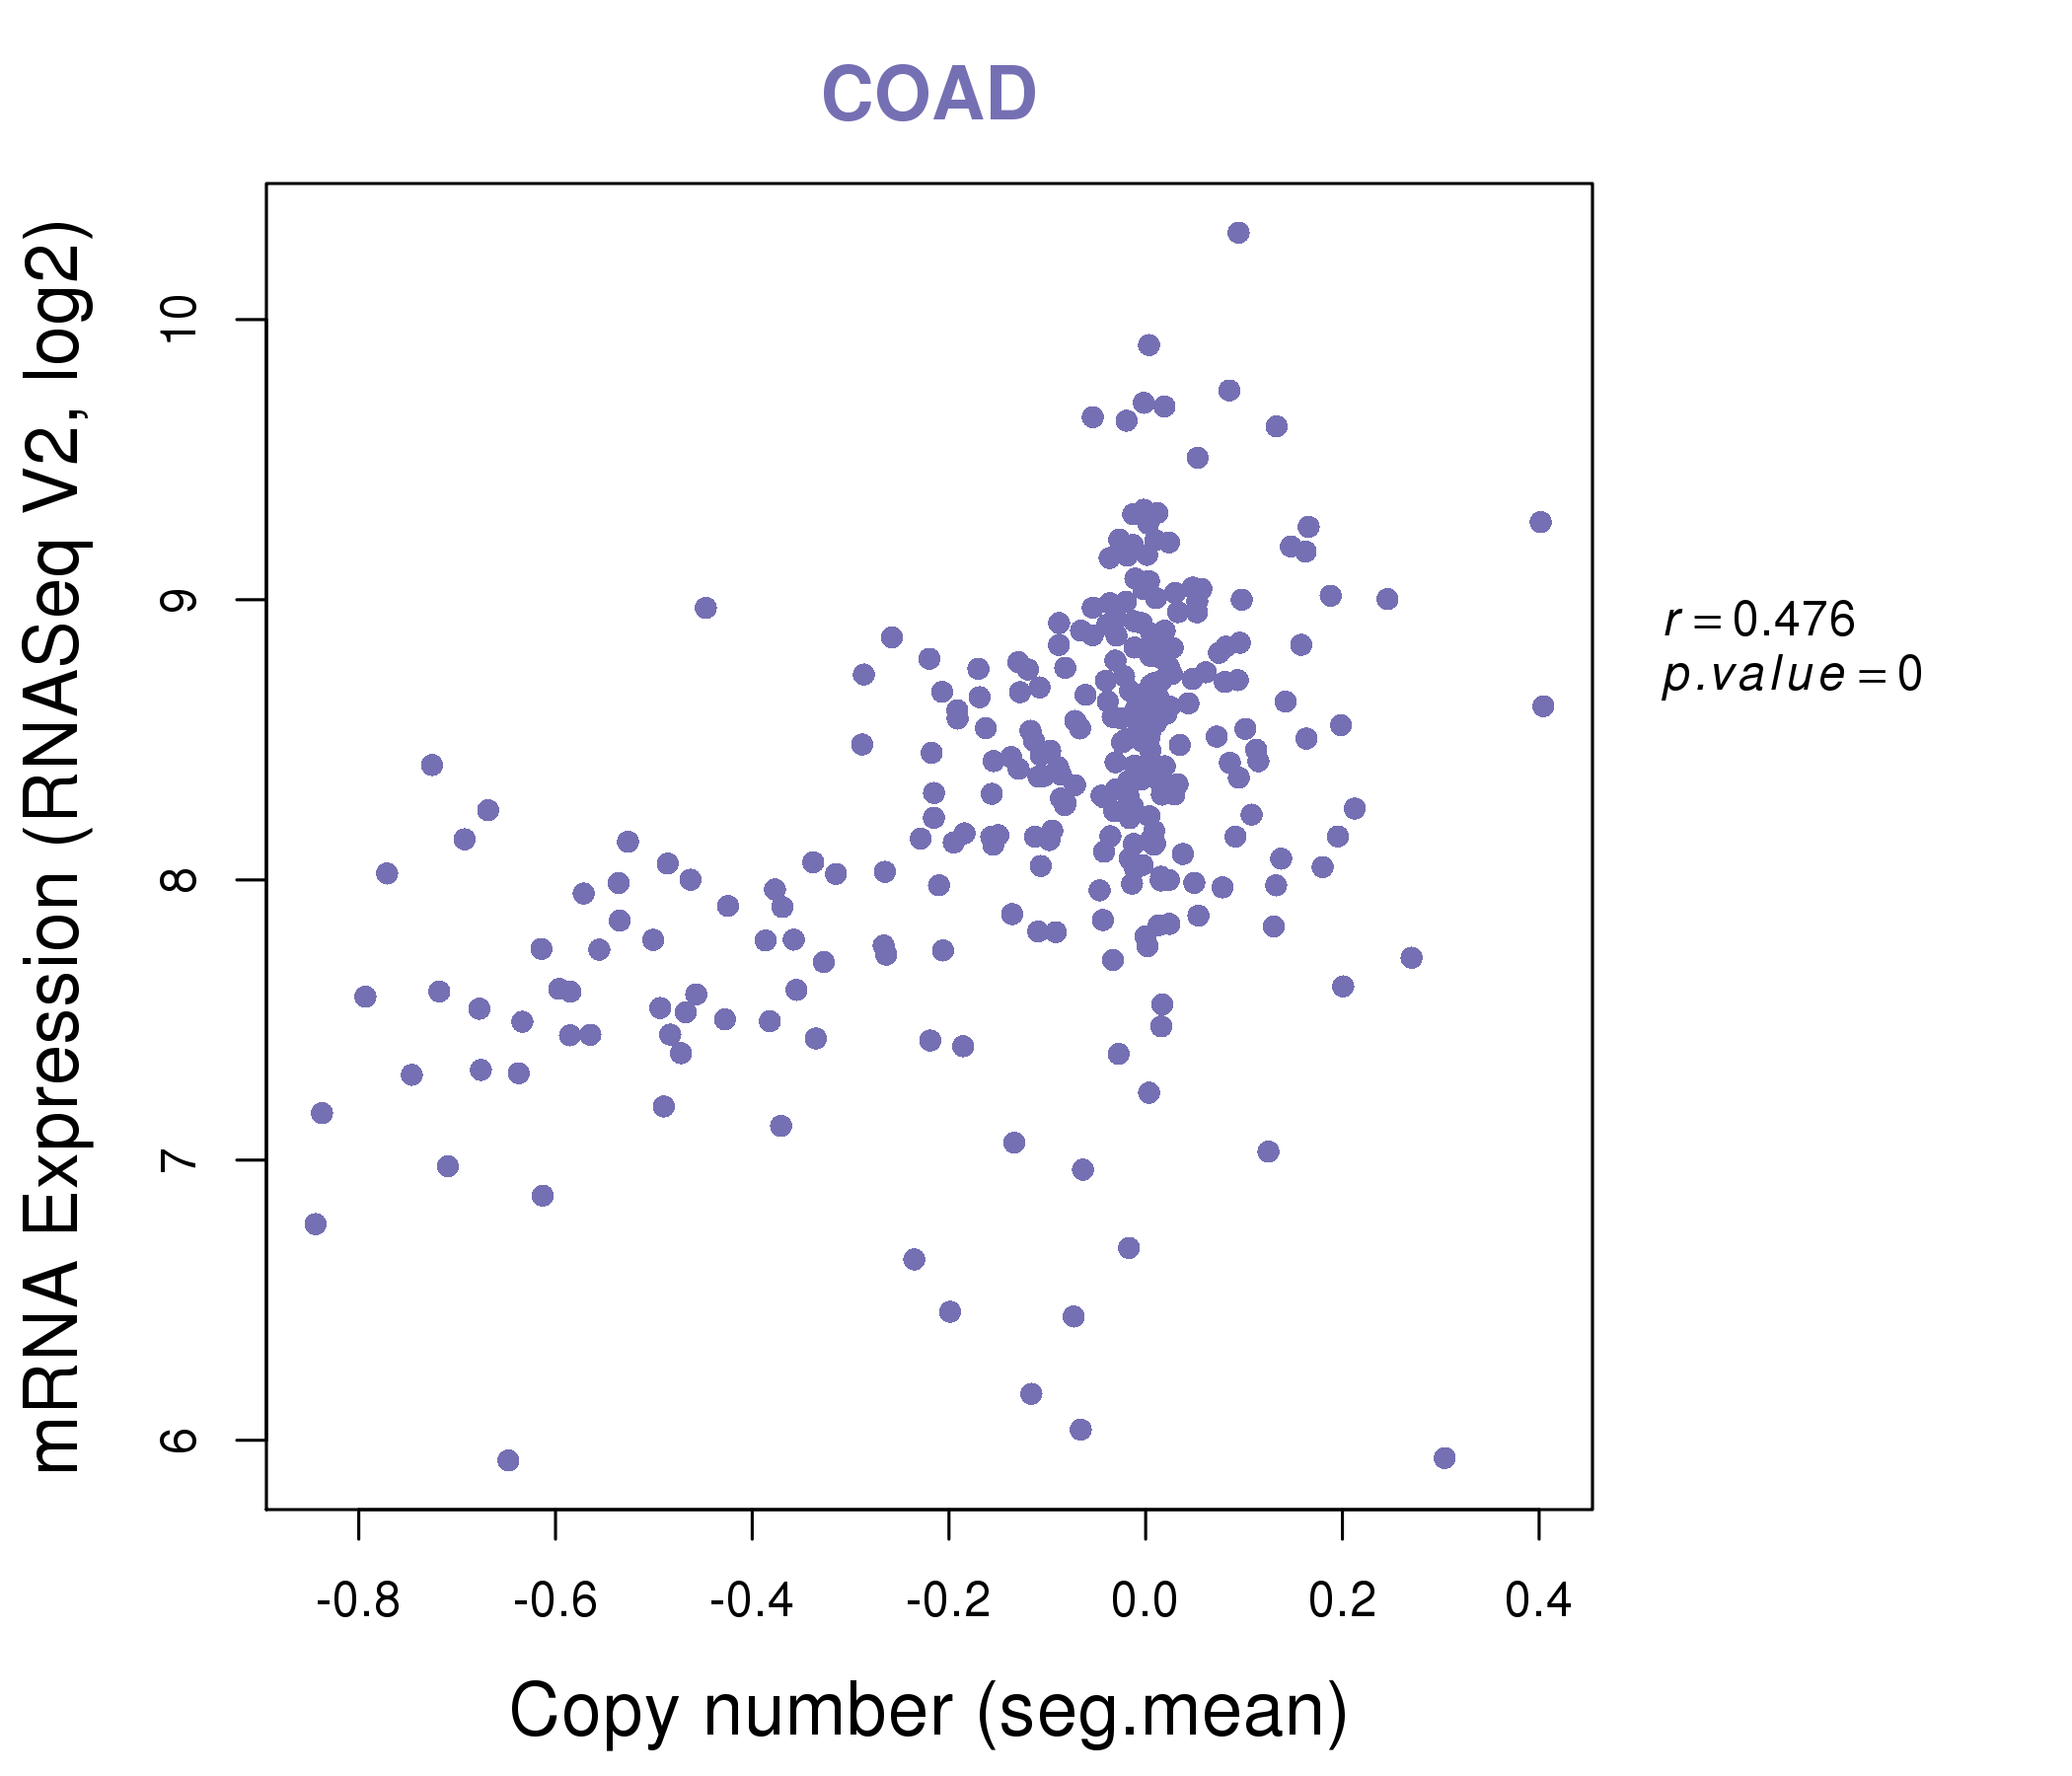
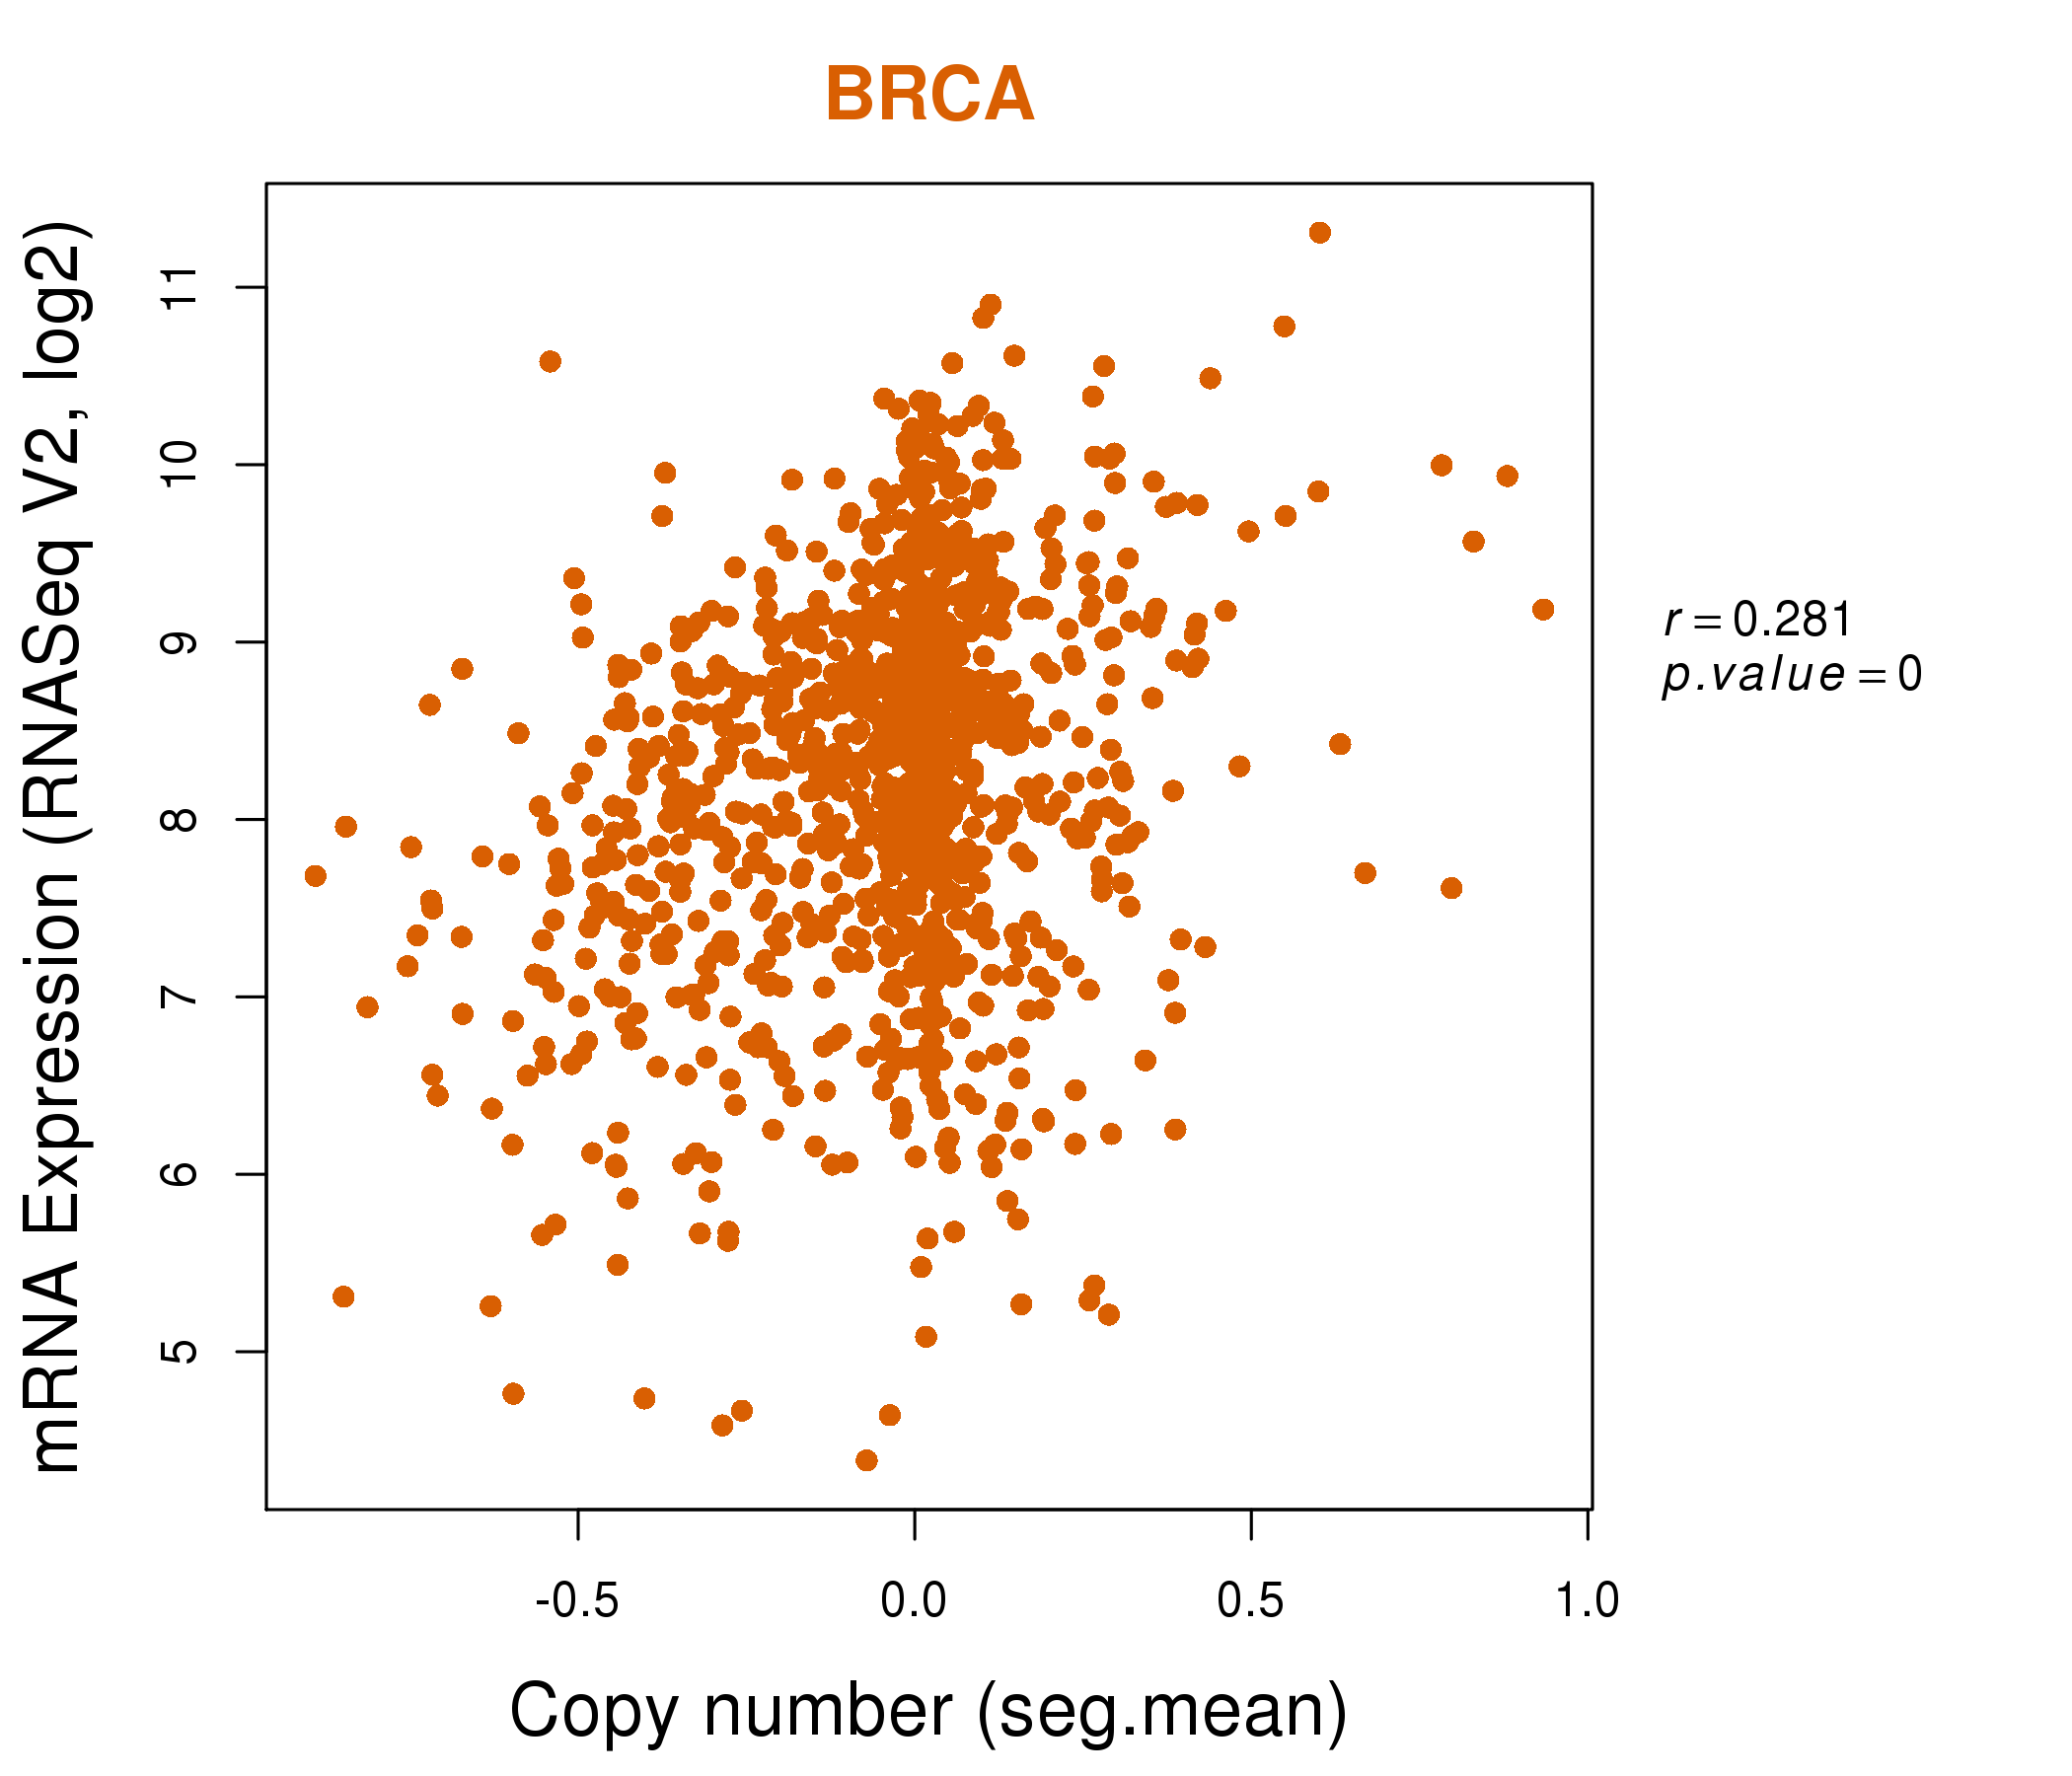
| * This plots show the correlation between CNV and gene expression. |
: Open all plots for all cancer types
 |
|
 |
|
| Top |
| Gene-Gene Network Information |
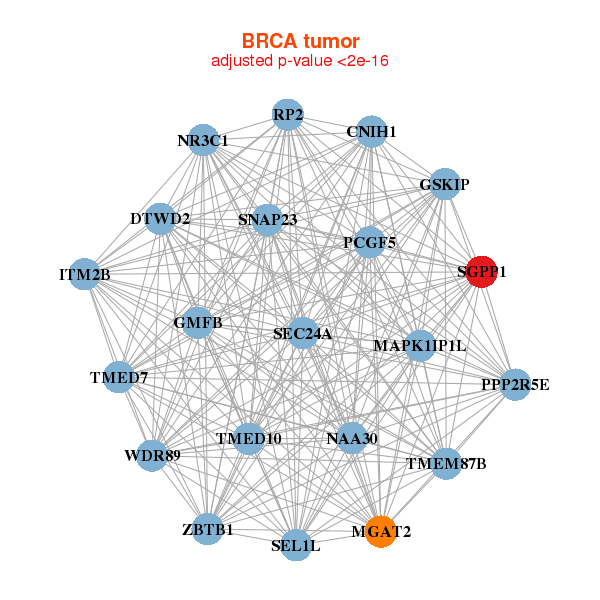
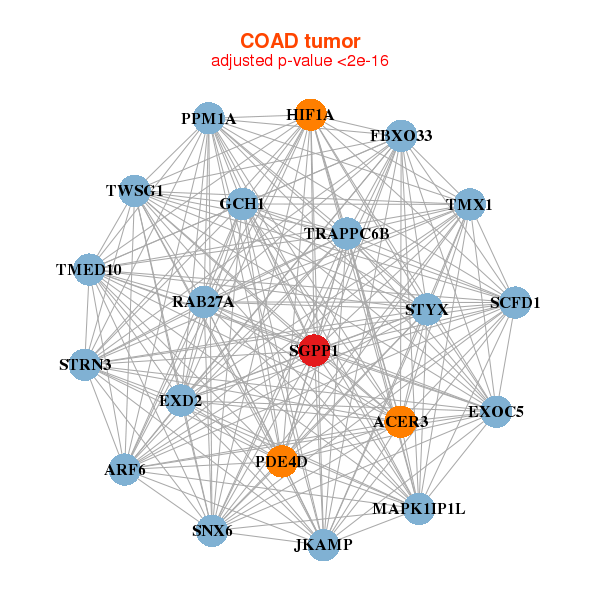
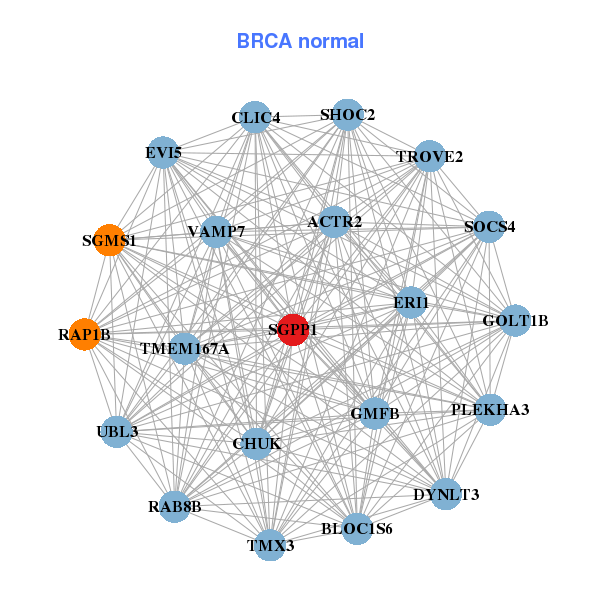
| * Co-Expression network figures were drawn using R package igraph. Only the top 20 genes with the highest correlations were shown. Red circle: input gene, orange circle: cell metabolism gene, sky circle: other gene |
: Open all plots for all cancer types
 |
|
| GSKIP,CNIH1,DTWD2,GMFB,ITM2B,MAPK1IP1L,MGAT2, NAA30,NR3C1,PCGF5,PPP2R5E,RP2,SEC24A,SEL1L, SGPP1,SNAP23,TMED10,TMED7,TMEM87B,WDR89,ZBTB1 | ACTR2,CHUK,CLIC4,DYNLT3,ERI1,EVI5,GMFB, GOLT1B,BLOC1S6,PLEKHA3,RAB8B,RAP1B,SGMS1,SGPP1, SHOC2,SOCS4,TMEM167A,TMX3,TROVE2,UBL3,VAMP7 |
 |
|
| ACER3,ARF6,EXD2,EXOC5,FBXO33,GCH1,HIF1A, JKAMP,MAPK1IP1L,PDE4D,PPM1A,RAB27A,SCFD1,SGPP1, SNX6,STRN3,STYX,TMED10,TMX1,TRAPPC6B,TWSG1 | ARPC5L,CASP9,CHUK,DDX52,DNTTIP2,ELL2,FAM107B, LSM12,MAP2K4,MAT2A,NIP7,PIGA,POLD3,RB1, SERTAD1,SRSF2,SGPP1,TAF5L,TDG,UAP1,WTAP |
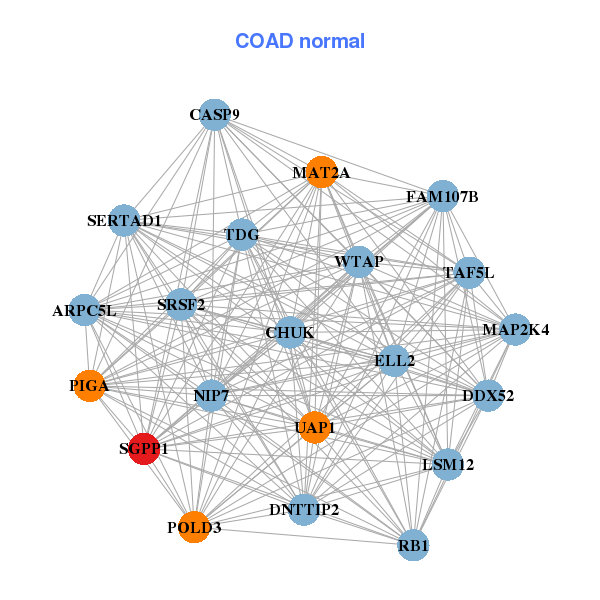
| * Co-Expression network figures were drawn using R package igraph. Only the top 20 genes with the highest correlations were shown. Red circle: input gene, orange circle: cell metabolism gene, sky circle: other gene |
: Open all plots for all cancer types
| Top |
: Open all interacting genes' information including KEGG pathway for all interacting genes from DAVID
| Top |
| Pharmacological Information for SGPP1 |
| There's no related Drug. |
| Top |
| Cross referenced IDs for SGPP1 |
| * We obtained these cross-references from Uniprot database. It covers 150 different DBs, 18 categories. http://www.uniprot.org/help/cross_references_section |
: Open all cross reference information
|
Copyright © 2016-Present - The Univsersity of Texas Health Science Center at Houston @ |