|
||||||||||||||||||||
| |
| Phenotypic Information (metabolism pathway, cancer, disease, phenome) |
| |
| |
| Gene-Gene Network Information: Co-Expression Network, Interacting Genes & KEGG |
| |
|


| Gene Summary for PLA2G12A |
| Basic gene info. | Gene symbol | PLA2G12A |
| Gene name | phospholipase A2, group XIIA | |
| Synonyms | GXII|PLA2G12|ROSSY | |
| Cytomap | UCSC genome browser: 4q25 | |
| Genomic location | chr4 :110631144-110651242 | |
| Type of gene | protein-coding | |
| RefGenes | NM_030821.4, | |
| Ensembl id | ENSG00000123739 | |
| Description | GXII sPLA2group XII secreted phospholipase A2group XIIA secreted phospholipase A2group XIIA secretory phospholipase A2phosphatidylcholine 2-acylhydrolase 12Aphospholipase A2, group XIIsPLA2-XII | |
| Modification date | 20141207 | |
| dbXrefs | MIM : 611652 | |
| HGNC : HGNC | ||
| Ensembl : ENSG00000123739 | ||
| HPRD : 17858 | ||
| Vega : OTTHUMG00000131915 | ||
| Protein | UniProt: go to UniProt's Cross Reference DB Table | |
| Expression | CleanEX: HS_PLA2G12A | |
| BioGPS: 81579 | ||
| Gene Expression Atlas: ENSG00000123739 | ||
| The Human Protein Atlas: ENSG00000123739 | ||
| Pathway | NCI Pathway Interaction Database: PLA2G12A | |
| KEGG: PLA2G12A | ||
| REACTOME: PLA2G12A | ||
| ConsensusPathDB | ||
| Pathway Commons: PLA2G12A | ||
| Metabolism | MetaCyc: PLA2G12A | |
| HUMANCyc: PLA2G12A | ||
| Regulation | Ensembl's Regulation: ENSG00000123739 | |
| miRBase: chr4 :110,631,144-110,651,242 | ||
| TargetScan: NM_030821 | ||
| cisRED: ENSG00000123739 | ||
| Context | iHOP: PLA2G12A | |
| cancer metabolism search in PubMed: PLA2G12A | ||
| UCL Cancer Institute: PLA2G12A | ||
| Assigned class in ccmGDB | C | |
| Top |
| Phenotypic Information for PLA2G12A(metabolism pathway, cancer, disease, phenome) |
| Cancer | CGAP: PLA2G12A |
| Familial Cancer Database: PLA2G12A | |
| * This gene is included in those cancer gene databases. |
|
|
|
|
|
| . | ||||||||||||||
Oncogene 1 | Significant driver gene in | |||||||||||||||||||
| cf) number; DB name 1 Oncogene; http://nar.oxfordjournals.org/content/35/suppl_1/D721.long, 2 Tumor Suppressor gene; https://bioinfo.uth.edu/TSGene/, 3 Cancer Gene Census; http://www.nature.com/nrc/journal/v4/n3/abs/nrc1299.html, 4 CancerGenes; http://nar.oxfordjournals.org/content/35/suppl_1/D721.long, 5 Network of Cancer Gene; http://ncg.kcl.ac.uk/index.php, 1Therapeutic Vulnerabilities in Cancer; http://cbio.mskcc.org/cancergenomics/statius/ |
| KEGG_GLYCEROPHOSPHOLIPID_METABOLISM KEGG_ARACHIDONIC_ACID_METABOLISM KEGG_LINOLEIC_ACID_METABOLISM KEGG_ALPHA_LINOLENIC_ACID_METABOLISM REACTOME_PHOSPHOLIPID_METABOLISM REACTOME_METABOLISM_OF_LIPIDS_AND_LIPOPROTEINS | |
| Mutations for PLA2G12A |
| * Under tables are showing count per each tissue to give us broad intuition about tissue specific mutation patterns.You can go to the detailed page for each mutation database's web site. |
| There's no structural variation information in COSMIC data for this gene. |
| * From mRNA Sanger sequences, Chitars2.0 arranged chimeric transcripts. This table shows PLA2G12A related fusion information. |
| ID | Head Gene | Tail Gene | Accession | Gene_a | qStart_a | qEnd_a | Chromosome_a | tStart_a | tEnd_a | Gene_a | qStart_a | qEnd_a | Chromosome_a | tStart_a | tEnd_a |
| DA268556 | PLA2G12A | 1 | 366 | 4 | 110650757 | 110651122 | SCAPER | 365 | 558 | 15 | 76866499 | 76914171 | |
| Top |
| There's no copy number variation information in COSMIC data for this gene. |
| Top |
|
 |
| Top |
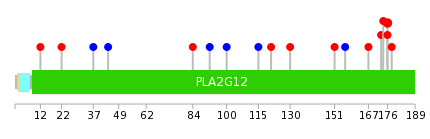
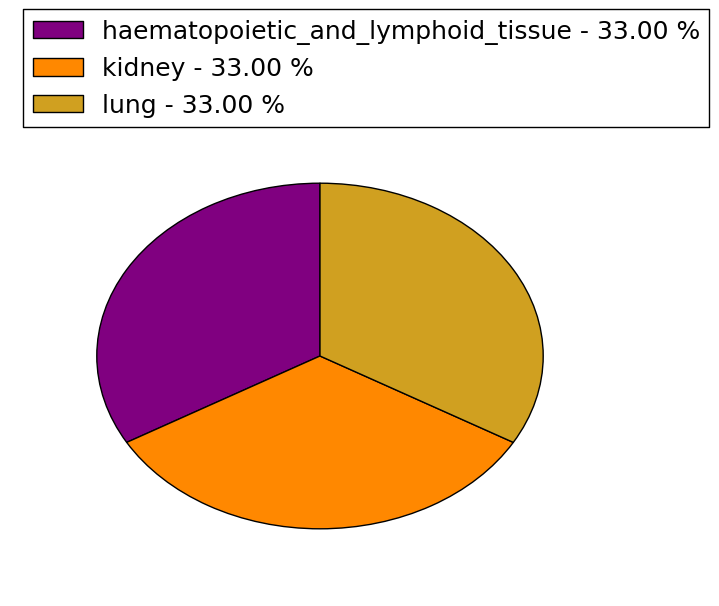
| Stat. for Non-Synonymous SNVs (# total SNVs=11) | (# total SNVs=3) |
 |  |
(# total SNVs=0) | (# total SNVs=0) |
| Top |
| * When you move the cursor on each content, you can see more deailed mutation information on the Tooltip. Those are primary_site,primary_histology,mutation(aa),pubmedID. |
| GRCh37 position | Mutation(aa) | Unique sampleID count |
| chr4:110635576-110635576 | p.R176Q | 3 |
| chr4:110638766-110638766 | p.Y130F | 1 |
| chr4:110638792-110638792 | p.K121N | 1 |
| chr4:110638810-110638810 | p.E115E | 1 |
| chr4:110638855-110638855 | p.I100I | 1 |
| chr4:110635571-110635571 | p.A178T | 1 |
| chr4:110639848-110639848 | p.F92F | 1 |
| chr4:110639873-110639873 | p.P84L | 1 |
| chr4:110635582-110635582 | p.S174N | 1 |
| chr4:110650834-110650834 | p.K44K | 1 |
| Top |
|
 |
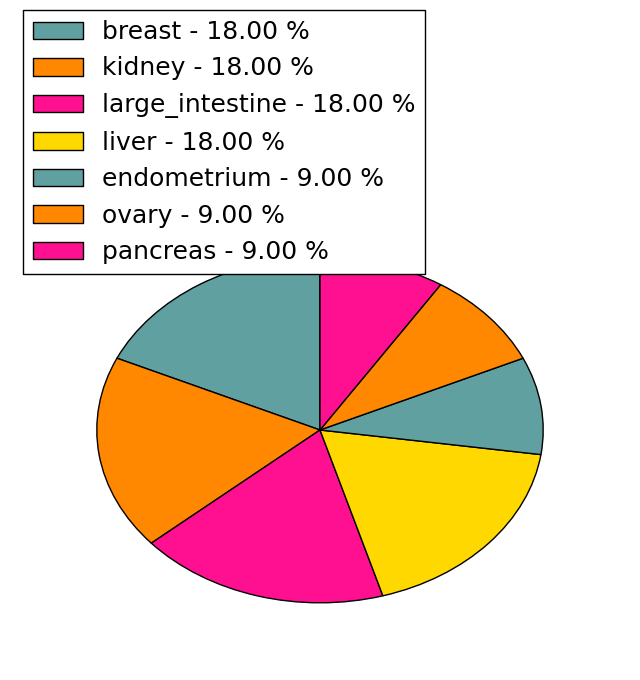
| Point Mutation/ Tissue ID | 1 | 2 | 3 | 4 | 5 | 6 | 7 | 8 | 9 | 10 | 11 | 12 | 13 | 14 | 15 | 16 | 17 | 18 | 19 | 20 |
| # sample | 1 | 1 | 1 | 1 | 1 | 1 | 1 | 2 | 2 | 1 | ||||||||||
| # mutation | 1 | 1 | 1 | 1 | 1 | 1 | 1 | 2 | 2 | 1 | ||||||||||
| nonsynonymous SNV | 1 | 1 | 1 | 1 | 1 | 1 | 2 | 1 | ||||||||||||
| synonymous SNV | 1 | 2 |
| cf) Tissue ID; Tissue type (1; BLCA[Bladder Urothelial Carcinoma], 2; BRCA[Breast invasive carcinoma], 3; CESC[Cervical squamous cell carcinoma and endocervical adenocarcinoma], 4; COAD[Colon adenocarcinoma], 5; GBM[Glioblastoma multiforme], 6; Glioma Low Grade, 7; HNSC[Head and Neck squamous cell carcinoma], 8; KICH[Kidney Chromophobe], 9; KIRC[Kidney renal clear cell carcinoma], 10; KIRP[Kidney renal papillary cell carcinoma], 11; LAML[Acute Myeloid Leukemia], 12; LUAD[Lung adenocarcinoma], 13; LUSC[Lung squamous cell carcinoma], 14; OV[Ovarian serous cystadenocarcinoma ], 15; PAAD[Pancreatic adenocarcinoma], 16; PRAD[Prostate adenocarcinoma], 17; SKCM[Skin Cutaneous Melanoma], 18:STAD[Stomach adenocarcinoma], 19:THCA[Thyroid carcinoma], 20:UCEC[Uterine Corpus Endometrial Carcinoma]) |
| Top |
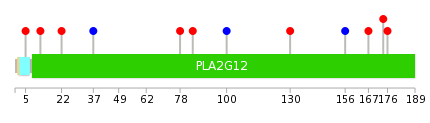
| * We represented just top 10 SNVs. When you move the cursor on each content, you can see more deailed mutation information on the Tooltip. Those are primary_site, primary_histology, mutation(aa), pubmedID. |
| Genomic Position | Mutation(aa) | Unique sampleID count |
| chr4:110639891 | p.Y130F | 1 |
| chr4:110650855 | p.I100I | 1 |
| chr4:110650902 | p.P84L | 1 |
| chr4:110650931 | p.G78V | 1 |
| chr4:110635576 | p.T37T | 1 |
| chr4:110650952 | p.C22G | 1 |
| chr4:110635582 | p.L12P | 1 |
| chr4:110635604 | p.S5W | 1 |
| chr4:110635635 | p.R176L | 1 |
| chr4:110638766 | p.S174N | 1 |
| * Copy number data were extracted from TCGA using R package TCGA-Assembler. The URLs of all public data files on TCGA DCC data server were gathered on Jan-05-2015. Function ProcessCNAData in TCGA-Assembler package was used to obtain gene-level copy number value which is calculated as the average copy number of the genomic region of a gene. |
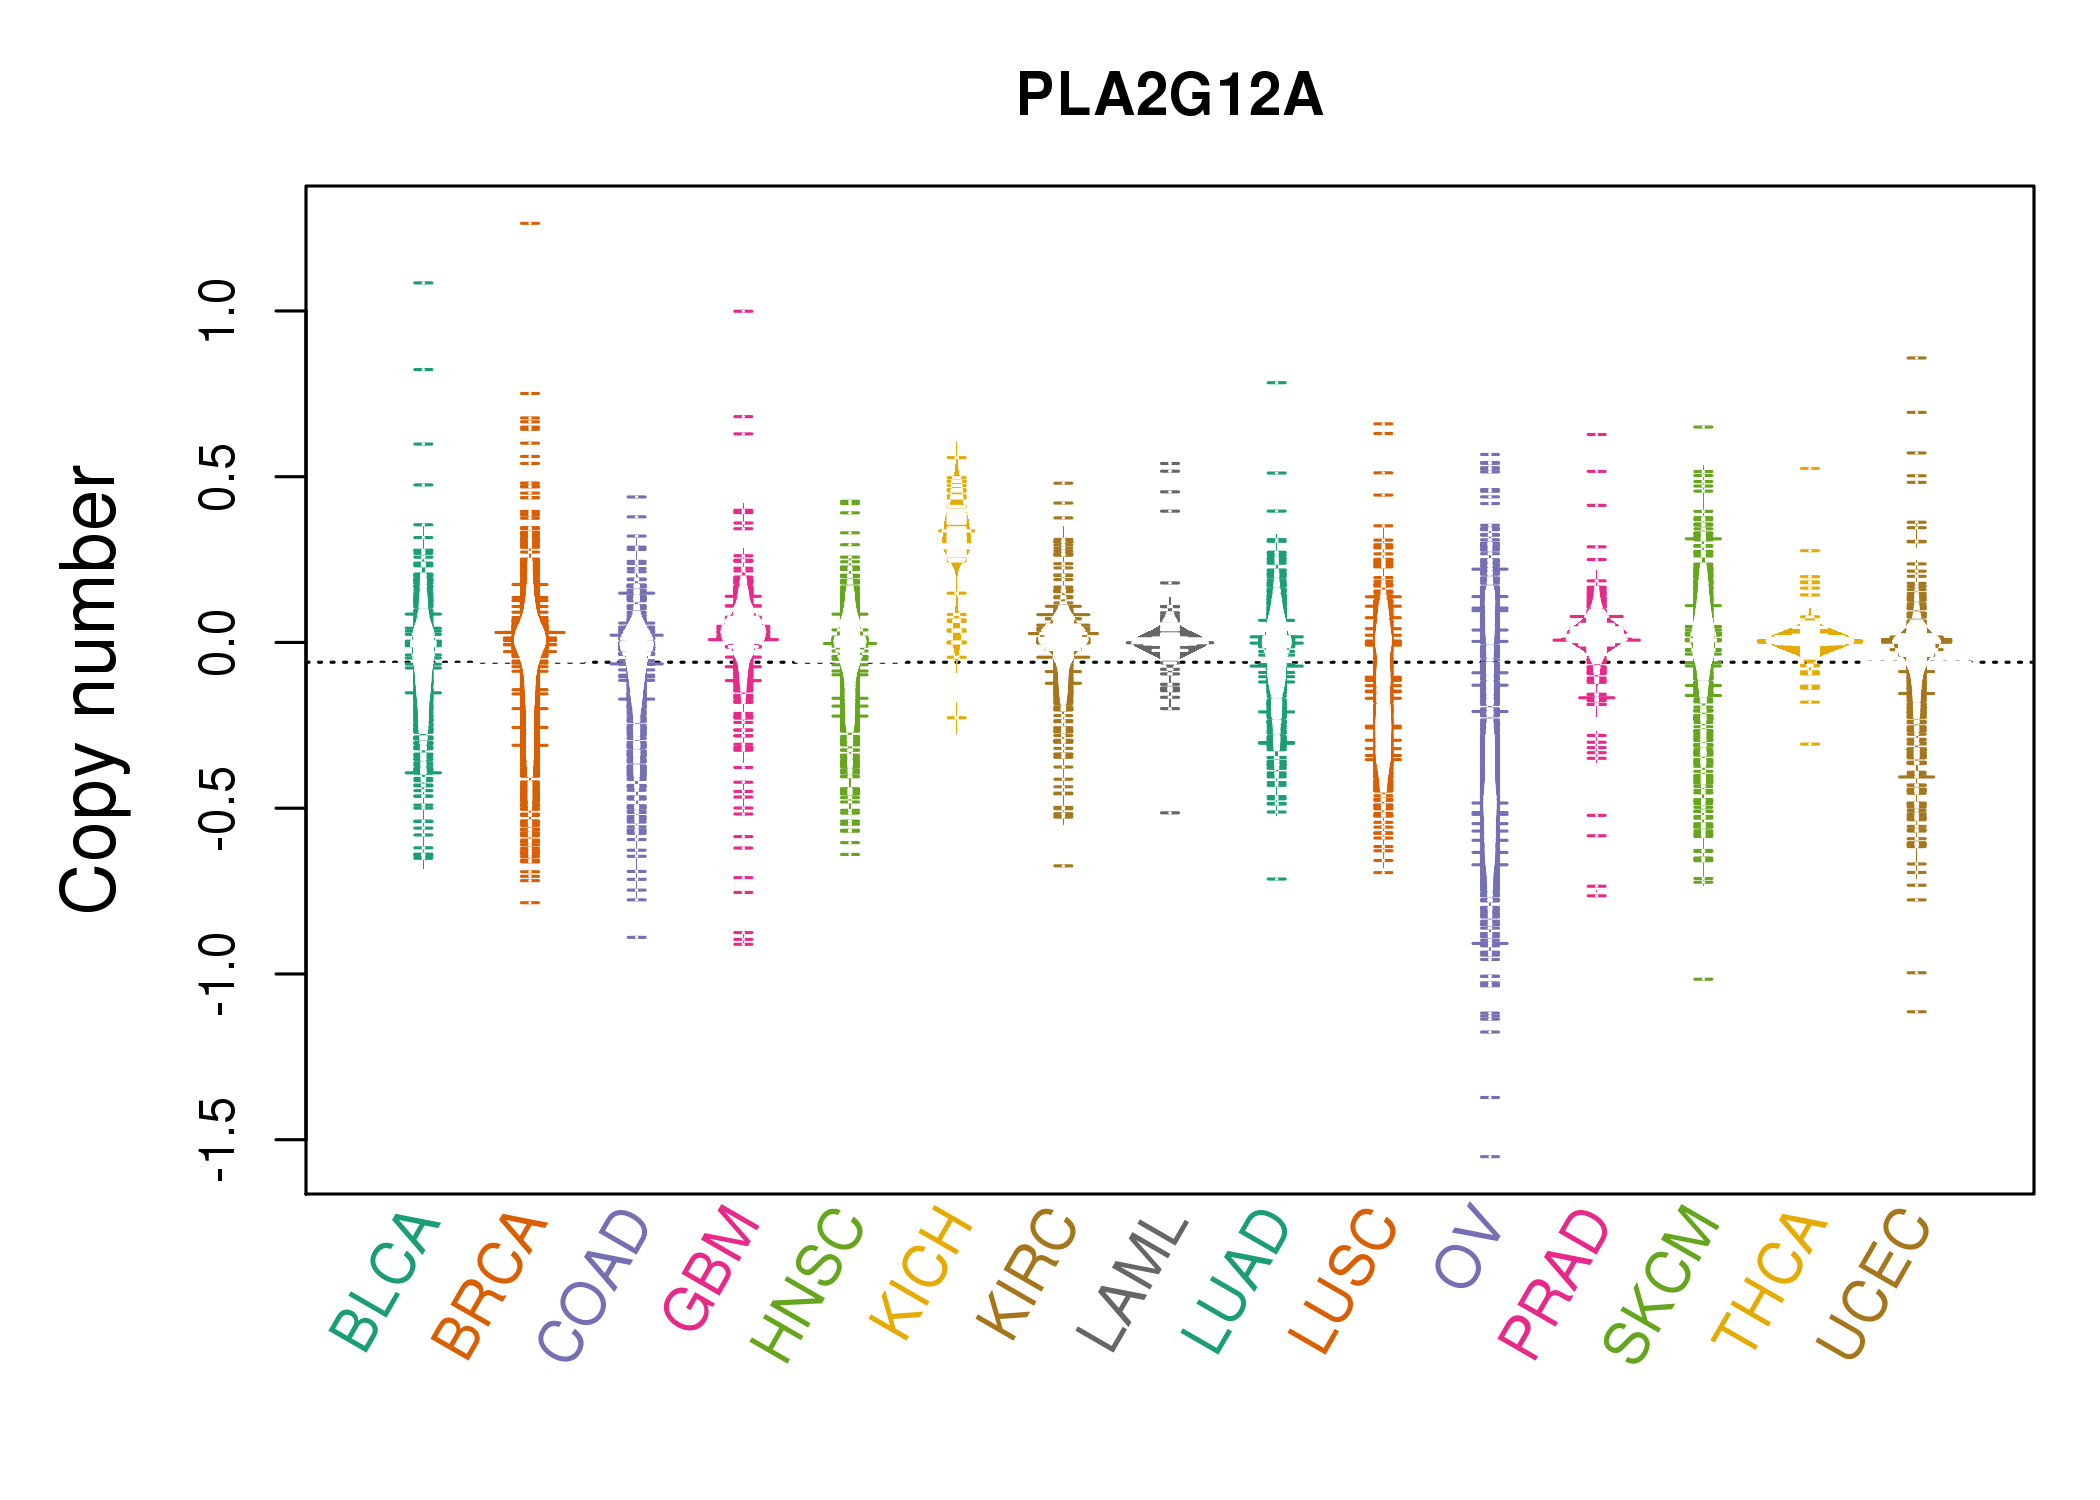 |
| cf) Tissue ID[Tissue type]: BLCA[Bladder Urothelial Carcinoma], BRCA[Breast invasive carcinoma], CESC[Cervical squamous cell carcinoma and endocervical adenocarcinoma], COAD[Colon adenocarcinoma], GBM[Glioblastoma multiforme], Glioma Low Grade, HNSC[Head and Neck squamous cell carcinoma], KICH[Kidney Chromophobe], KIRC[Kidney renal clear cell carcinoma], KIRP[Kidney renal papillary cell carcinoma], LAML[Acute Myeloid Leukemia], LUAD[Lung adenocarcinoma], LUSC[Lung squamous cell carcinoma], OV[Ovarian serous cystadenocarcinoma ], PAAD[Pancreatic adenocarcinoma], PRAD[Prostate adenocarcinoma], SKCM[Skin Cutaneous Melanoma], STAD[Stomach adenocarcinoma], THCA[Thyroid carcinoma], UCEC[Uterine Corpus Endometrial Carcinoma] |
| Top |
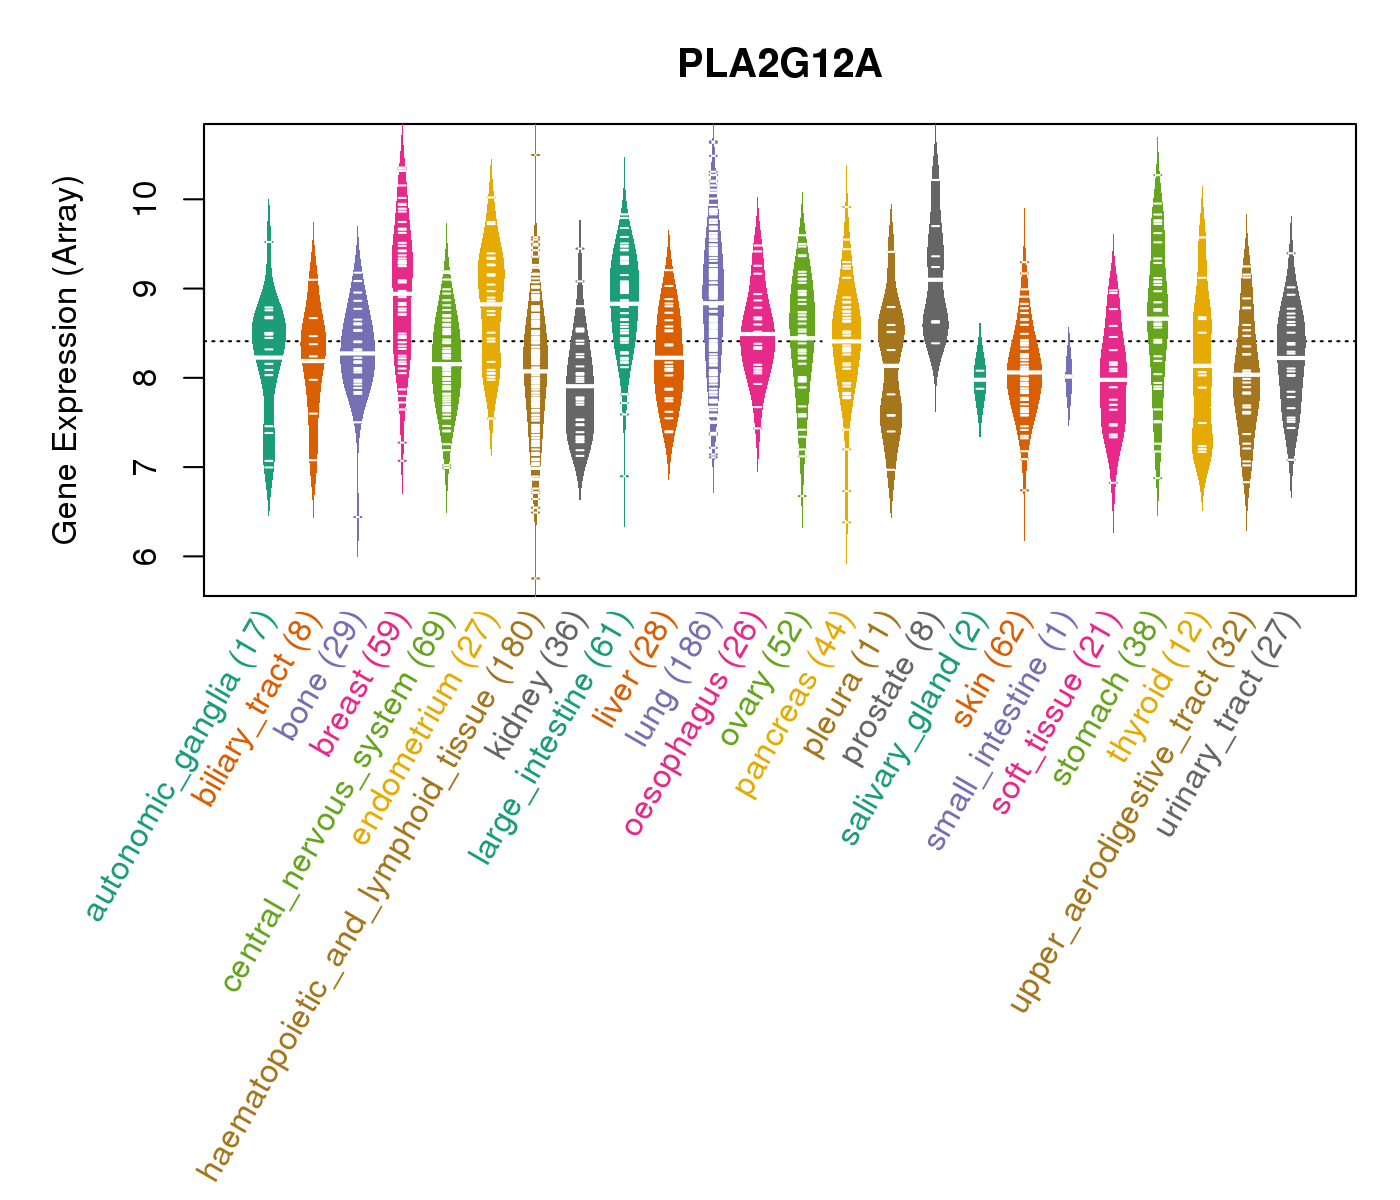
| Gene Expression for PLA2G12A |
| * CCLE gene expression data were extracted from CCLE_Expression_Entrez_2012-10-18.res: Gene-centric RMA-normalized mRNA expression data. |
 |
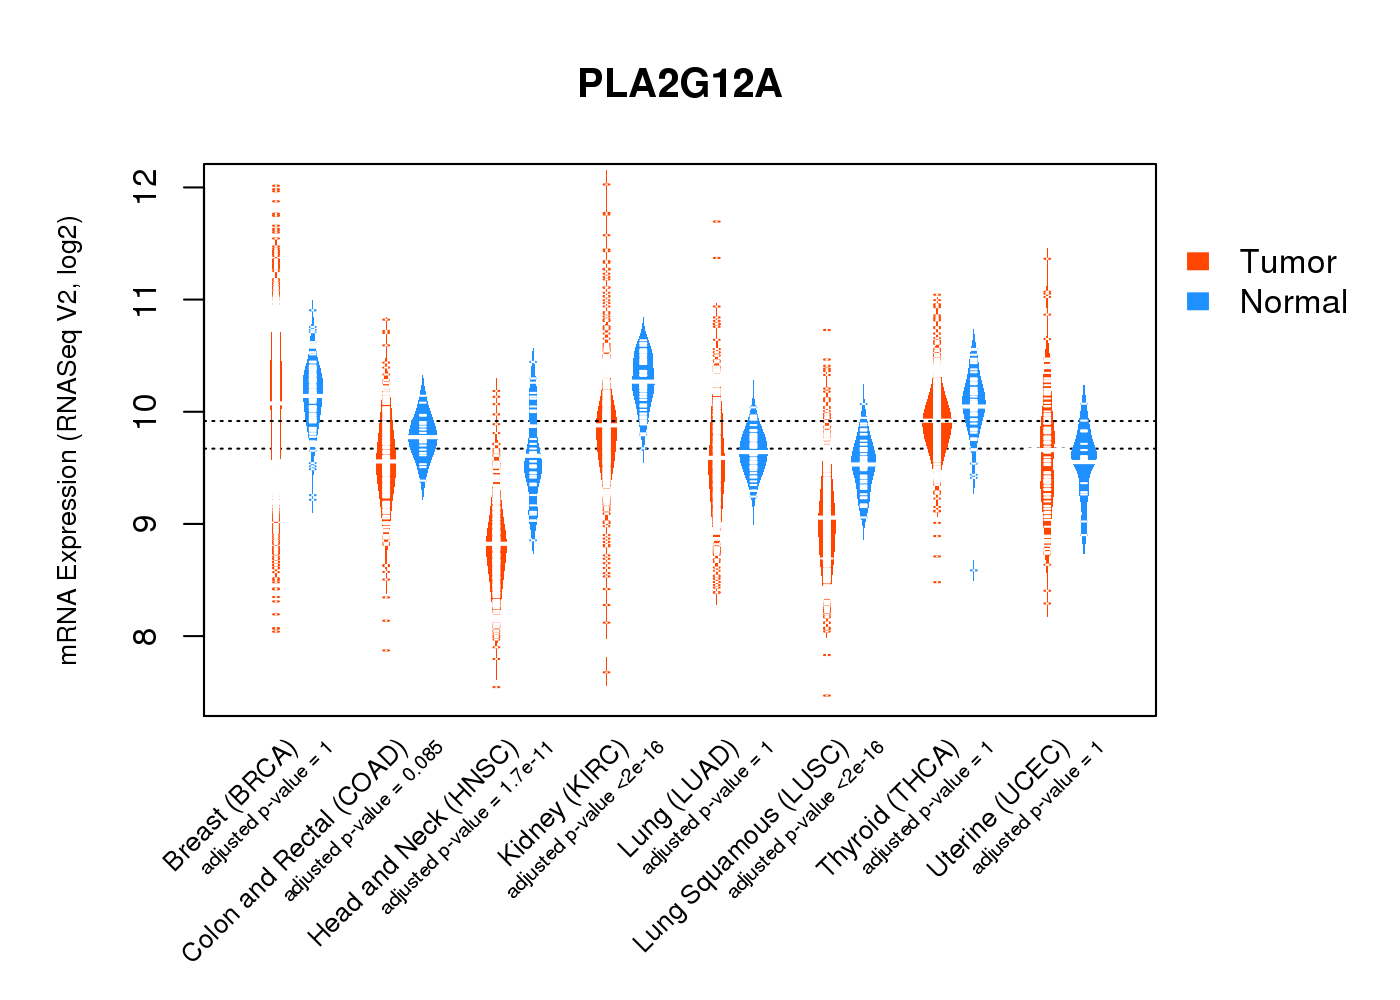
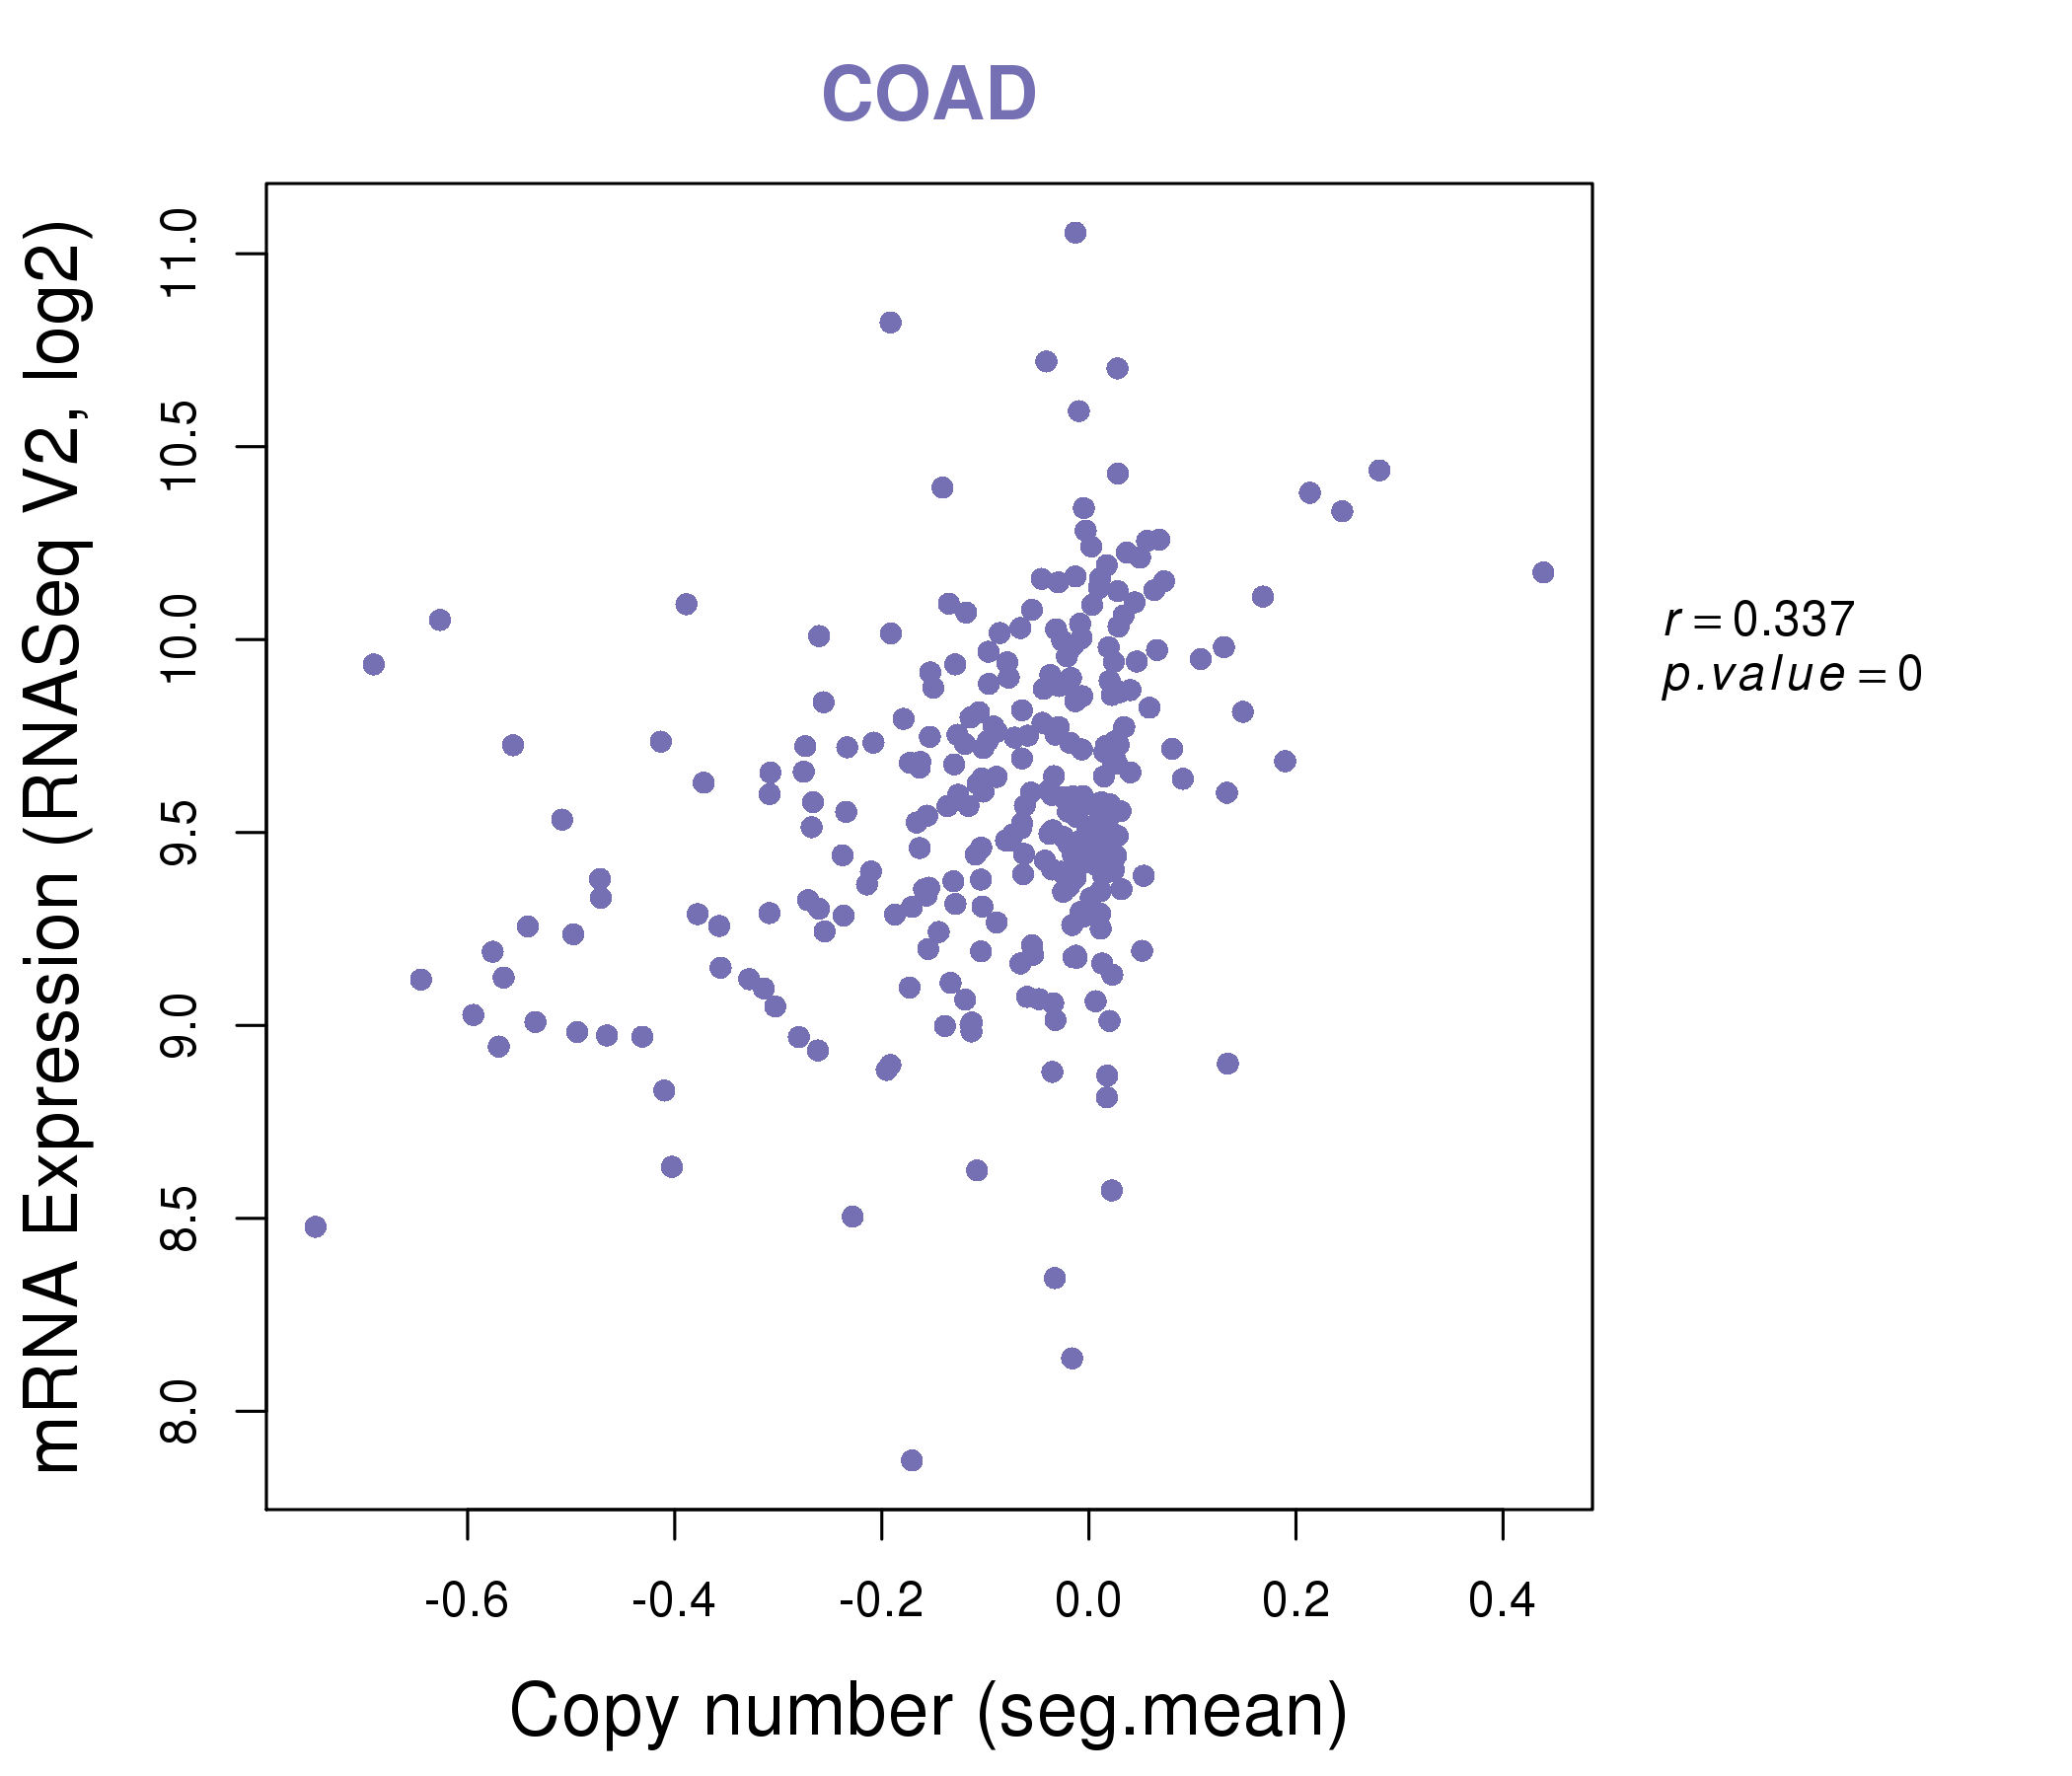
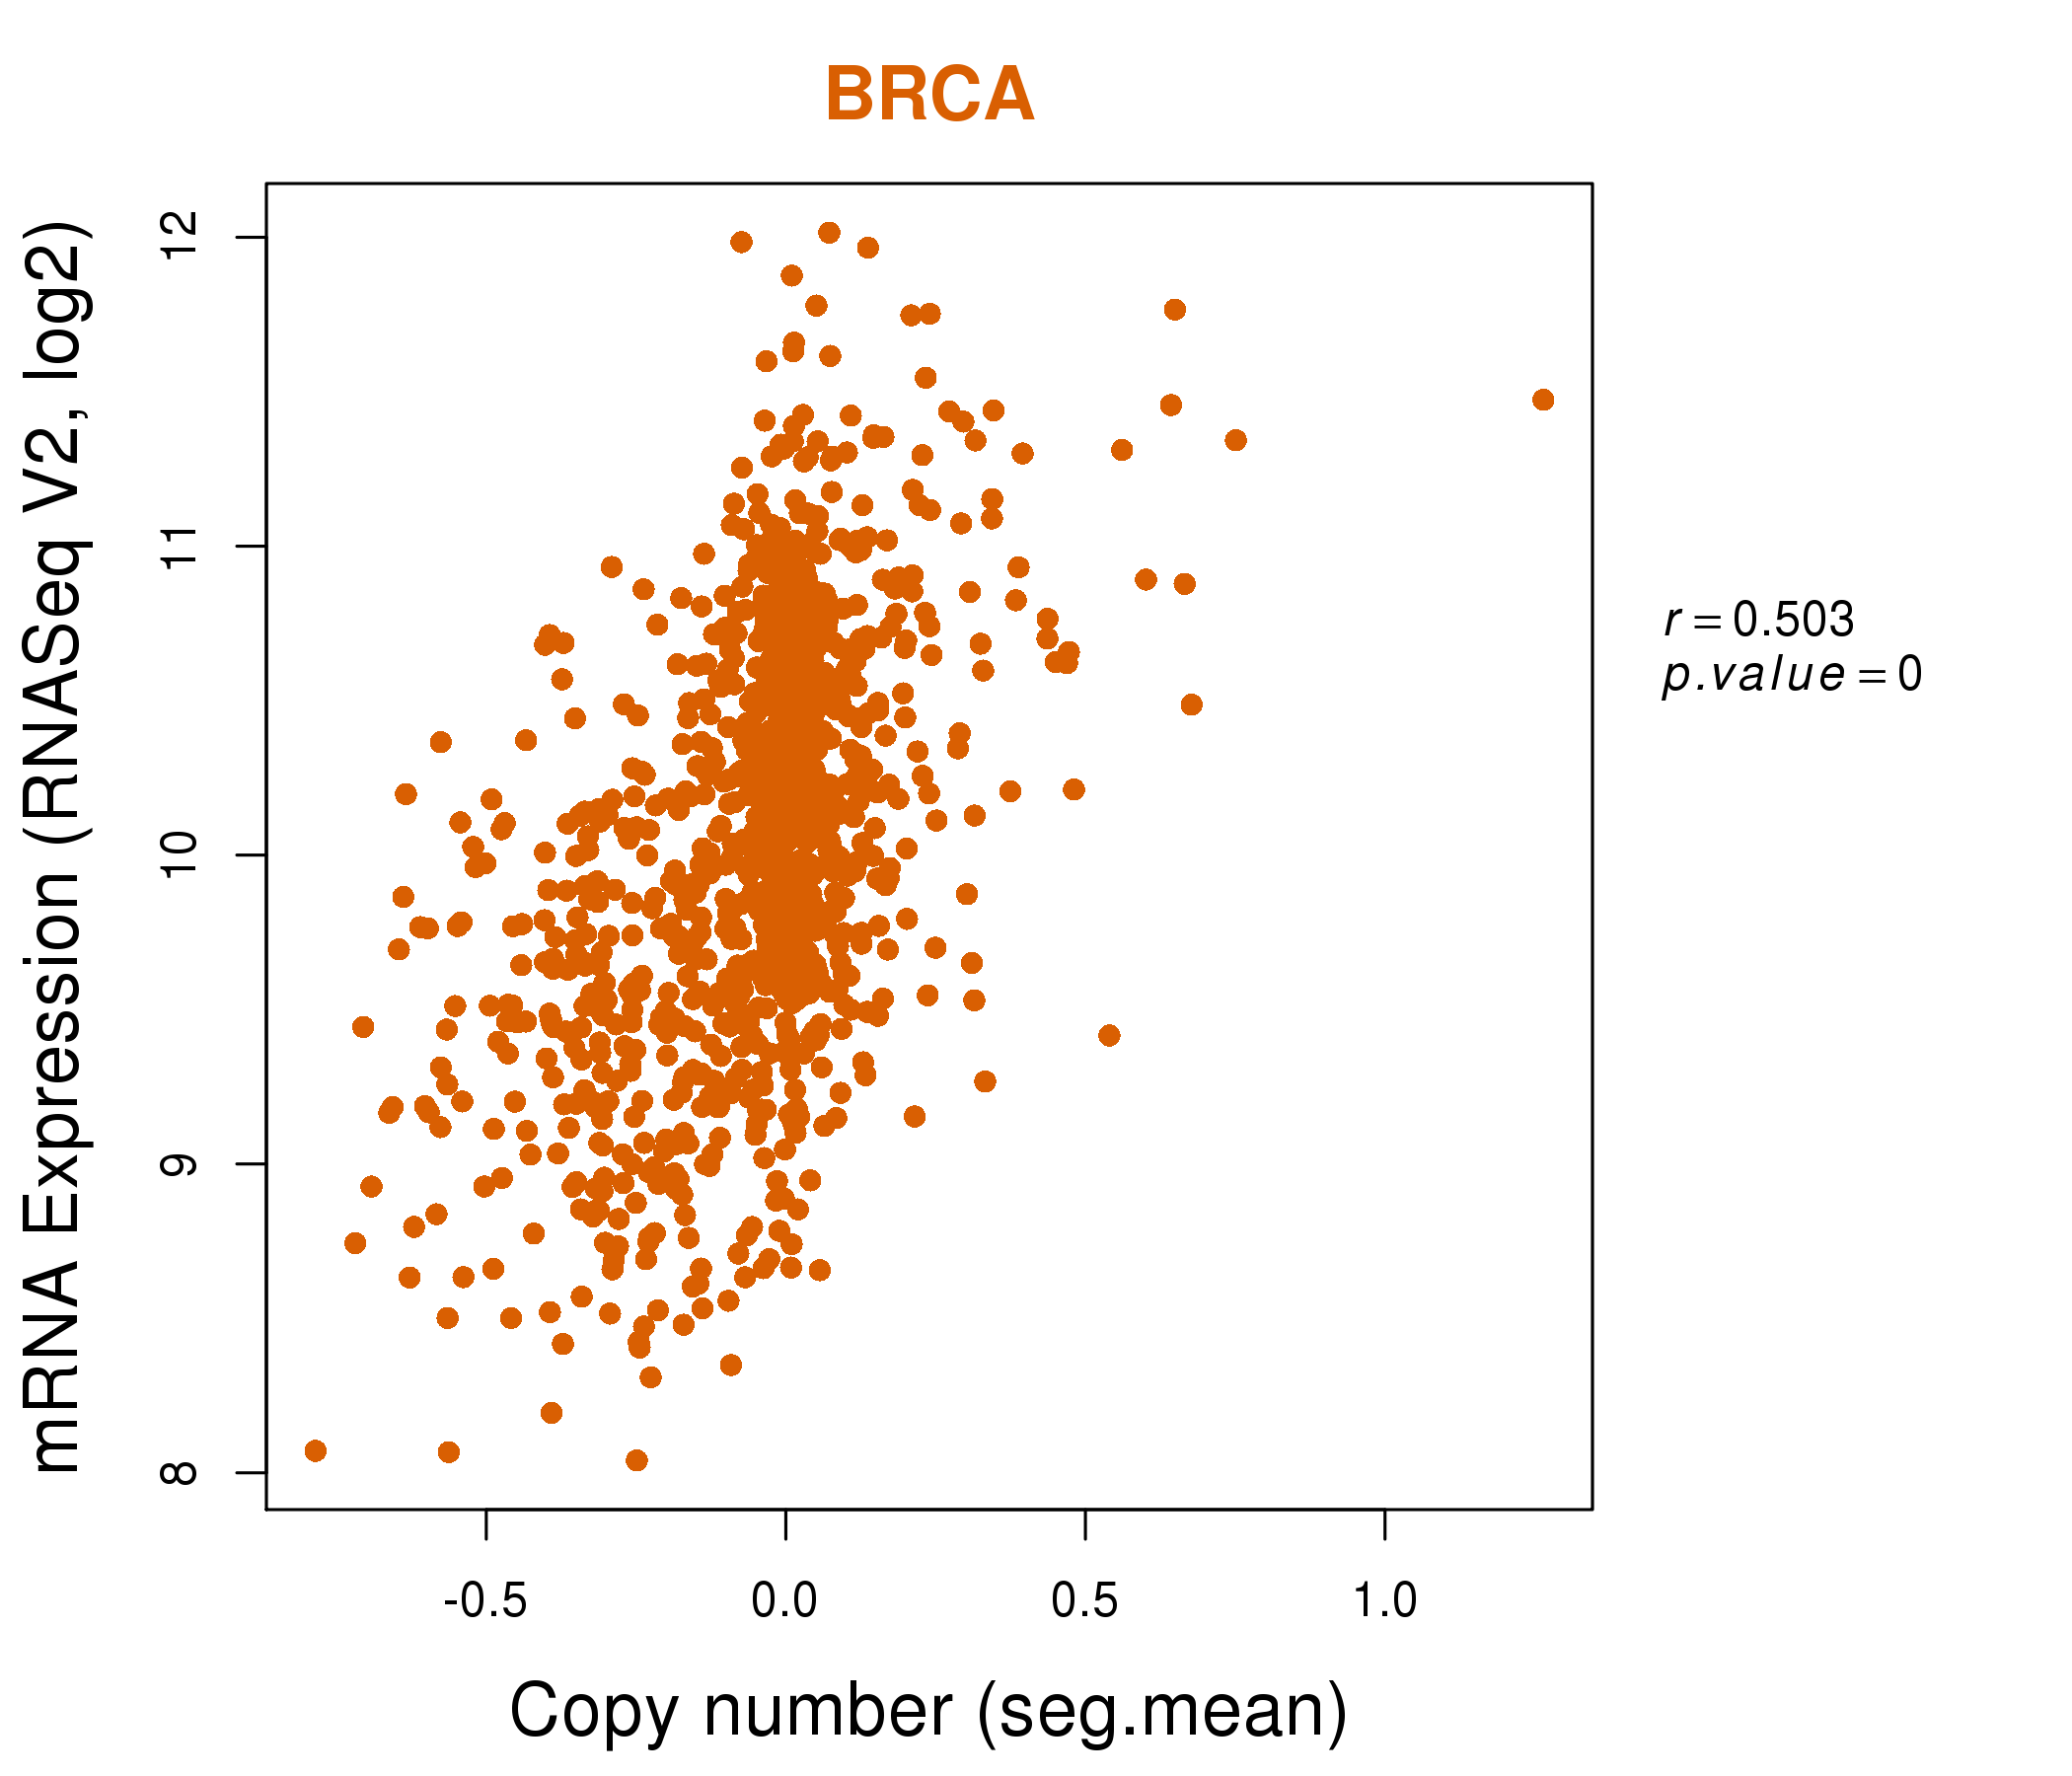
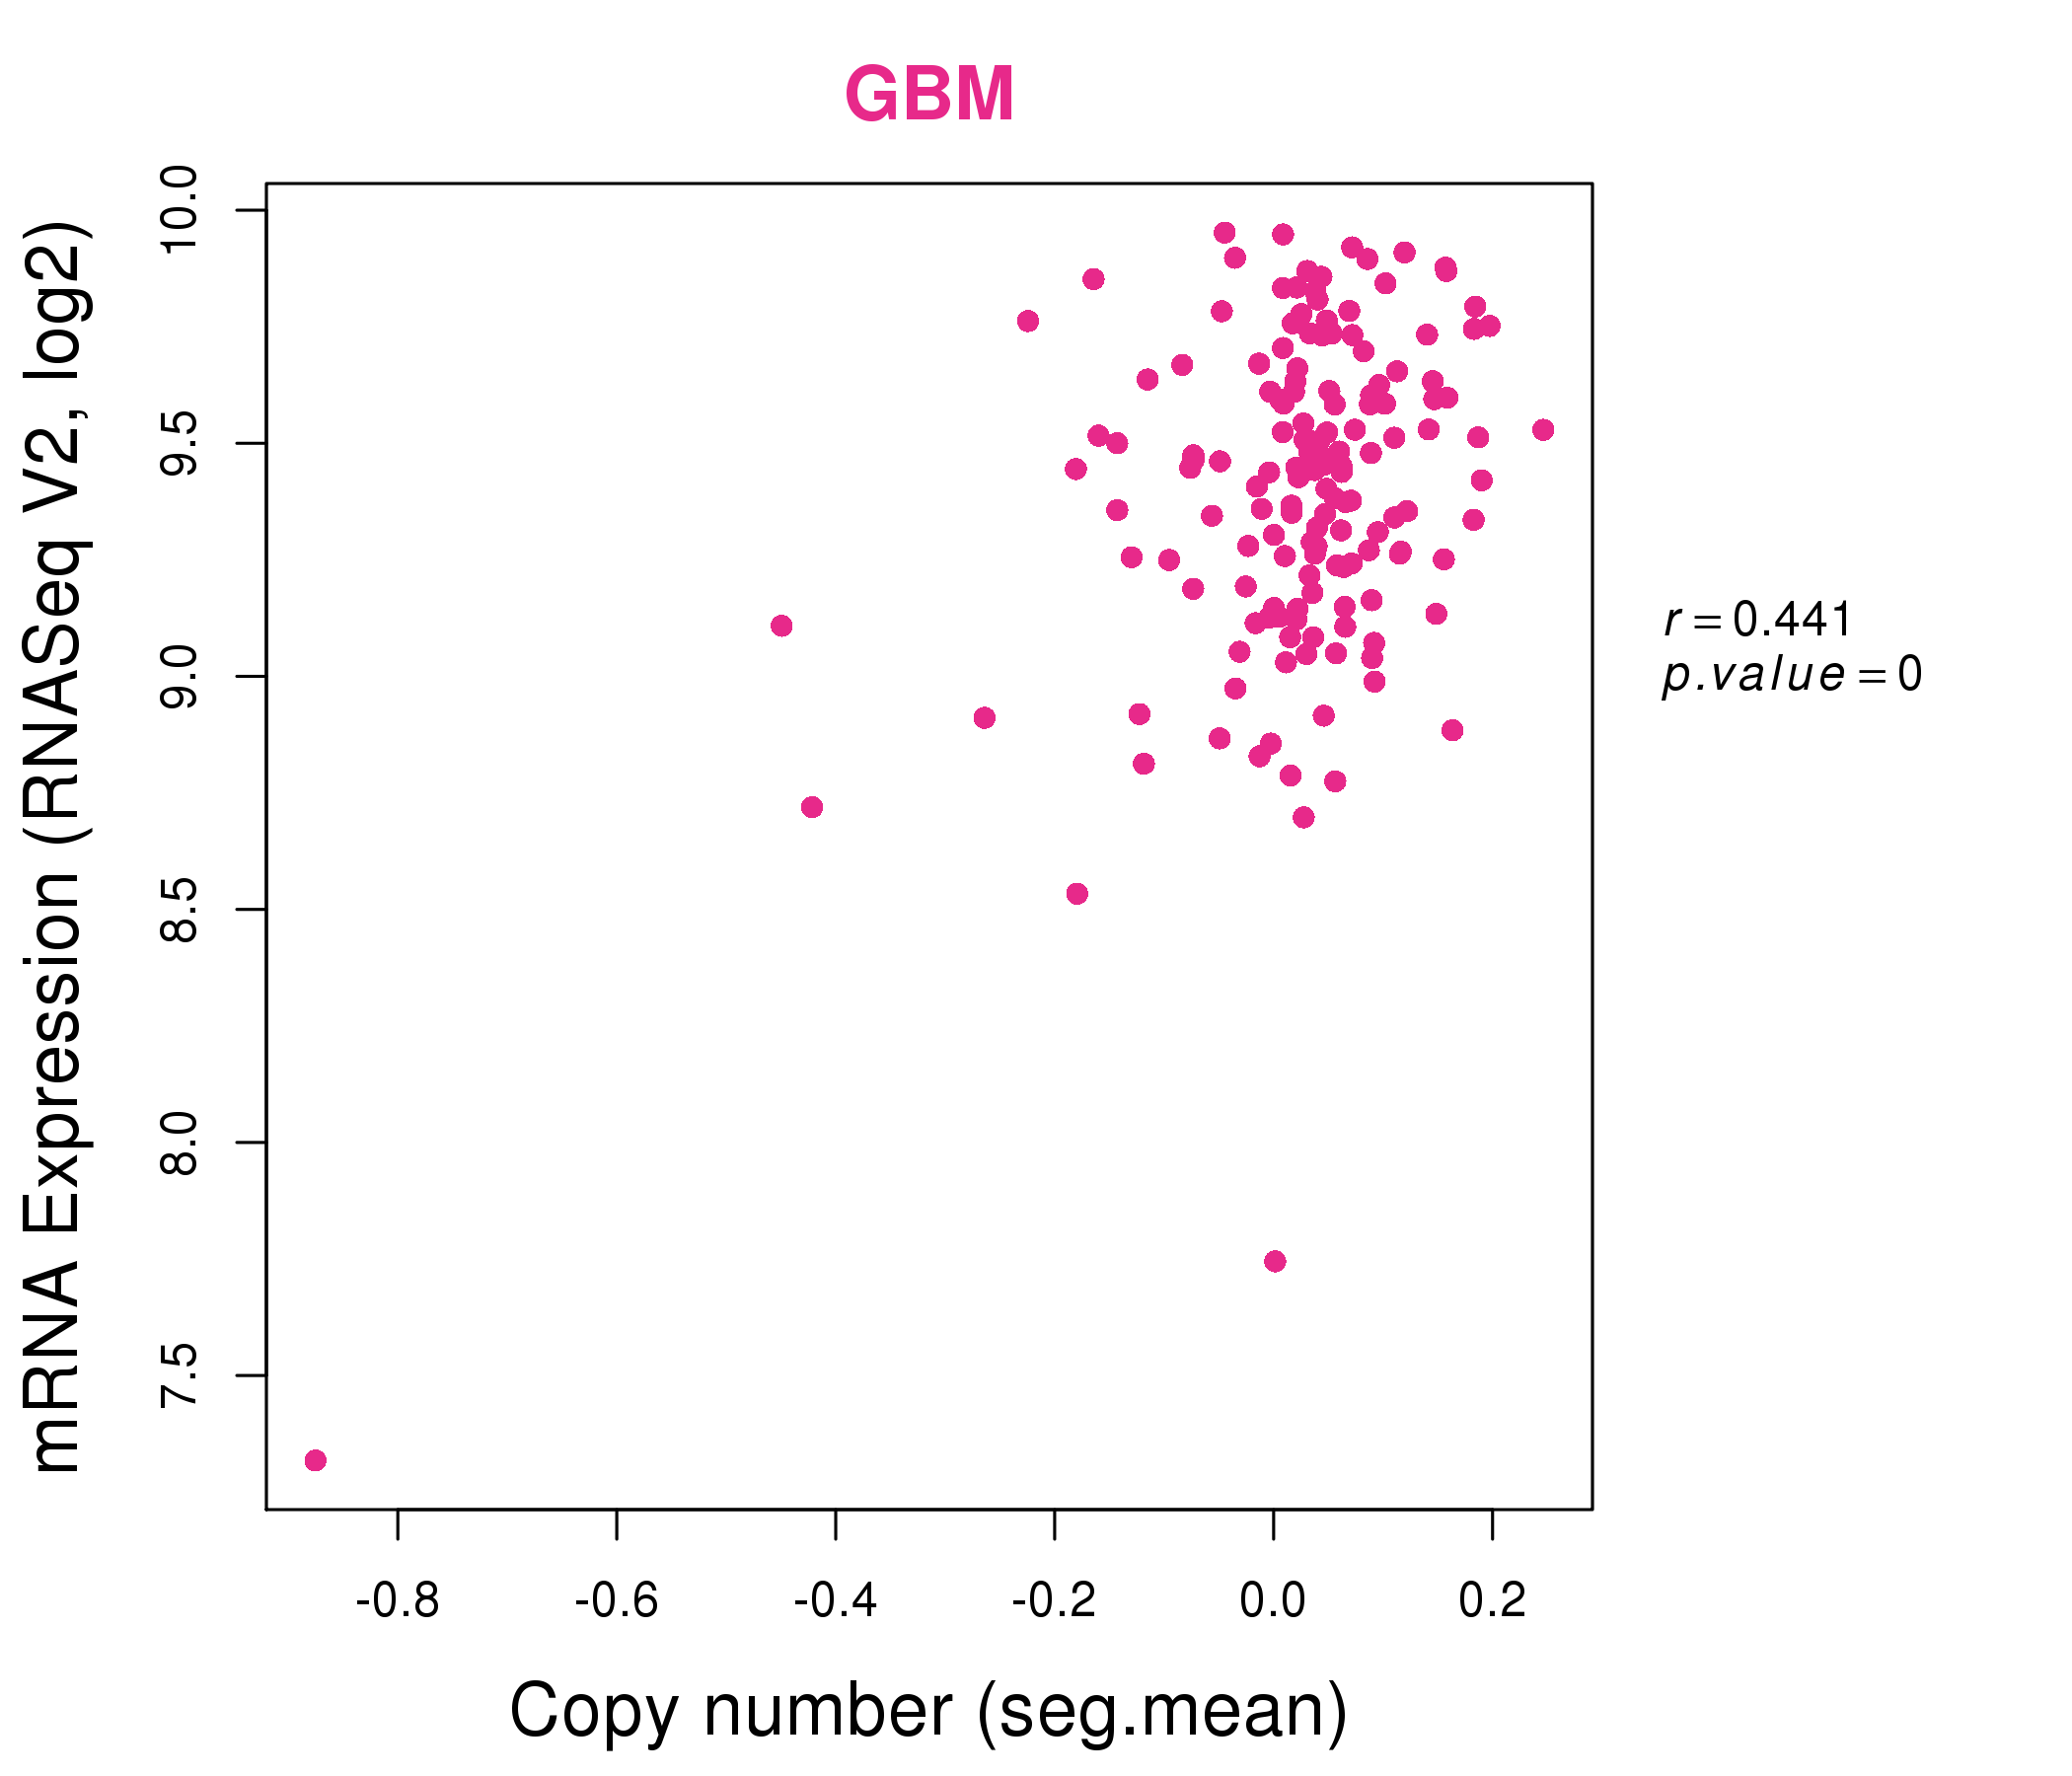
| * Normalized gene expression data of RNASeqV2 was extracted from TCGA using R package TCGA-Assembler. The URLs of all public data files on TCGA DCC data server were gathered at Jan-05-2015. Only eight cancer types have enough normal control samples for differential expression analysis. (t test, adjusted p<0.05 (using Benjamini-Hochberg FDR)) |
 |
| Top |
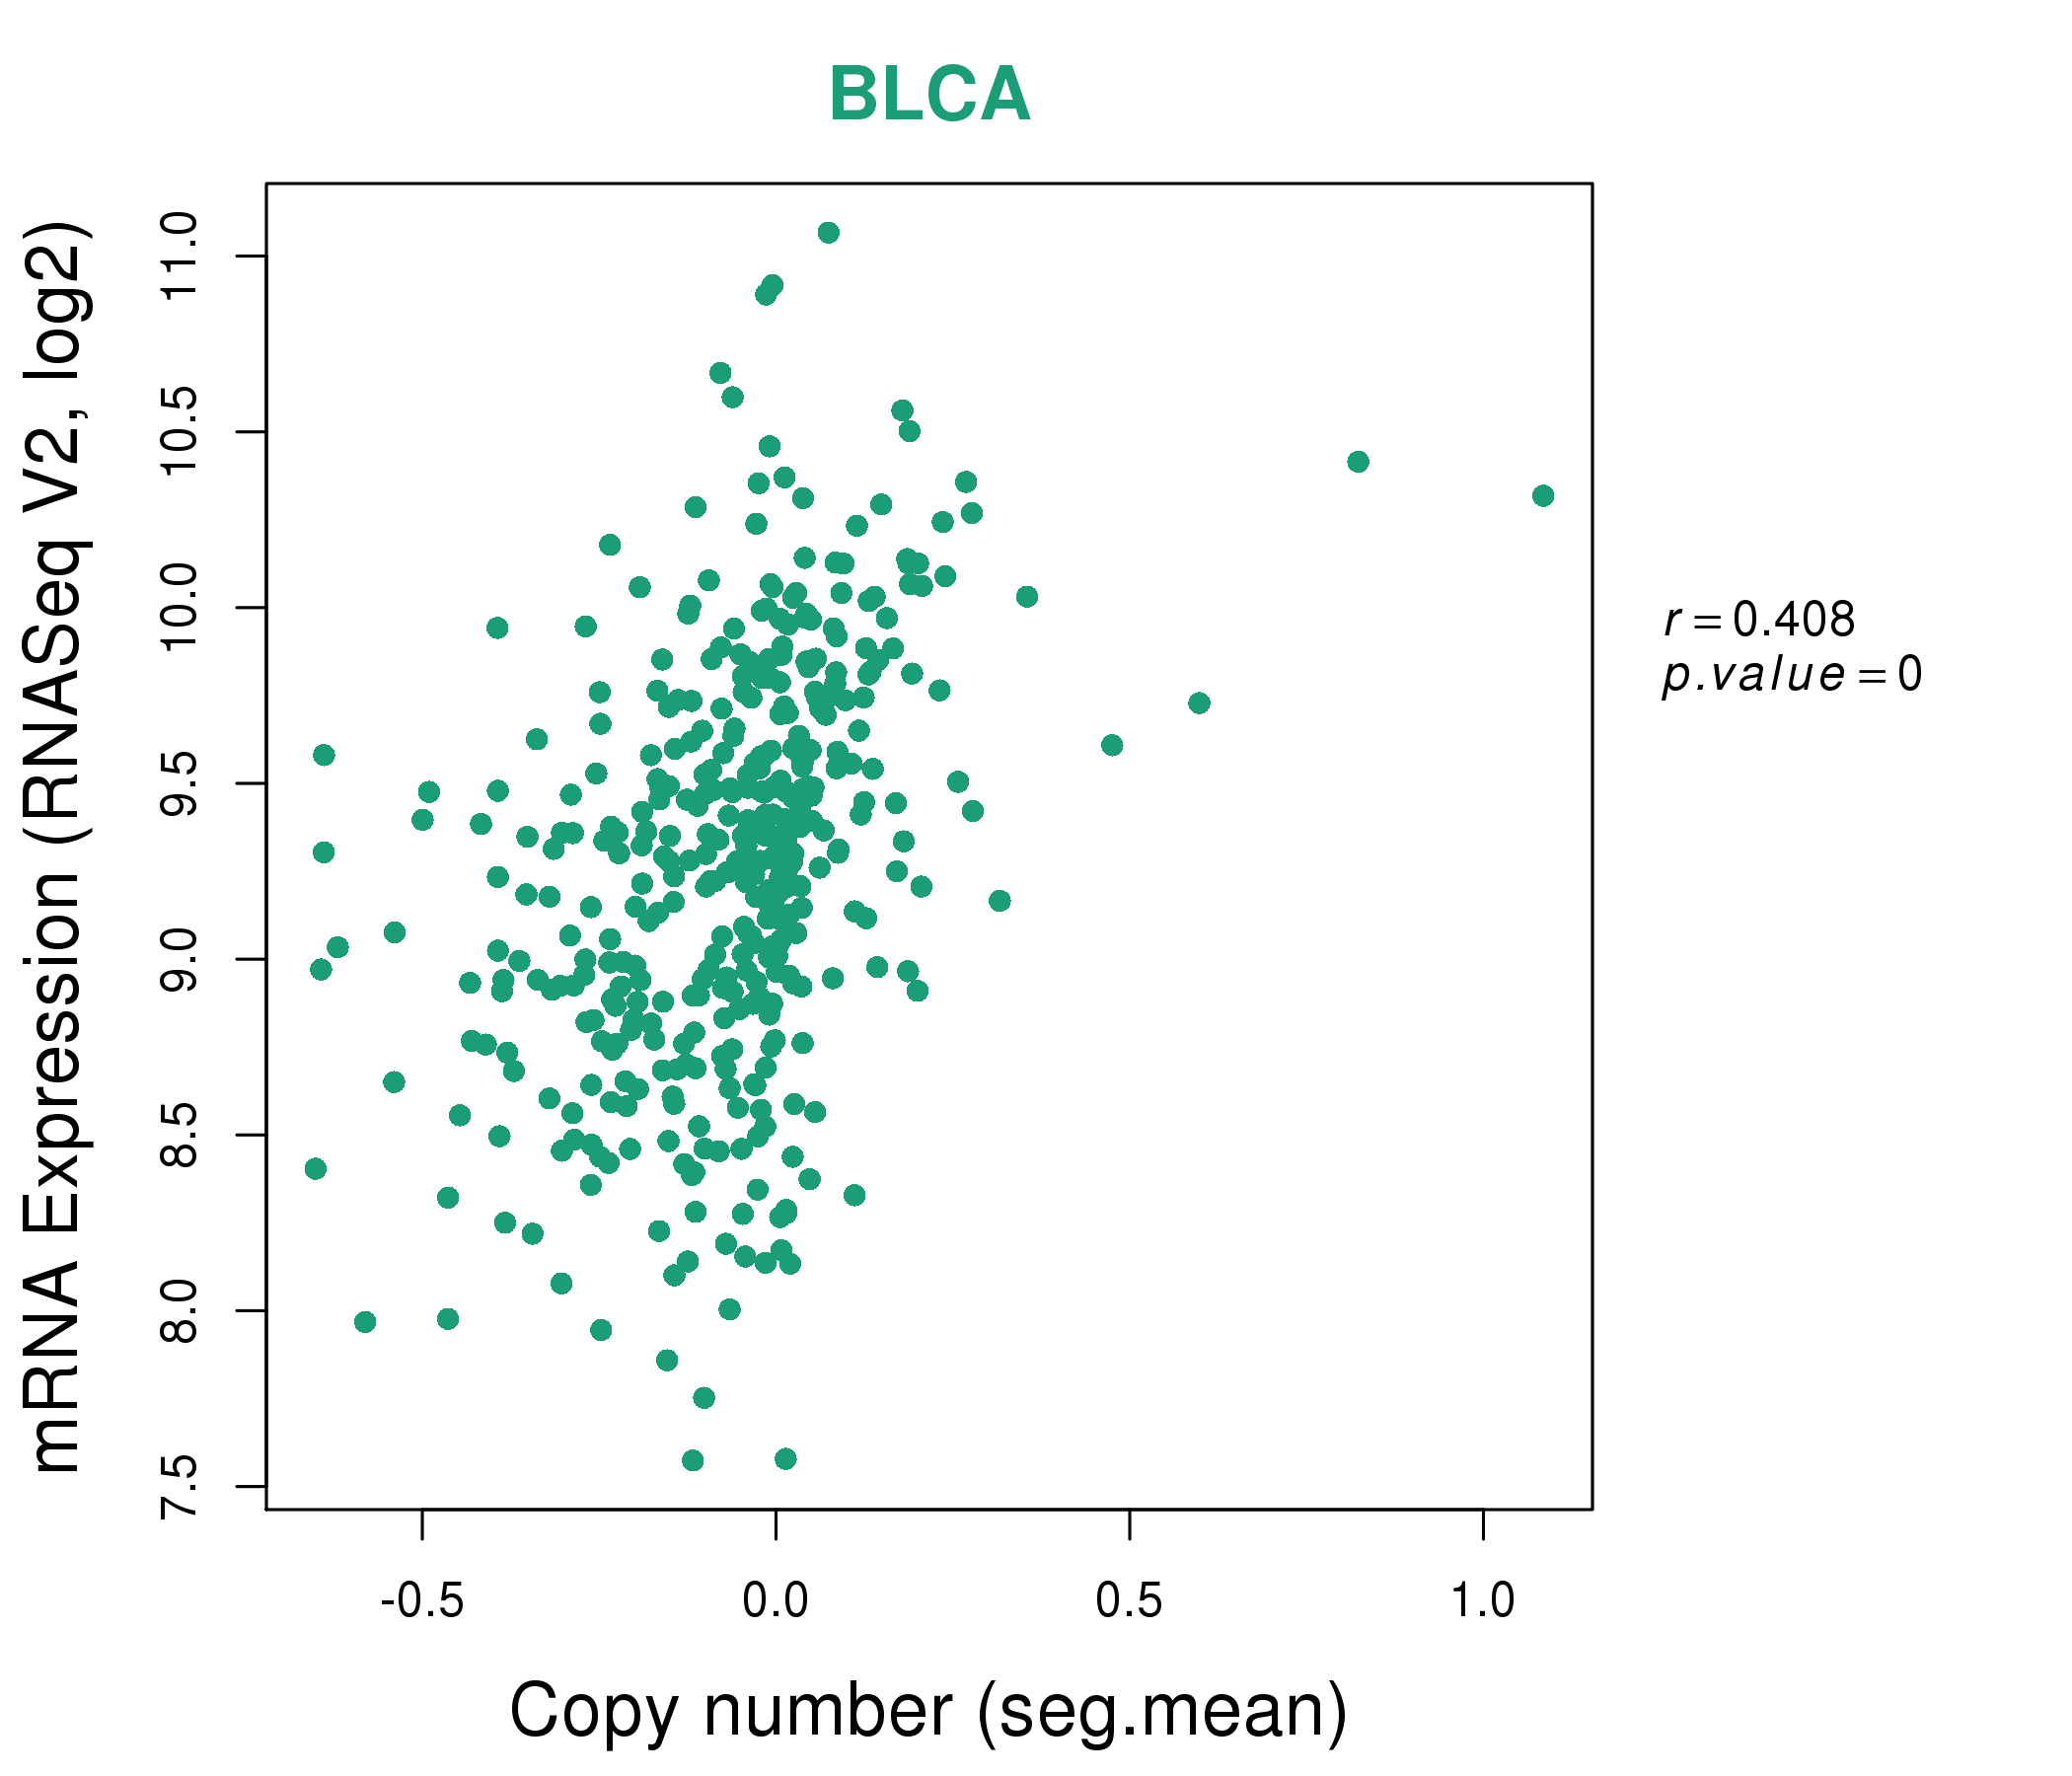
| * This plots show the correlation between CNV and gene expression. |
: Open all plots for all cancer types
 |
|
 |
|
| Top |
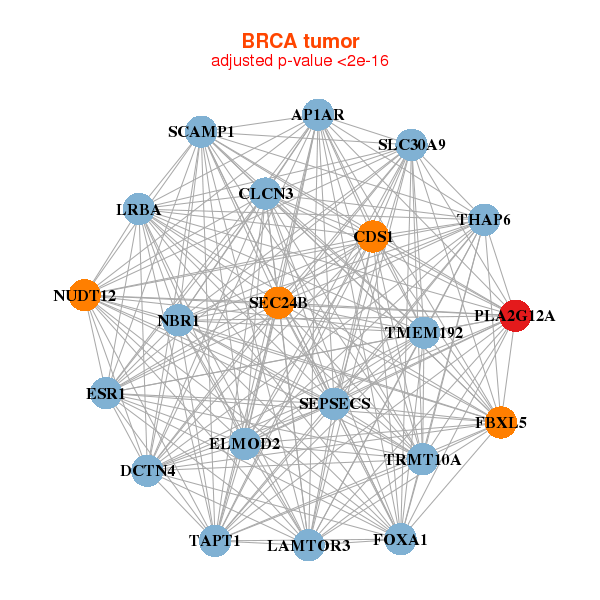
| Gene-Gene Network Information |
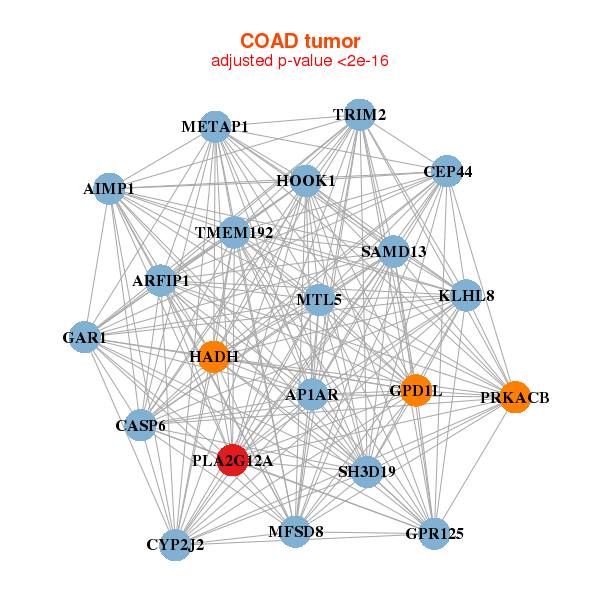
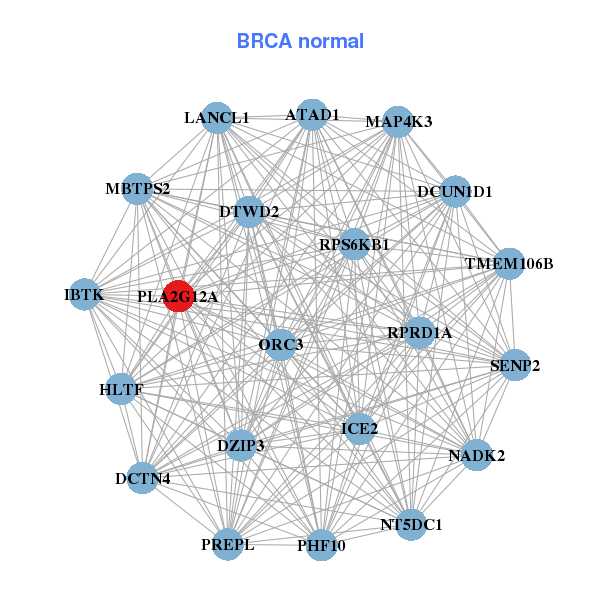
| * Co-Expression network figures were drawn using R package igraph. Only the top 20 genes with the highest correlations were shown. Red circle: input gene, orange circle: cell metabolism gene, sky circle: other gene |
: Open all plots for all cancer types
 |
|
| AP1AR,CDS1,CLCN3,DCTN4,ELMOD2,ESR1,FBXL5, FOXA1,LRBA,LAMTOR3,NBR1,NUDT12,PLA2G12A,TRMT10A, SCAMP1,SEC24B,SEPSECS,SLC30A9,TAPT1,THAP6,TMEM192 | ATAD1,NADK2,DCTN4,DCUN1D1,DTWD2,DZIP3,HLTF, IBTK,LANCL1,MAP4K3,MBTPS2,ICE2,NT5DC1,ORC3, PHF10,PLA2G12A,PREPL,RPRD1A,RPS6KB1,SENP2,TMEM106B |
 |
|
| AIMP1,AP1AR,ARFIP1,CASP6,CYP2J2,GAR1,GPD1L, GPR125,HADH,HOOK1,CEP44,KLHL8,METAP1,MFSD8, MTL5,PLA2G12A,PRKACB,SAMD13,SH3D19,TMEM192,TRIM2 | ABHD14B,ADD3,ANXA13,APPL1,CACNA2D4,CCNG1,CDC14B, CPNE3,CTPS2,DACH1,FAHD2A,KIF12,LETMD1,LOC202781, MAOA,NUDT13,PGAP2,PLA2G12A,SLC16A10,UGT2A3,ZNF33B |
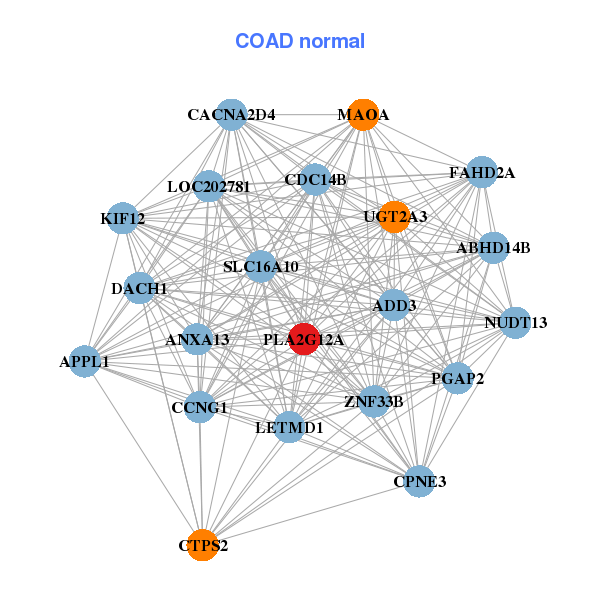
| * Co-Expression network figures were drawn using R package igraph. Only the top 20 genes with the highest correlations were shown. Red circle: input gene, orange circle: cell metabolism gene, sky circle: other gene |
: Open all plots for all cancer types
| Top |
: Open all interacting genes' information including KEGG pathway for all interacting genes from DAVID
| Top |
| Pharmacological Information for PLA2G12A |
| There's no related Drug. |
| Top |
| Cross referenced IDs for PLA2G12A |
| * We obtained these cross-references from Uniprot database. It covers 150 different DBs, 18 categories. http://www.uniprot.org/help/cross_references_section |
: Open all cross reference information
|
Copyright © 2016-Present - The Univsersity of Texas Health Science Center at Houston @ |