|
||||||||||||||||||||||||||||||||||||||||||||||||||||||||||||||||||||||||||||||||||||||||||||||||||||||||||||||||||||||||||||||||||||||||||||||||||||||||||||||||||||||||||||||||||||||||||||||||||||||||||||||||||||||||||||||||||||||||||||||||||||||||||||||||||||||||||||||||||||||||||||||||||||||||||||||||||||||||||
| |
| Phenotypic Information (metabolism pathway, cancer, disease, phenome) |
| |
| |
| Gene-Gene Network Information: Co-Expression Network, Interacting Genes & KEGG |
| |
|


| Gene Summary for NCOA3 |
| Basic gene info. | Gene symbol | NCOA3 |
| Gene name | nuclear receptor coactivator 3 | |
| Synonyms | ACTR|AIB-1|AIB1|CAGH16|CTG26|KAT13B|RAC3|SRC-3|SRC3|TNRC14|TNRC16|TRAM-1|bHLHe42|pCIP | |
| Cytomap | UCSC genome browser: 20q12 | |
| Genomic location | chr20 :46130600-46285621 | |
| Type of gene | protein-coding | |
| RefGenes | NM_001174087.1, NM_001174088.1,NM_006534.3,NM_181659.2, | |
| Ensembl id | ENSG00000124151 | |
| Description | CBP-interacting proteinamplified in breast cancer 1 proteinclass E basic helix-loop-helix protein 42receptor-associated coactivator 3steroid receptor coactivator protein 3thyroid hormone receptor activator molecule 1 | |
| Modification date | 20141207 | |
| dbXrefs | MIM : 601937 | |
| HGNC : HGNC | ||
| Ensembl : ENSG00000124151 | ||
| HPRD : 03570 | ||
| Vega : OTTHUMG00000033061 | ||
| Protein | UniProt: Q9Y6Q9 go to UniProt's Cross Reference DB Table | |
| Expression | CleanEX: HS_NCOA3 | |
| BioGPS: 8202 | ||
| Gene Expression Atlas: ENSG00000124151 | ||
| The Human Protein Atlas: ENSG00000124151 | ||
| Pathway | NCI Pathway Interaction Database: NCOA3 | |
| KEGG: NCOA3 | ||
| REACTOME: NCOA3 | ||
| ConsensusPathDB | ||
| Pathway Commons: NCOA3 | ||
| Metabolism | MetaCyc: NCOA3 | |
| HUMANCyc: NCOA3 | ||
| Regulation | Ensembl's Regulation: ENSG00000124151 | |
| miRBase: chr20 :46,130,600-46,285,621 | ||
| TargetScan: NM_001174087 | ||
| cisRED: ENSG00000124151 | ||
| Context | iHOP: NCOA3 | |
| cancer metabolism search in PubMed: NCOA3 | ||
| UCL Cancer Institute: NCOA3 | ||
| Assigned class in ccmGDB | A - This gene has a literature evidence and it belongs to cancer gene. | |
| References showing role of NCOA3 in cancer cell metabolism | 1. Wagner M, Koslowski M, Paret C, Schmidt M, Türeci Ö, et al. (2013) NCOA3 is a selective co-activator of estrogen receptor α-mediated transactivation of PLAC1 in MCF-7 breast cancer cells. BMC cancer 13: 570. go to article | |
| Top |
| Phenotypic Information for NCOA3(metabolism pathway, cancer, disease, phenome) |
| Cancer | CGAP: NCOA3 |
| Familial Cancer Database: NCOA3 | |
| * This gene is included in those cancer gene databases. |
|
|
|
|
|
| . | ||||||||||||||||||||||||||||||||||||||||||||||||||||||||||||||||||||||||||||||||||||||||||||||||||||||||||||||||||||||||||||||||||||||||||||||||||||||||||||||||||||||||||||||||||||||||||||||||||||||||||||||||||||||||||||||||||||||||||||||||||||||||||||||||||||||||||||||||||||||||||||||||||||||||||||||||||||
Oncogene 1 | Significant driver gene in | |||||||||||||||||||||||||||||||||||||||||||||||||||||||||||||||||||||||||||||||||||||||||||||||||||||||||||||||||||||||||||||||||||||||||||||||||||||||||||||||||||||||||||||||||||||||||||||||||||||||||||||||||||||||||||||||||||||||||||||||||||||||||||||||||||||||||||||||||||||||||||||||||||||||||||||||||||||||||
| cf) number; DB name 1 Oncogene; http://nar.oxfordjournals.org/content/35/suppl_1/D721.long, 2 Tumor Suppressor gene; https://bioinfo.uth.edu/TSGene/, 3 Cancer Gene Census; http://www.nature.com/nrc/journal/v4/n3/abs/nrc1299.html, 4 CancerGenes; http://nar.oxfordjournals.org/content/35/suppl_1/D721.long, 5 Network of Cancer Gene; http://ncg.kcl.ac.uk/index.php, 1Therapeutic Vulnerabilities in Cancer; http://cbio.mskcc.org/cancergenomics/statius/ |
| REACTOME_METABOLISM_OF_LIPIDS_AND_LIPOPROTEINS | |
| OMIM | 601937; gene. 601937; gene. |
| Orphanet | |
| Disease | KEGG Disease: NCOA3 |
| MedGen: NCOA3 (Human Medical Genetics with Condition) | |
| ClinVar: NCOA3 | |
| Phenotype | MGI: NCOA3 (International Mouse Phenotyping Consortium) |
| PhenomicDB: NCOA3 | |
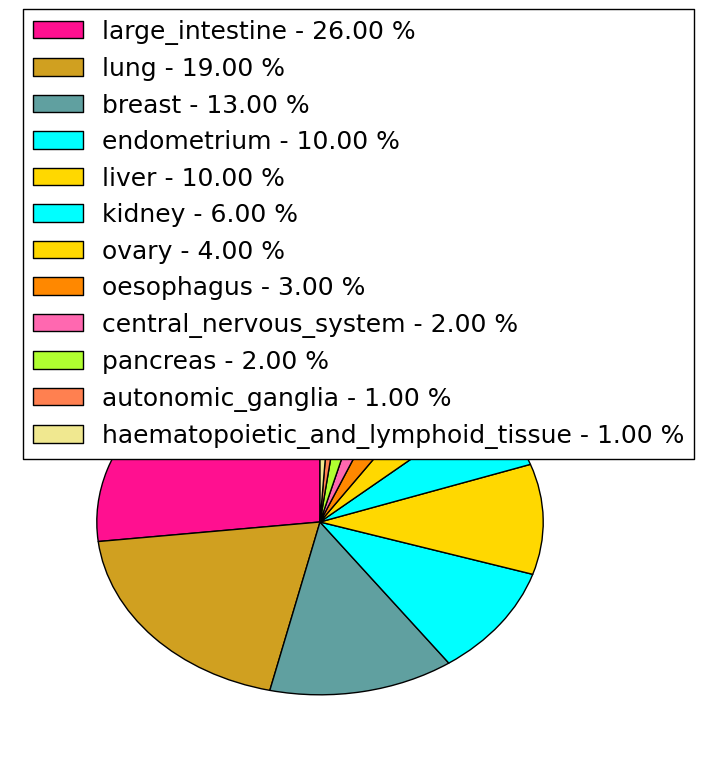
| Mutations for NCOA3 |
| * Under tables are showing count per each tissue to give us broad intuition about tissue specific mutation patterns.You can go to the detailed page for each mutation database's web site. |
| - Statistics for Tissue and Mutation type | Top |
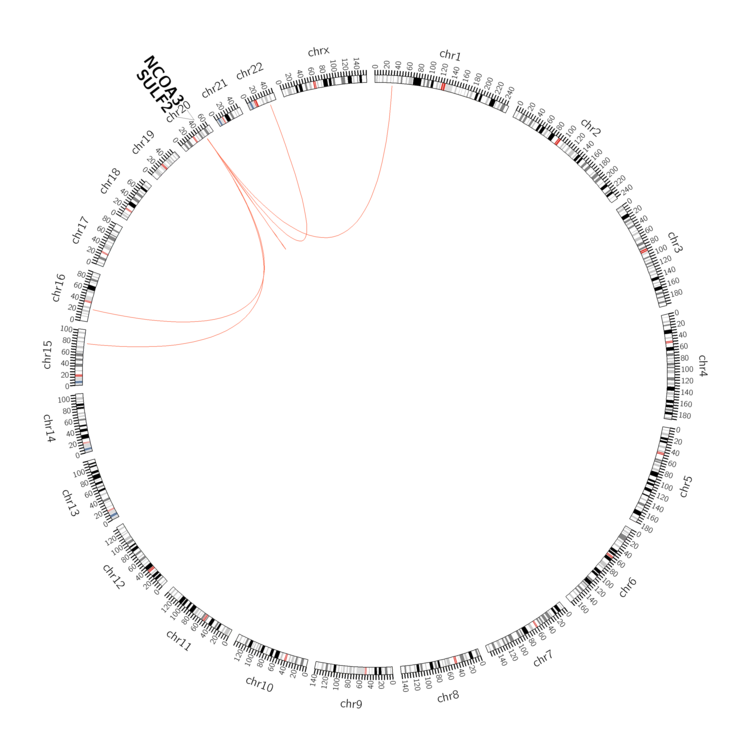 |
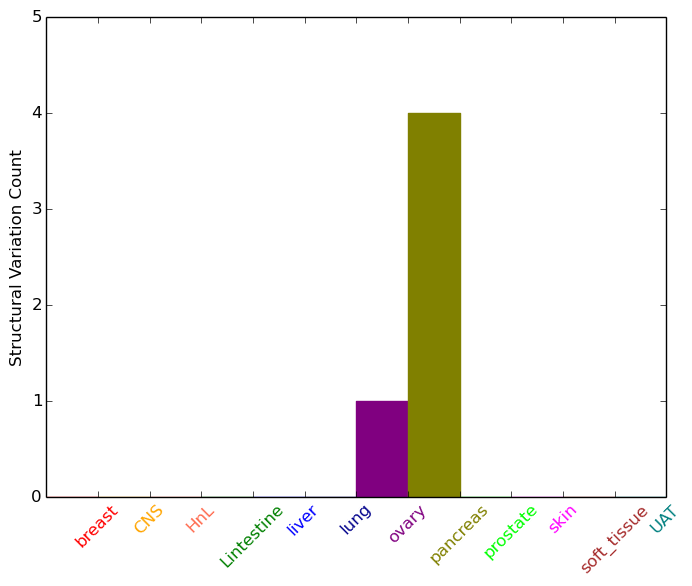
| - For Inter-chromosomal Variations |
| * Inter-chromosomal variantions includes 'interchromosomal amplicon to amplicon', 'interchromosomal amplicon to non-amplified dna', 'interchromosomal insertion', 'Interchromosomal unknown type'. |
 |
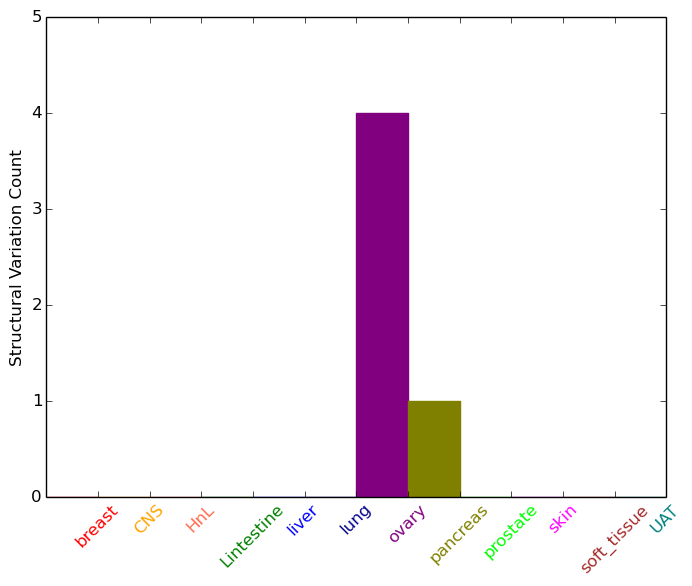
| - For Intra-chromosomal Variations |
| * Intra-chromosomal variantions includes 'intrachromosomal amplicon to amplicon', 'intrachromosomal amplicon to non-amplified dna', 'intrachromosomal deletion', 'intrachromosomal fold-back inversion', 'intrachromosomal inversion', 'intrachromosomal tandem duplication', 'Intrachromosomal unknown type', 'intrachromosomal with inverted orientation', 'intrachromosomal with non-inverted orientation'. |
 |
| Sample | Symbol_a | Chr_a | Start_a | End_a | Symbol_b | Chr_b | Start_b | End_b |
| ovary | NCOA3 | chr20 | 46158748 | 46158768 | chr22 | 38294210 | 38294230 | |
| ovary | NCOA3 | chr20 | 46206475 | 46206495 | NCOA3 | chr20 | 46200684 | 46200704 |
| ovary | NCOA3 | chr20 | 46251918 | 46251938 | NCOA3 | chr20 | 46197824 | 46197844 |
| ovary | NCOA3 | chr20 | 46261851 | 46261871 | SULF2 | chr20 | 46340708 | 46340728 |
| ovary | NCOA3 | chr20 | 46261852 | 46261872 | SULF2 | chr20 | 46340708 | 46340728 |
| pancreas | NCOA3 | chr20 | 46138721 | 46138741 | chr20 | 46078459 | 46078479 | |
| pancreas | NCOA3 | chr20 | 46213968 | 46213988 | chr15 | 77208146 | 77208166 |
| cf) Tissue number; Tissue name (1;Breast, 2;Central_nervous_system, 3;Haematopoietic_and_lymphoid_tissue, 4;Large_intestine, 5;Liver, 6;Lung, 7;Ovary, 8;Pancreas, 9;Prostate, 10;Skin, 11;Soft_tissue, 12;Upper_aerodigestive_tract) |
| * From mRNA Sanger sequences, Chitars2.0 arranged chimeric transcripts. This table shows NCOA3 related fusion information. |
| ID | Head Gene | Tail Gene | Accession | Gene_a | qStart_a | qEnd_a | Chromosome_a | tStart_a | tEnd_a | Gene_a | qStart_a | qEnd_a | Chromosome_a | tStart_a | tEnd_a |
| DA523336 | NCOA3 | 1 | 109 | 20 | 46130657 | 46130765 | SLAIN1 | 106 | 549 | 13 | 78293665 | 78318569 | |
| DB144841 | NCOA3 | 1 | 107 | 20 | 46130657 | 46130763 | TXNDC5 | 106 | 547 | 6 | 7899876 | 8002806 | |
| BQ009202 | C4orf48 | 18 | 285 | 4 | 2044137 | 2045691 | NCOA3 | 283 | 698 | 20 | 46275876 | 46279816 | |
| BF839348 | ANTXR1 | 9 | 234 | 2 | 69350198 | 69397409 | NCOA3 | 229 | 372 | 20 | 46219171 | 46219314 | |
| BP292769 | STAT5B | 1 | 496 | 17 | 40359571 | 40362610 | NCOA3 | 493 | 552 | 20 | 46269913 | 46269972 | |
| DA853259 | NCOA3 | 4 | 139 | 20 | 46130628 | 46130763 | ZMYND8 | 138 | 570 | 20 | 45920609 | 45938950 | |
| F12469 | NCOA3 | 1 | 114 | 20 | 46132899 | 46133012 | CD36 | 112 | 152 | 7 | 80125707 | 80125747 | |
| BE832543 | XPO6 | 1 | 112 | 16 | 28157506 | 28164073 | NCOA3 | 112 | 188 | 20 | 46265422 | 46265498 | |
| AI571643 | SPINK1 | 1 | 233 | 5 | 147204146 | 147207693 | NCOA3 | 225 | 406 | 20 | 46232662 | 46232843 | |
| Top |
| Mutation type/ Tissue ID | brca | cns | cerv | endome | haematopo | kidn | Lintest | liver | lung | ns | ovary | pancre | prost | skin | stoma | thyro | urina | |||
| Total # sample | 4 | 2 | 1 | 4 | 5 | 2 | ||||||||||||||
| GAIN (# sample) | 4 | 2 | 1 | 4 | 5 | 2 | ||||||||||||||
| LOSS (# sample) |
| cf) Tissue ID; Tissue type (1; Breast, 2; Central_nervous_system, 3; Cervix, 4; Endometrium, 5; Haematopoietic_and_lymphoid_tissue, 6; Kidney, 7; Large_intestine, 8; Liver, 9; Lung, 10; NS, 11; Ovary, 12; Pancreas, 13; Prostate, 14; Skin, 15; Stomach, 16; Thyroid, 17; Urinary_tract) |
| Top |
|
 |
| Top |
| Stat. for Non-Synonymous SNVs (# total SNVs=97) | (# total SNVs=62) |
 | 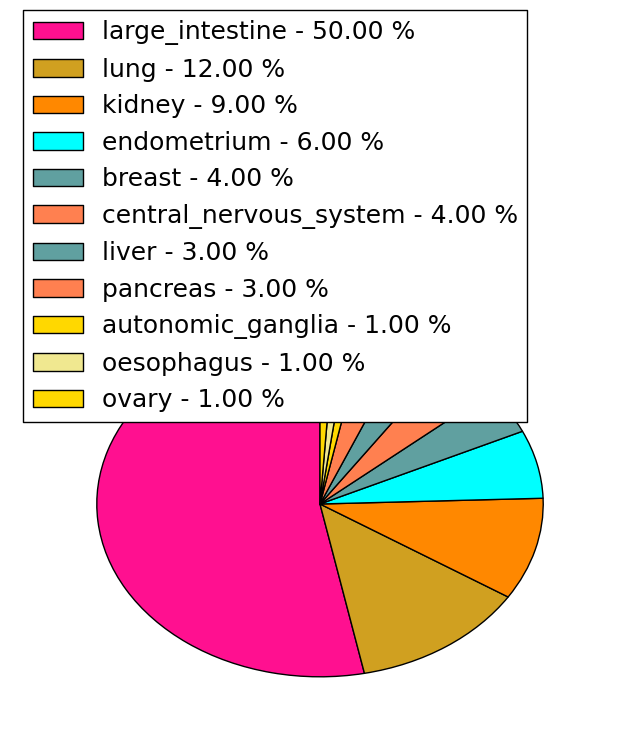 |
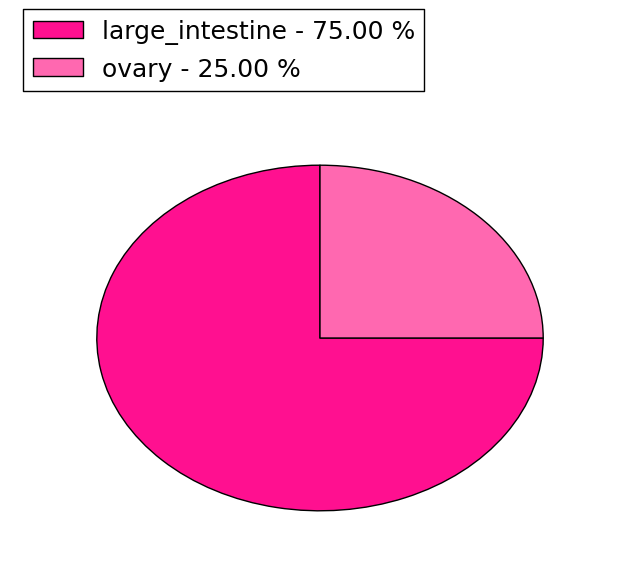
(# total SNVs=26) | (# total SNVs=4) |
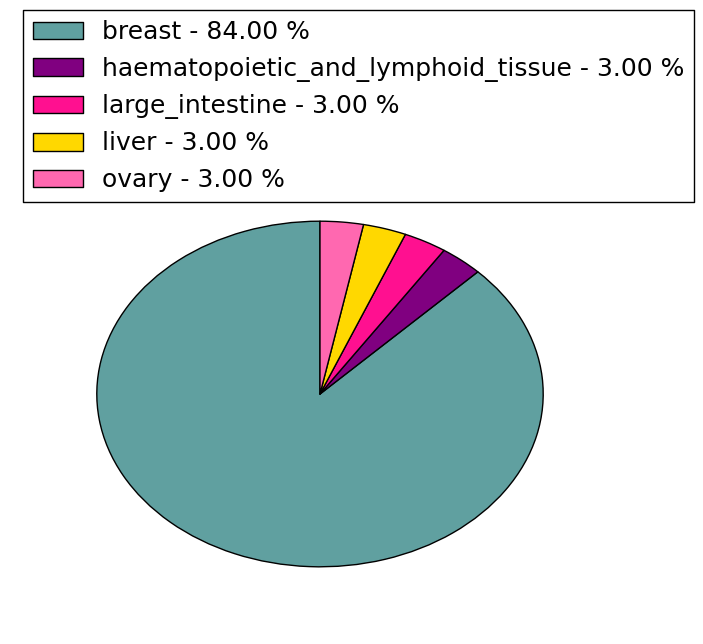 |  |
| Top |
| * When you move the cursor on each content, you can see more deailed mutation information on the Tooltip. Those are primary_site,primary_histology,mutation(aa),pubmedID. |
| GRCh37 position | Mutation(aa) | Unique sampleID count |
| chr20:46279837-46279839 | p.Q1255delQ | 17 |
| chr20:46279860-46279860 | p.Q1262Q | 12 |
| chr20:46279830-46279830 | p.Q1252Q | 6 |
| chr20:46279839-46279839 | p.Q1255Q | 6 |
| chr20:46279827-46279827 | p.Q1251Q | 5 |
| chr20:46279836-46279836 | p.Q1254Q | 5 |
| chr20:46279834-46279836 | p.Q1254delQ | 4 |
| chr20:46264449-46264449 | p.P499L | 4 |
| chr20:46265284-46265284 | p.D718D | 3 |
| chr20:46279866-46279866 | p.Q1264Q | 3 |
| Top |
|
 |
| Point Mutation/ Tissue ID | 1 | 2 | 3 | 4 | 5 | 6 | 7 | 8 | 9 | 10 | 11 | 12 | 13 | 14 | 15 | 16 | 17 | 18 | 19 | 20 |
| # sample | 5 | 8 | 1 | 20 | 2 | 6 | 4 | 1 | 13 | 4 | 4 | 15 | 17 | 1 | 12 | |||||
| # mutation | 5 | 8 | 1 | 21 | 2 | 6 | 4 | 1 | 16 | 4 | 4 | 15 | 18 | 1 | 13 | |||||
| nonsynonymous SNV | 4 | 8 | 1 | 15 | 1 | 4 | 4 | 1 | 11 | 4 | 3 | 12 | 12 | 1 | 10 | |||||
| synonymous SNV | 1 | 6 | 1 | 2 | 5 | 1 | 3 | 6 | 3 |
| cf) Tissue ID; Tissue type (1; BLCA[Bladder Urothelial Carcinoma], 2; BRCA[Breast invasive carcinoma], 3; CESC[Cervical squamous cell carcinoma and endocervical adenocarcinoma], 4; COAD[Colon adenocarcinoma], 5; GBM[Glioblastoma multiforme], 6; Glioma Low Grade, 7; HNSC[Head and Neck squamous cell carcinoma], 8; KICH[Kidney Chromophobe], 9; KIRC[Kidney renal clear cell carcinoma], 10; KIRP[Kidney renal papillary cell carcinoma], 11; LAML[Acute Myeloid Leukemia], 12; LUAD[Lung adenocarcinoma], 13; LUSC[Lung squamous cell carcinoma], 14; OV[Ovarian serous cystadenocarcinoma ], 15; PAAD[Pancreatic adenocarcinoma], 16; PRAD[Prostate adenocarcinoma], 17; SKCM[Skin Cutaneous Melanoma], 18:STAD[Stomach adenocarcinoma], 19:THCA[Thyroid carcinoma], 20:UCEC[Uterine Corpus Endometrial Carcinoma]) |
| Top |
| * We represented just top 10 SNVs. When you move the cursor on each content, you can see more deailed mutation information on the Tooltip. Those are primary_site, primary_histology, mutation(aa), pubmedID. |
| Genomic Position | Mutation(aa) | Unique sampleID count |
| chr20:46264449 | p.Q1261Q,NCOA3 | 3 |
| chr20:46279860 | p.P499H,NCOA3 | 3 |
| chr20:46279984 | p.F1279F,NCOA3 | 2 |
| chr20:46265284 | p.A1303T,NCOA3 | 2 |
| chr20:46264450 | p.P499P,NCOA3 | 2 |
| chr20:46281213 | p.D165N,NCOA3 | 2 |
| chr20:46255881 | p.S1336L,NCOA3 | 2 |
| chr20:46281693 | p.D718D,NCOA3 | 2 |
| chr20:46279914 | p.Q1379Q,NCOA3 | 2 |
| chr20:46265205 | p.H592H,NCOA3 | 1 |
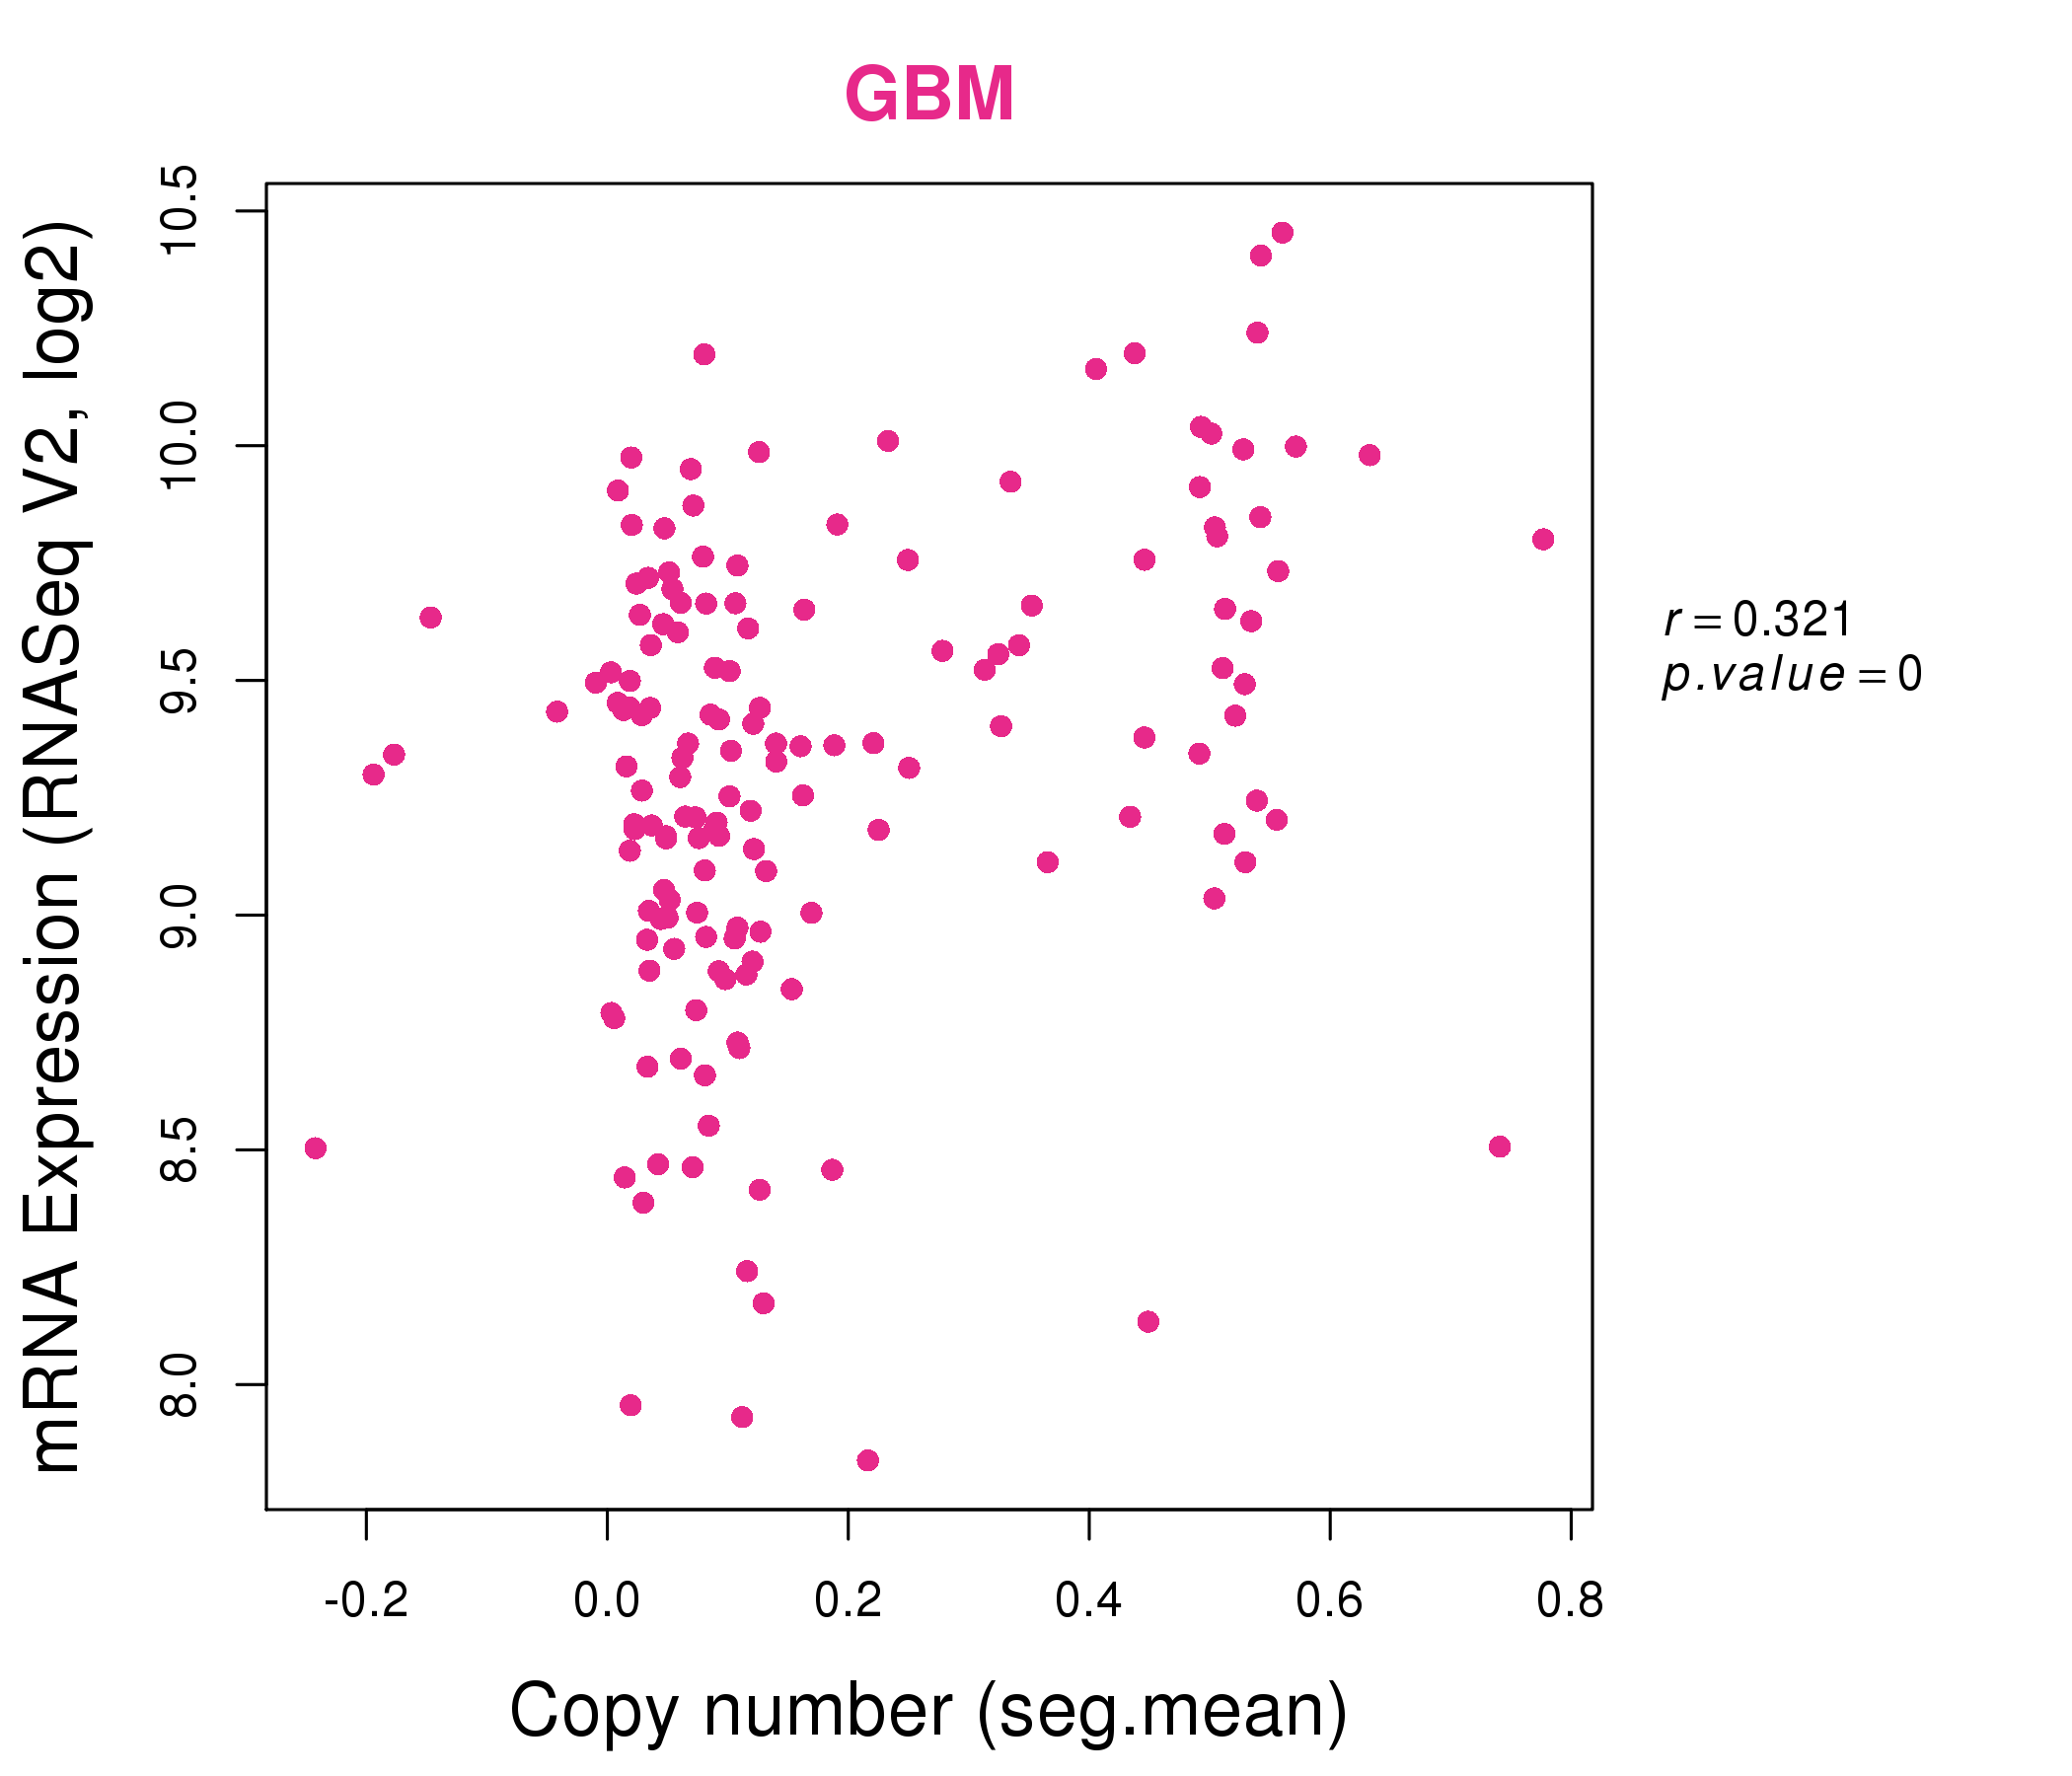
| * Copy number data were extracted from TCGA using R package TCGA-Assembler. The URLs of all public data files on TCGA DCC data server were gathered on Jan-05-2015. Function ProcessCNAData in TCGA-Assembler package was used to obtain gene-level copy number value which is calculated as the average copy number of the genomic region of a gene. |
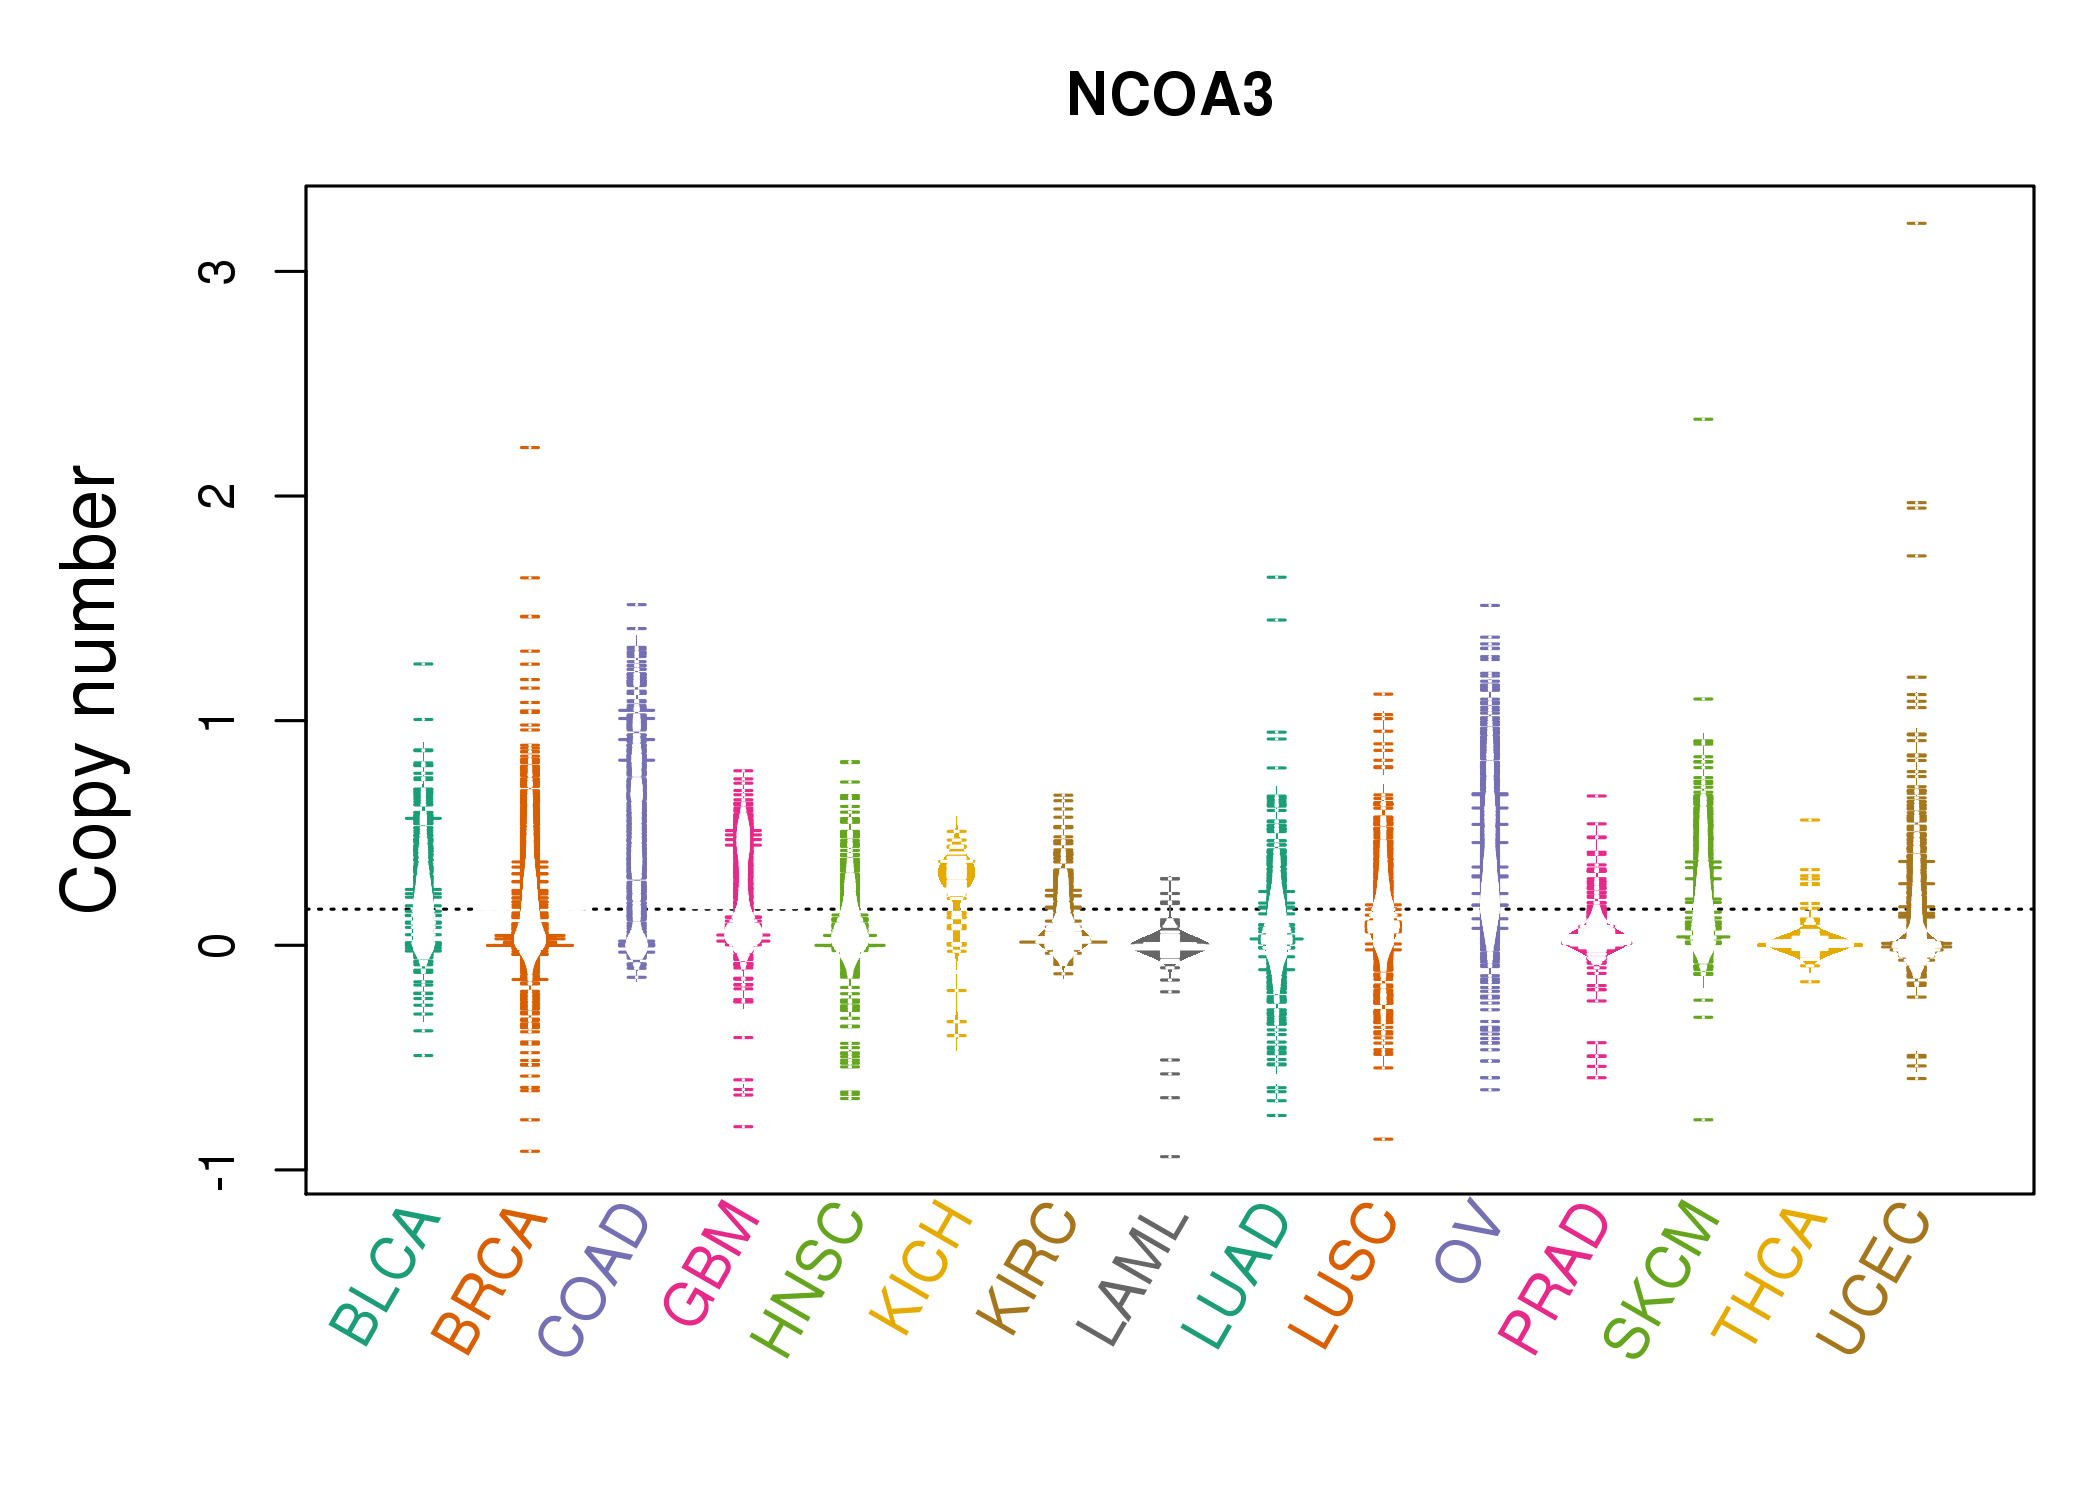 |
| cf) Tissue ID[Tissue type]: BLCA[Bladder Urothelial Carcinoma], BRCA[Breast invasive carcinoma], CESC[Cervical squamous cell carcinoma and endocervical adenocarcinoma], COAD[Colon adenocarcinoma], GBM[Glioblastoma multiforme], Glioma Low Grade, HNSC[Head and Neck squamous cell carcinoma], KICH[Kidney Chromophobe], KIRC[Kidney renal clear cell carcinoma], KIRP[Kidney renal papillary cell carcinoma], LAML[Acute Myeloid Leukemia], LUAD[Lung adenocarcinoma], LUSC[Lung squamous cell carcinoma], OV[Ovarian serous cystadenocarcinoma ], PAAD[Pancreatic adenocarcinoma], PRAD[Prostate adenocarcinoma], SKCM[Skin Cutaneous Melanoma], STAD[Stomach adenocarcinoma], THCA[Thyroid carcinoma], UCEC[Uterine Corpus Endometrial Carcinoma] |
| Top |
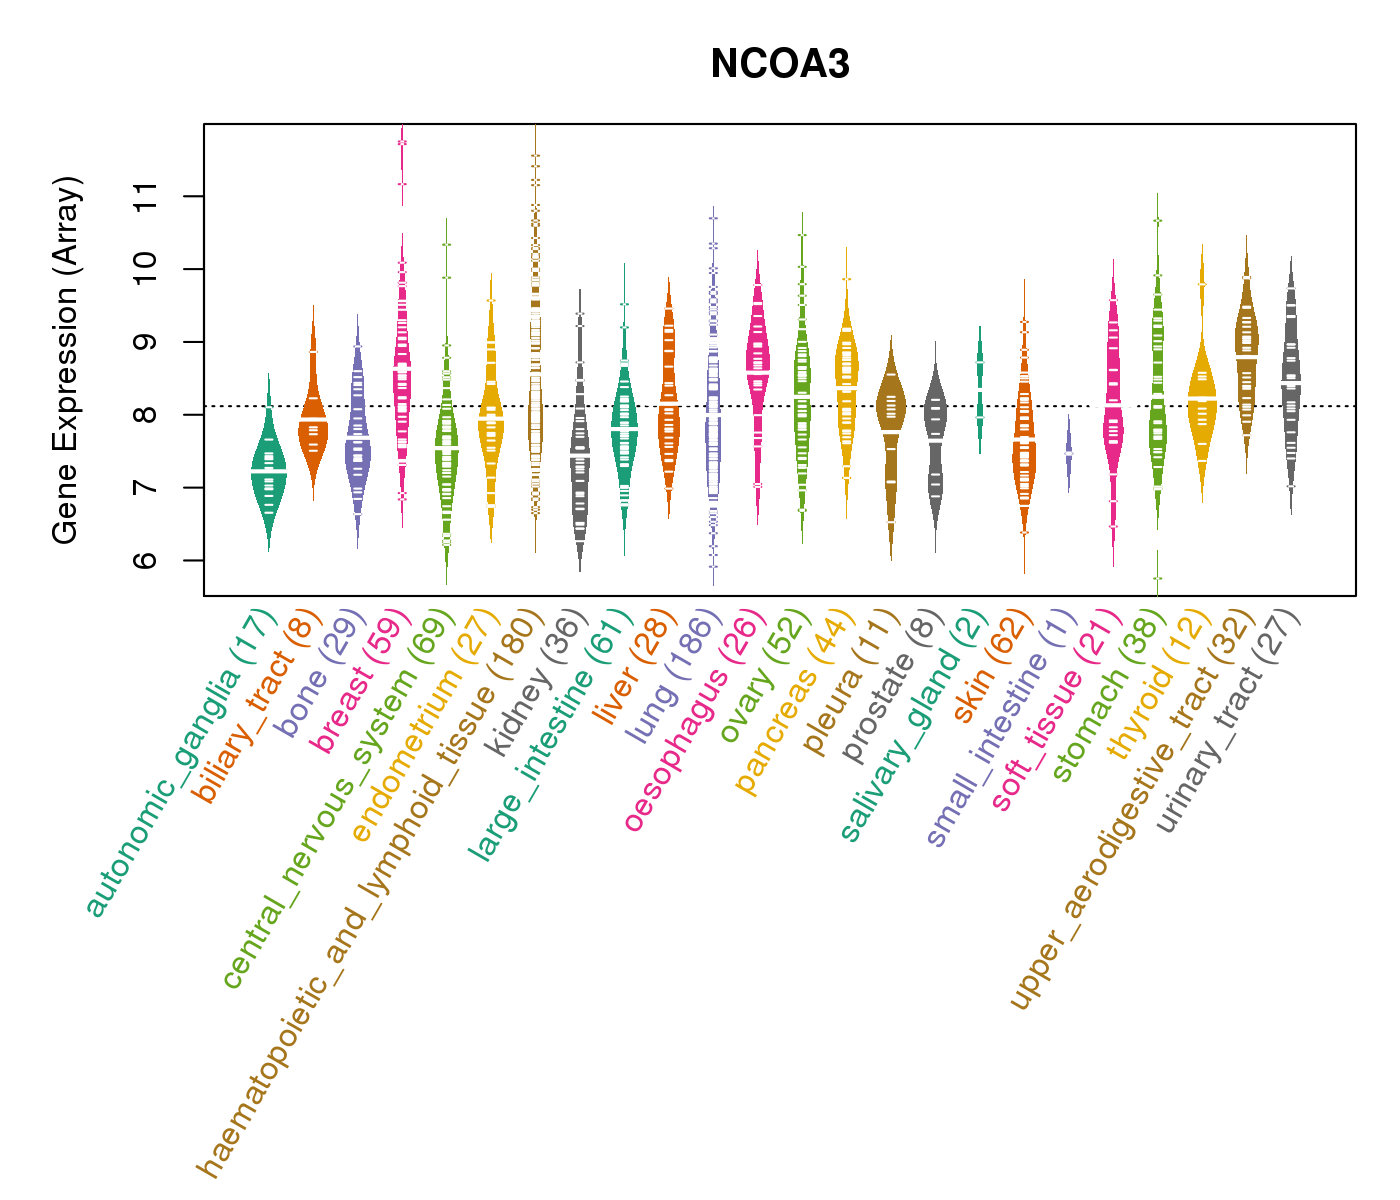
| Gene Expression for NCOA3 |
| * CCLE gene expression data were extracted from CCLE_Expression_Entrez_2012-10-18.res: Gene-centric RMA-normalized mRNA expression data. |
 |
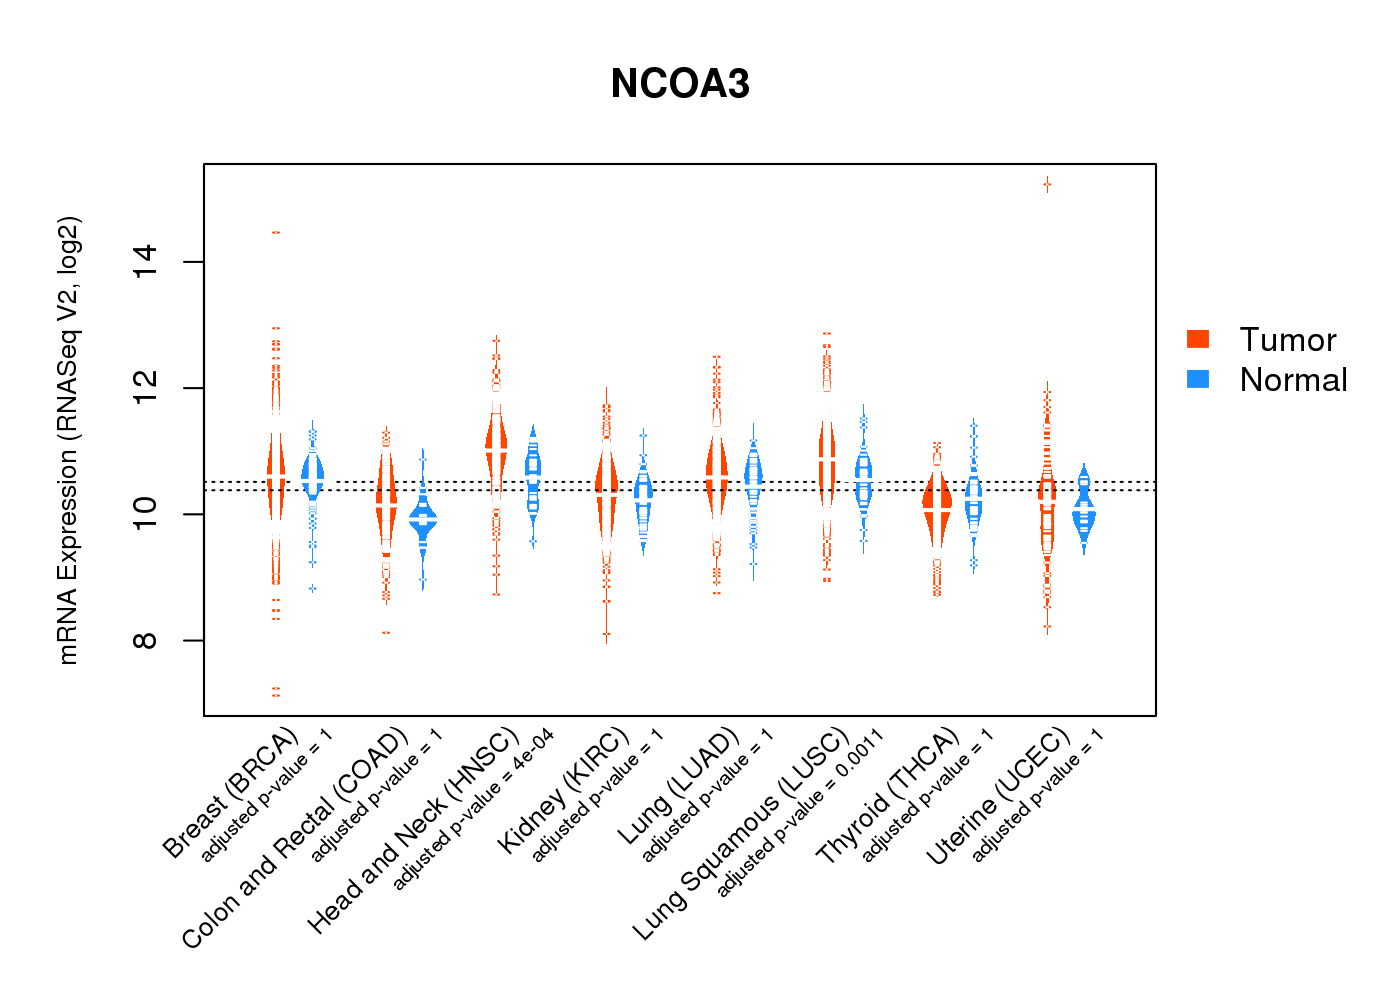
| * Normalized gene expression data of RNASeqV2 was extracted from TCGA using R package TCGA-Assembler. The URLs of all public data files on TCGA DCC data server were gathered at Jan-05-2015. Only eight cancer types have enough normal control samples for differential expression analysis. (t test, adjusted p<0.05 (using Benjamini-Hochberg FDR)) |
 |
| Top |
| * This plots show the correlation between CNV and gene expression. |
: Open all plots for all cancer types
 |
|
 |
|

| Top |
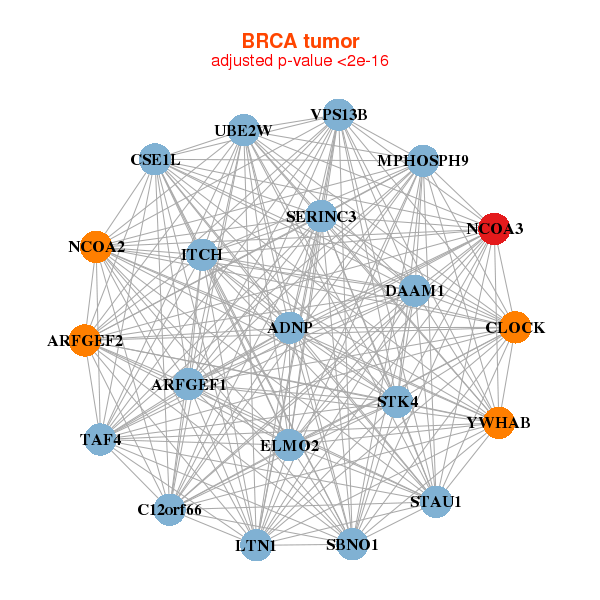
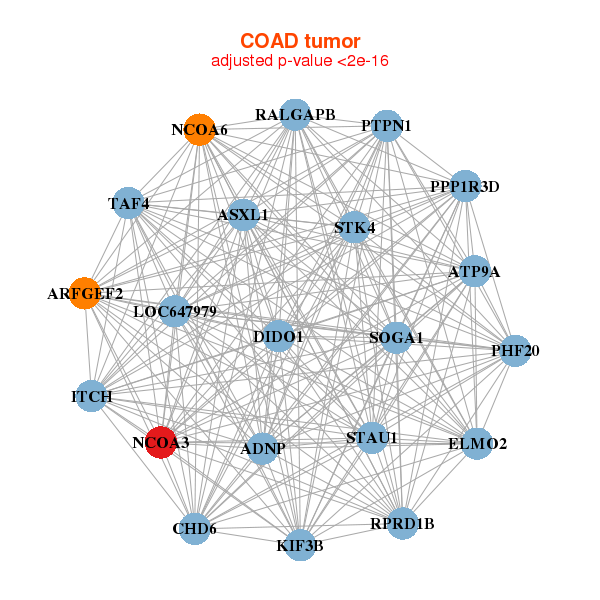
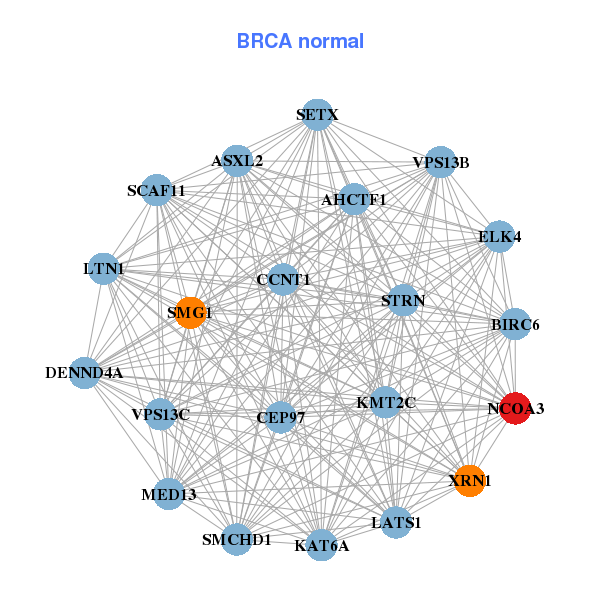
| Gene-Gene Network Information |
| * Co-Expression network figures were drawn using R package igraph. Only the top 20 genes with the highest correlations were shown. Red circle: input gene, orange circle: cell metabolism gene, sky circle: other gene |
: Open all plots for all cancer types
 |
|
| ADNP,ARFGEF1,ARFGEF2,C12orf66,CLOCK,CSE1L,DAAM1, ELMO2,ITCH,MPHOSPH9,NCOA2,NCOA3,LTN1,SBNO1, SERINC3,STAU1,STK4,TAF4,UBE2W,VPS13B,YWHAB | AHCTF1,ASXL2,BIRC6,CCNT1,CEP97,DENND4A,ELK4, LATS1,MED13,KMT2C,KAT6A,NCOA3,LTN1,SETX, SCAF11,SMCHD1,SMG1,STRN,VPS13B,VPS13C,XRN1 |
 |
|
| ADNP,ARFGEF2,ASXL1,ATP9A,SOGA1,CHD6,DIDO1, ELMO2,ITCH,KIF3B,LOC647979,NCOA3,NCOA6,PHF20, PPP1R3D,PTPN1,RALGAPB,RPRD1B,STAU1,STK4,TAF4 | BEND4,DOCK8,ETS1,IKZF3,INPP5D,KCNC3,KDM5A, KIAA0922,KLHL6,NCOA3,NUP210,P2RY8,PARP15,PAX5, PLCG2,SNX29P2,SP140,STK4,TLR9,WDFY4,ZNF831 |
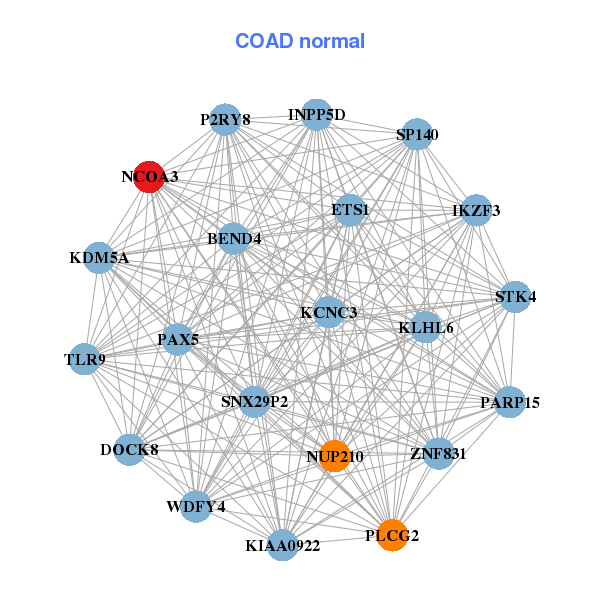
| * Co-Expression network figures were drawn using R package igraph. Only the top 20 genes with the highest correlations were shown. Red circle: input gene, orange circle: cell metabolism gene, sky circle: other gene |
: Open all plots for all cancer types
| Top |
: Open all interacting genes' information including KEGG pathway for all interacting genes from DAVID
| Top |
| Pharmacological Information for NCOA3 |
| There's no related Drug. |
| Top |
| Cross referenced IDs for NCOA3 |
| * We obtained these cross-references from Uniprot database. It covers 150 different DBs, 18 categories. http://www.uniprot.org/help/cross_references_section |
: Open all cross reference information
|
Copyright © 2016-Present - The Univsersity of Texas Health Science Center at Houston @ |