|
||||||||||||||||||||||||||||||||||||||||||||||||||||||||||||||||||||||||||||||||||||||||||||||||||||||||||||||||||||||||||||||||||||||||||||||||||||||||||||||||||||||||||||||||||||||||||||||||||||||||||||||||||||||||||||||||||||||||||||||||||||||||||||||||||||||||||||||||||||||||||||||||||||||||||||||||||||||||||
| |
| Phenotypic Information (metabolism pathway, cancer, disease, phenome) |
| |
| |
| Gene-Gene Network Information: Co-Expression Network, Interacting Genes & KEGG |
| |
|


| Gene Summary for CANX |
| Basic gene info. | Gene symbol | CANX |
| Gene name | calnexin | |
| Synonyms | CNX|IP90|P90 | |
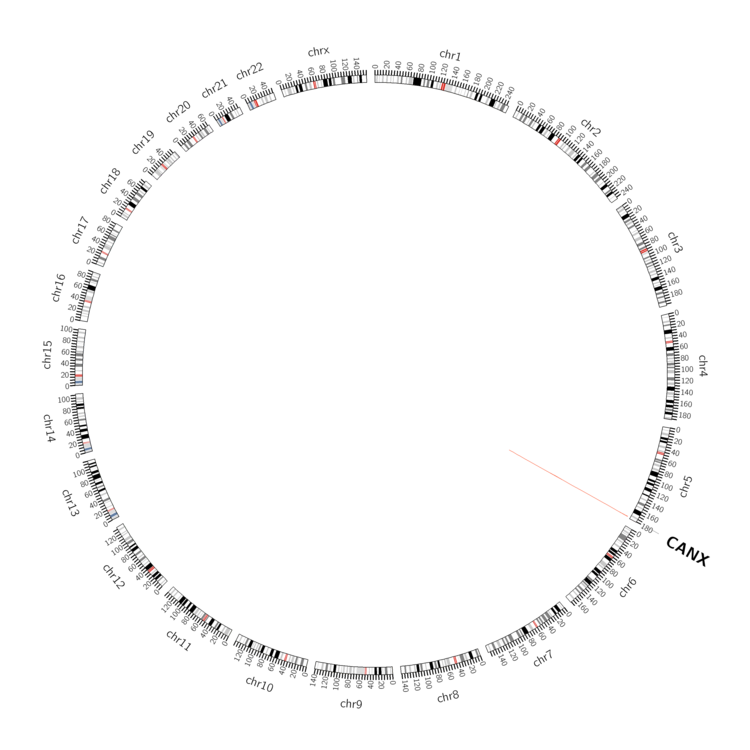
| Cytomap | UCSC genome browser: 5q35 | |
| Genomic location | chr5 :179125929-179158639 | |
| Type of gene | protein-coding | |
| RefGenes | NM_001024649.1, NM_001746.3, | |
| Ensembl id | ENSG00000127022 | |
| Description | major histocompatibility complex class I antigen-binding protein p88 | |
| Modification date | 20141207 | |
| dbXrefs | MIM : 114217 | |
| HGNC : HGNC | ||
| Ensembl : ENSG00000127022 | ||
| HPRD : 00252 | ||
| Vega : OTTHUMG00000130910 | ||
| Protein | UniProt: go to UniProt's Cross Reference DB Table | |
| Expression | CleanEX: HS_CANX | |
| BioGPS: 821 | ||
| Gene Expression Atlas: ENSG00000127022 | ||
| The Human Protein Atlas: ENSG00000127022 | ||
| Pathway | NCI Pathway Interaction Database: CANX | |
| KEGG: CANX | ||
| REACTOME: CANX | ||
| ConsensusPathDB | ||
| Pathway Commons: CANX | ||
| Metabolism | MetaCyc: CANX | |
| HUMANCyc: CANX | ||
| Regulation | Ensembl's Regulation: ENSG00000127022 | |
| miRBase: chr5 :179,125,929-179,158,639 | ||
| TargetScan: NM_001024649 | ||
| cisRED: ENSG00000127022 | ||
| Context | iHOP: CANX | |
| cancer metabolism search in PubMed: CANX | ||
| UCL Cancer Institute: CANX | ||
| Assigned class in ccmGDB | C | |
| Top |
| Phenotypic Information for CANX(metabolism pathway, cancer, disease, phenome) |
| Cancer | CGAP: CANX |
| Familial Cancer Database: CANX | |
| * This gene is included in those cancer gene databases. |
|
|
|
|
|
| . | ||||||||||||||||||||||||||||||||||||||||||||||||||||||||||||||||||||||||||||||||||||||||||||||||||||||||||||||||||||||||||||||||||||||||||||||||||||||||||||||||||||||||||||||||||||||||||||||||||||||||||||||||||||||||||||||||||||||||||||||||||||||||||||||||||||||||||||||||||||||||||||||||||||||||||||||||||||
Oncogene 1 | Significant driver gene in | |||||||||||||||||||||||||||||||||||||||||||||||||||||||||||||||||||||||||||||||||||||||||||||||||||||||||||||||||||||||||||||||||||||||||||||||||||||||||||||||||||||||||||||||||||||||||||||||||||||||||||||||||||||||||||||||||||||||||||||||||||||||||||||||||||||||||||||||||||||||||||||||||||||||||||||||||||||||||
| cf) number; DB name 1 Oncogene; http://nar.oxfordjournals.org/content/35/suppl_1/D721.long, 2 Tumor Suppressor gene; https://bioinfo.uth.edu/TSGene/, 3 Cancer Gene Census; http://www.nature.com/nrc/journal/v4/n3/abs/nrc1299.html, 4 CancerGenes; http://nar.oxfordjournals.org/content/35/suppl_1/D721.long, 5 Network of Cancer Gene; http://ncg.kcl.ac.uk/index.php, 1Therapeutic Vulnerabilities in Cancer; http://cbio.mskcc.org/cancergenomics/statius/ |
| REACTOME_METABOLISM_OF_PROTEINS | |
| OMIM | |
| Orphanet | |
| Disease | KEGG Disease: CANX |
| MedGen: CANX (Human Medical Genetics with Condition) | |
| ClinVar: CANX | |
| Phenotype | MGI: CANX (International Mouse Phenotyping Consortium) |
| PhenomicDB: CANX | |
| Mutations for CANX |
| * Under tables are showing count per each tissue to give us broad intuition about tissue specific mutation patterns.You can go to the detailed page for each mutation database's web site. |
| - Statistics for Tissue and Mutation type | Top |
 |
| - For Inter-chromosomal Variations |
| There's no inter-chromosomal structural variation. |
| - For Intra-chromosomal Variations |
| * Intra-chromosomal variantions includes 'intrachromosomal amplicon to amplicon', 'intrachromosomal amplicon to non-amplified dna', 'intrachromosomal deletion', 'intrachromosomal fold-back inversion', 'intrachromosomal inversion', 'intrachromosomal tandem duplication', 'Intrachromosomal unknown type', 'intrachromosomal with inverted orientation', 'intrachromosomal with non-inverted orientation'. |
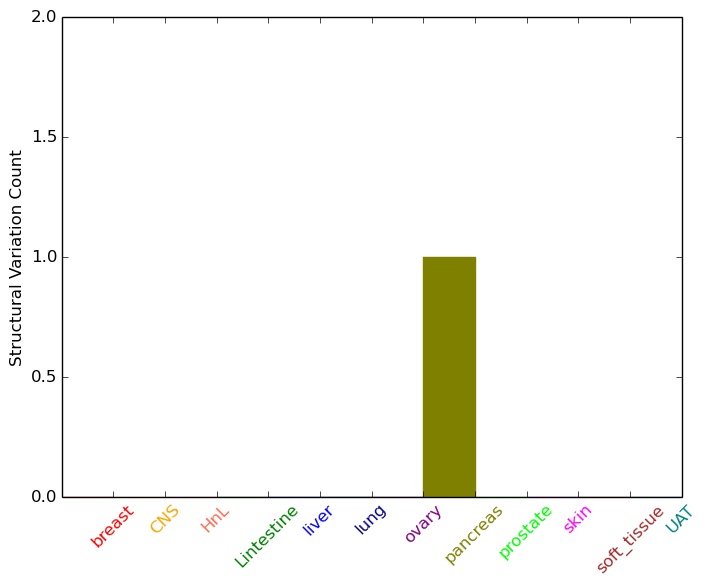 |
| Sample | Symbol_a | Chr_a | Start_a | End_a | Symbol_b | Chr_b | Start_b | End_b |
| pancreas | CANX | chr5 | 179141104 | 179141124 | chr5 | 179055101 | 179055121 |
| cf) Tissue number; Tissue name (1;Breast, 2;Central_nervous_system, 3;Haematopoietic_and_lymphoid_tissue, 4;Large_intestine, 5;Liver, 6;Lung, 7;Ovary, 8;Pancreas, 9;Prostate, 10;Skin, 11;Soft_tissue, 12;Upper_aerodigestive_tract) |
| * From mRNA Sanger sequences, Chitars2.0 arranged chimeric transcripts. This table shows CANX related fusion information. |
| ID | Head Gene | Tail Gene | Accession | Gene_a | qStart_a | qEnd_a | Chromosome_a | tStart_a | tEnd_a | Gene_a | qStart_a | qEnd_a | Chromosome_a | tStart_a | tEnd_a |
| N44604 | CANX | 1 | 210 | 5 | 179156135 | 179156344 | MLIP | 208 | 283 | 6 | 53986265 | 53986340 | |
| BM726297 | KIFC3 | 1 | 69 | 16 | 57792333 | 57792401 | CANX | 69 | 495 | 5 | 179157500 | 179157926 | |
| BG168464 | CANX | 1 | 84 | 5 | 179147429 | 179147512 | CSDA | 77 | 307 | 12 | 10851694 | 10851923 | |
| BM680904 | CANX | 19 | 445 | 5 | 179157500 | 179157926 | KIFC3 | 445 | 498 | 16 | 57792333 | 57792386 | |
| BE150450 | TGFBR1 | 7 | 112 | 9 | 101915624 | 101915729 | CANX | 103 | 614 | 5 | 179155621 | 179156133 | |
| CB242580 | CANX | 19 | 376 | 5 | 179157569 | 179157926 | CANX | 372 | 548 | 5 | 179157392 | 179157568 | |
| AL046980 | RBBP6 | 28 | 669 | 16 | 24580820 | 24581461 | CANX | 661 | 778 | 5 | 179157329 | 179157446 | |
| BF949860 | CALM1 | 2 | 78 | 14 | 90872966 | 90873043 | CANX | 74 | 166 | 5 | 179146676 | 179146768 | |
| CB856751 | CANX | 1 | 269 | 5 | 179143186 | 179147449 | CANX | 267 | 624 | 5 | 179156065 | 179156422 | |
| BG009982 | CANX | 6 | 202 | 5 | 179155948 | 179156146 | KDM5B | 190 | 459 | 1 | 202712054 | 202712323 | |
| AW583198 | CANX | 24 | 129 | 5 | 179156758 | 179156863 | CANX | 130 | 355 | 5 | 179156530 | 179156755 | |
| AU125279 | CANX | 1 | 422 | 5 | 179156591 | 179157013 | SNHG3 | 420 | 747 | 1 | 28833820 | 28834153 | |
| BE836489 | TMTC1 | 2 | 234 | 12 | 29727036 | 29727270 | CANX | 231 | 382 | 5 | 179136873 | 179137024 | |
| BI019346 | CLSPN | 1 | 290 | 1 | 36230155 | 36235467 | CANX | 288 | 406 | 5 | 179135979 | 179136910 | |
| AW469973 | CANX | 1 | 370 | 5 | 179157203 | 179157572 | CANX | 367 | 525 | 5 | 179157020 | 179157179 | |
| CA448313 | PRSS23 | 18 | 275 | 11 | 86519968 | 86520225 | CANX | 275 | 546 | 5 | 179156721 | 179156992 | |
| BP240903 | CANX | 1 | 453 | 5 | 179149870 | 179153735 | PPAP2B | 451 | 573 | 1 | 57045203 | 57045325 | |
| Top |
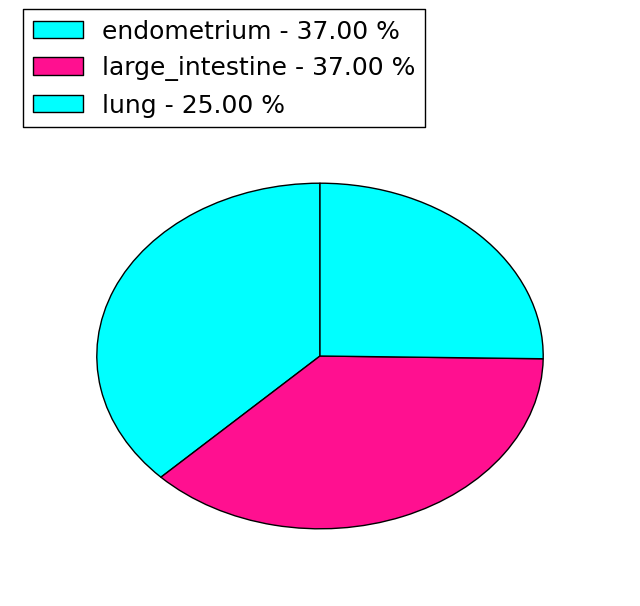
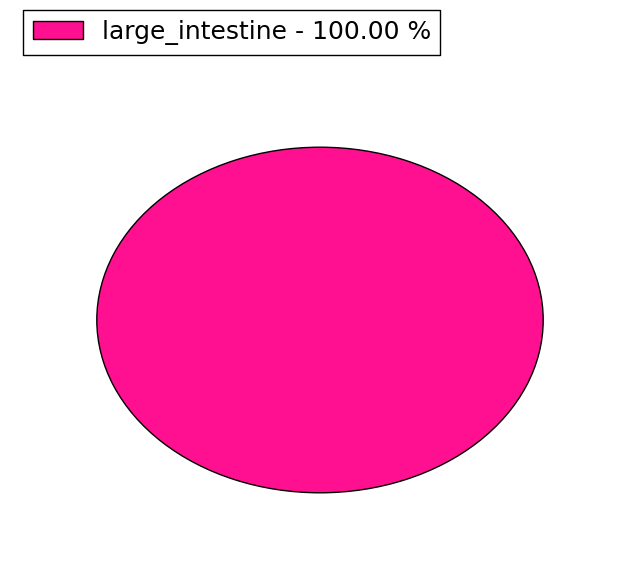
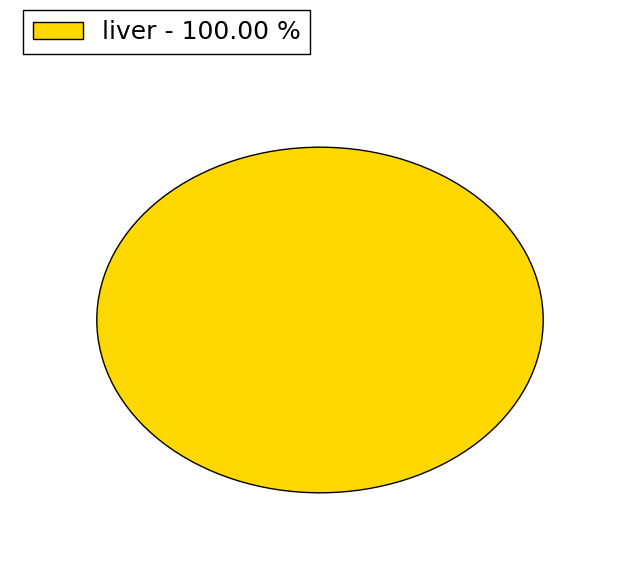
| Mutation type/ Tissue ID | brca | cns | cerv | endome | haematopo | kidn | Lintest | liver | lung | ns | ovary | pancre | prost | skin | stoma | thyro | urina | |||
| Total # sample | 1 | |||||||||||||||||||
| GAIN (# sample) | 1 | |||||||||||||||||||
| LOSS (# sample) |
| cf) Tissue ID; Tissue type (1; Breast, 2; Central_nervous_system, 3; Cervix, 4; Endometrium, 5; Haematopoietic_and_lymphoid_tissue, 6; Kidney, 7; Large_intestine, 8; Liver, 9; Lung, 10; NS, 11; Ovary, 12; Pancreas, 13; Prostate, 14; Skin, 15; Stomach, 16; Thyroid, 17; Urinary_tract) |
| Top |
|
 |
| Top |
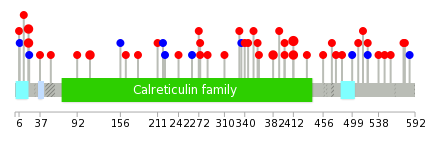
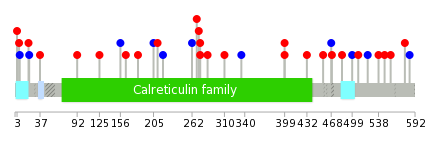
| Stat. for Non-Synonymous SNVs (# total SNVs=37) | (# total SNVs=8) |
 |  |
(# total SNVs=3) | (# total SNVs=1) |
 |  |
| Top |
| * When you move the cursor on each content, you can see more deailed mutation information on the Tooltip. Those are primary_site,primary_histology,mutation(aa),pubmedID. |
| GRCh37 position | Mutation(aa) | Unique sampleID count |
| chr5:179149920-179149920 | p.F435fs*12 | 4 |
| chr5:179149857-179149857 | p.E412G | 3 |
| chr5:179135268-179135268 | p.E111D | 2 |
| chr5:179147524-179147524 | p.K382I | 2 |
| chr5:179149818-179149818 | p.P399L | 2 |
| chr5:179132740-179132740 | p.A20T | 2 |
| chr5:179149856-179149856 | p.E412Q | 2 |
| chr5:179132741-179132741 | p.A20V | 2 |
| chr5:179147460-179147460 | p.E361Q | 1 |
| chr5:179149988-179149988 | p.G456C | 1 |
| Top |
|
 |
| Point Mutation/ Tissue ID | 1 | 2 | 3 | 4 | 5 | 6 | 7 | 8 | 9 | 10 | 11 | 12 | 13 | 14 | 15 | 16 | 17 | 18 | 19 | 20 |
| # sample | 2 | 2 | 5 | 1 | 4 | 5 | 3 | 2 | 2 | 1 | 8 | |||||||||
| # mutation | 2 | 2 | 5 | 1 | 4 | 6 | 3 | 2 | 2 | 1 | 8 | |||||||||
| nonsynonymous SNV | 1 | 2 | 2 | 1 | 4 | 5 | 2 | 1 | 1 | 1 | 5 | |||||||||
| synonymous SNV | 1 | 3 | 1 | 1 | 1 | 1 | 3 |
| cf) Tissue ID; Tissue type (1; BLCA[Bladder Urothelial Carcinoma], 2; BRCA[Breast invasive carcinoma], 3; CESC[Cervical squamous cell carcinoma and endocervical adenocarcinoma], 4; COAD[Colon adenocarcinoma], 5; GBM[Glioblastoma multiforme], 6; Glioma Low Grade, 7; HNSC[Head and Neck squamous cell carcinoma], 8; KICH[Kidney Chromophobe], 9; KIRC[Kidney renal clear cell carcinoma], 10; KIRP[Kidney renal papillary cell carcinoma], 11; LAML[Acute Myeloid Leukemia], 12; LUAD[Lung adenocarcinoma], 13; LUSC[Lung squamous cell carcinoma], 14; OV[Ovarian serous cystadenocarcinoma ], 15; PAAD[Pancreatic adenocarcinoma], 16; PRAD[Prostate adenocarcinoma], 17; SKCM[Skin Cutaneous Melanoma], 18:STAD[Stomach adenocarcinoma], 19:THCA[Thyroid carcinoma], 20:UCEC[Uterine Corpus Endometrial Carcinoma]) |
| Top |
| * We represented just top 10 SNVs. When you move the cursor on each content, you can see more deailed mutation information on the Tooltip. Those are primary_site, primary_histology, mutation(aa), pubmedID. |
| Genomic Position | Mutation(aa) | Unique sampleID count |
| chr5:179149818 | p.P399L,CANX | 2 |
| chr5:179143205 | p.T211M,CANX | 1 |
| chr5:179151663 | p.I499I,CANX | 1 |
| chr5:179136000 | p.A219A,CANX | 1 |
| chr5:179143237 | p.Q508H,CANX | 1 |
| chr5:179151705 | p.L262L,CANX | 1 |
| chr5:179136022 | p.P522P,CANX | 1 |
| chr5:179146685 | p.P269H,CANX | 1 |
| chr5:179151752 | p.G538E,CANX | 1 |
| chr5:179136891 | p.G3W,CANX | 1 |
| * Copy number data were extracted from TCGA using R package TCGA-Assembler. The URLs of all public data files on TCGA DCC data server were gathered on Jan-05-2015. Function ProcessCNAData in TCGA-Assembler package was used to obtain gene-level copy number value which is calculated as the average copy number of the genomic region of a gene. |
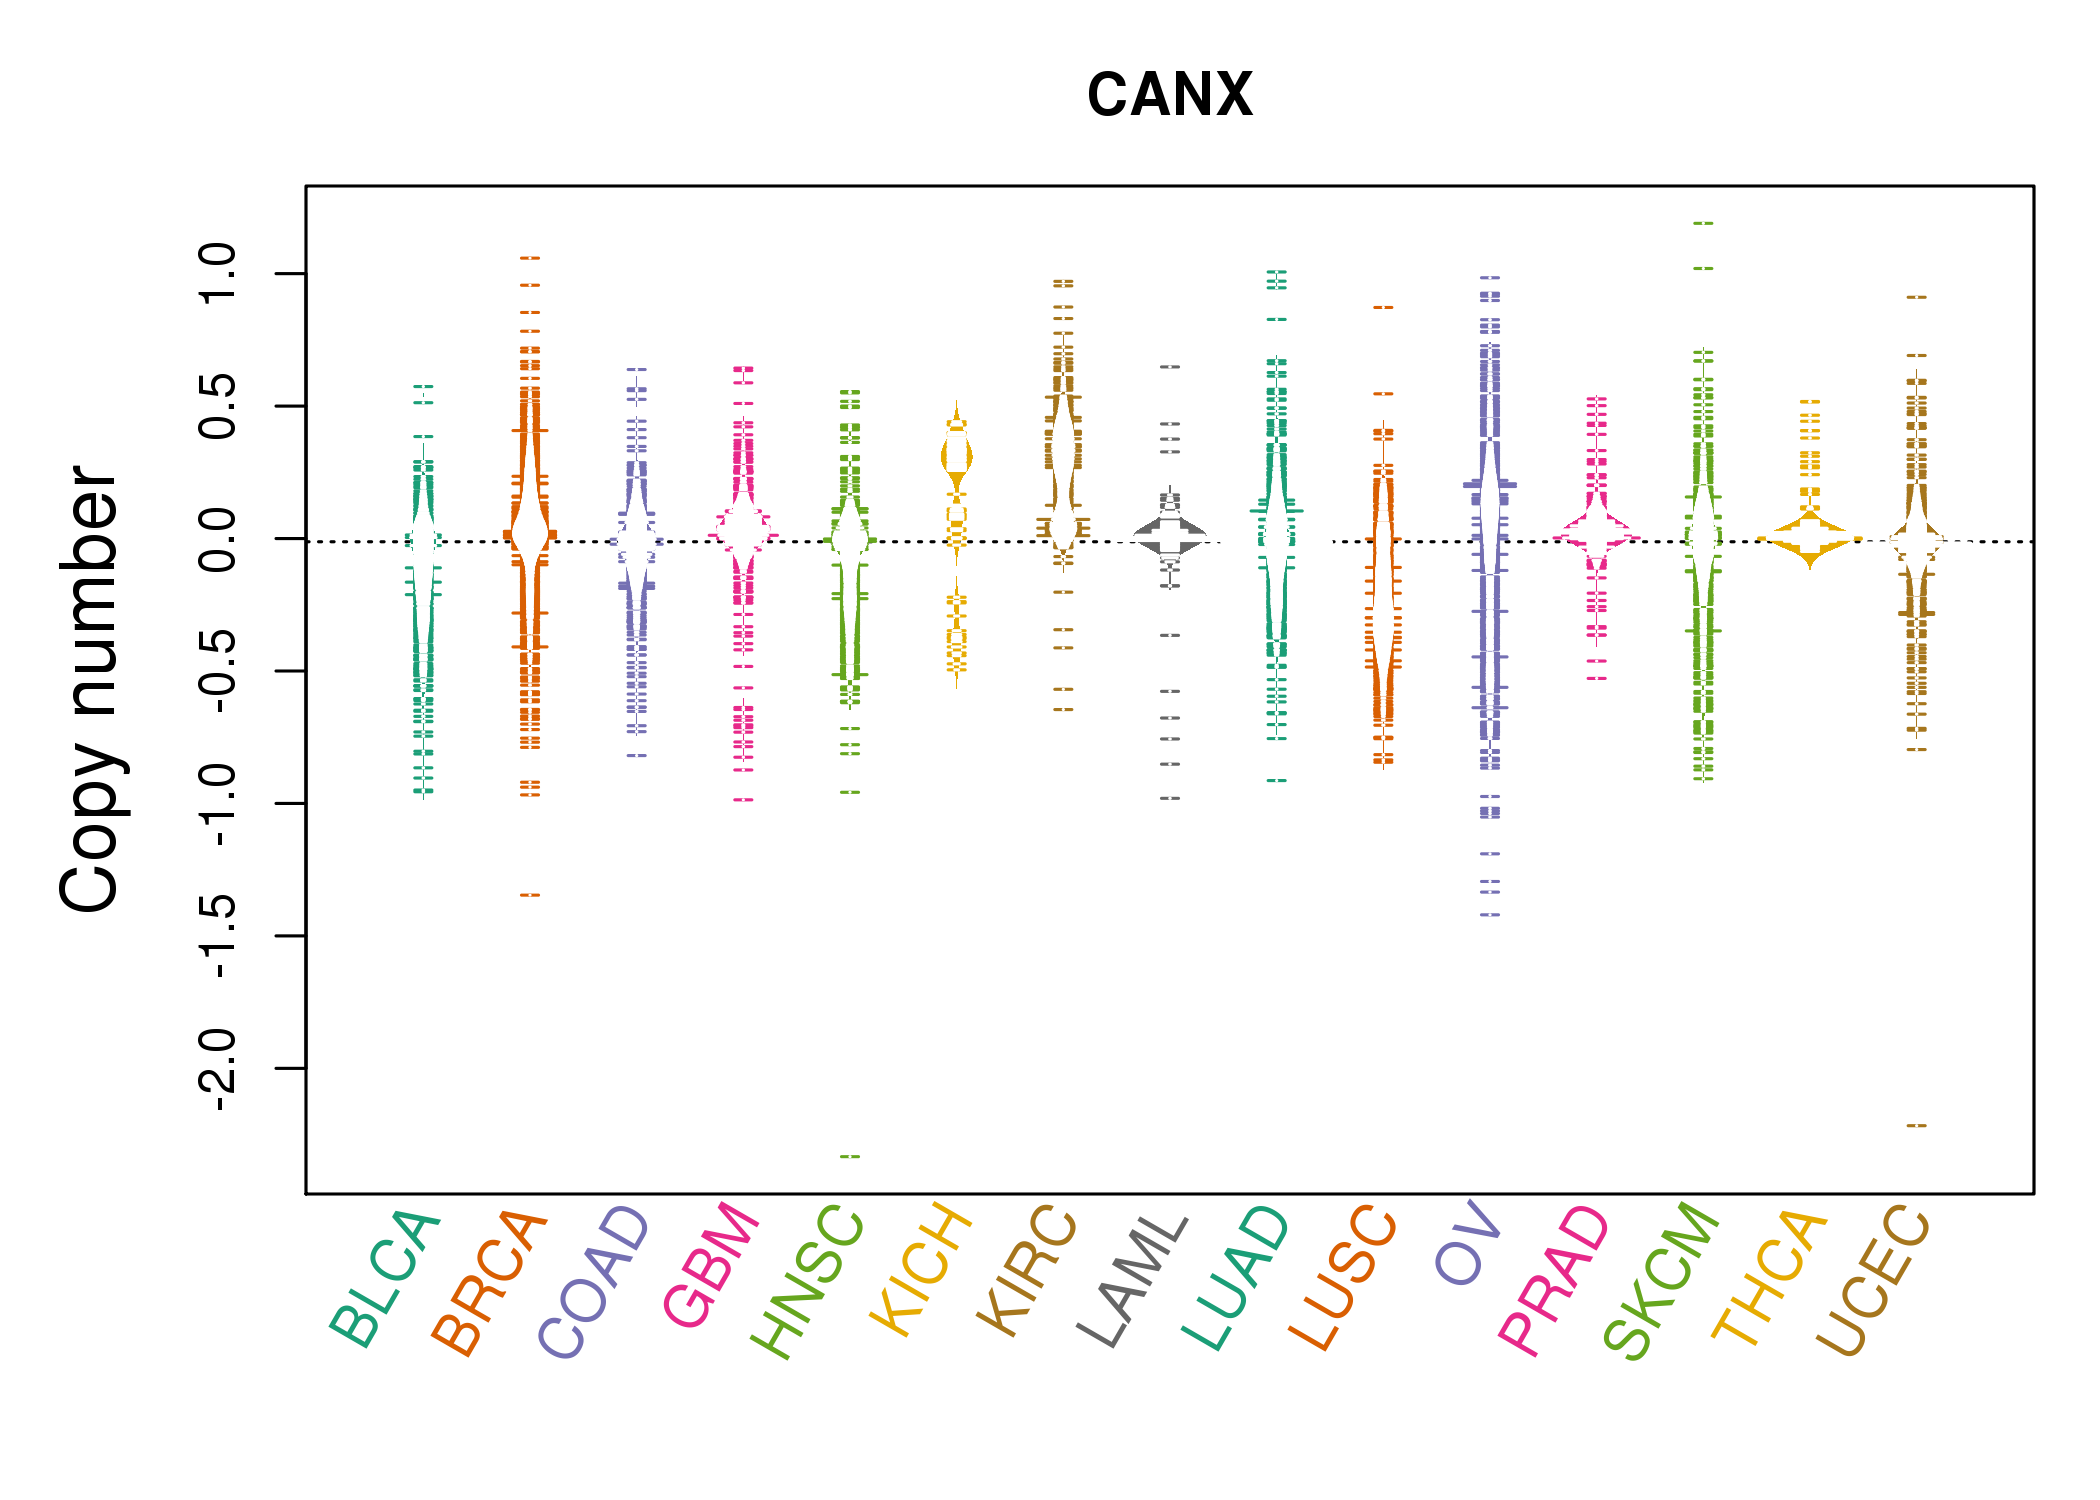 |
| cf) Tissue ID[Tissue type]: BLCA[Bladder Urothelial Carcinoma], BRCA[Breast invasive carcinoma], CESC[Cervical squamous cell carcinoma and endocervical adenocarcinoma], COAD[Colon adenocarcinoma], GBM[Glioblastoma multiforme], Glioma Low Grade, HNSC[Head and Neck squamous cell carcinoma], KICH[Kidney Chromophobe], KIRC[Kidney renal clear cell carcinoma], KIRP[Kidney renal papillary cell carcinoma], LAML[Acute Myeloid Leukemia], LUAD[Lung adenocarcinoma], LUSC[Lung squamous cell carcinoma], OV[Ovarian serous cystadenocarcinoma ], PAAD[Pancreatic adenocarcinoma], PRAD[Prostate adenocarcinoma], SKCM[Skin Cutaneous Melanoma], STAD[Stomach adenocarcinoma], THCA[Thyroid carcinoma], UCEC[Uterine Corpus Endometrial Carcinoma] |
| Top |
| Gene Expression for CANX |
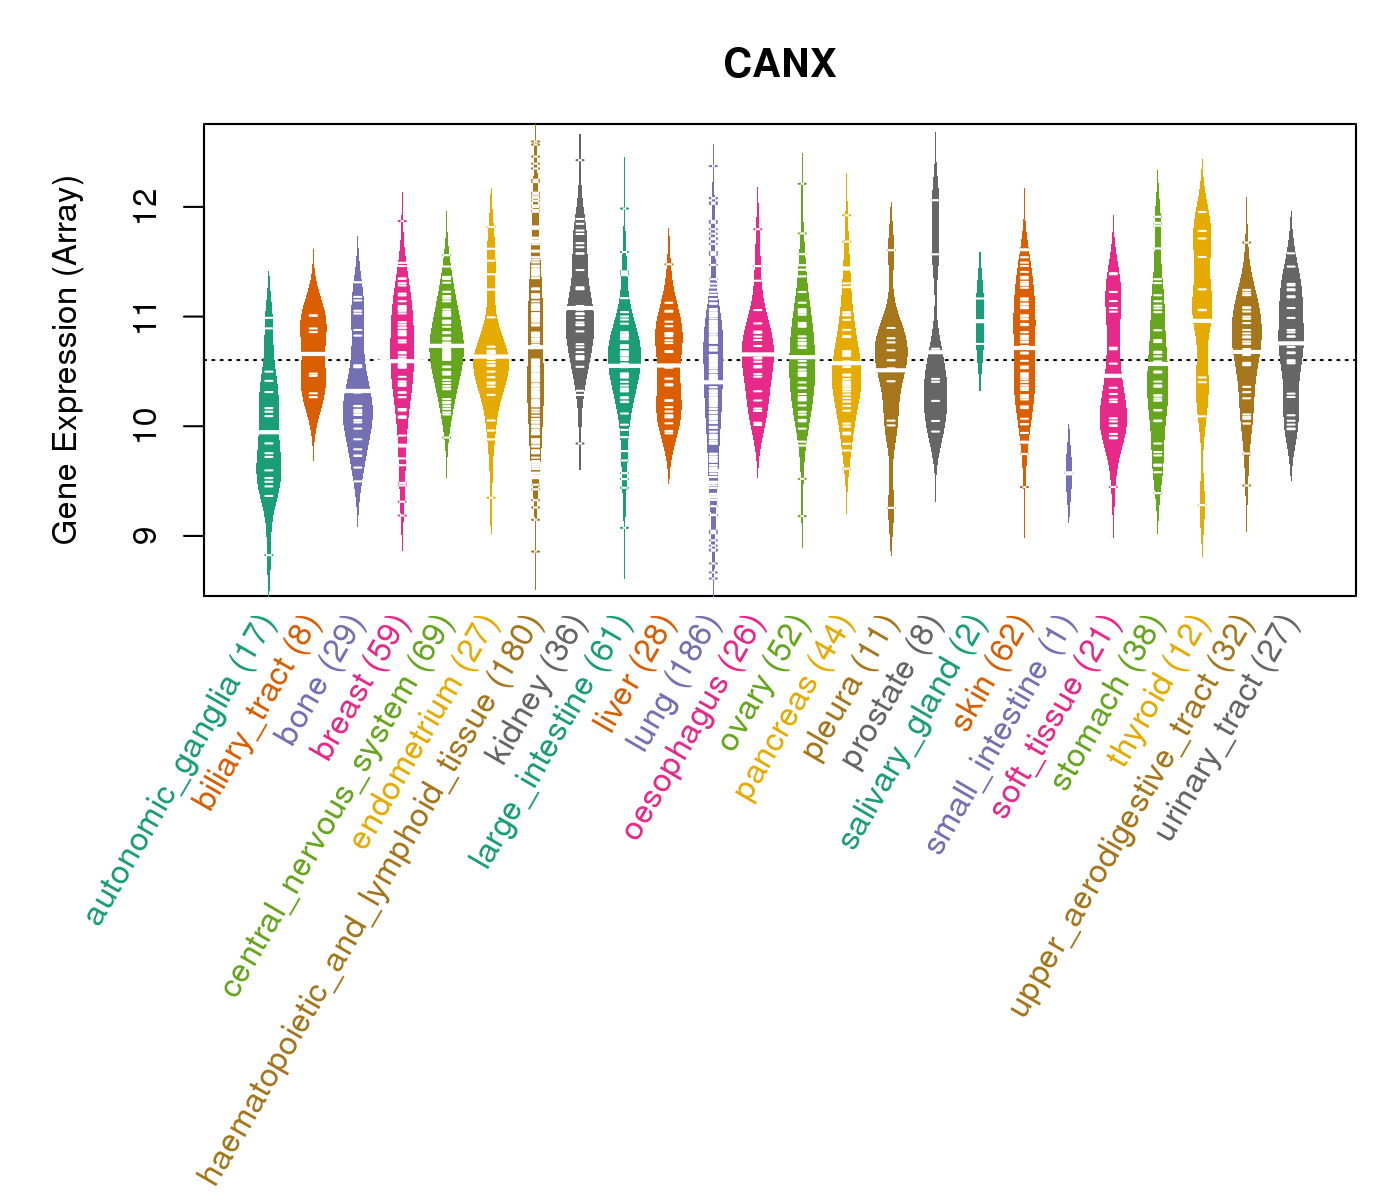
| * CCLE gene expression data were extracted from CCLE_Expression_Entrez_2012-10-18.res: Gene-centric RMA-normalized mRNA expression data. |
 |
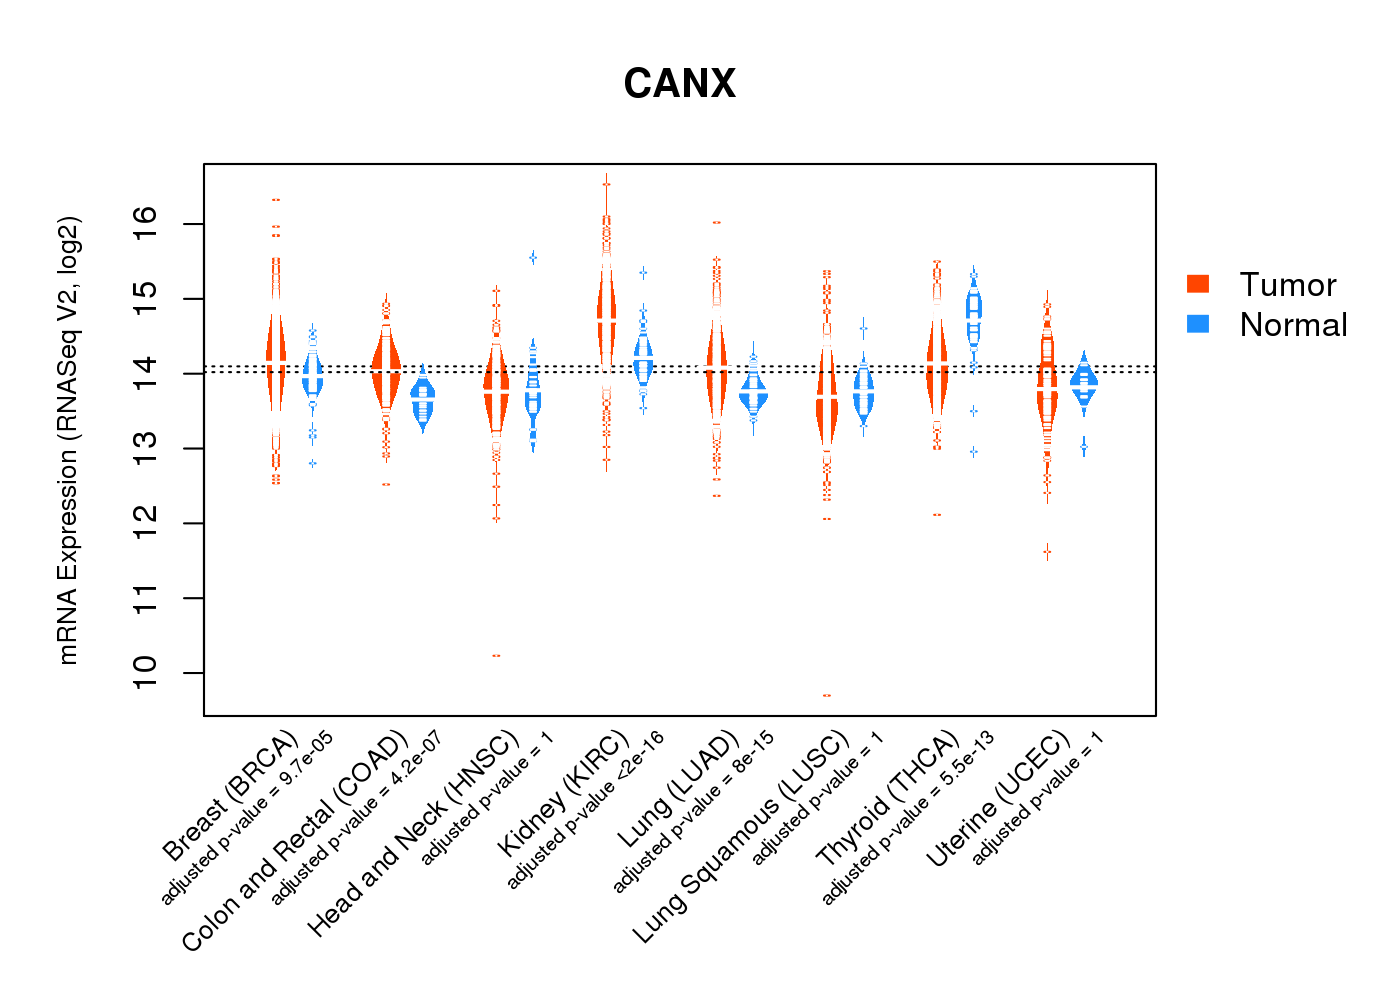
| * Normalized gene expression data of RNASeqV2 was extracted from TCGA using R package TCGA-Assembler. The URLs of all public data files on TCGA DCC data server were gathered at Jan-05-2015. Only eight cancer types have enough normal control samples for differential expression analysis. (t test, adjusted p<0.05 (using Benjamini-Hochberg FDR)) |
 |
| Top |
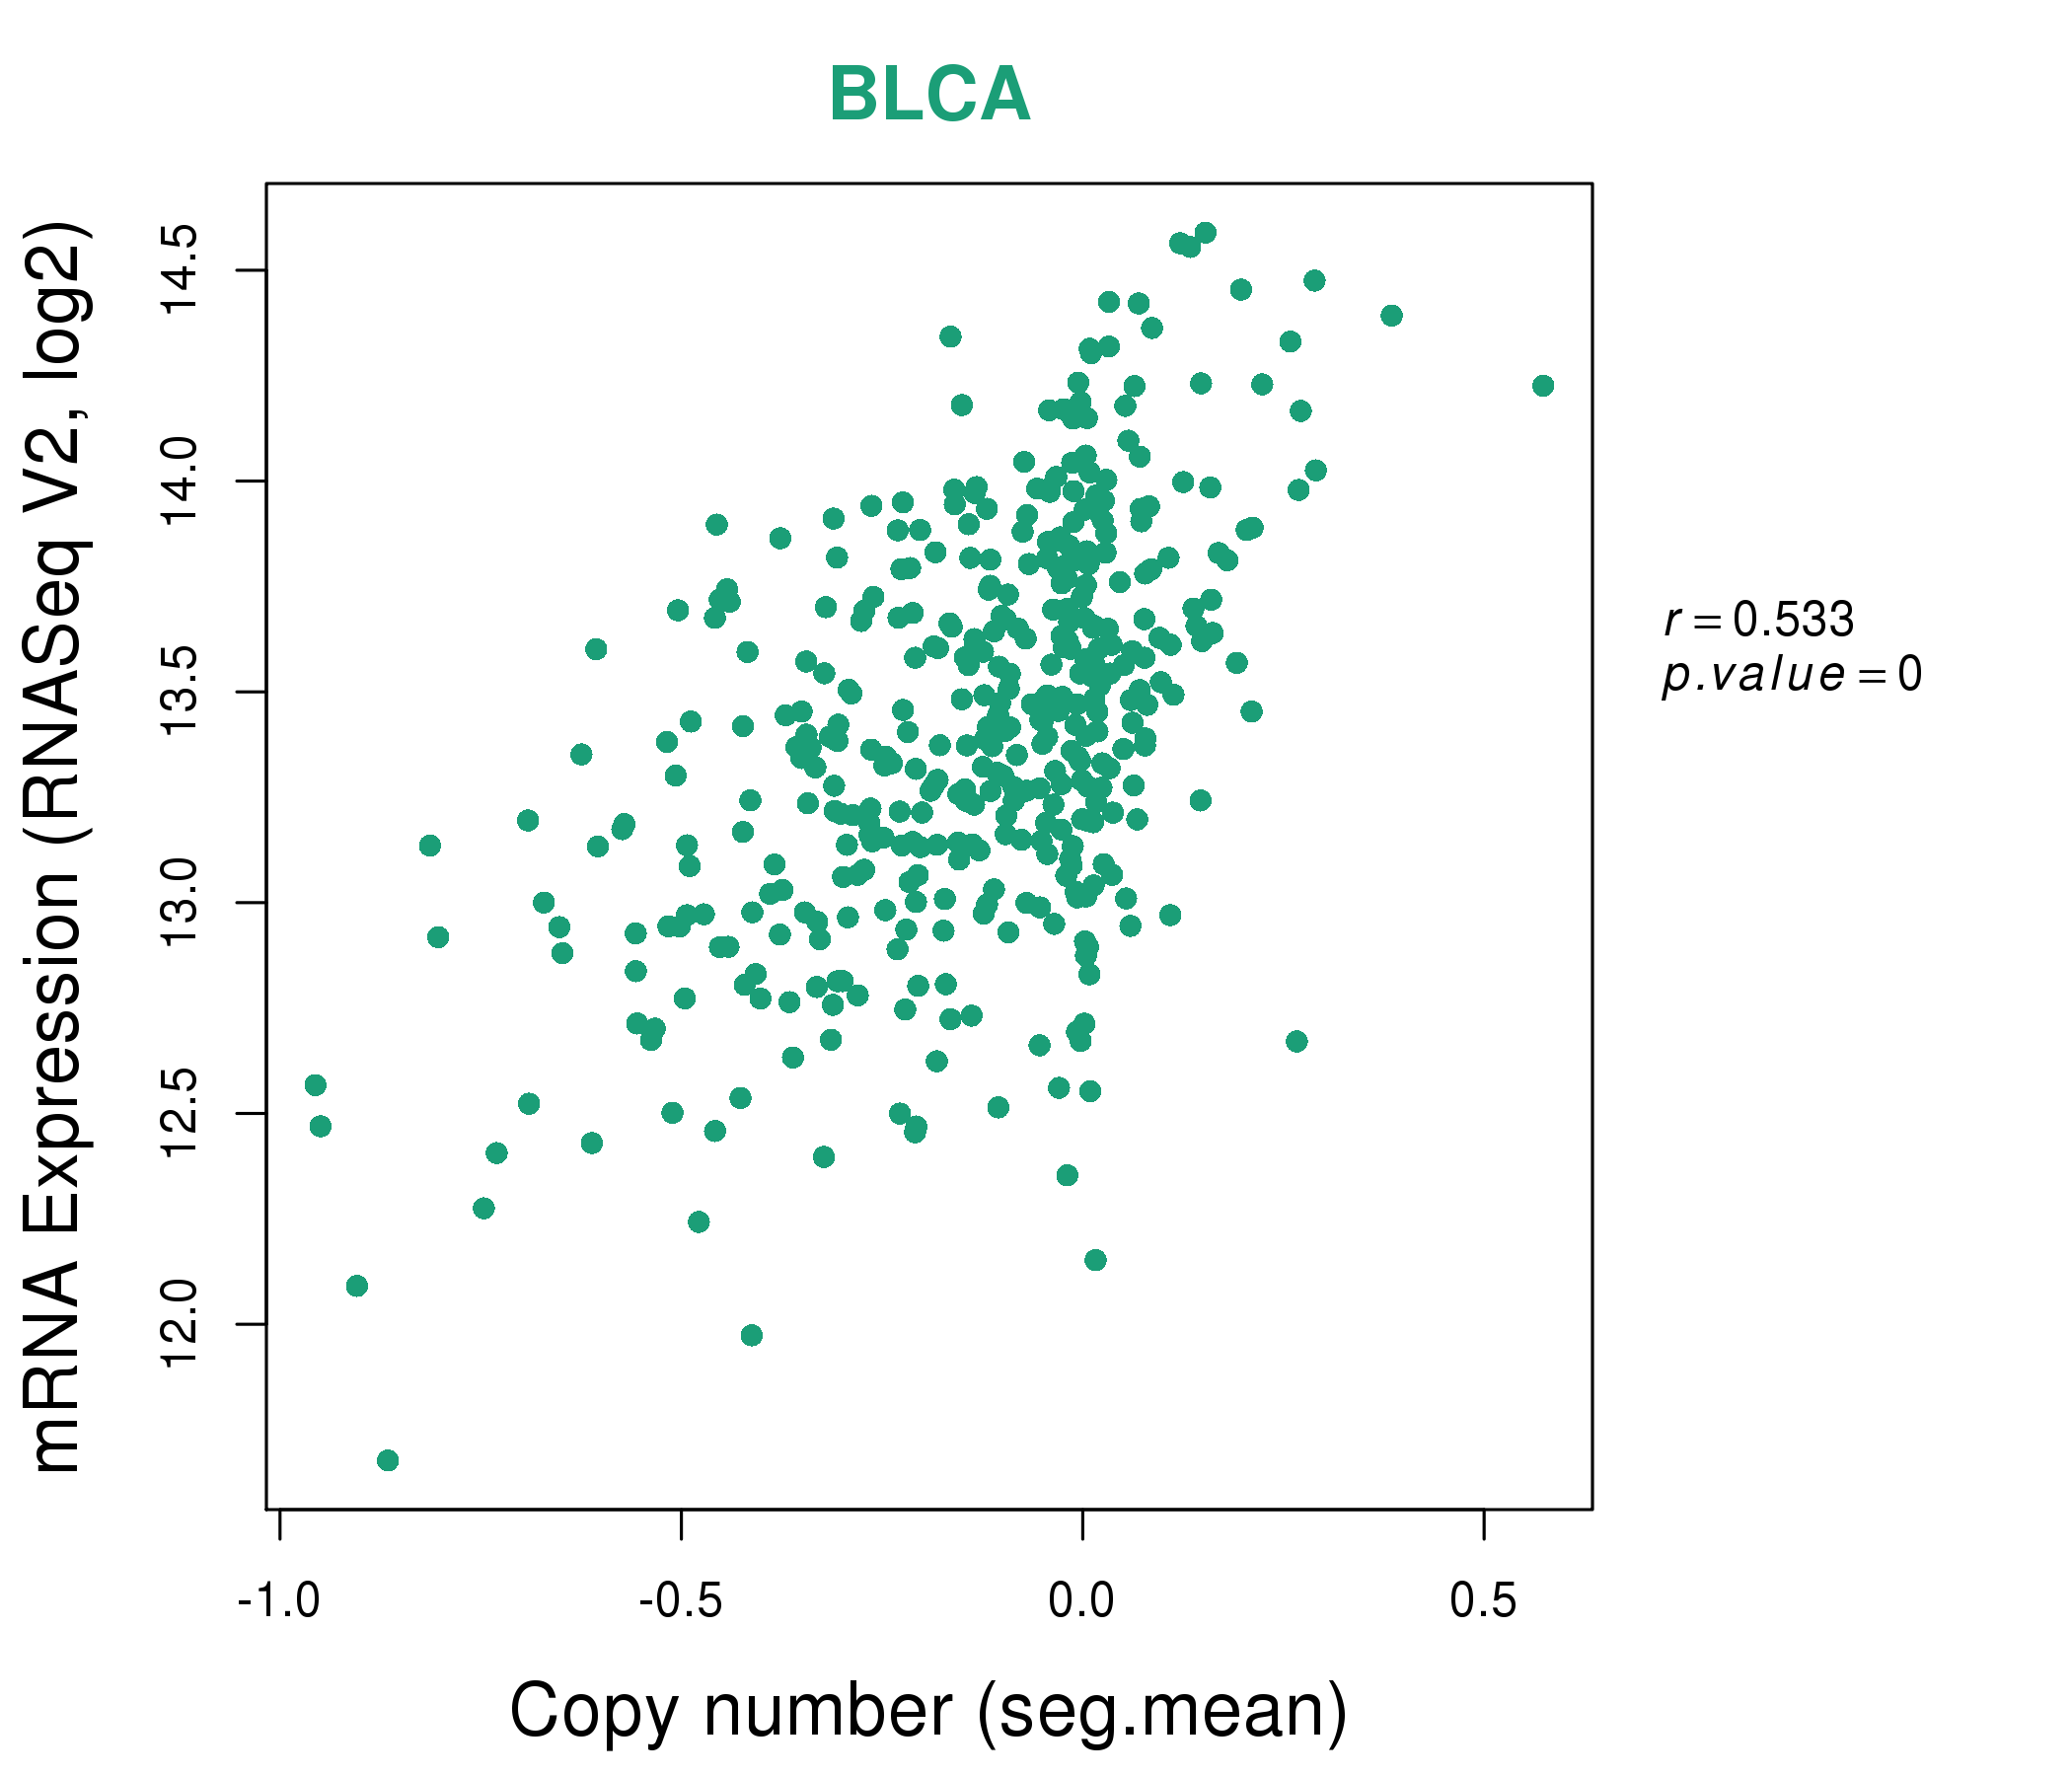
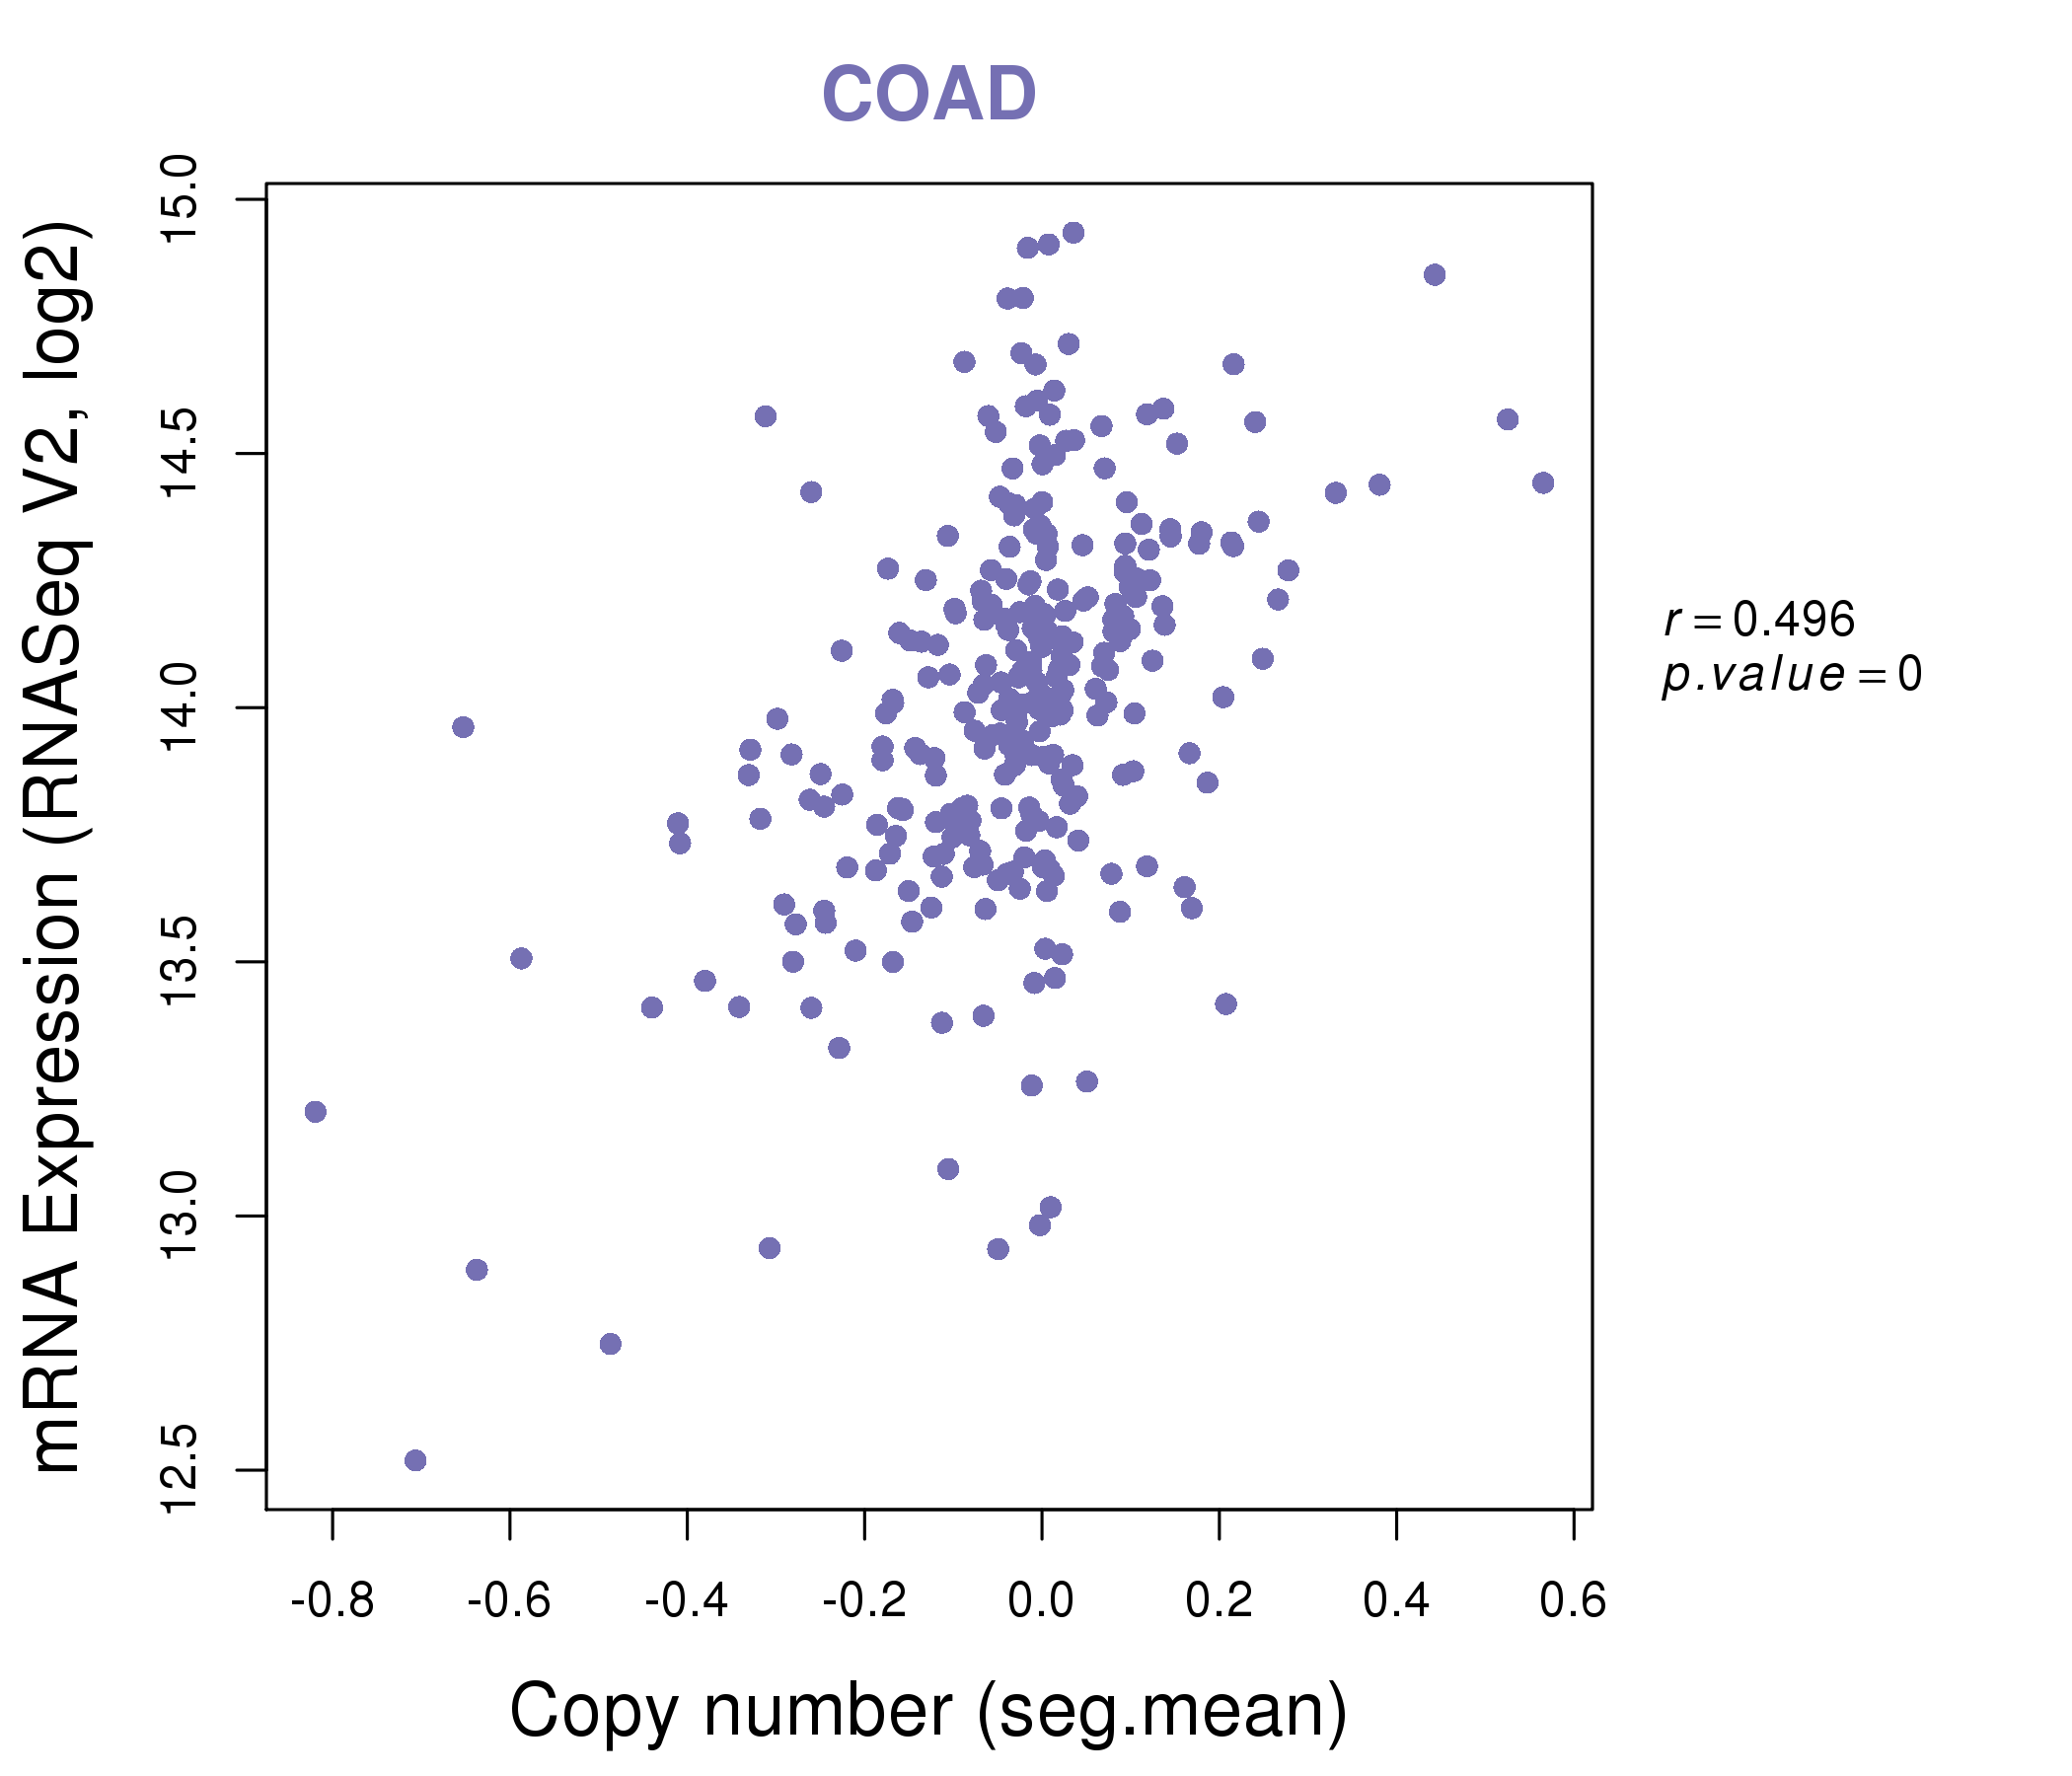
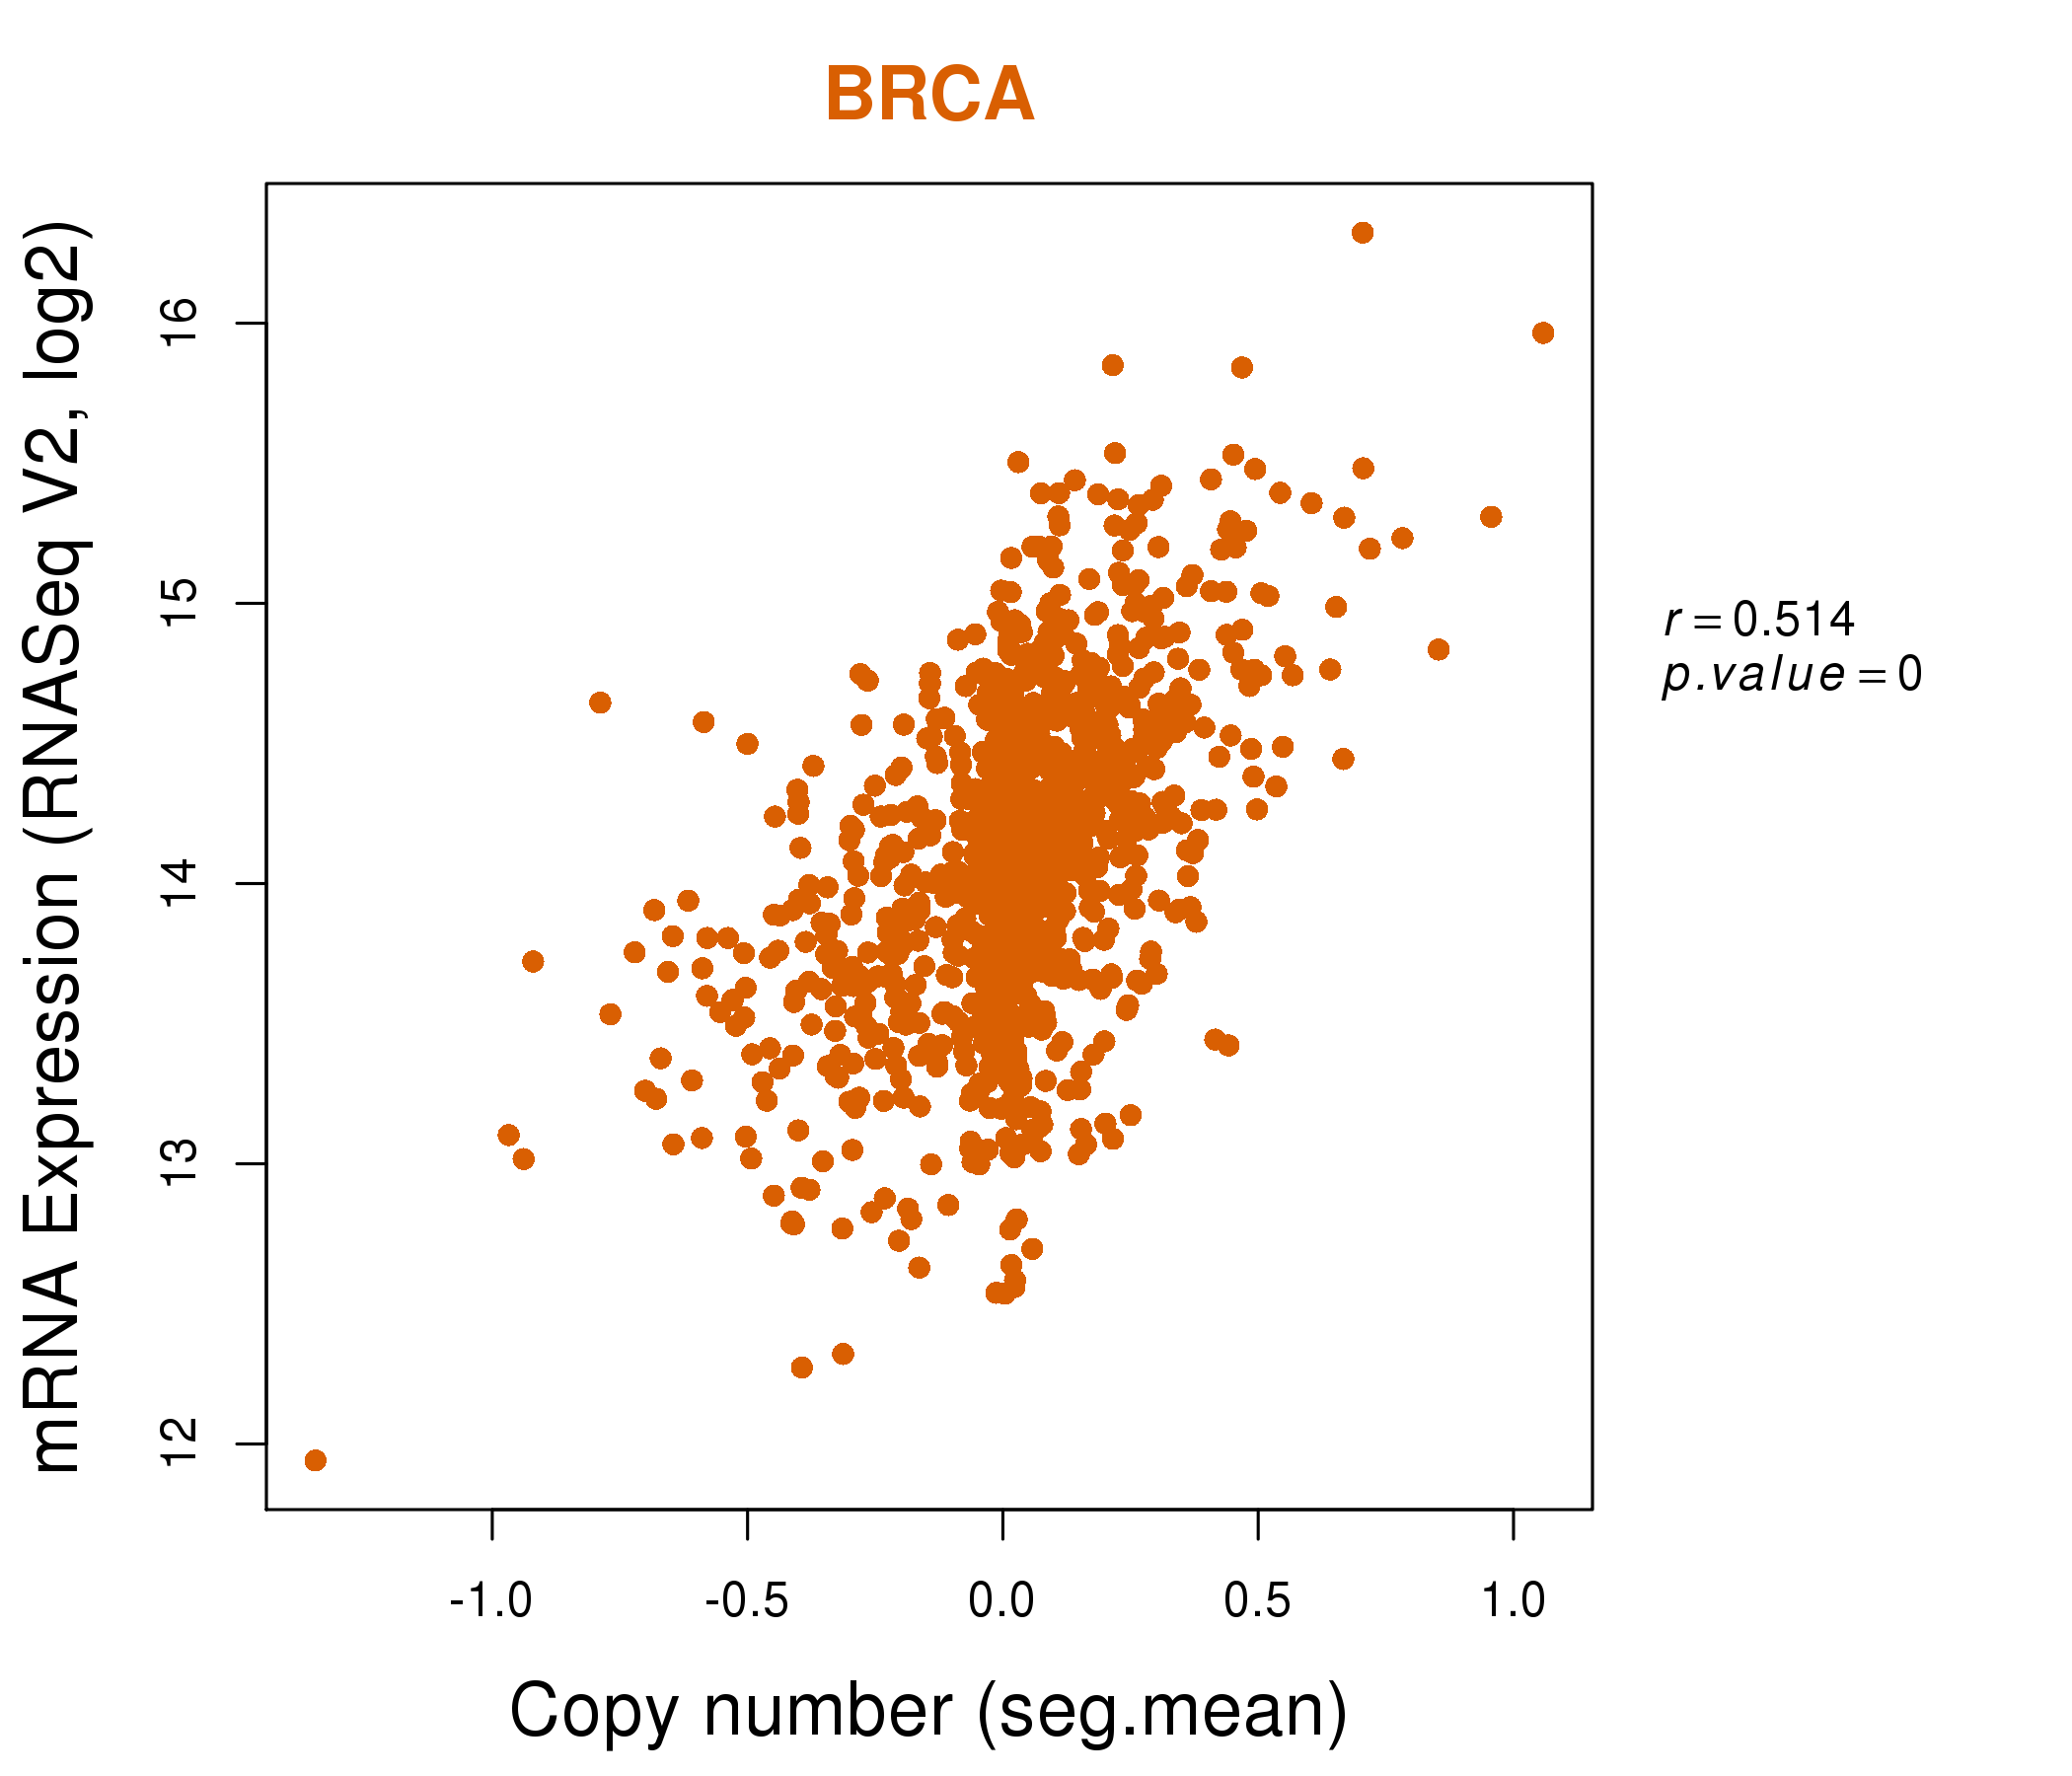
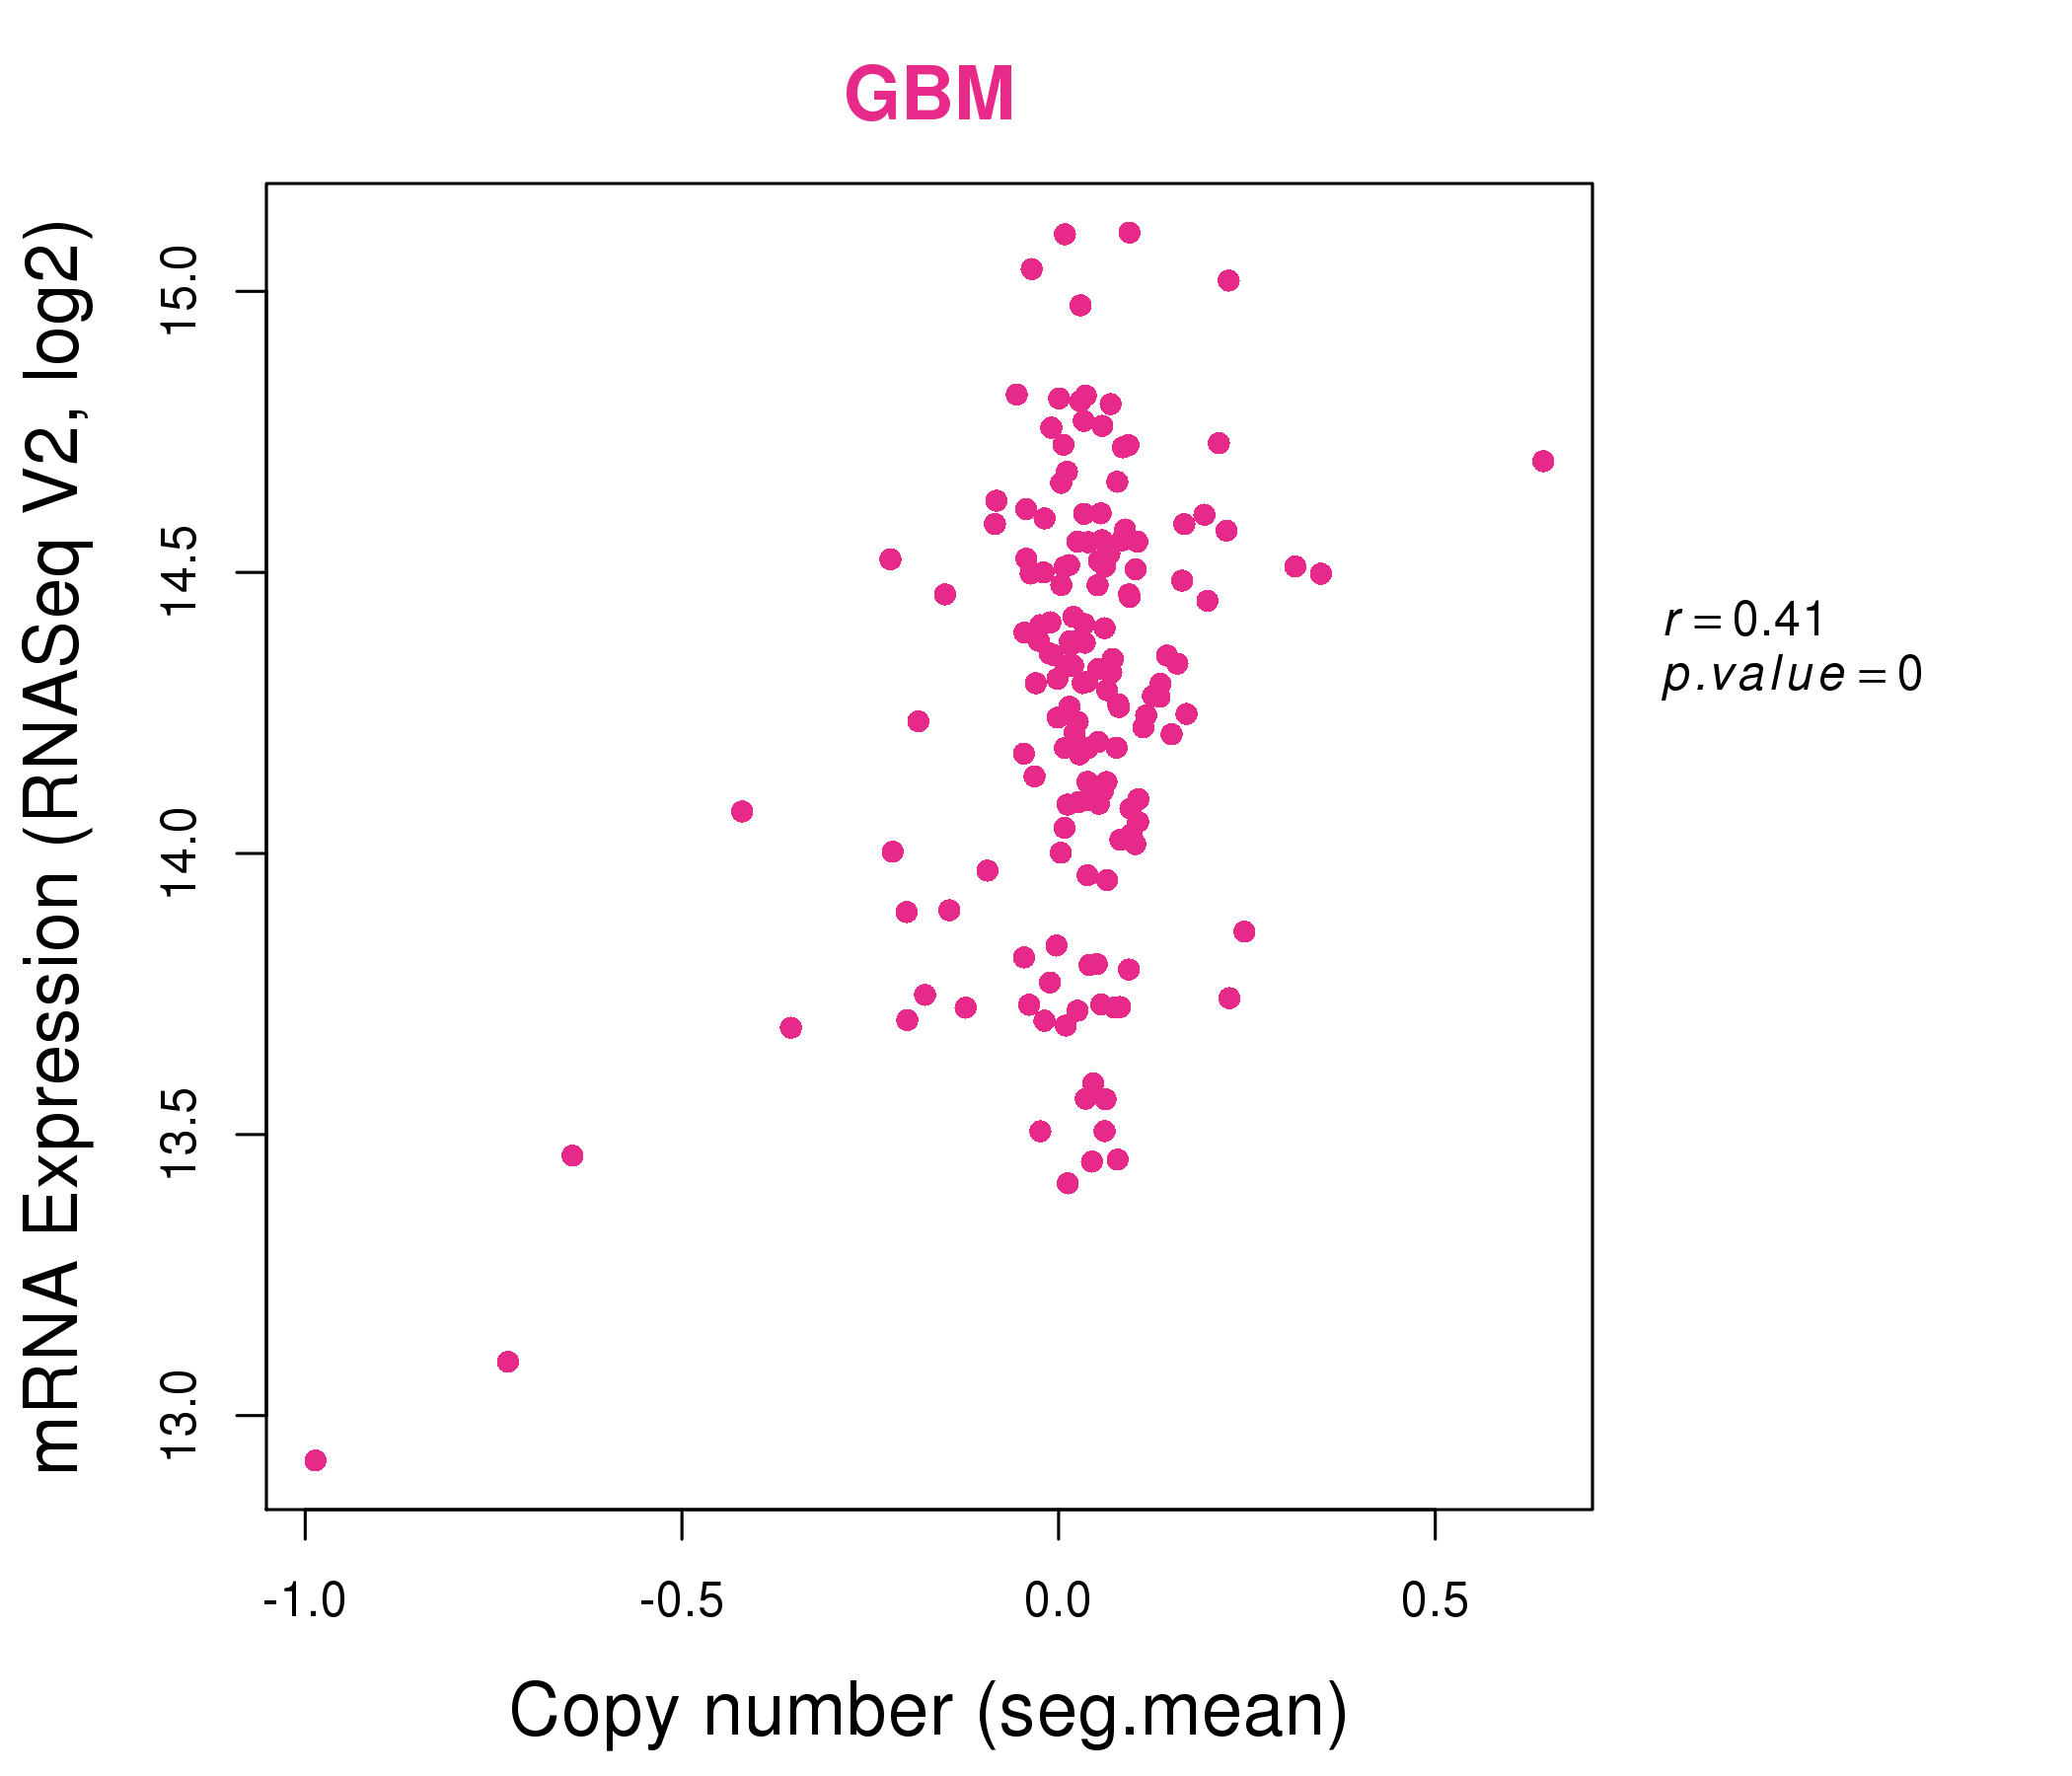
| * This plots show the correlation between CNV and gene expression. |
: Open all plots for all cancer types
 |
|
 |
|
| Top |
| Gene-Gene Network Information |
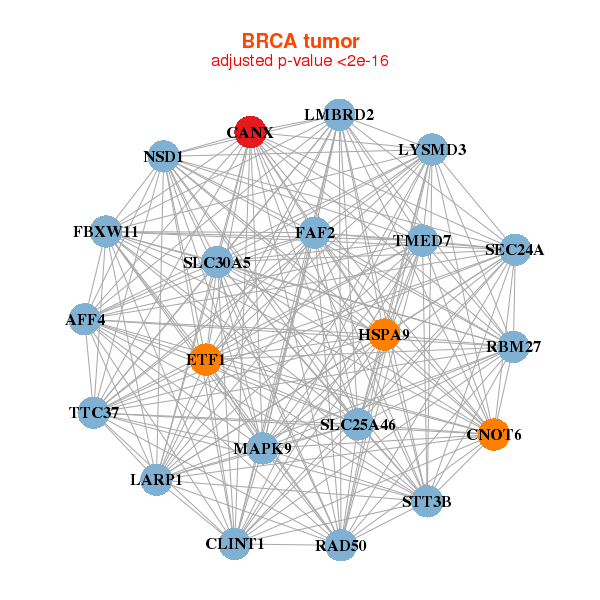
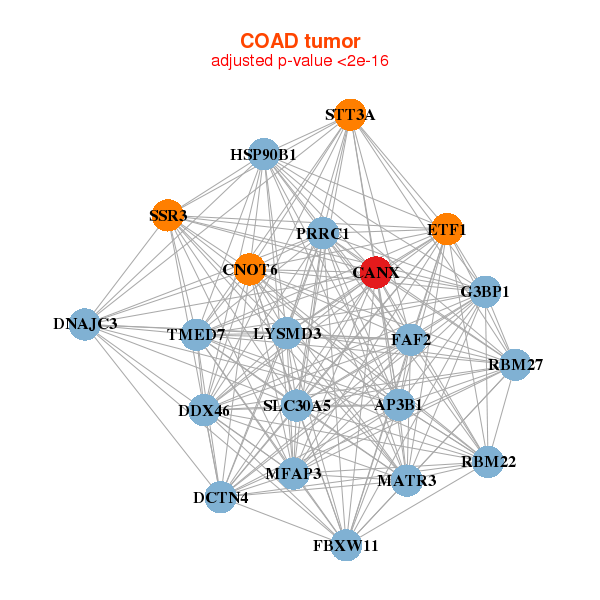
| * Co-Expression network figures were drawn using R package igraph. Only the top 20 genes with the highest correlations were shown. Red circle: input gene, orange circle: cell metabolism gene, sky circle: other gene |
: Open all plots for all cancer types
 |
|
| AFF4,CANX,CLINT1,CNOT6,ETF1,FAF2,FBXW11, HSPA9,LARP1,LMBRD2,LYSMD3,MAPK9,NSD1,RAD50, RBM27,SEC24A,SLC25A46,SLC30A5,STT3B,TMED7,TTC37 | API5,ATP6V1A,CANX,CAPRIN1,COPB1,GOLPH3L,GOSR1, IMPACT,CFAP97,LMBR1,POC1B,PRRC1,SLC33A1,SLC39A9, SPIN1,SRP72,TM9SF2,TMED10,TMED2,TMEM181,VPS4B |
 |
|
| AP3B1,CANX,CNOT6,DCTN4,DDX46,DNAJC3,ETF1, FAF2,FBXW11,G3BP1,HSP90B1,LYSMD3,MATR3,MFAP3, PRRC1,RBM22,RBM27,SLC30A5,SSR3,STT3A,TMED7 | ARCN1,CAND1,CANX,CAPRIN1,CCT6A,CPSF2,CSE1L, GMPS,HNRNPR,HSP90B1,HSPA5,HSPD1,PDIA3,PDIA3P1, PDIA6,RARS,SSR1,UBQLN1,USO1,XRCC5,ZW10 |
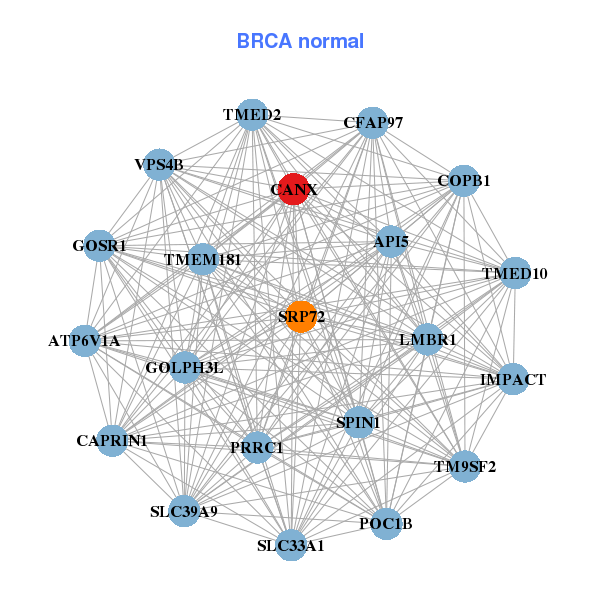
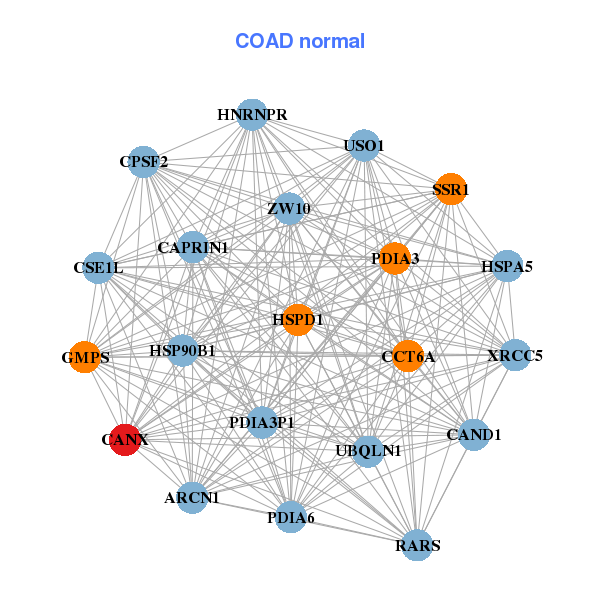
| * Co-Expression network figures were drawn using R package igraph. Only the top 20 genes with the highest correlations were shown. Red circle: input gene, orange circle: cell metabolism gene, sky circle: other gene |
: Open all plots for all cancer types
| Top |
: Open all interacting genes' information including KEGG pathway for all interacting genes from DAVID
| Top |
| Pharmacological Information for CANX |
| There's no related Drug. |
| Top |
| Cross referenced IDs for CANX |
| * We obtained these cross-references from Uniprot database. It covers 150 different DBs, 18 categories. http://www.uniprot.org/help/cross_references_section |
: Open all cross reference information
|
Copyright © 2016-Present - The Univsersity of Texas Health Science Center at Houston @ |