|
||||||||||||||||||||
| |
| Phenotypic Information (metabolism pathway, cancer, disease, phenome) |
| |
| |
| Gene-Gene Network Information: Co-Expression Network, Interacting Genes & KEGG |
| |
|


| Gene Summary for USP11 |
| Basic gene info. | Gene symbol | USP11 |
| Gene name | ubiquitin specific peptidase 11 | |
| Synonyms | UHX1 | |
| Cytomap | UCSC genome browser: Xp11.23 | |
| Genomic location | chrX :47092313-47107727 | |
| Type of gene | protein-coding | |
| RefGenes | NM_004651.3, | |
| Ensembl id | ENSG00000102226 | |
| Description | deubiquitinating enzyme 11ubiquitin carboxyl-terminal hydrolase 11ubiquitin carboxyl-terminal hydrolase, X-linkedubiquitin thioesterase 11ubiquitin thiolesterase 11ubiquitin-specific processing protease 11ubiquitin-specific-processing protease 11 | |
| Modification date | 20141207 | |
| dbXrefs | MIM : 300050 | |
| HGNC : HGNC | ||
| Ensembl : ENSG00000102226 | ||
| HPRD : 02081 | ||
| Vega : OTTHUMG00000021437 | ||
| Protein | UniProt: P51784 go to UniProt's Cross Reference DB Table | |
| Expression | CleanEX: HS_USP11 | |
| BioGPS: 8237 | ||
| Gene Expression Atlas: ENSG00000102226 | ||
| The Human Protein Atlas: ENSG00000102226 | ||
| Pathway | NCI Pathway Interaction Database: USP11 | |
| KEGG: USP11 | ||
| REACTOME: USP11 | ||
| ConsensusPathDB | ||
| Pathway Commons: USP11 | ||
| Metabolism | MetaCyc: USP11 | |
| HUMANCyc: USP11 | ||
| Regulation | Ensembl's Regulation: ENSG00000102226 | |
| miRBase: chrX :47,092,313-47,107,727 | ||
| TargetScan: NM_004651 | ||
| cisRED: ENSG00000102226 | ||
| Context | iHOP: USP11 | |
| cancer metabolism search in PubMed: USP11 | ||
| UCL Cancer Institute: USP11 | ||
| Assigned class in ccmGDB | B - This gene belongs to cancer gene. | |
| Top |
| Phenotypic Information for USP11(metabolism pathway, cancer, disease, phenome) |
| Cancer | CGAP: USP11 |
| Familial Cancer Database: USP11 | |
| * This gene is included in those cancer gene databases. |
|
|
|
|
|
| . | ||||||||||||||
Oncogene 1 | Significant driver gene in | |||||||||||||||||||
| cf) number; DB name 1 Oncogene; http://nar.oxfordjournals.org/content/35/suppl_1/D721.long, 2 Tumor Suppressor gene; https://bioinfo.uth.edu/TSGene/, 3 Cancer Gene Census; http://www.nature.com/nrc/journal/v4/n3/abs/nrc1299.html, 4 CancerGenes; http://nar.oxfordjournals.org/content/35/suppl_1/D721.long, 5 Network of Cancer Gene; http://ncg.kcl.ac.uk/index.php, 1Therapeutic Vulnerabilities in Cancer; http://cbio.mskcc.org/cancergenomics/statius/ |
| REACTOME_METABOLISM_OF_PROTEINS | |
| OMIM | 300050; gene. |
| Orphanet | |
| Disease | KEGG Disease: USP11 |
| MedGen: USP11 (Human Medical Genetics with Condition) | |
| ClinVar: USP11 | |
| Phenotype | MGI: USP11 (International Mouse Phenotyping Consortium) |
| PhenomicDB: USP11 | |
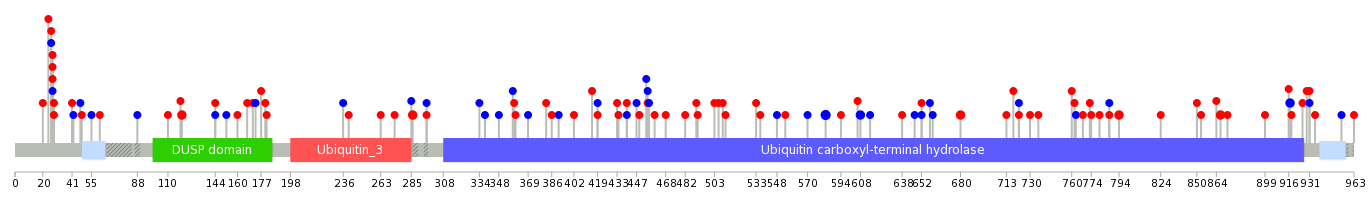
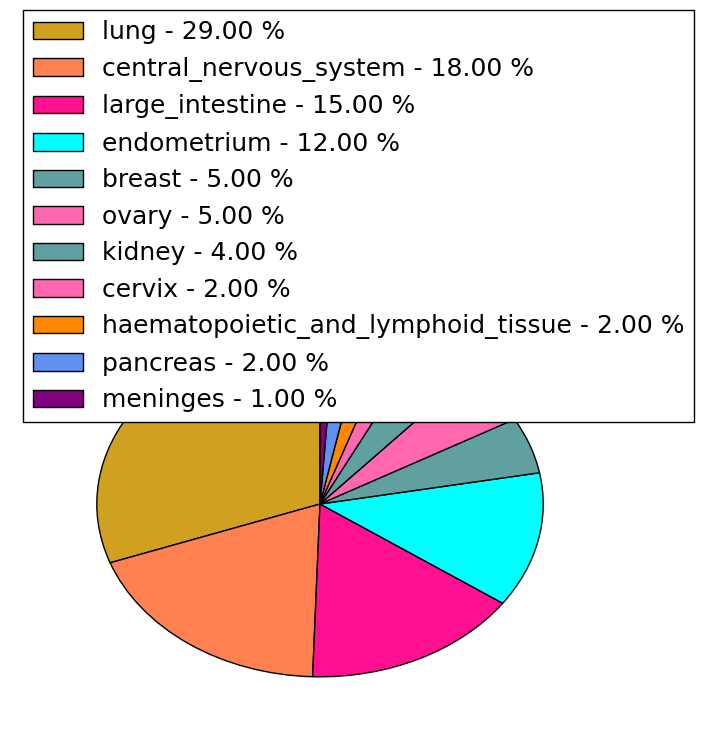
| Mutations for USP11 |
| * Under tables are showing count per each tissue to give us broad intuition about tissue specific mutation patterns.You can go to the detailed page for each mutation database's web site. |
| There's no structural variation information in COSMIC data for this gene. |
| * From mRNA Sanger sequences, Chitars2.0 arranged chimeric transcripts. This table shows USP11 related fusion information. |
| ID | Head Gene | Tail Gene | Accession | Gene_a | qStart_a | qEnd_a | Chromosome_a | tStart_a | tEnd_a | Gene_a | qStart_a | qEnd_a | Chromosome_a | tStart_a | tEnd_a |
| N29021 | USP11 | 1 | 167 | X | 47107334 | 47107501 | SAV1 | 164 | 479 | 14 | 51102019 | 51111547 | |
| DA220924 | ASAP2 | 24 | 174 | 2 | 9484859 | 9491016 | USP11 | 175 | 494 | X | 47092424 | 47098764 | |
| AI497670 | USP11 | 22 | 287 | X | 47107462 | 47107727 | PRODH | 282 | 345 | 22 | 18913475 | 18913538 | |
| T74731 | USP11 | 1 | 189 | X | 47107352 | 47107542 | SIRPA | 177 | 417 | 20 | 1918906 | 1919143 | |
| CA312751 | USP11 | 74 | 331 | X | 47107010 | 47107358 | DYNC2H1 | 314 | 337 | 11 | 103336082 | 103336206 | |
| AW955052 | USP11 | 1 | 52 | X | 47107298 | 47107349 | USP11 | 51 | 349 | X | 47104451 | 47106621 | |
| AA322974 | USP11 | 1 | 53 | X | 47107298 | 47107350 | USP11 | 52 | 168 | X | 47104451 | 47104850 | |
| AW849407 | USP11 | 1 | 209 | X | 47099037 | 47099245 | USP11 | 203 | 357 | X | 47101478 | 47101632 | |
| T07607 | PRR14L | 1 | 113 | 22 | 32078884 | 32078996 | USP11 | 114 | 324 | X | 47104299 | 47104883 | |
| CD517199 | USP11 | 1 | 108 | X | 47106583 | 47106772 | USP11 | 103 | 280 | X | 47104465 | 47106509 | |
| Top |
| There's no copy number variation information in COSMIC data for this gene. |
| Top |
|
 |
| Top |
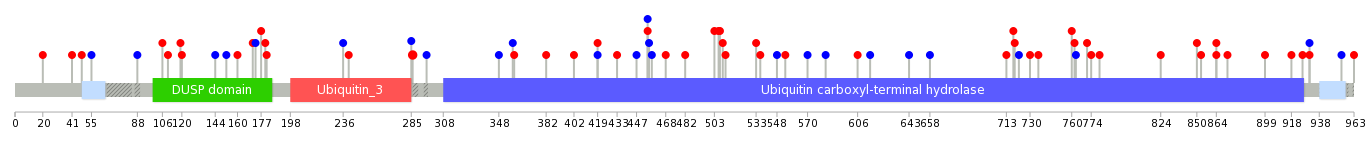
| Stat. for Non-Synonymous SNVs (# total SNVs=72) | (# total SNVs=35) |
 |  |
(# total SNVs=1) | (# total SNVs=1) |
 |  |
| Top |
| * When you move the cursor on each content, you can see more deailed mutation information on the Tooltip. Those are primary_site,primary_histology,mutation(aa),pubmedID. |
| GRCh37 position | Mutation(aa) | Unique sampleID count |
| chr23:47104414-47104414 | p.? | 3 |
| chr23:47102831-47102831 | p.G583G | 3 |
| chr23:47100994-47100994 | p.Q402* | 2 |
| chr23:47102906-47102906 | p.Y608Y | 2 |
| chr23:47098522-47098522 | p.G120E | 2 |
| chr23:47104146-47104146 | p.E680Q | 2 |
| chr23:47106753-47106753 | p.P867L | 2 |
| chr23:47107095-47107095 | p.I917I | 2 |
| chr23:47104863-47104863 | p.L794Q | 2 |
| chr23:47101492-47101492 | p.Q440H | 2 |
| Top |
|
 |
| Point Mutation/ Tissue ID | 1 | 2 | 3 | 4 | 5 | 6 | 7 | 8 | 9 | 10 | 11 | 12 | 13 | 14 | 15 | 16 | 17 | 18 | 19 | 20 |
| # sample | 3 | 4 | 14 | 1 | 1 | 2 | 1 | 8 | 6 | 2 | 6 | 7 | 12 | |||||||
| # mutation | 3 | 4 | 13 | 1 | 1 | 2 | 1 | 8 | 6 | 2 | 6 | 8 | 17 | |||||||
| nonsynonymous SNV | 1 | 3 | 7 | 1 | 1 | 2 | 1 | 6 | 4 | 2 | 6 | 6 | 7 | |||||||
| synonymous SNV | 2 | 1 | 6 | 2 | 2 | 2 | 10 |
| cf) Tissue ID; Tissue type (1; BLCA[Bladder Urothelial Carcinoma], 2; BRCA[Breast invasive carcinoma], 3; CESC[Cervical squamous cell carcinoma and endocervical adenocarcinoma], 4; COAD[Colon adenocarcinoma], 5; GBM[Glioblastoma multiforme], 6; Glioma Low Grade, 7; HNSC[Head and Neck squamous cell carcinoma], 8; KICH[Kidney Chromophobe], 9; KIRC[Kidney renal clear cell carcinoma], 10; KIRP[Kidney renal papillary cell carcinoma], 11; LAML[Acute Myeloid Leukemia], 12; LUAD[Lung adenocarcinoma], 13; LUSC[Lung squamous cell carcinoma], 14; OV[Ovarian serous cystadenocarcinoma ], 15; PAAD[Pancreatic adenocarcinoma], 16; PRAD[Prostate adenocarcinoma], 17; SKCM[Skin Cutaneous Melanoma], 18:STAD[Stomach adenocarcinoma], 19:THCA[Thyroid carcinoma], 20:UCEC[Uterine Corpus Endometrial Carcinoma]) |
| Top |
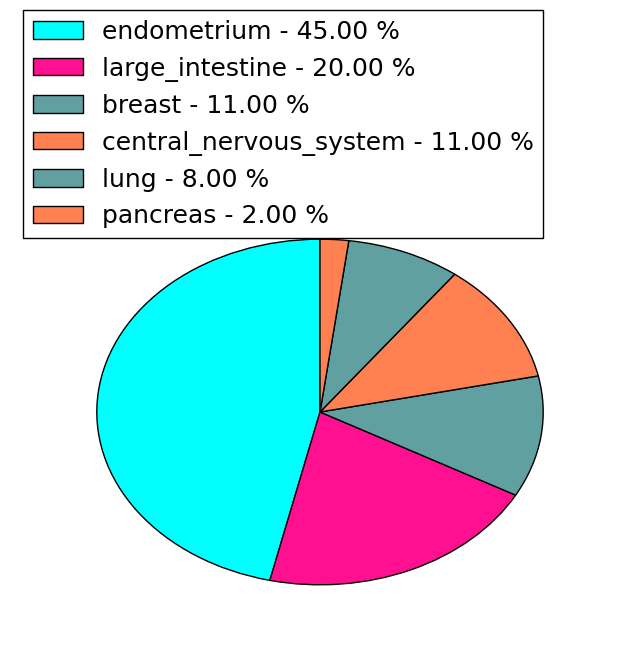
| * We represented just top 10 SNVs. When you move the cursor on each content, you can see more deailed mutation information on the Tooltip. Those are primary_site, primary_histology, mutation(aa), pubmedID. |
| Genomic Position | Mutation(aa) | Unique sampleID count |
| chrX:47100031 | p.A286T | 2 |
| chrX:47103906 | p.V419M | 1 |
| chrX:47099757 | p.S536L | 1 |
| chrX:47104794 | p.E762K | 1 |
| chrX:47101088 | p.P954P | 1 |
| chrX:47101698 | p.A160T | 1 |
| chrX:47107215 | p.V419V | 1 |
| chrX:47098522 | p.H548H | 1 |
| chrX:47104082 | p.G763G | 1 |
| chrX:47100030 | p.N963Y | 1 |
| * Copy number data were extracted from TCGA using R package TCGA-Assembler. The URLs of all public data files on TCGA DCC data server were gathered on Jan-05-2015. Function ProcessCNAData in TCGA-Assembler package was used to obtain gene-level copy number value which is calculated as the average copy number of the genomic region of a gene. |
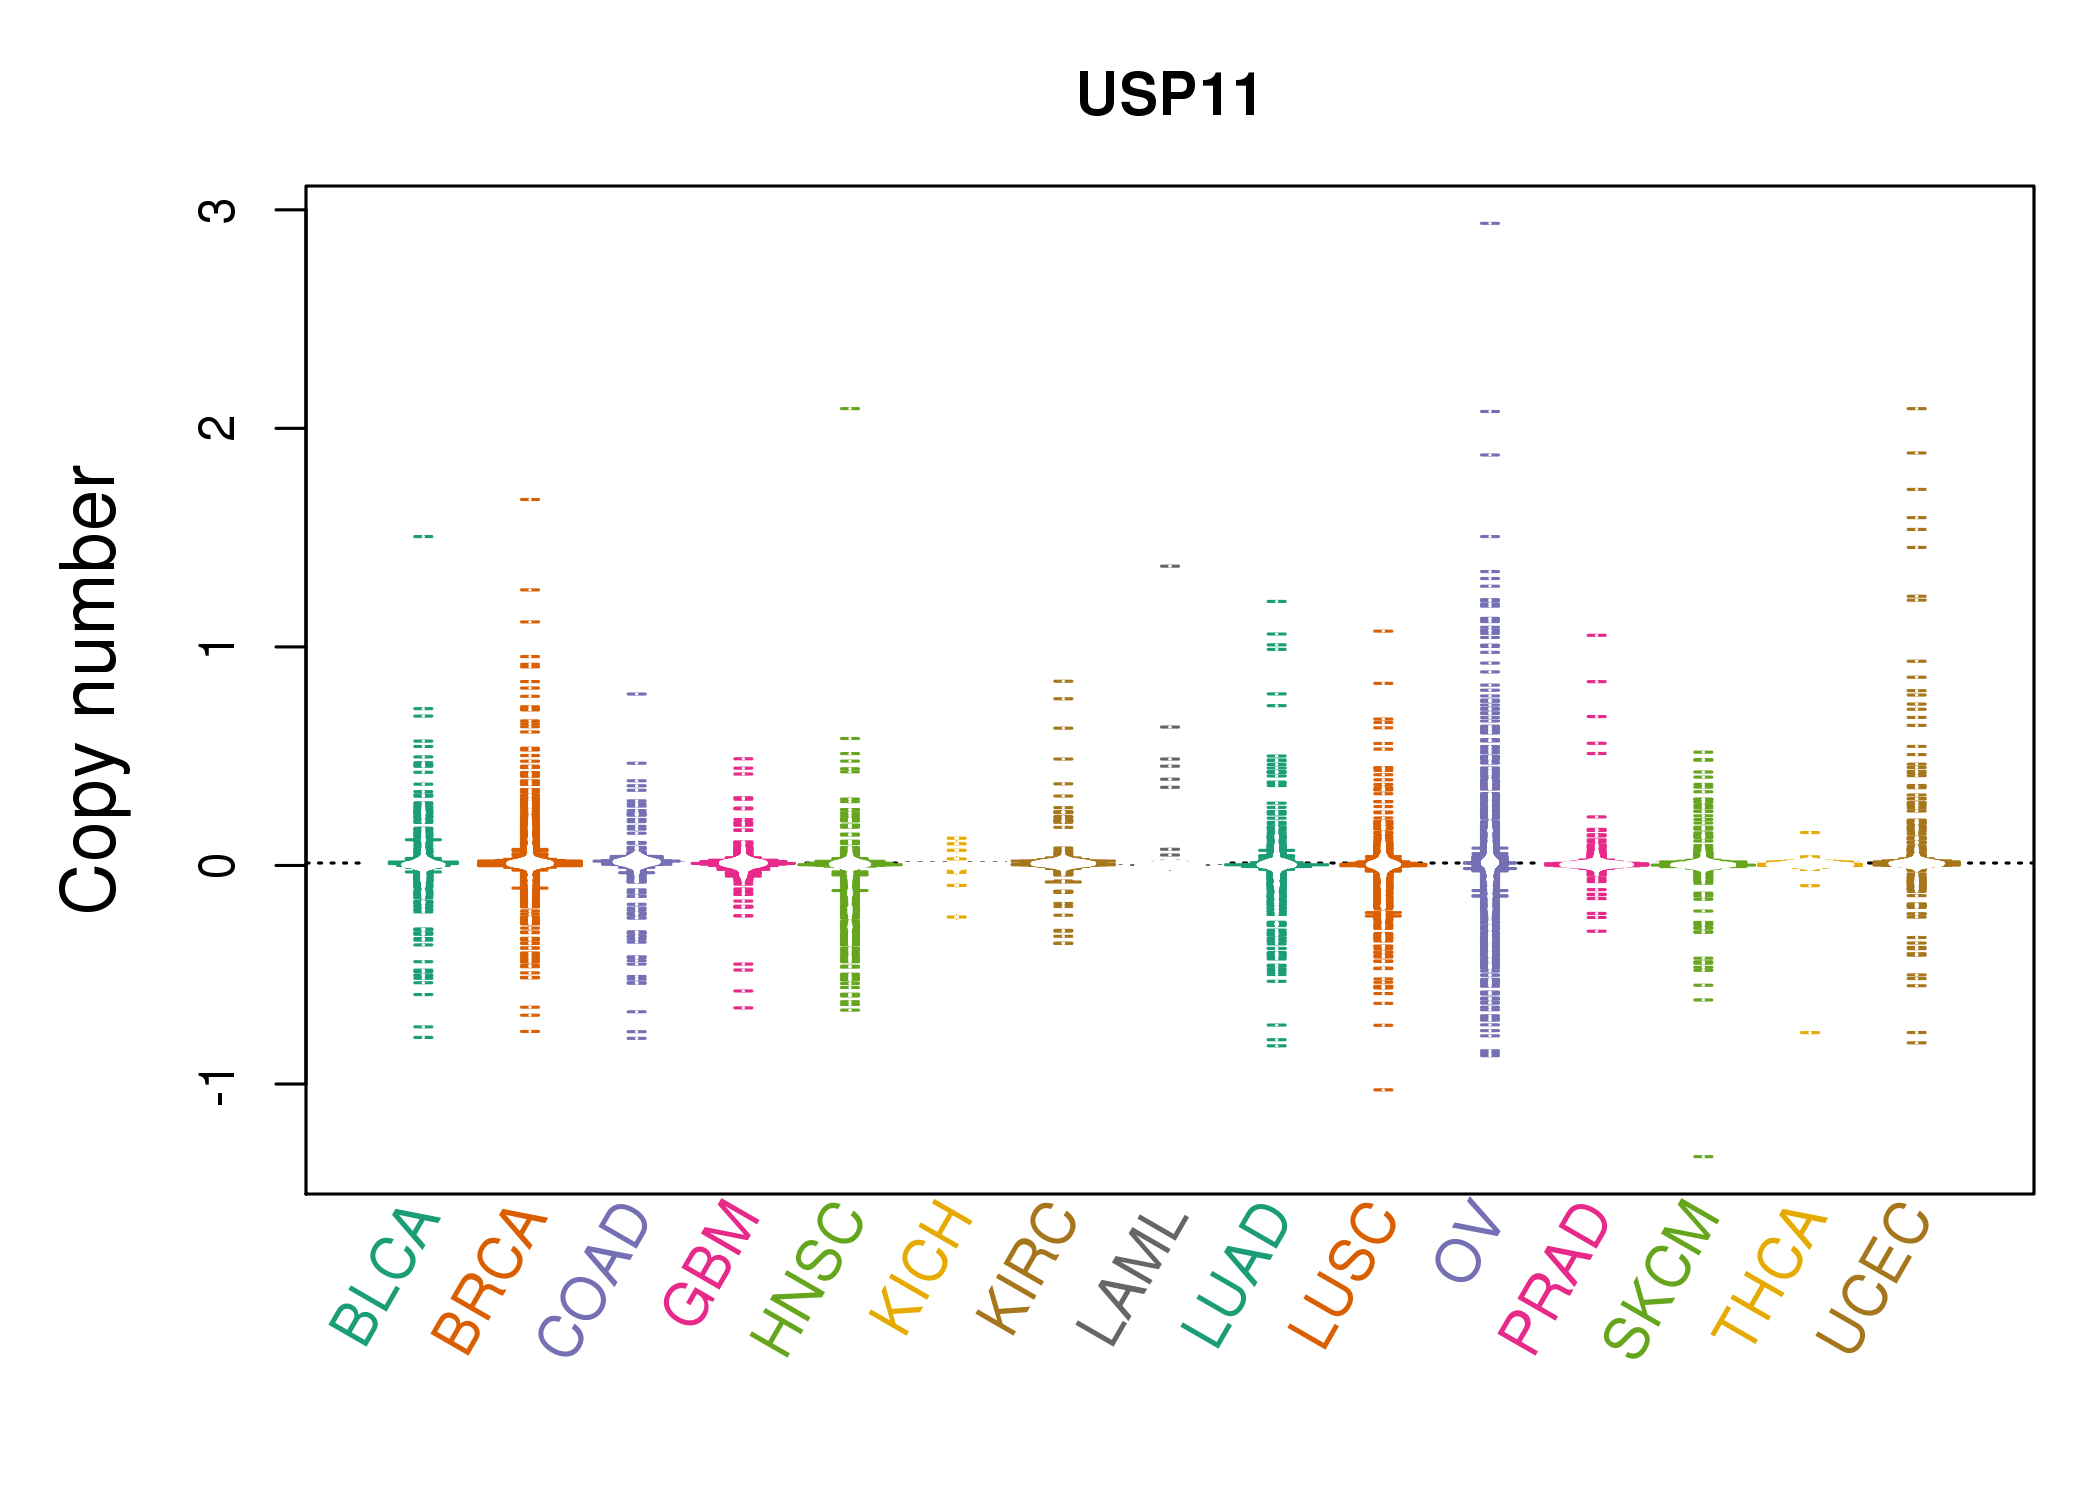 |
| cf) Tissue ID[Tissue type]: BLCA[Bladder Urothelial Carcinoma], BRCA[Breast invasive carcinoma], CESC[Cervical squamous cell carcinoma and endocervical adenocarcinoma], COAD[Colon adenocarcinoma], GBM[Glioblastoma multiforme], Glioma Low Grade, HNSC[Head and Neck squamous cell carcinoma], KICH[Kidney Chromophobe], KIRC[Kidney renal clear cell carcinoma], KIRP[Kidney renal papillary cell carcinoma], LAML[Acute Myeloid Leukemia], LUAD[Lung adenocarcinoma], LUSC[Lung squamous cell carcinoma], OV[Ovarian serous cystadenocarcinoma ], PAAD[Pancreatic adenocarcinoma], PRAD[Prostate adenocarcinoma], SKCM[Skin Cutaneous Melanoma], STAD[Stomach adenocarcinoma], THCA[Thyroid carcinoma], UCEC[Uterine Corpus Endometrial Carcinoma] |
| Top |
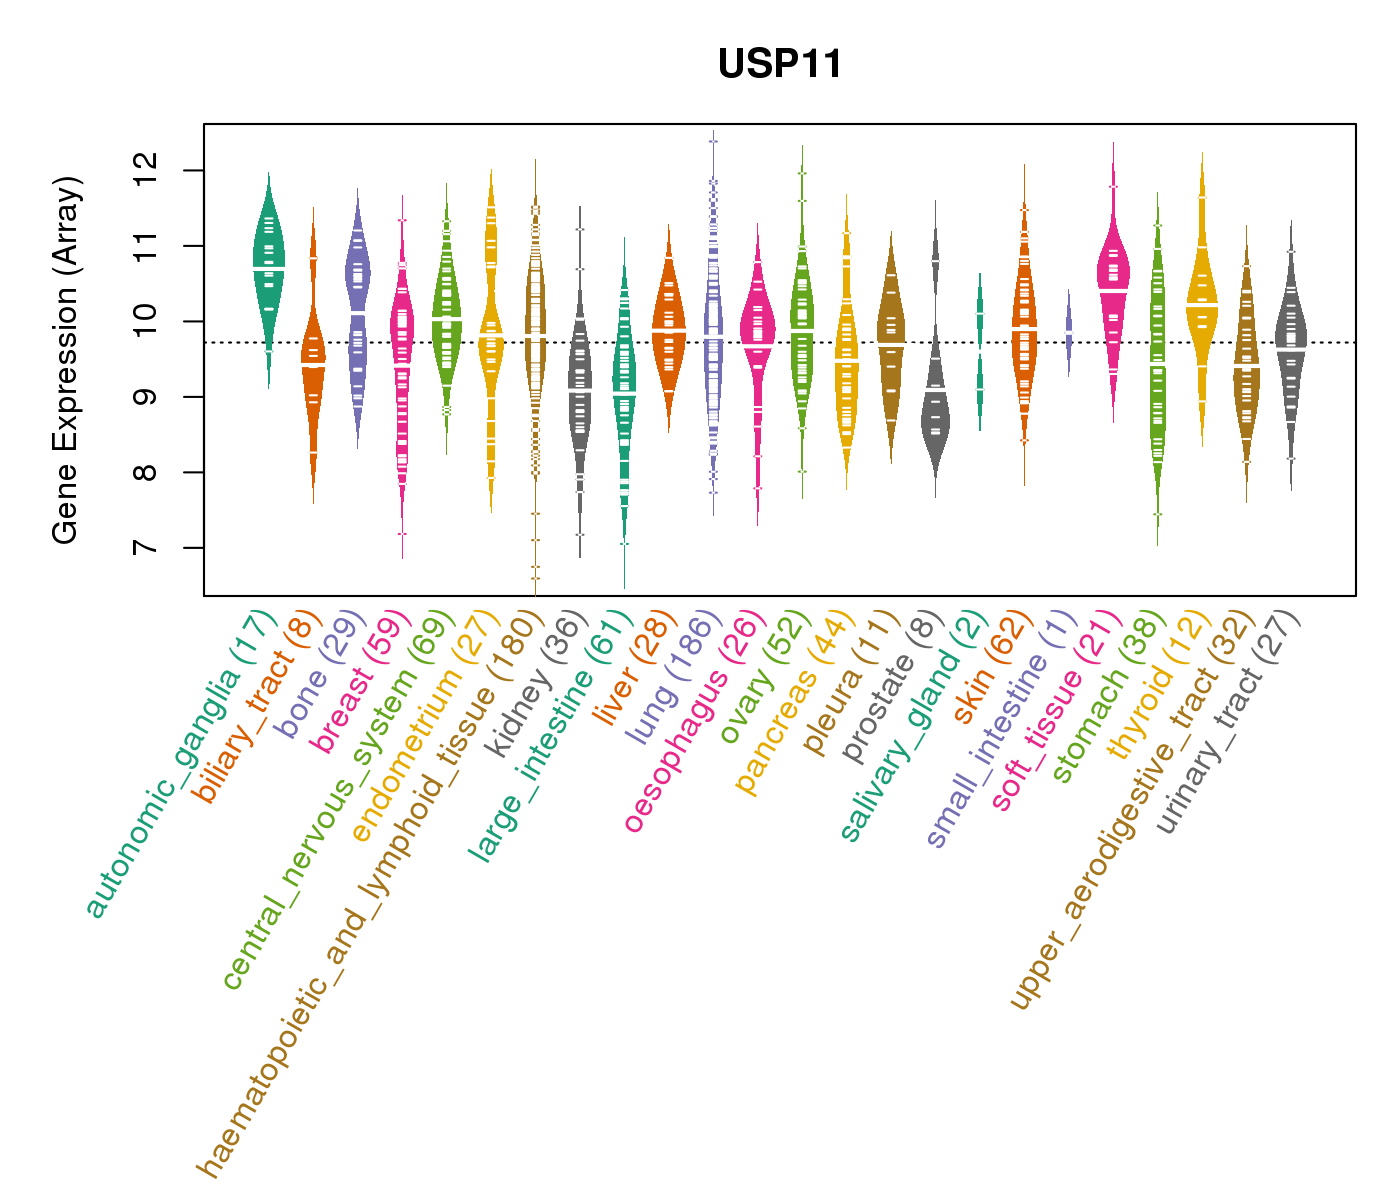
| Gene Expression for USP11 |
| * CCLE gene expression data were extracted from CCLE_Expression_Entrez_2012-10-18.res: Gene-centric RMA-normalized mRNA expression data. |
 |
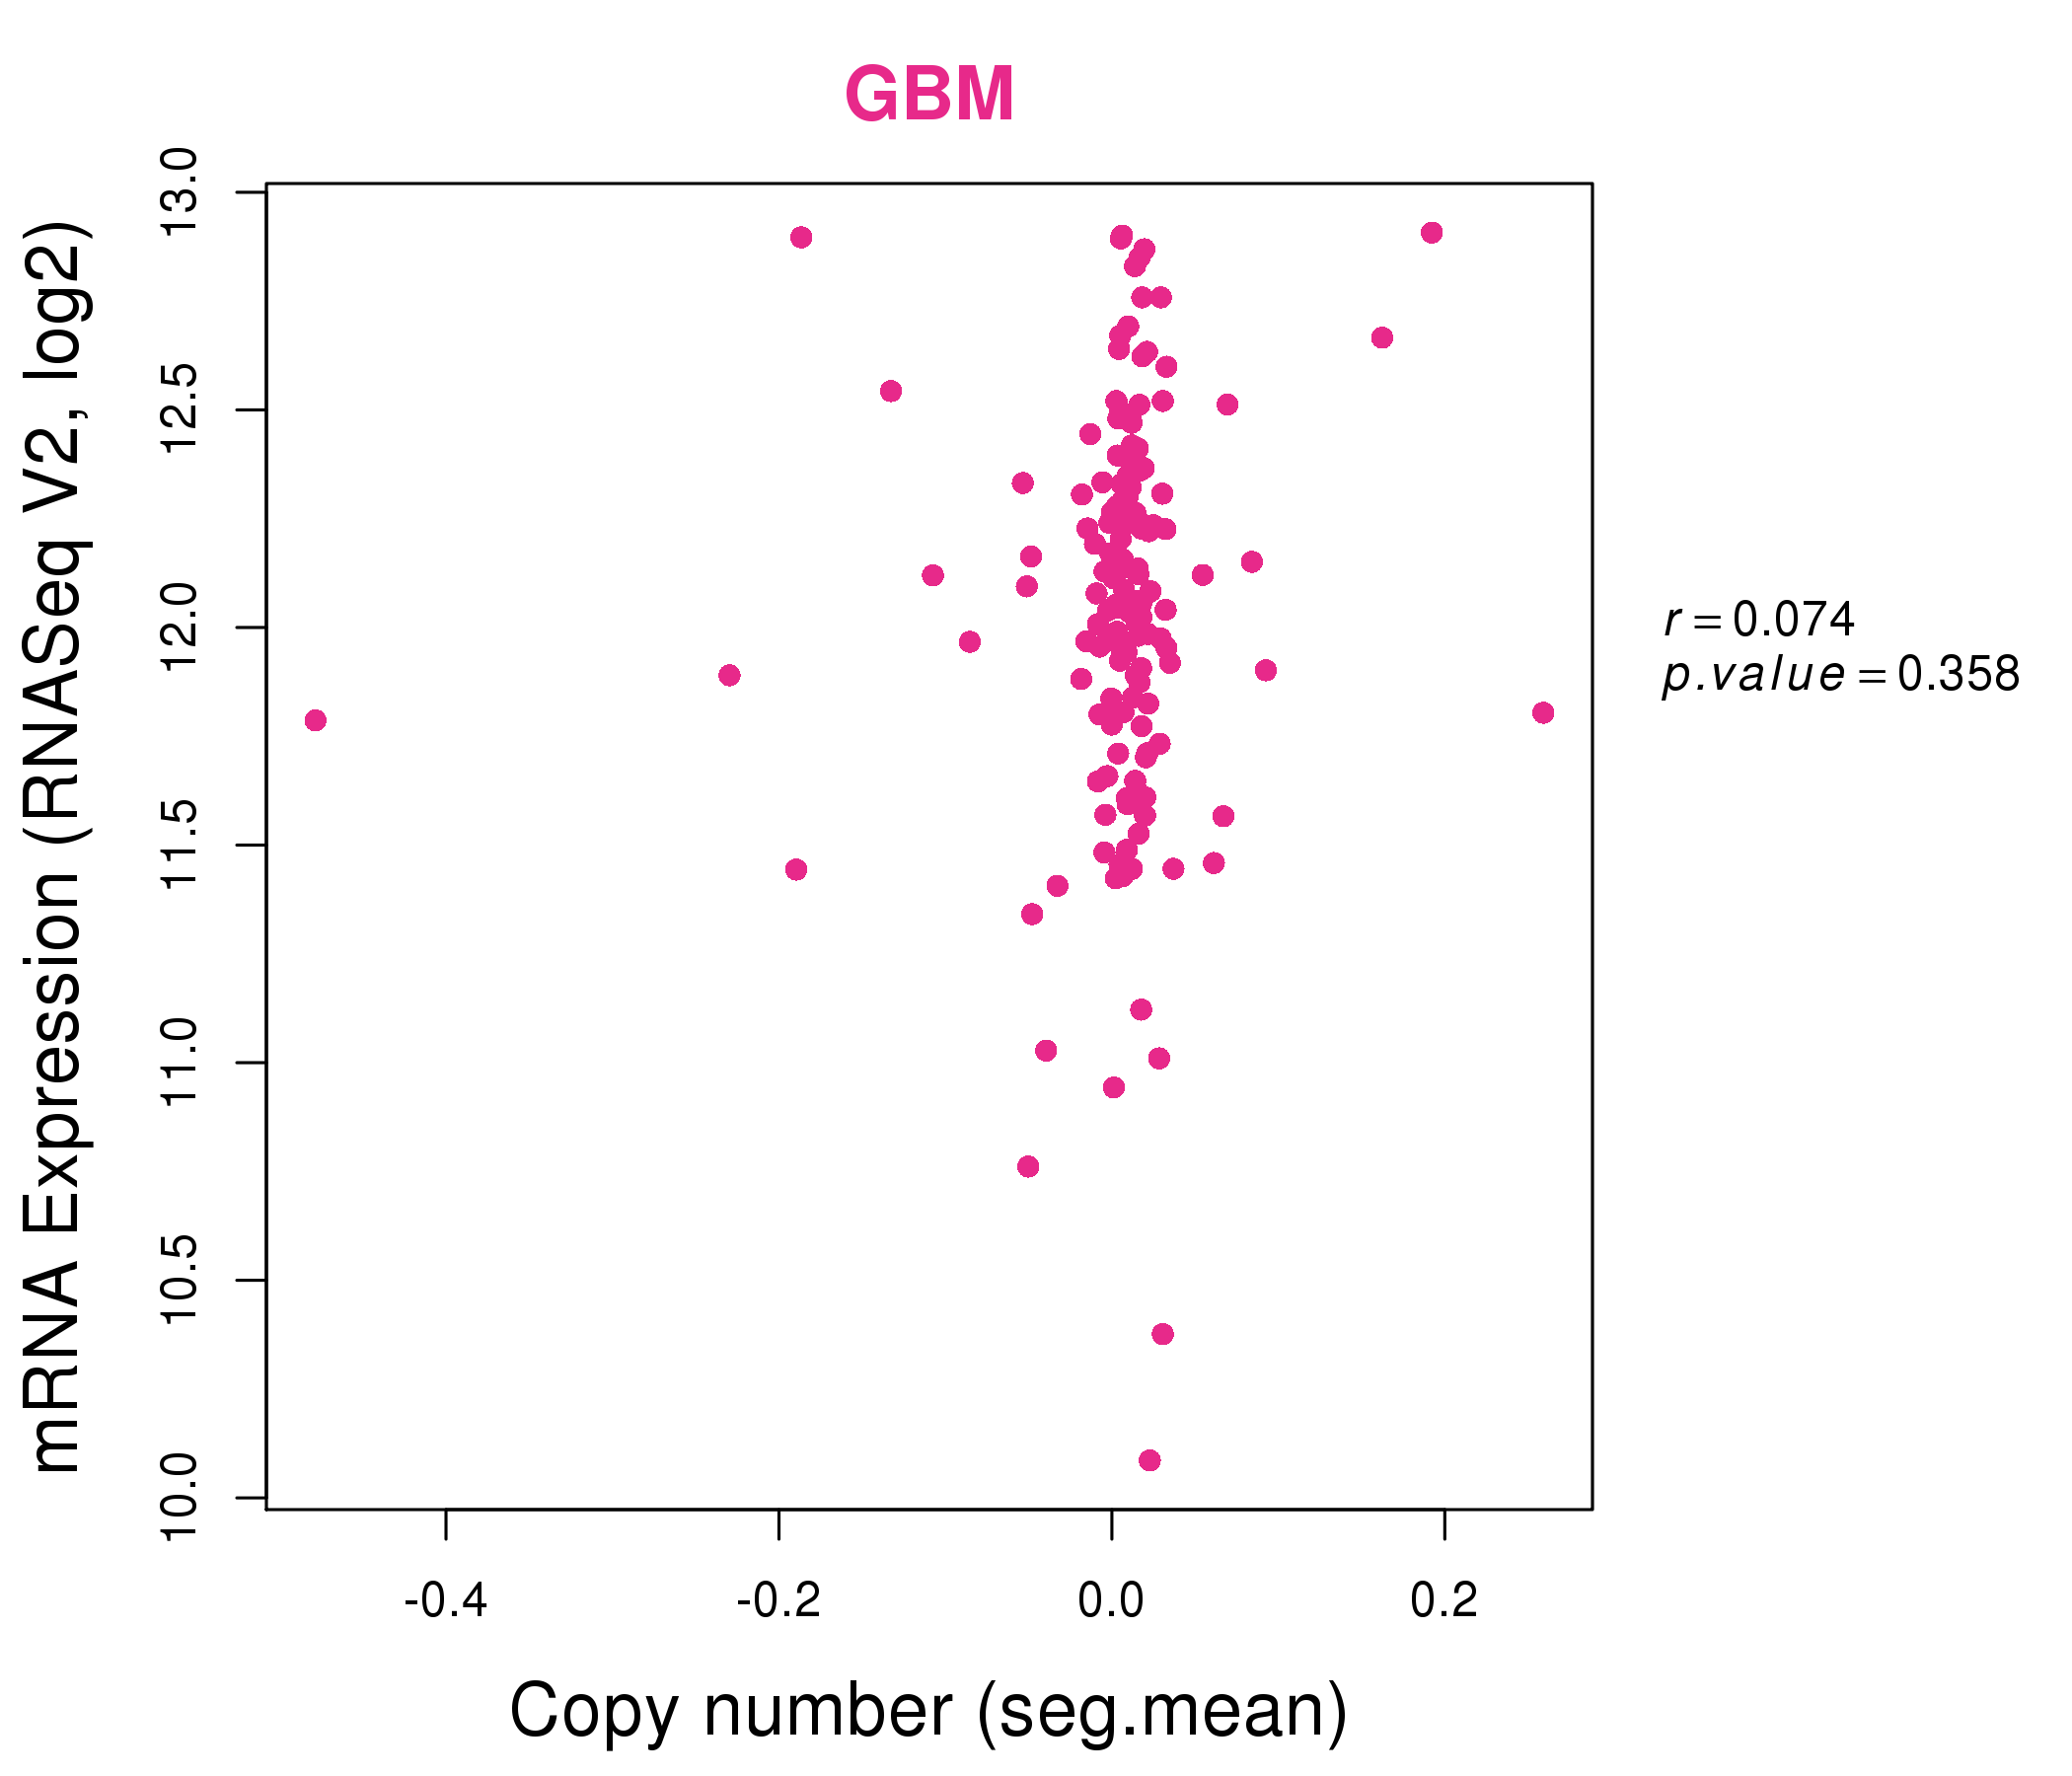
| * Normalized gene expression data of RNASeqV2 was extracted from TCGA using R package TCGA-Assembler. The URLs of all public data files on TCGA DCC data server were gathered at Jan-05-2015. Only eight cancer types have enough normal control samples for differential expression analysis. (t test, adjusted p<0.05 (using Benjamini-Hochberg FDR)) |
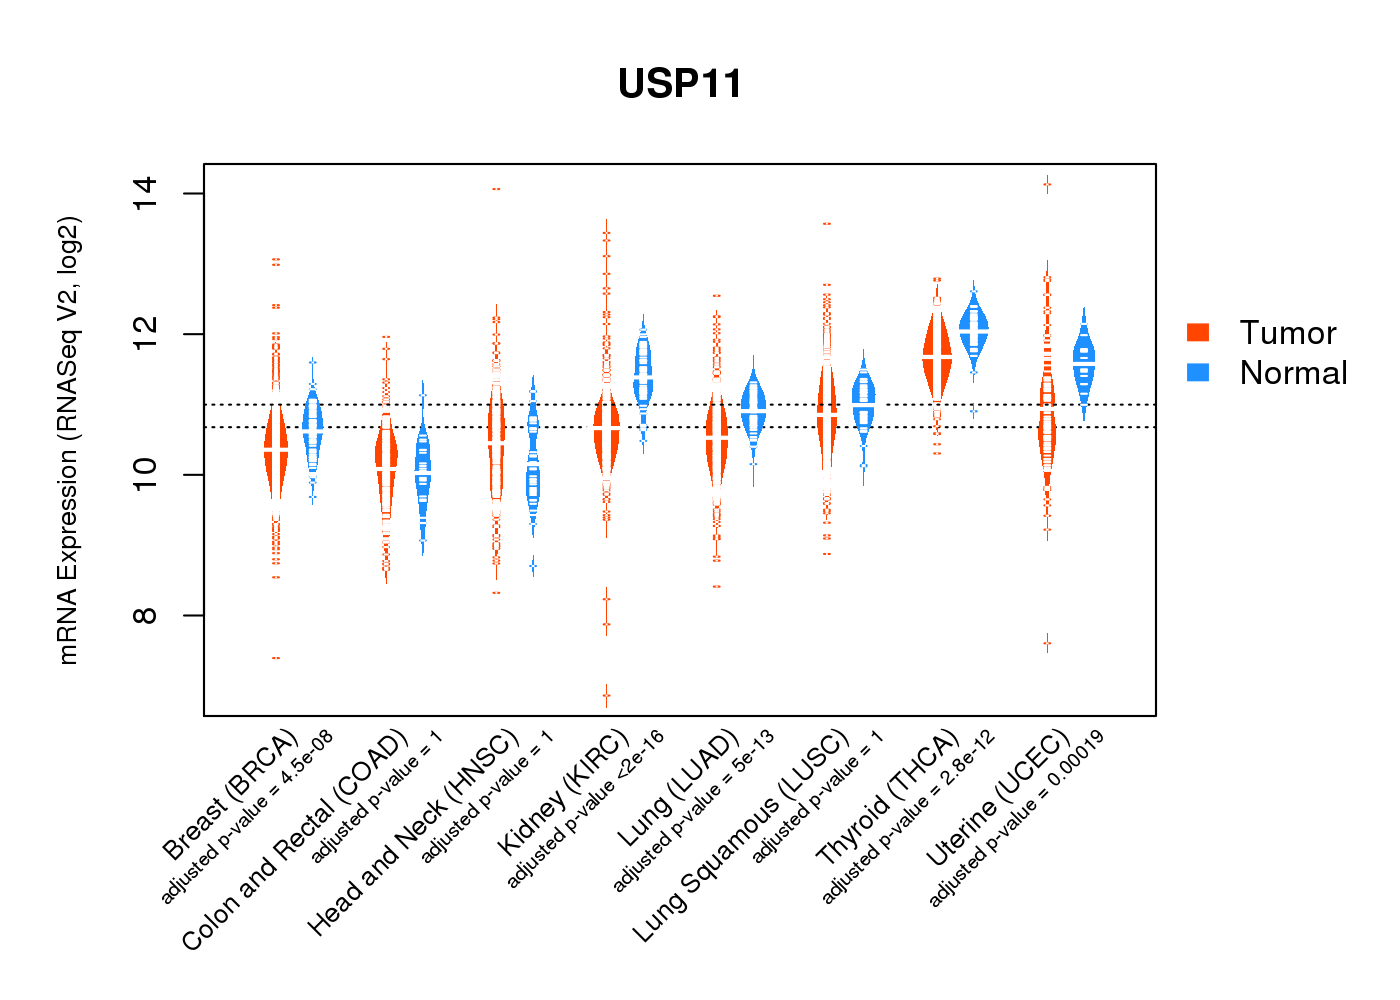 |
| Top |
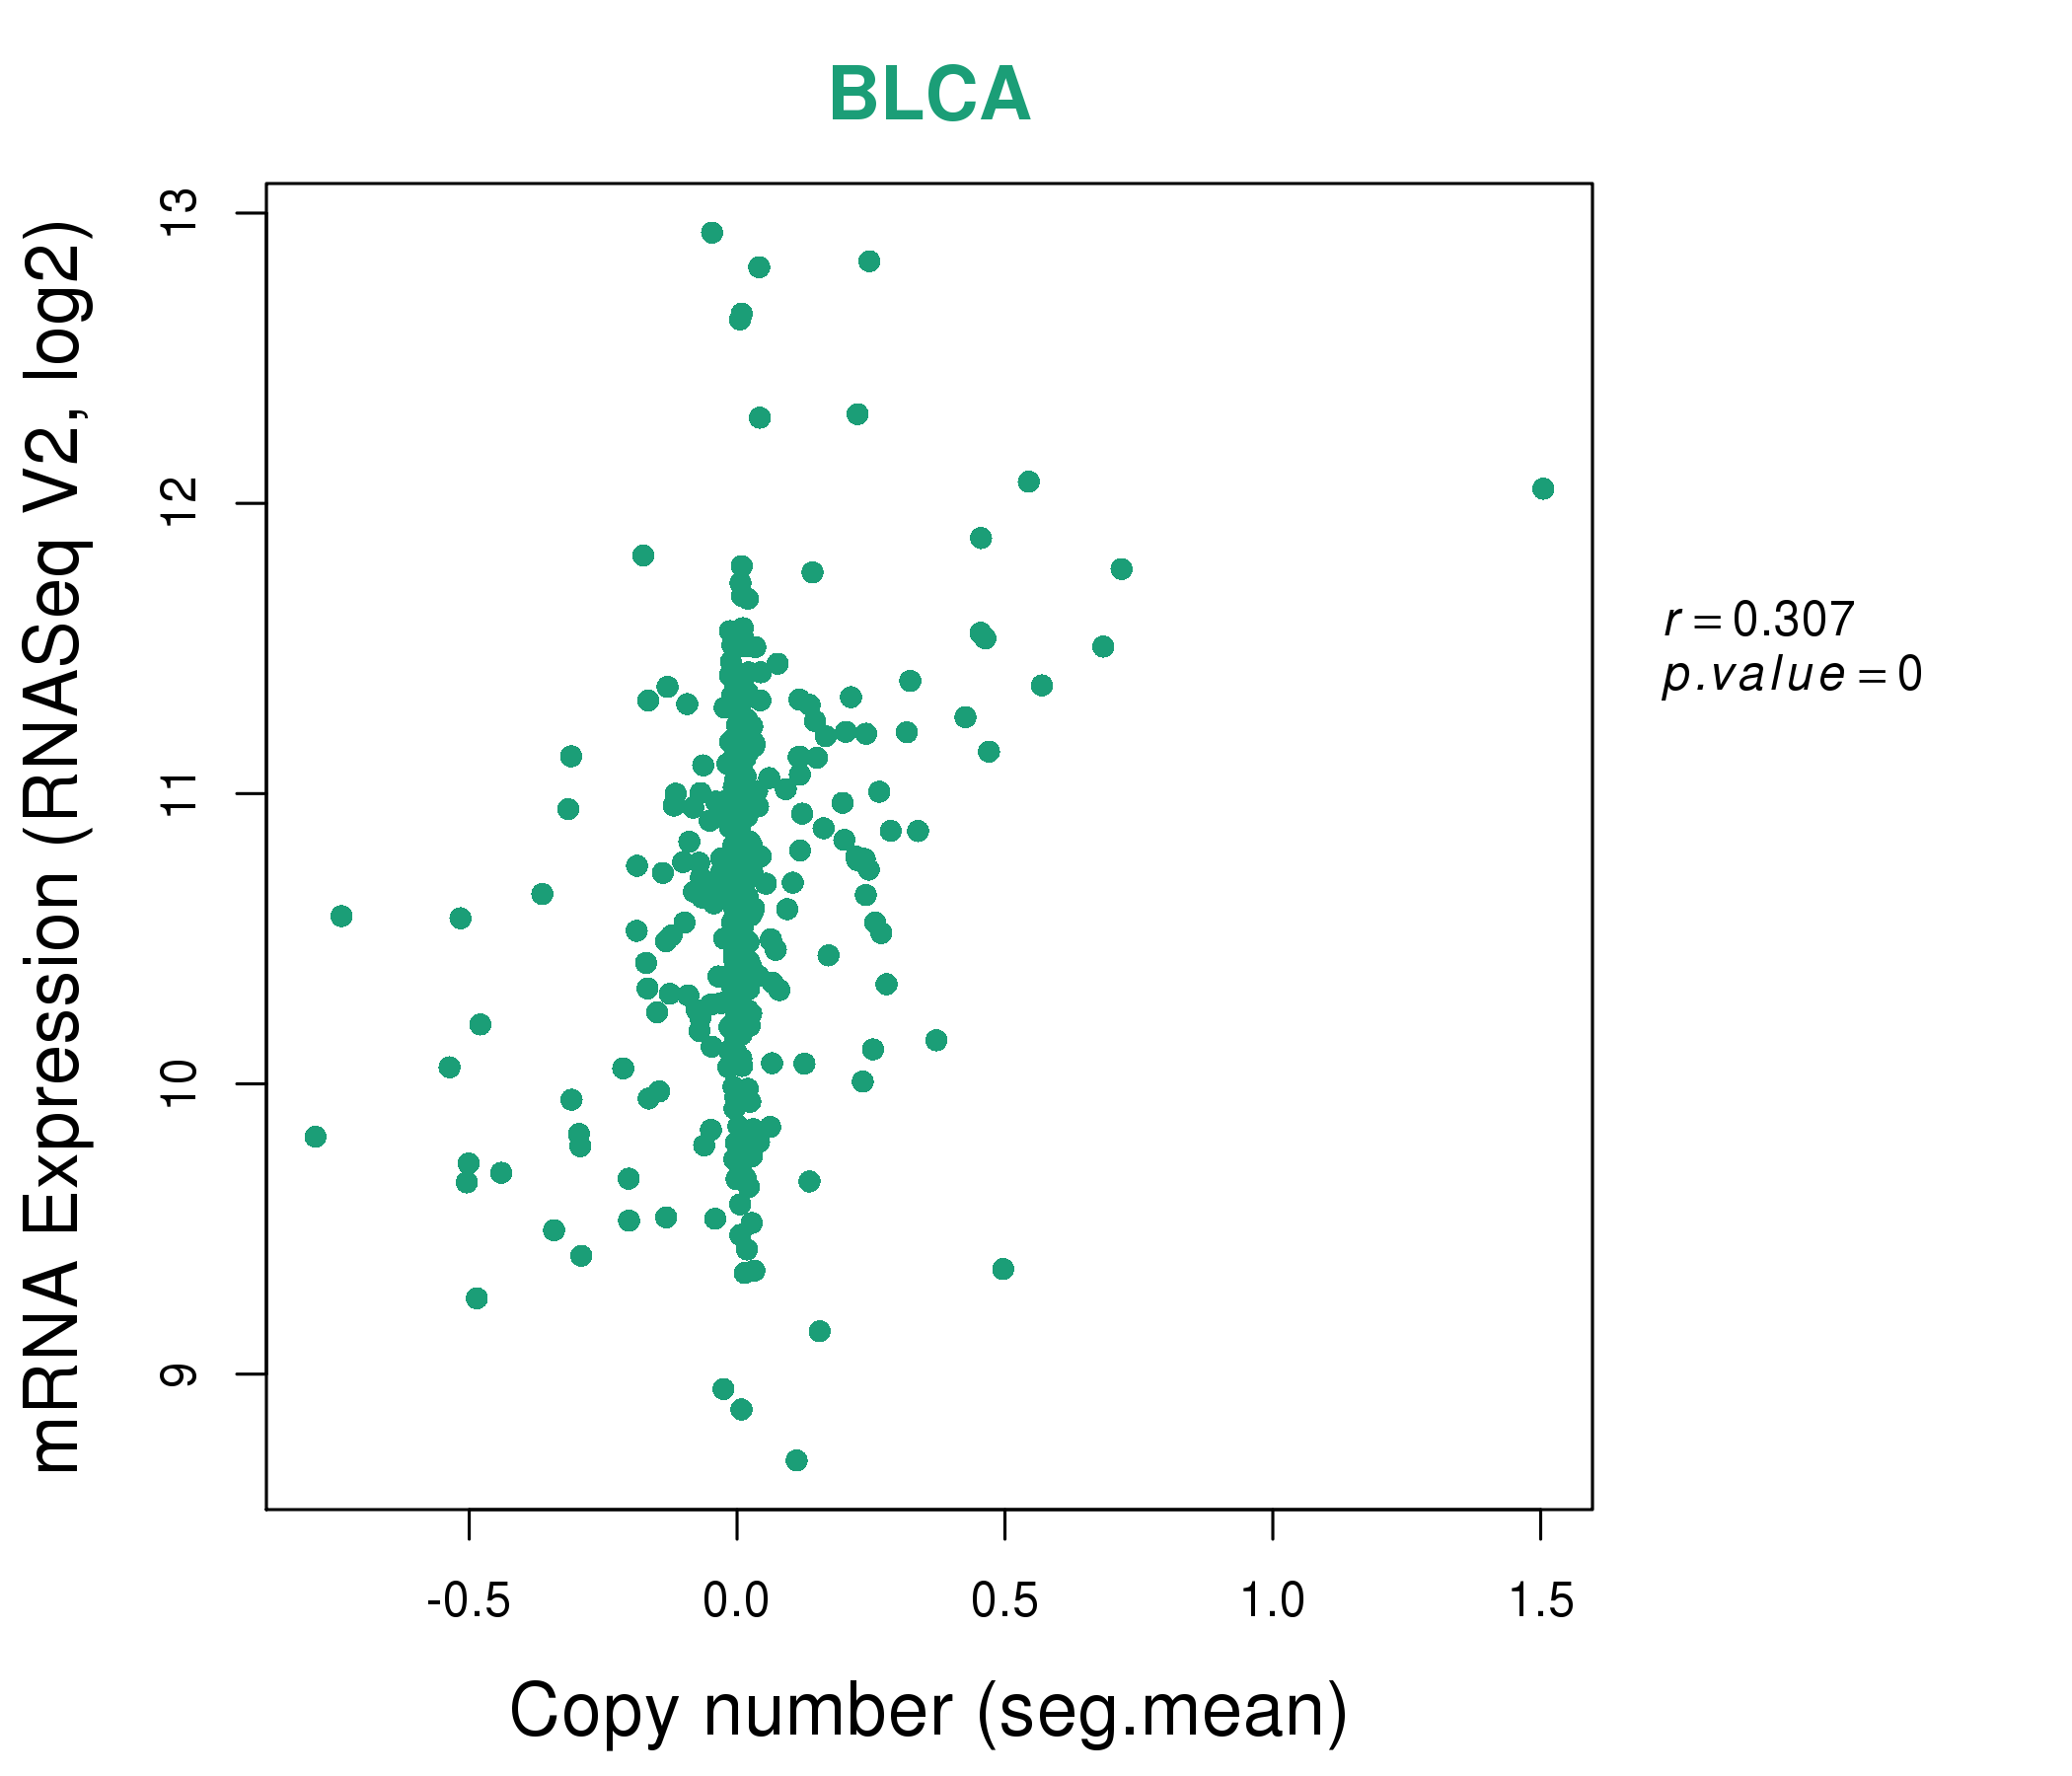
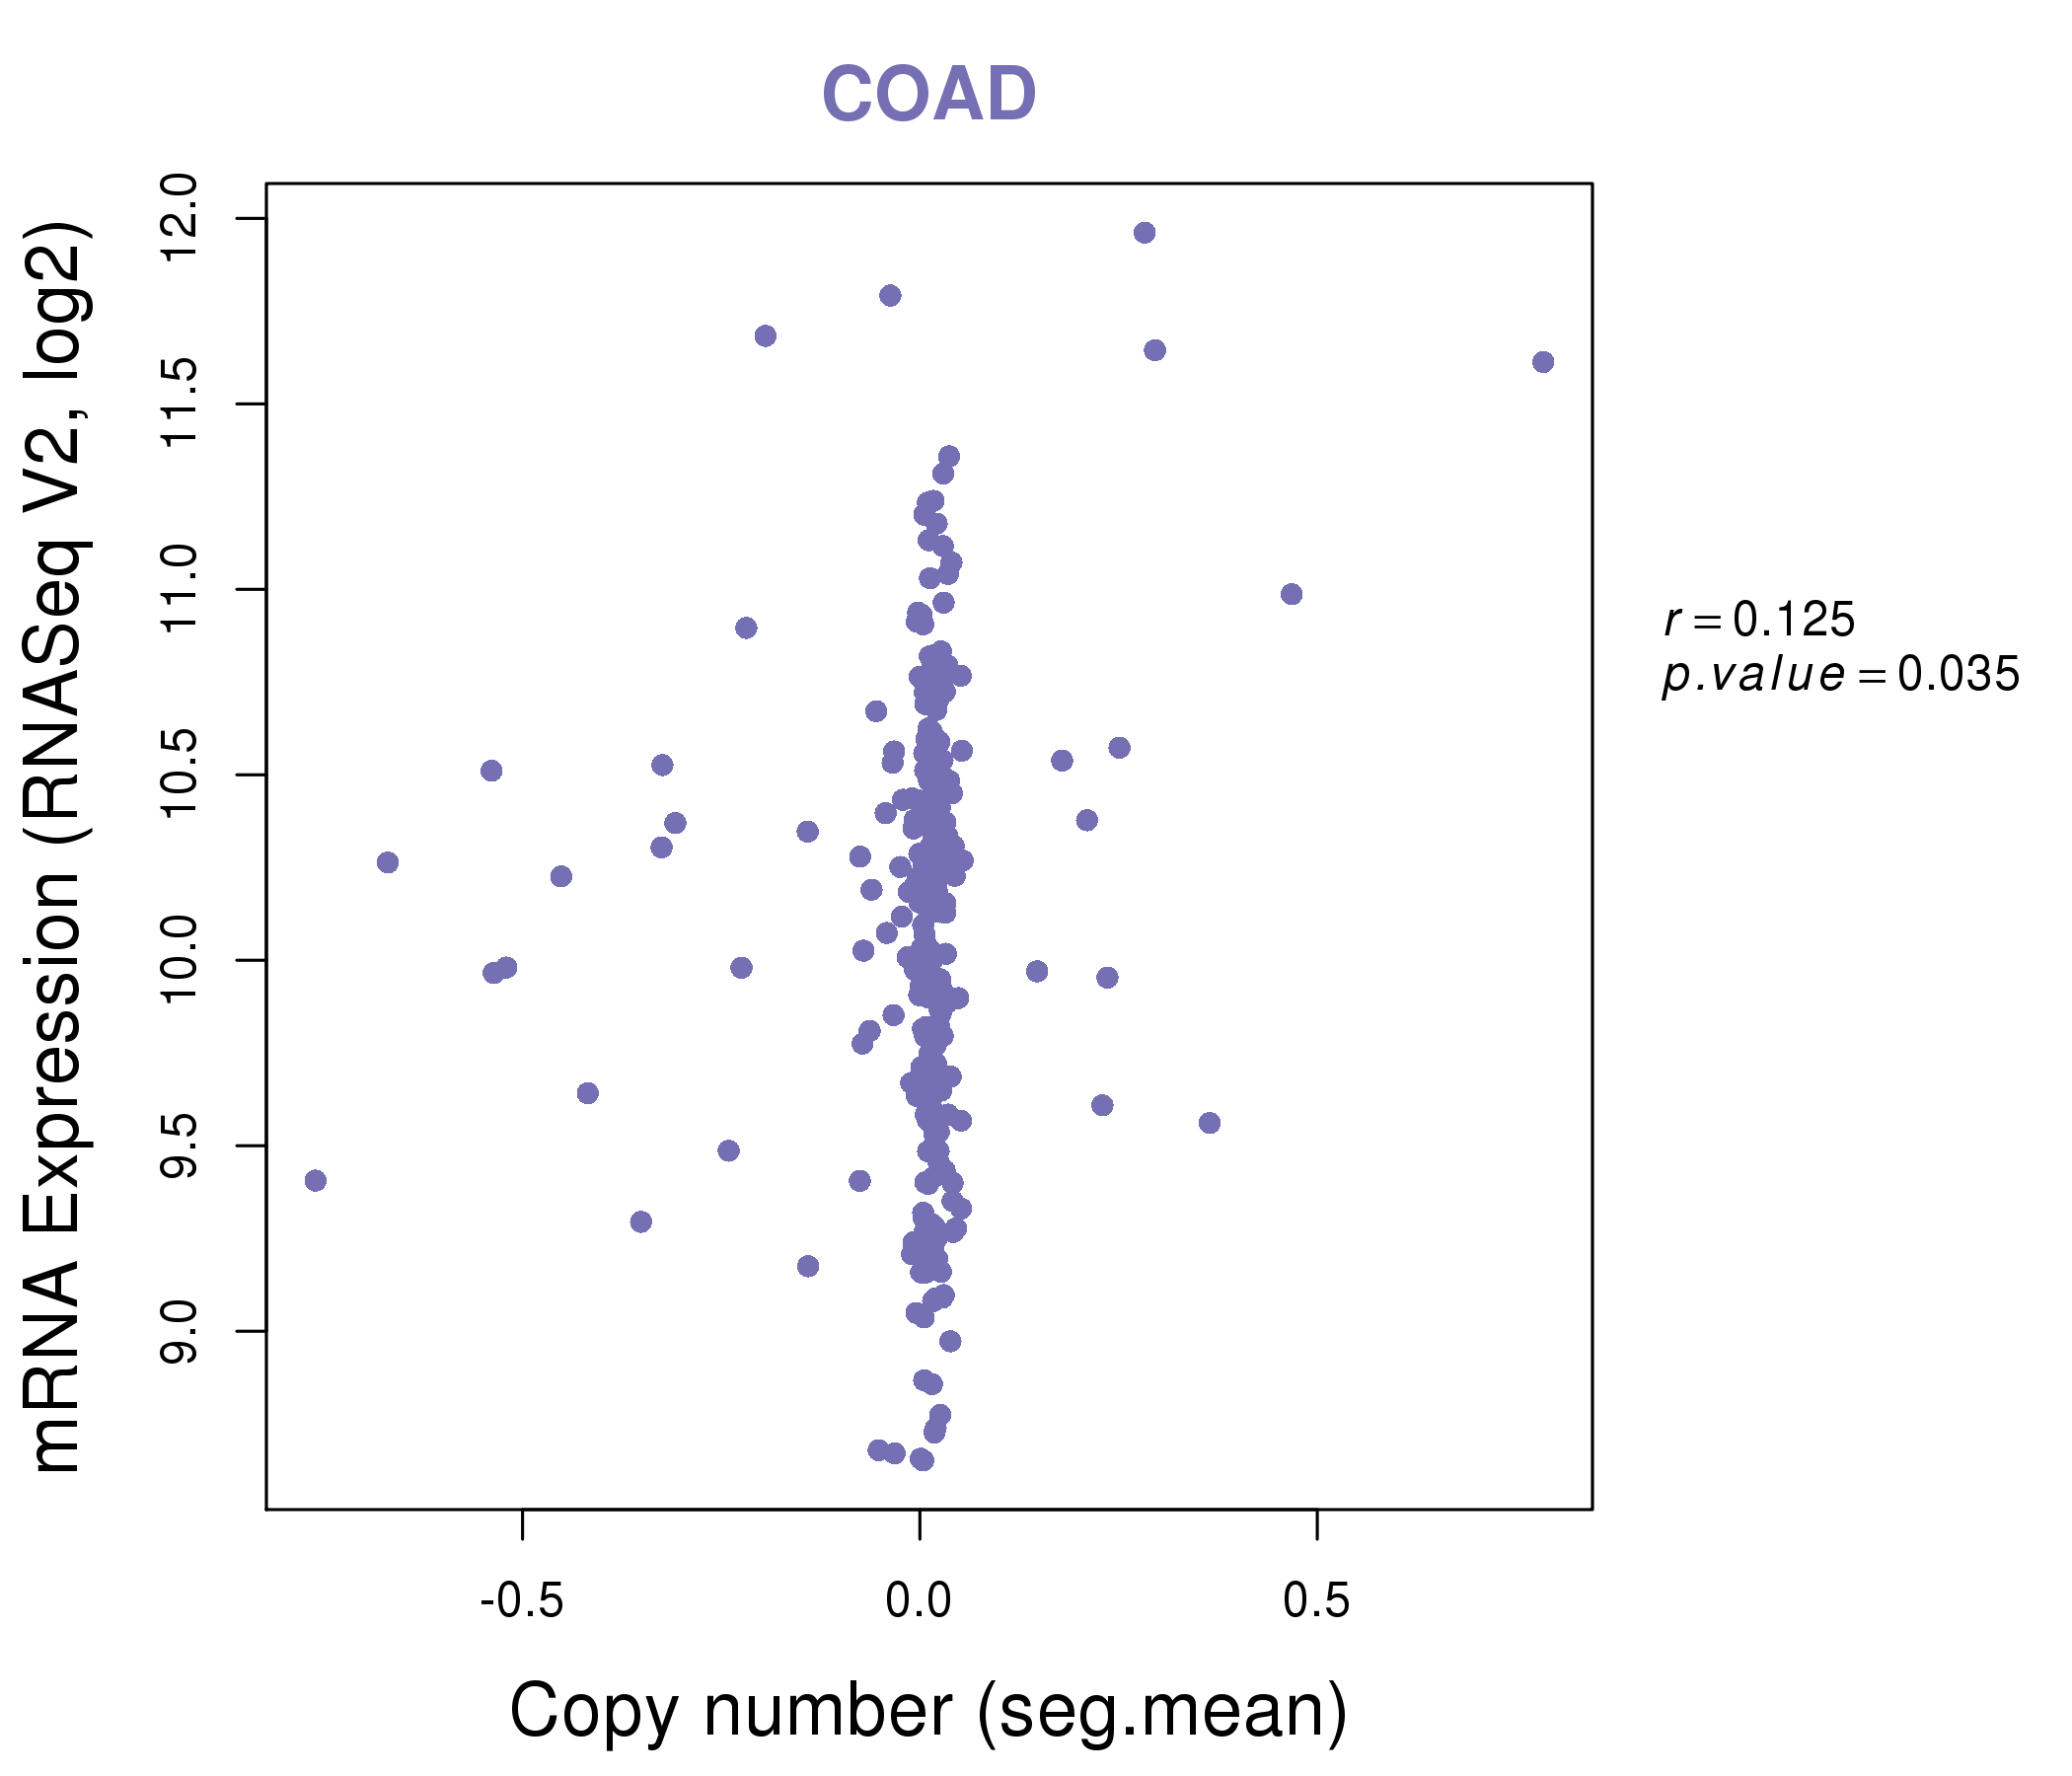
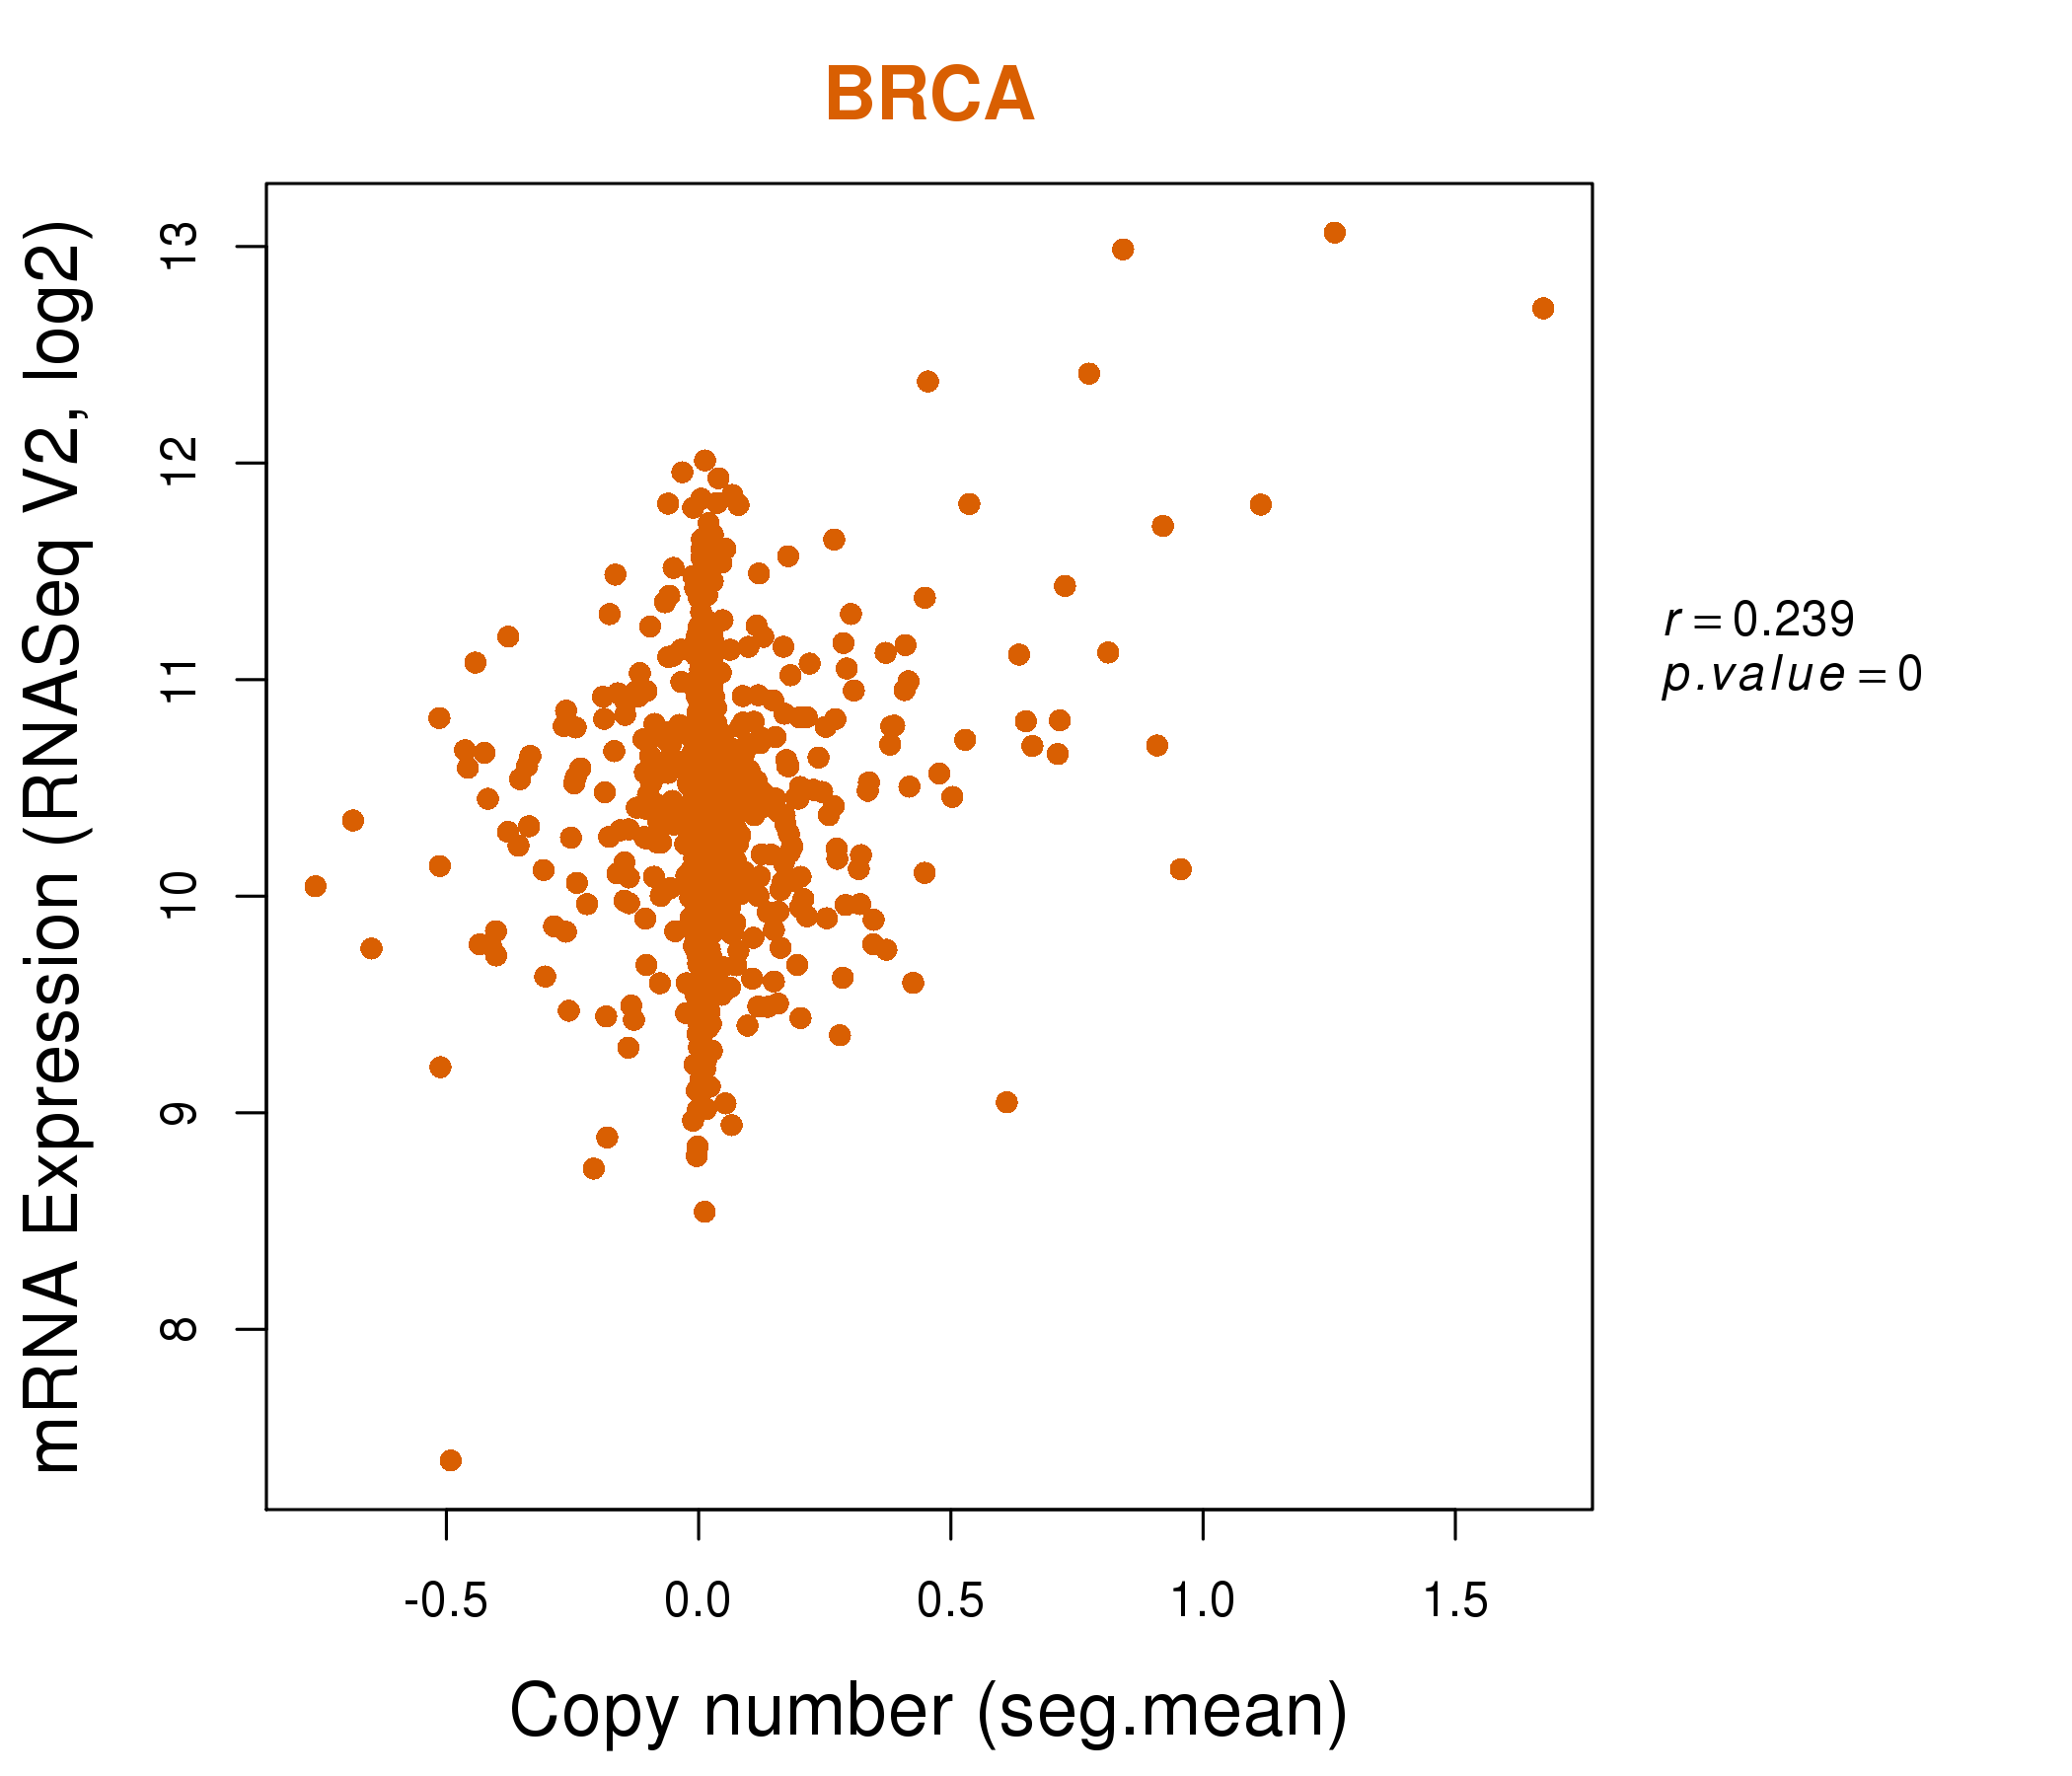
| * This plots show the correlation between CNV and gene expression. |
: Open all plots for all cancer types
 |
|
 |
|
| Top |
| Gene-Gene Network Information |
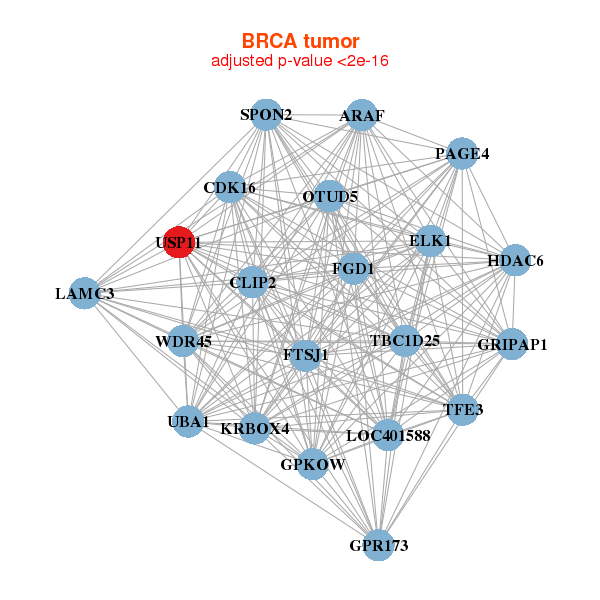
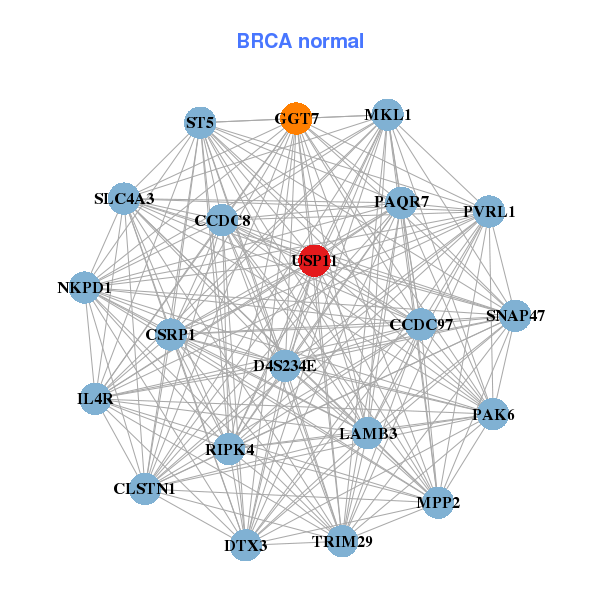
| * Co-Expression network figures were drawn using R package igraph. Only the top 20 genes with the highest correlations were shown. Red circle: input gene, orange circle: cell metabolism gene, sky circle: other gene |
: Open all plots for all cancer types
 |
|
| ARAF,CDK16,CLIP2,ELK1,FGD1,FTSJ1,GPKOW, GPR173,GRIPAP1,HDAC6,LAMC3,LOC401588,OTUD5,PAGE4, SPON2,TBC1D25,TFE3,UBA1,USP11,WDR45,KRBOX4 | CCDC8,CCDC97,CLSTN1,CSRP1,D4S234E,DTX3,GGT7, IL4R,LAMB3,MKL1,MPP2,NKPD1,PAK6,PAQR7, PVRL1,RIPK4,SLC4A3,SNAP47,ST5,TRIM29,USP11 |
 |
|
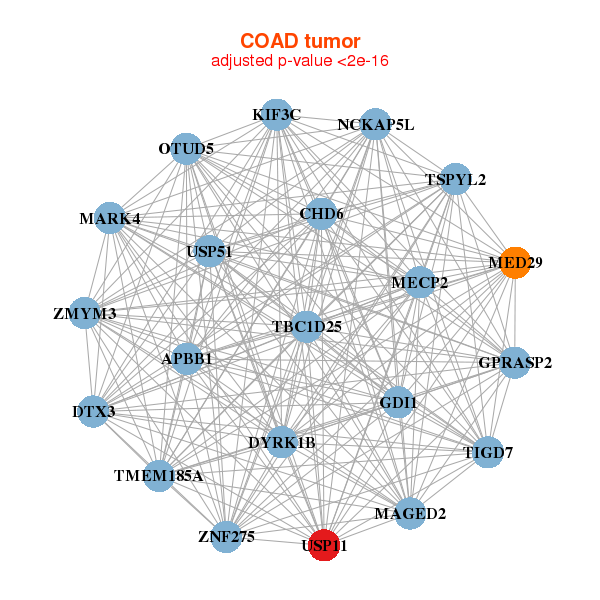
| APBB1,CHD6,DTX3,DYRK1B,GDI1,GPRASP2,KIF3C, MAGED2,MARK4,MECP2,MED29,NCKAP5L,OTUD5,TBC1D25, TIGD7,TMEM185A,TSPYL2,USP11,USP51,ZMYM3,ZNF275 | VSTM4,ENO2,FAM65A,GPR124,ISLR,KIF3C,LTBP3, MAGEE1,MAPK8IP1,PALM2-AKAP2,PCDHB4,SCRN1,SLC16A2,SLC22A17, STAT5B,TCF4,TIMP2,USP11,USP27X,WFS1,ZKSCAN2 |
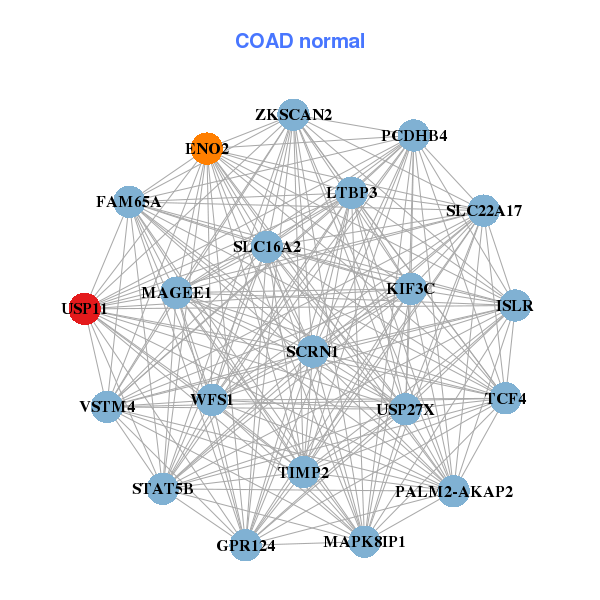
| * Co-Expression network figures were drawn using R package igraph. Only the top 20 genes with the highest correlations were shown. Red circle: input gene, orange circle: cell metabolism gene, sky circle: other gene |
: Open all plots for all cancer types
| Top |
: Open all interacting genes' information including KEGG pathway for all interacting genes from DAVID
| Top |
| Pharmacological Information for USP11 |
| There's no related Drug. |
| Top |
| Cross referenced IDs for USP11 |
| * We obtained these cross-references from Uniprot database. It covers 150 different DBs, 18 categories. http://www.uniprot.org/help/cross_references_section |
: Open all cross reference information
|
Copyright © 2016-Present - The Univsersity of Texas Health Science Center at Houston @ |