|
||||||||||||||||||||||||||||||||||||||||||||||||||||||||||||||||||||||||||||||||||||||||||||||||||||||||||||||||||||||||||||||||||||||||||||||||||||||||||||||||||||||||||||||||||||||||||||||||||||||||||||||||||||||||||||||||||||||||||||||||||||||||||||||||||||||||||||||||||||||||||||||||||||||||||||||||||||||||||
| |
| Phenotypic Information (metabolism pathway, cancer, disease, phenome) |
| |
| |
| Gene-Gene Network Information: Co-Expression Network, Interacting Genes & KEGG |
| |
|


| Gene Summary for ACOX3 |
| Top |
| Phenotypic Information for ACOX3(metabolism pathway, cancer, disease, phenome) |
| Cancer | CGAP: ACOX3 |
| Familial Cancer Database: ACOX3 | |
| * This gene is included in those cancer gene databases. |
|
|
|
|
|
|
| ||||||||||||||||||||||||||||||||||||||||||||||||||||||||||||||||||||||||||||||||||||||||||||||||||||||||||||||||||||||||||||||||||||||||||||||||||||||||||||||||||||||||||||||||||||||||||||||||||||||||||||||||||||||||||||||||||||||||||||||||||||||||||||||||||||||||||||||||||||||||||||||||||||||||||||||||||||
Oncogene 1 | Significant driver gene in | |||||||||||||||||||||||||||||||||||||||||||||||||||||||||||||||||||||||||||||||||||||||||||||||||||||||||||||||||||||||||||||||||||||||||||||||||||||||||||||||||||||||||||||||||||||||||||||||||||||||||||||||||||||||||||||||||||||||||||||||||||||||||||||||||||||||||||||||||||||||||||||||||||||||||||||||||||||||||
| cf) number; DB name 1 Oncogene; http://nar.oxfordjournals.org/content/35/suppl_1/D721.long, 2 Tumor Suppressor gene; https://bioinfo.uth.edu/TSGene/, 3 Cancer Gene Census; http://www.nature.com/nrc/journal/v4/n3/abs/nrc1299.html, 4 CancerGenes; http://nar.oxfordjournals.org/content/35/suppl_1/D721.long, 5 Network of Cancer Gene; http://ncg.kcl.ac.uk/index.php, 1Therapeutic Vulnerabilities in Cancer; http://cbio.mskcc.org/cancergenomics/statius/ |
| KEGG_FATTY_ACID_METABOLISM KEGG_ALPHA_LINOLENIC_ACID_METABOLISM REACTOME_PEROXISOMAL_LIPID_METABOLISM REACTOME_METABOLISM_OF_LIPIDS_AND_LIPOPROTEINS | |
| OMIM | |
| Orphanet | |
| Disease | KEGG Disease: ACOX3 |
| MedGen: ACOX3 (Human Medical Genetics with Condition) | |
| ClinVar: ACOX3 | |
| Phenotype | MGI: ACOX3 (International Mouse Phenotyping Consortium) |
| PhenomicDB: ACOX3 | |
| Mutations for ACOX3 |
| * Under tables are showing count per each tissue to give us broad intuition about tissue specific mutation patterns.You can go to the detailed page for each mutation database's web site. |
| There's no structural variation information in COSMIC data for this gene. |
| * From mRNA Sanger sequences, Chitars2.0 arranged chimeric transcripts. This table shows ACOX3 related fusion information. |
| ID | Head Gene | Tail Gene | Accession | Gene_a | qStart_a | qEnd_a | Chromosome_a | tStart_a | tEnd_a | Gene_a | qStart_a | qEnd_a | Chromosome_a | tStart_a | tEnd_a |
| BI915466 | ACOX3 | 1 | 64 | 4 | 8442373 | 8442438 | DLGAP4 | 62 | 839 | 20 | 35125107 | 35129000 | |
| AA527241 | ACOX3 | 1 | 179 | 4 | 8369320 | 8369498 | C1orf106 | 173 | 491 | 1 | 200875031 | 200875352 | |
| BF990548 | ACOX3 | 17 | 77 | 4 | 8407532 | 8407592 | ACOX3 | 73 | 115 | 4 | 8411068 | 8411244 | |
| Top |
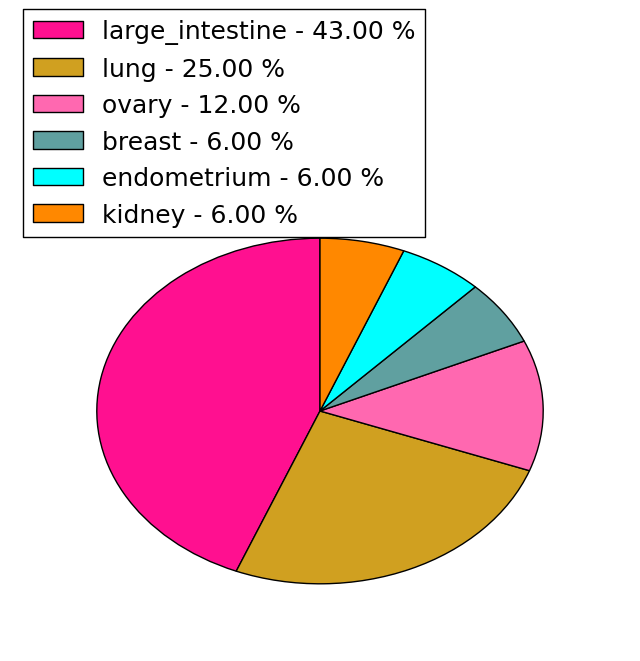
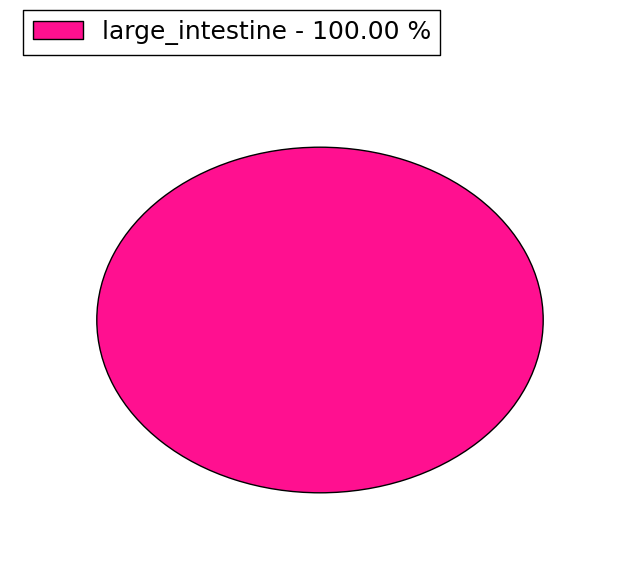
| Mutation type/ Tissue ID | brca | cns | cerv | endome | haematopo | kidn | Lintest | liver | lung | ns | ovary | pancre | prost | skin | stoma | thyro | urina | |||
| Total # sample | 1 | 1 | ||||||||||||||||||
| GAIN (# sample) | 1 | |||||||||||||||||||
| LOSS (# sample) | 1 |
| cf) Tissue ID; Tissue type (1; Breast, 2; Central_nervous_system, 3; Cervix, 4; Endometrium, 5; Haematopoietic_and_lymphoid_tissue, 6; Kidney, 7; Large_intestine, 8; Liver, 9; Lung, 10; NS, 11; Ovary, 12; Pancreas, 13; Prostate, 14; Skin, 15; Stomach, 16; Thyroid, 17; Urinary_tract) |
| Top |
|
 |
| Top |
| Stat. for Non-Synonymous SNVs (# total SNVs=63) | (# total SNVs=16) |
 |  |
(# total SNVs=1) | (# total SNVs=1) |
 |  |
| Top |
| * When you move the cursor on each content, you can see more deailed mutation information on the Tooltip. Those are primary_site,primary_histology,mutation(aa),pubmedID. |
| GRCh37 position | Mutation(aa) | Unique sampleID count |
| chr4:8401376-8401376 | p.F260F | 3 |
| chr4:8401309-8401309 | p.E283K | 3 |
| chr4:8401339-8401339 | p.L273F | 3 |
| chr4:8401369-8401369 | p.F263V | 2 |
| chr4:8417620-8417620 | p.R84Q | 2 |
| chr4:8368805-8368805 | p.L662L | 2 |
| chr4:8398744-8398744 | p.A326T | 2 |
| chr4:8372691-8372691 | p.V643M | 2 |
| chr4:8412056-8412056 | p.F190L | 2 |
| chr4:8383332-8383332 | p.A514T | 2 |
| Top |
|
 |
| Point Mutation/ Tissue ID | 1 | 2 | 3 | 4 | 5 | 6 | 7 | 8 | 9 | 10 | 11 | 12 | 13 | 14 | 15 | 16 | 17 | 18 | 19 | 20 |
| # sample | 3 | 2 | 12 | 4 | 2 | 11 | 5 | 1 | 1 | 16 | 9 | 9 | ||||||||
| # mutation | 3 | 2 | 11 | 4 | 2 | 11 | 5 | 1 | 1 | 15 | 10 | 9 | ||||||||
| nonsynonymous SNV | 3 | 2 | 8 | 3 | 2 | 7 | 5 | 1 | 1 | 11 | 6 | 8 | ||||||||
| synonymous SNV | 4 | 1 | 4 | 4 | 4 | 1 |
| cf) Tissue ID; Tissue type (1; BLCA[Bladder Urothelial Carcinoma], 2; BRCA[Breast invasive carcinoma], 3; CESC[Cervical squamous cell carcinoma and endocervical adenocarcinoma], 4; COAD[Colon adenocarcinoma], 5; GBM[Glioblastoma multiforme], 6; Glioma Low Grade, 7; HNSC[Head and Neck squamous cell carcinoma], 8; KICH[Kidney Chromophobe], 9; KIRC[Kidney renal clear cell carcinoma], 10; KIRP[Kidney renal papillary cell carcinoma], 11; LAML[Acute Myeloid Leukemia], 12; LUAD[Lung adenocarcinoma], 13; LUSC[Lung squamous cell carcinoma], 14; OV[Ovarian serous cystadenocarcinoma ], 15; PAAD[Pancreatic adenocarcinoma], 16; PRAD[Prostate adenocarcinoma], 17; SKCM[Skin Cutaneous Melanoma], 18:STAD[Stomach adenocarcinoma], 19:THCA[Thyroid carcinoma], 20:UCEC[Uterine Corpus Endometrial Carcinoma]) |
| Top |
| * We represented just top 10 SNVs. When you move the cursor on each content, you can see more deailed mutation information on the Tooltip. Those are primary_site, primary_histology, mutation(aa), pubmedID. |
| Genomic Position | Mutation(aa) | Unique sampleID count |
| chr4:8396360 | p.R389H,ACOX3 | 2 |
| chr4:8416596 | p.K146K,ACOX3 | 2 |
| chr4:8401339 | p.A514T,ACOX3 | 2 |
| chr4:8398744 | p.A326T,ACOX3 | 2 |
| chr4:8383332 | p.L273F,ACOX3 | 2 |
| chr4:8390956 | p.T414T,ACOX3 | 1 |
| chr4:8411994 | p.A261T,ACOX3 | 1 |
| chr4:8372681 | p.L158P,ACOX3 | 1 |
| chr4:8401327 | p.P17S,ACOX3 | 1 |
| chr4:8418165 | p.A625A | 1 |
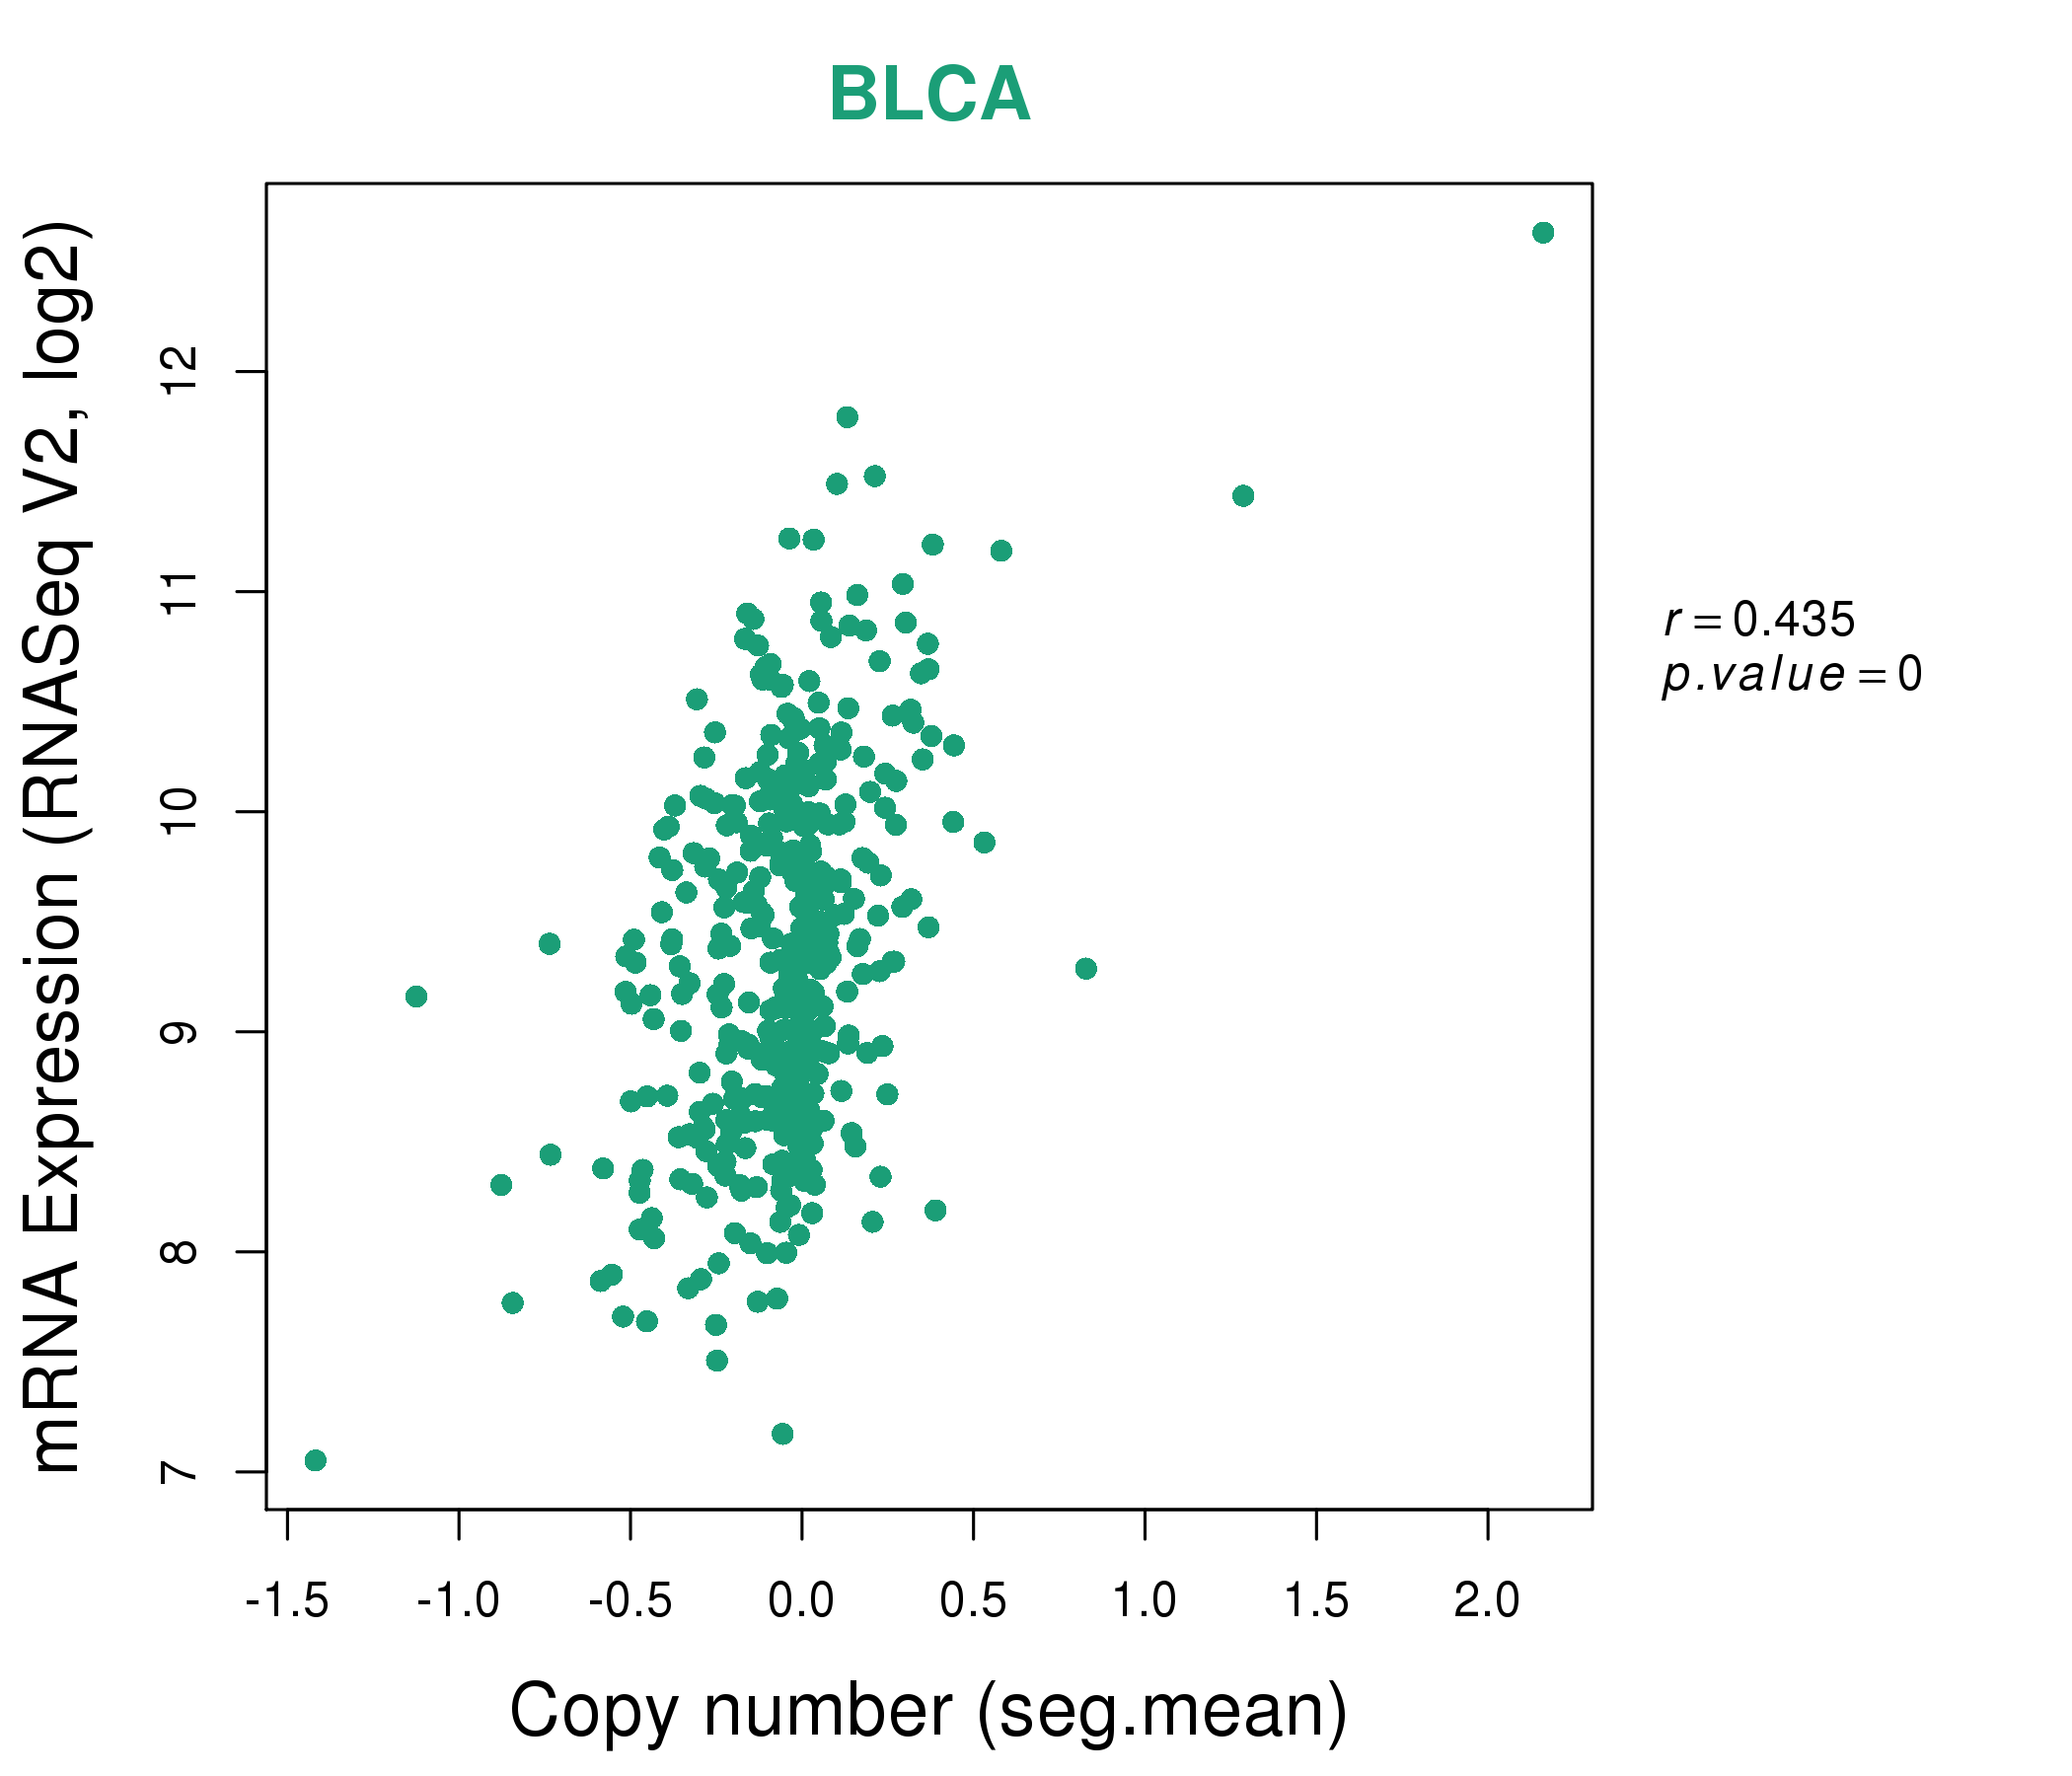
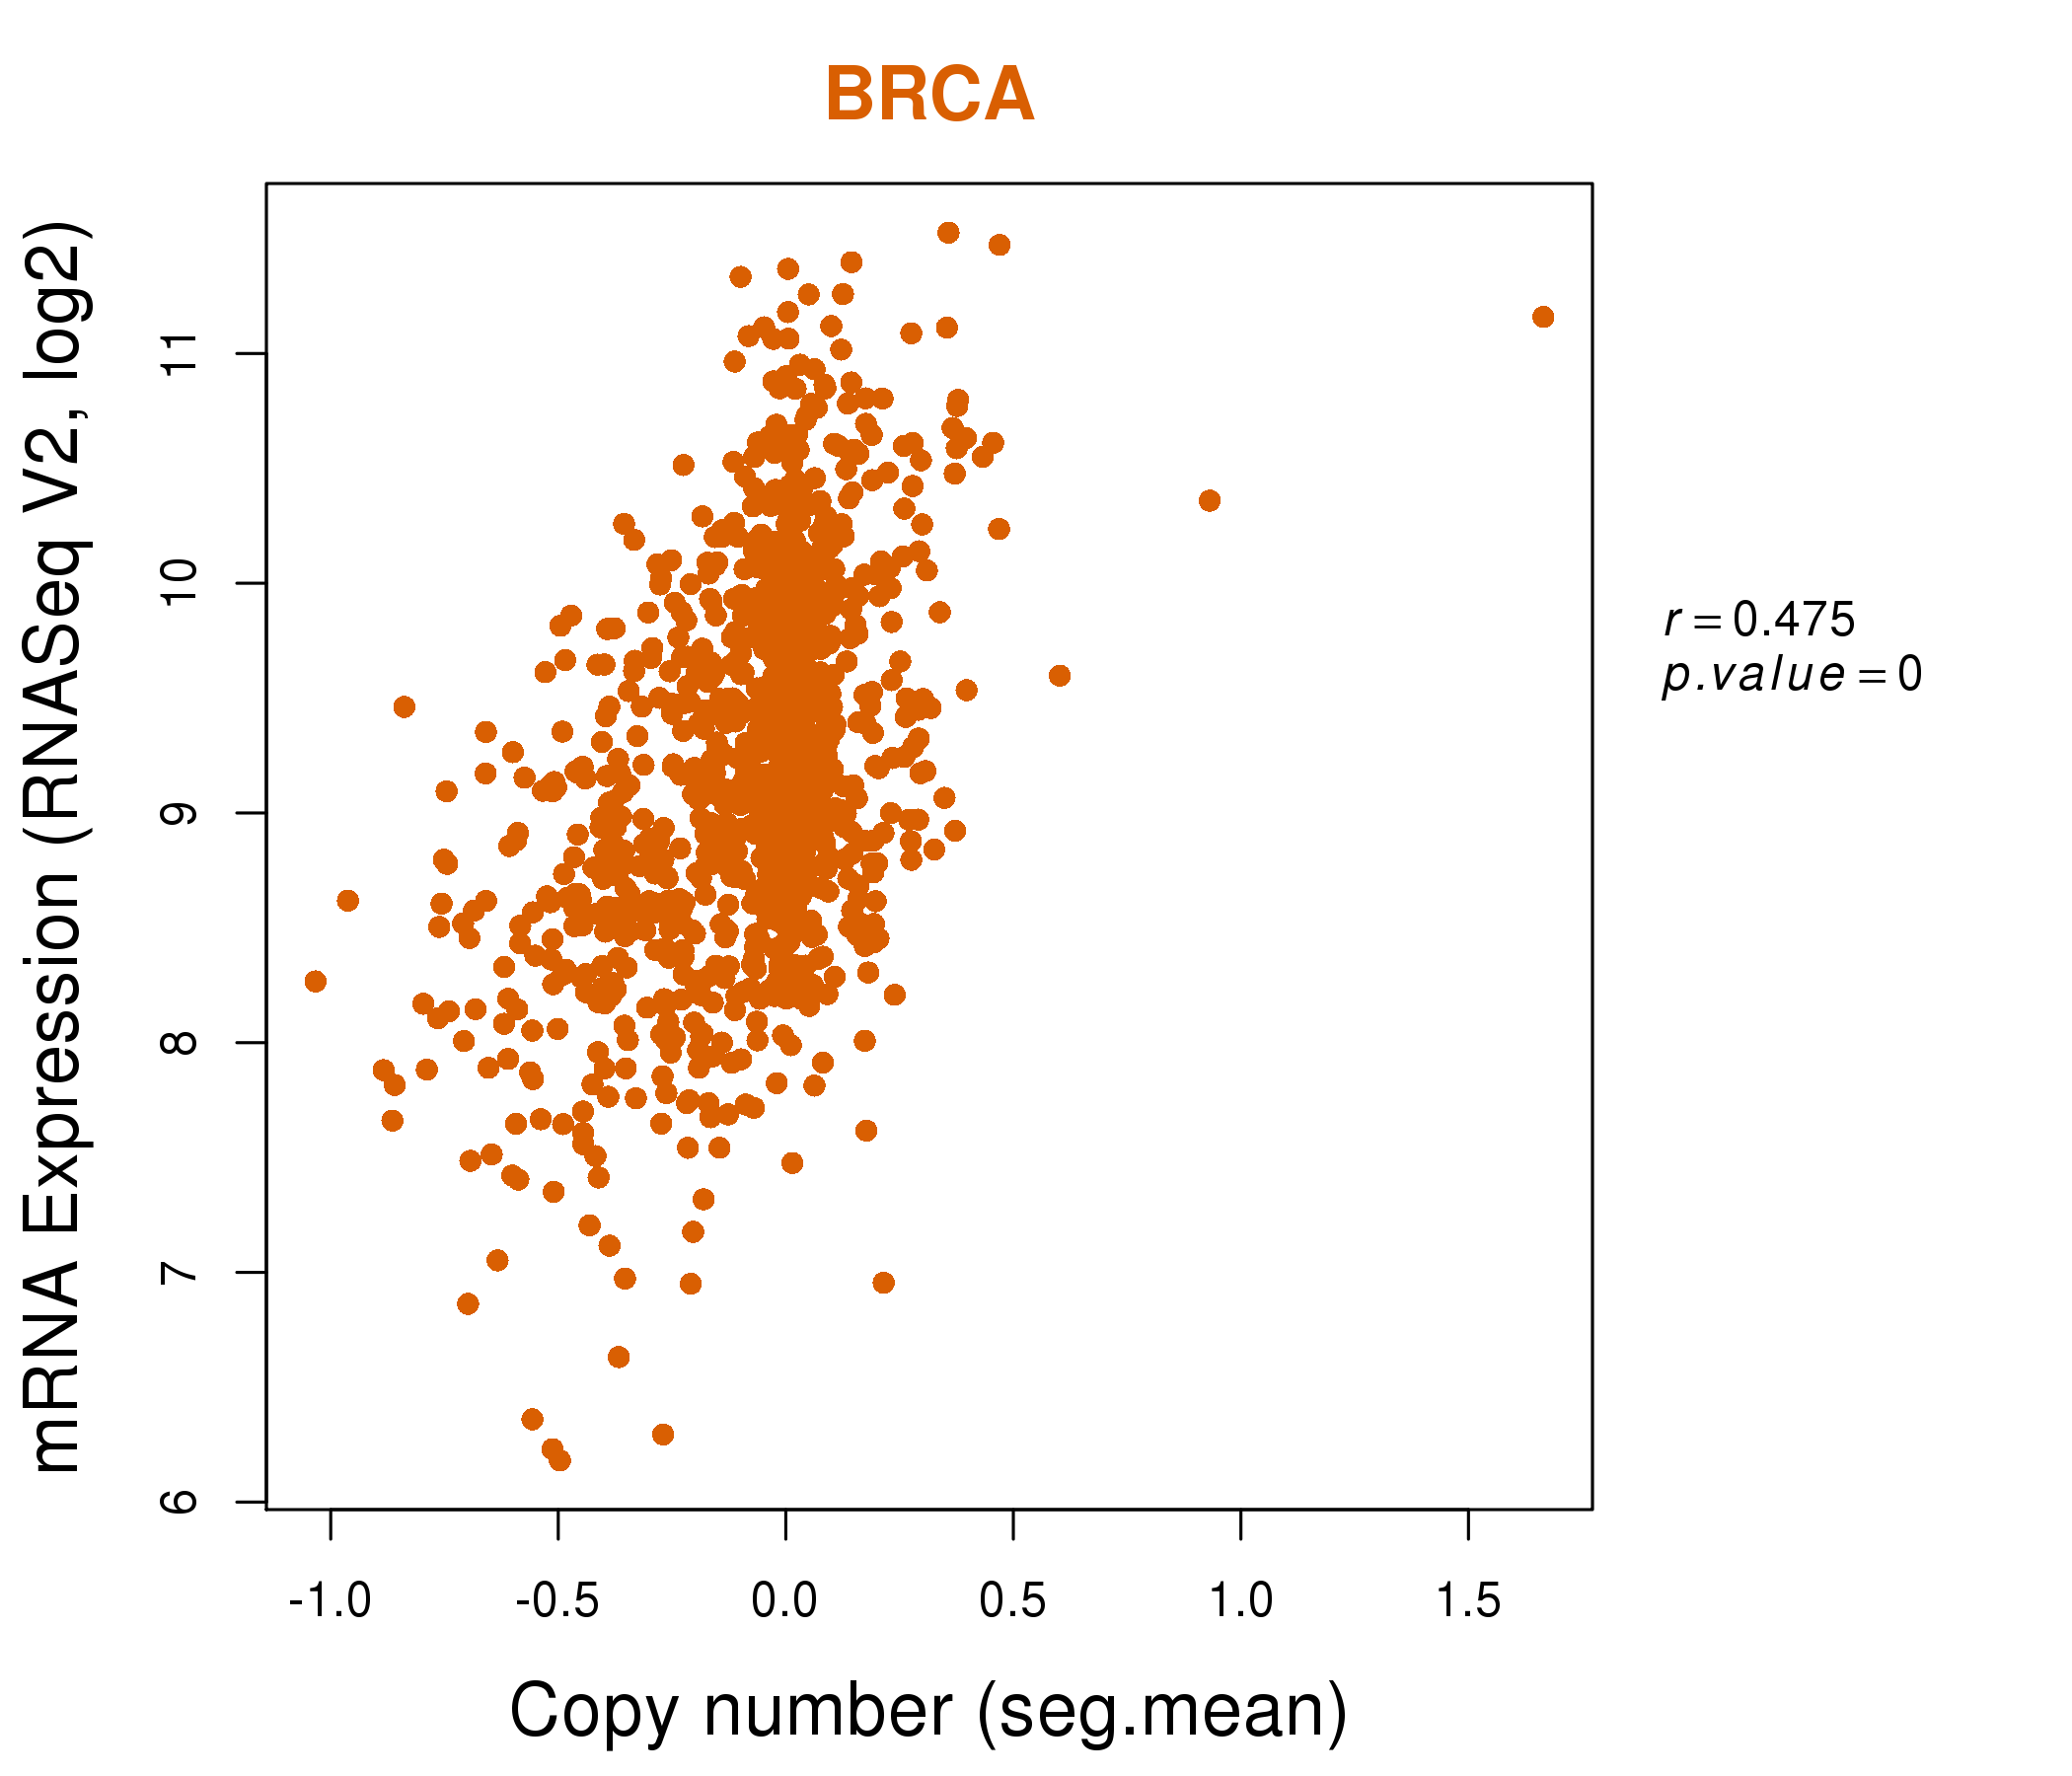
| * Copy number data were extracted from TCGA using R package TCGA-Assembler. The URLs of all public data files on TCGA DCC data server were gathered on Jan-05-2015. Function ProcessCNAData in TCGA-Assembler package was used to obtain gene-level copy number value which is calculated as the average copy number of the genomic region of a gene. |
 |
| cf) Tissue ID[Tissue type]: BLCA[Bladder Urothelial Carcinoma], BRCA[Breast invasive carcinoma], CESC[Cervical squamous cell carcinoma and endocervical adenocarcinoma], COAD[Colon adenocarcinoma], GBM[Glioblastoma multiforme], Glioma Low Grade, HNSC[Head and Neck squamous cell carcinoma], KICH[Kidney Chromophobe], KIRC[Kidney renal clear cell carcinoma], KIRP[Kidney renal papillary cell carcinoma], LAML[Acute Myeloid Leukemia], LUAD[Lung adenocarcinoma], LUSC[Lung squamous cell carcinoma], OV[Ovarian serous cystadenocarcinoma ], PAAD[Pancreatic adenocarcinoma], PRAD[Prostate adenocarcinoma], SKCM[Skin Cutaneous Melanoma], STAD[Stomach adenocarcinoma], THCA[Thyroid carcinoma], UCEC[Uterine Corpus Endometrial Carcinoma] |
| Top |
| Gene Expression for ACOX3 |
| * CCLE gene expression data were extracted from CCLE_Expression_Entrez_2012-10-18.res: Gene-centric RMA-normalized mRNA expression data. |
 |
| * Normalized gene expression data of RNASeqV2 was extracted from TCGA using R package TCGA-Assembler. The URLs of all public data files on TCGA DCC data server were gathered at Jan-05-2015. Only eight cancer types have enough normal control samples for differential expression analysis. (t test, adjusted p<0.05 (using Benjamini-Hochberg FDR)) |
 |
| Top |
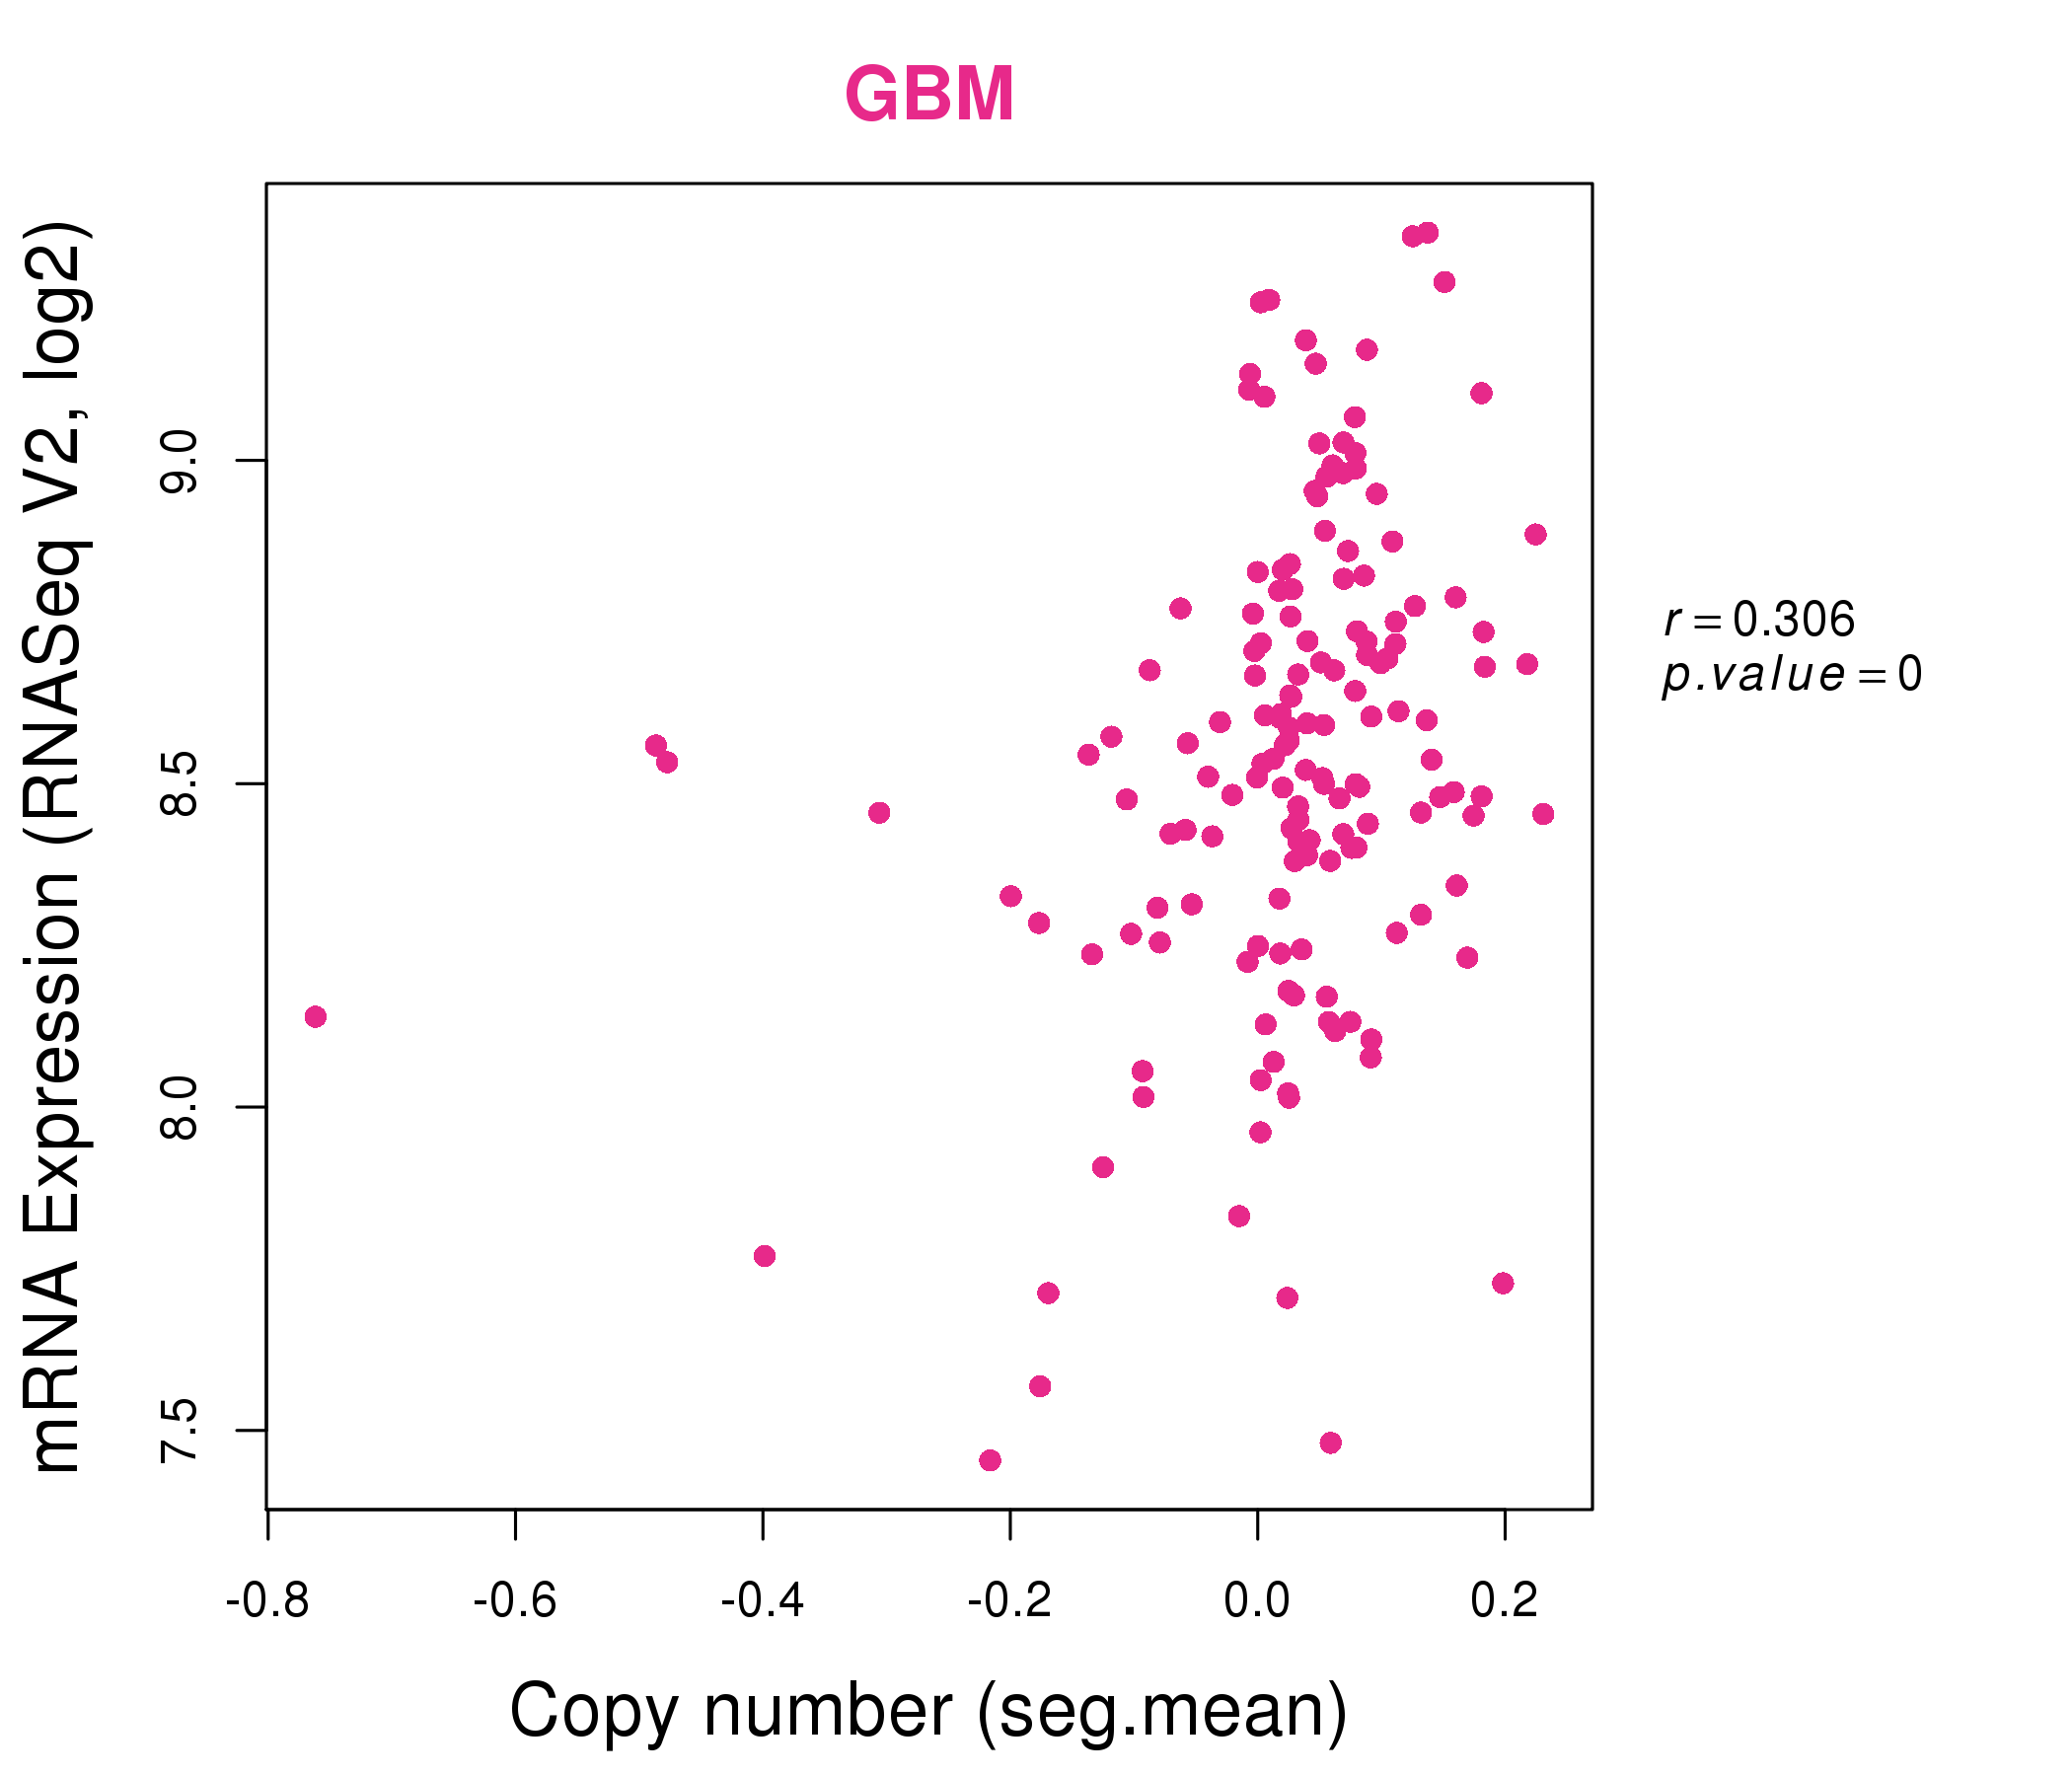
| * This plots show the correlation between CNV and gene expression. |
: Open all plots for all cancer types
 |
|
 |
|
| Top |
| Gene-Gene Network Information |
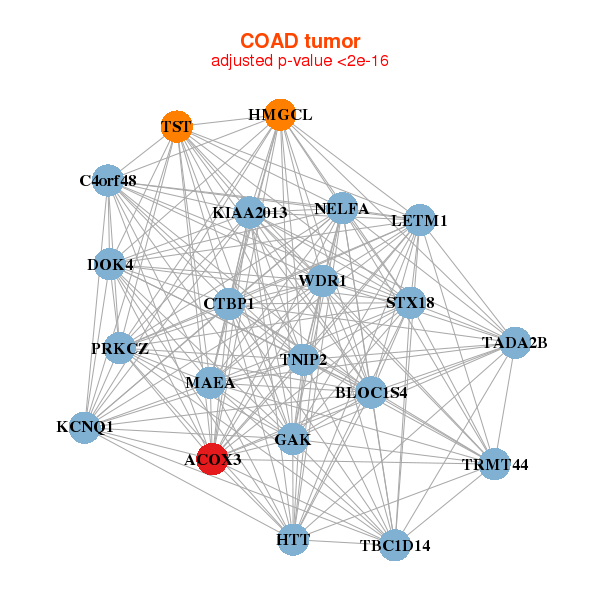
| * Co-Expression network figures were drawn using R package igraph. Only the top 20 genes with the highest correlations were shown. Red circle: input gene, orange circle: cell metabolism gene, sky circle: other gene |
: Open all plots for all cancer types
 |
|
| ACOX3,ADD1,TRMT44,CASZ1,BLOC1S4,GAK,HMGCL, KIAA0232,CERS4,LETM1,MAN2B2,MRFAP1,MRFAP1L1,NUDT16L1, PAFAH2,PIGG,RBM47,STX18,TADA2B,WDR1,WFS1 | ACOX3,ARHGAP8,HID1,KDF1,CAPN13,CARD14,CCDC57, DLG3,ESRP2,FAM110C,FAM174B,GPR39,KIAA0319L,PAFAH2, PIGO,PRR15L,REEP6,SEC16A,SIDT1,STYK1,TMEM63C |
 |
|
| ACOX3,TRMT44,C4orf48,BLOC1S4,CTBP1,DOK4,GAK, HMGCL,HTT,KCNQ1,KIAA2013,LETM1,MAEA,PRKCZ, STX18,TADA2B,TBC1D14,TNIP2,TST,WDR1,NELFA | ACOX3,SLC35F6,CAPN1,CYP4F22,DAO,GPT,IL2RB, KIR2DL4,MOV10,MVP,PRKD2,PYCARD,RALY,SLC6A9, SNORA72,STX4,TAPBP,TRIM14,TRIM26,TYMP,VPS16 |


| * Co-Expression network figures were drawn using R package igraph. Only the top 20 genes with the highest correlations were shown. Red circle: input gene, orange circle: cell metabolism gene, sky circle: other gene |
: Open all plots for all cancer types
| Top |
: Open all interacting genes' information including KEGG pathway for all interacting genes from DAVID
| Top |
| Pharmacological Information for ACOX3 |
| There's no related Drug. |
| Top |
| Cross referenced IDs for ACOX3 |
| * We obtained these cross-references from Uniprot database. It covers 150 different DBs, 18 categories. http://www.uniprot.org/help/cross_references_section |
: Open all cross reference information
|
Copyright © 2016-Present - The Univsersity of Texas Health Science Center at Houston @ |