|
||||||||||||||||||||
| |
| Phenotypic Information (metabolism pathway, cancer, disease, phenome) |
| |
| |
| Gene-Gene Network Information: Co-Expression Network, Interacting Genes & KEGG |
| |
|


| Gene Summary for ELOVL3 |
| Basic gene info. | Gene symbol | ELOVL3 |
| Gene name | ELOVL fatty acid elongase 3 | |
| Synonyms | CIG-30|CIG30 | |
| Cytomap | UCSC genome browser: 10q24.32 | |
| Genomic location | chr10 :103986142-103989344 | |
| Type of gene | protein-coding | |
| RefGenes | NM_152310.2, | |
| Ensembl id | ENSG00000119915 | |
| Description | 3-keto acyl-CoA synthase ELOVL3ELOVL FA elongase 3cold-inducible glycoprotein of 30 kDaelongation of very long chain fatty acids (FEN1/Elo2, SUR4/Elo3, yeast)-like 3elongation of very long chain fatty acids protein 3very-long-chain 3-oxoacyl-CoA synt | |
| Modification date | 20141207 | |
| dbXrefs | MIM : 611815 | |
| HGNC : HGNC | ||
| Ensembl : ENSG00000119915 | ||
| HPRD : 16858 | ||
| Vega : OTTHUMG00000018951 | ||
| Protein | UniProt: go to UniProt's Cross Reference DB Table | |
| Expression | CleanEX: HS_ELOVL3 | |
| BioGPS: 83401 | ||
| Gene Expression Atlas: ENSG00000119915 | ||
| The Human Protein Atlas: ENSG00000119915 | ||
| Pathway | NCI Pathway Interaction Database: ELOVL3 | |
| KEGG: ELOVL3 | ||
| REACTOME: ELOVL3 | ||
| ConsensusPathDB | ||
| Pathway Commons: ELOVL3 | ||
| Metabolism | MetaCyc: ELOVL3 | |
| HUMANCyc: ELOVL3 | ||
| Regulation | Ensembl's Regulation: ENSG00000119915 | |
| miRBase: chr10 :103,986,142-103,989,344 | ||
| TargetScan: NM_152310 | ||
| cisRED: ENSG00000119915 | ||
| Context | iHOP: ELOVL3 | |
| cancer metabolism search in PubMed: ELOVL3 | ||
| UCL Cancer Institute: ELOVL3 | ||
| Assigned class in ccmGDB | C | |
| Top |
| Phenotypic Information for ELOVL3(metabolism pathway, cancer, disease, phenome) |
| Cancer | CGAP: ELOVL3 |
| Familial Cancer Database: ELOVL3 | |
| * This gene is included in those cancer gene databases. |
|
|
|
|
|
| . | ||||||||||||||
Oncogene 1 | Significant driver gene in | |||||||||||||||||||
| cf) number; DB name 1 Oncogene; http://nar.oxfordjournals.org/content/35/suppl_1/D721.long, 2 Tumor Suppressor gene; https://bioinfo.uth.edu/TSGene/, 3 Cancer Gene Census; http://www.nature.com/nrc/journal/v4/n3/abs/nrc1299.html, 4 CancerGenes; http://nar.oxfordjournals.org/content/35/suppl_1/D721.long, 5 Network of Cancer Gene; http://ncg.kcl.ac.uk/index.php, 1Therapeutic Vulnerabilities in Cancer; http://cbio.mskcc.org/cancergenomics/statius/ |
| REACTOME_METABOLISM_OF_LIPIDS_AND_LIPOPROTEINS | |
| OMIM | |
| Orphanet | |
| Disease | KEGG Disease: ELOVL3 |
| MedGen: ELOVL3 (Human Medical Genetics with Condition) | |
| ClinVar: ELOVL3 | |
| Phenotype | MGI: ELOVL3 (International Mouse Phenotyping Consortium) |
| PhenomicDB: ELOVL3 | |
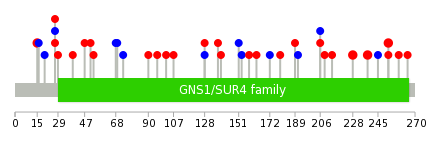
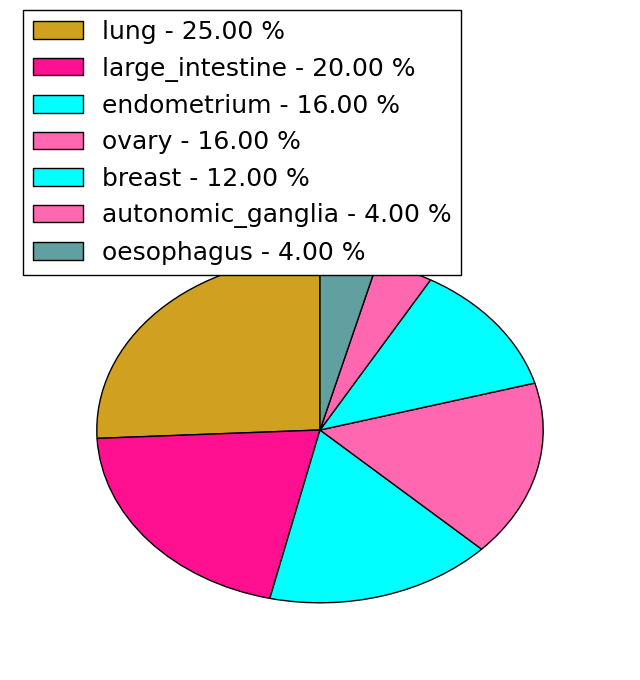
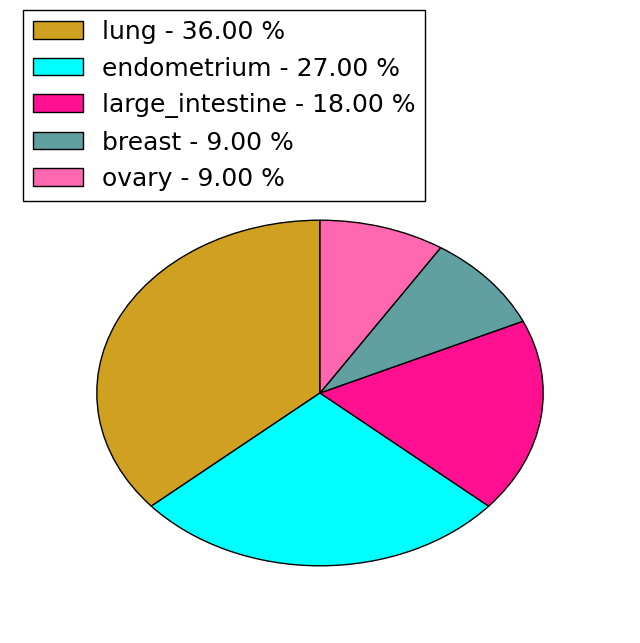
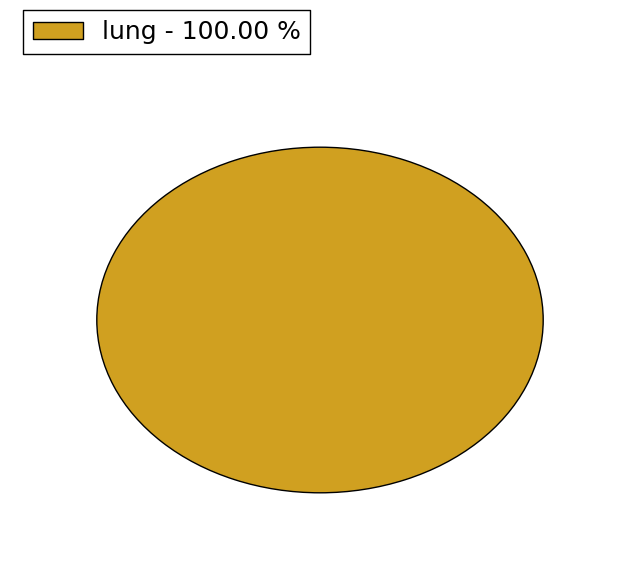
| Mutations for ELOVL3 |
| * Under tables are showing count per each tissue to give us broad intuition about tissue specific mutation patterns.You can go to the detailed page for each mutation database's web site. |
| There's no structural variation information in COSMIC data for this gene. |
| * From mRNA Sanger sequences, Chitars2.0 arranged chimeric transcripts. This table shows ELOVL3 related fusion information. |
| ID | Head Gene | Tail Gene | Accession | Gene_a | qStart_a | qEnd_a | Chromosome_a | tStart_a | tEnd_a | Gene_a | qStart_a | qEnd_a | Chromosome_a | tStart_a | tEnd_a |
| Top |
| There's no copy number variation information in COSMIC data for this gene. |
| Top |
|
 |
| Top |
| Stat. for Non-Synonymous SNVs (# total SNVs=24) | (# total SNVs=11) |
 |  |
(# total SNVs=1) | (# total SNVs=0) |
 |
| Top |
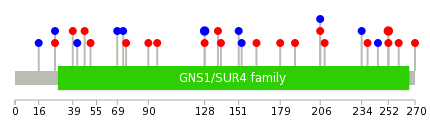
| * When you move the cursor on each content, you can see more deailed mutation information on the Tooltip. Those are primary_site,primary_histology,mutation(aa),pubmedID. |
| GRCh37 position | Mutation(aa) | Unique sampleID count |
| chr10:103988950-103988950 | p.H252Y | 3 |
| chr10:103986350-103986350 | p.F15L | 2 |
| chr10:103986386-103986386 | p.R27S | 2 |
| chr10:103988814-103988814 | p.Q206Q | 2 |
| chr10:103988879-103988879 | p.G228E | 2 |
| chr10:103988910-103988910 | p.W238C | 2 |
| chr10:103988260-103988260 | p.F107C | 1 |
| chr10:103988670-103988670 | p.F158L | 1 |
| chr10:103987420-103987420 | p.L47V | 1 |
| chr10:103988931-103988931 | p.T245T | 1 |
| Top |
|
 |
| Point Mutation/ Tissue ID | 1 | 2 | 3 | 4 | 5 | 6 | 7 | 8 | 9 | 10 | 11 | 12 | 13 | 14 | 15 | 16 | 17 | 18 | 19 | 20 |
| # sample | 1 | 3 | 4 | 2 | 4 | 3 | 3 | 4 | 2 | 5 | ||||||||||
| # mutation | 1 | 3 | 3 | 2 | 4 | 3 | 3 | 4 | 2 | 5 | ||||||||||
| nonsynonymous SNV | 3 | 1 | 1 | 1 | 2 | 3 | 3 | 2 | 3 | |||||||||||
| synonymous SNV | 1 | 2 | 1 | 3 | 1 | 1 | 3 |
| cf) Tissue ID; Tissue type (1; BLCA[Bladder Urothelial Carcinoma], 2; BRCA[Breast invasive carcinoma], 3; CESC[Cervical squamous cell carcinoma and endocervical adenocarcinoma], 4; COAD[Colon adenocarcinoma], 5; GBM[Glioblastoma multiforme], 6; Glioma Low Grade, 7; HNSC[Head and Neck squamous cell carcinoma], 8; KICH[Kidney Chromophobe], 9; KIRC[Kidney renal clear cell carcinoma], 10; KIRP[Kidney renal papillary cell carcinoma], 11; LAML[Acute Myeloid Leukemia], 12; LUAD[Lung adenocarcinoma], 13; LUSC[Lung squamous cell carcinoma], 14; OV[Ovarian serous cystadenocarcinoma ], 15; PAAD[Pancreatic adenocarcinoma], 16; PRAD[Prostate adenocarcinoma], 17; SKCM[Skin Cutaneous Melanoma], 18:STAD[Stomach adenocarcinoma], 19:THCA[Thyroid carcinoma], 20:UCEC[Uterine Corpus Endometrial Carcinoma]) |
| Top |
| * We represented just top 10 SNVs. When you move the cursor on each content, you can see more deailed mutation information on the Tooltip. Those are primary_site, primary_histology, mutation(aa), pubmedID. |
| Genomic Position | Mutation(aa) | Unique sampleID count |
| chr10:103988950 | p.H252Y | 3 |
| chr10:103986386 | p.R27R | 2 |
| chr10:103988324 | p.Q206Q | 2 |
| chr10:103988814 | p.L128L | 2 |
| chr10:103988226 | p.K163T | 1 |
| chr10:103988822 | p.P39S | 1 |
| chr10:103986353 | p.A179T | 1 |
| chr10:103988322 | p.L42L | 1 |
| chr10:103988898 | p.A189P | 1 |
| chr10:103988910 | p.L47V | 1 |
| * Copy number data were extracted from TCGA using R package TCGA-Assembler. The URLs of all public data files on TCGA DCC data server were gathered on Jan-05-2015. Function ProcessCNAData in TCGA-Assembler package was used to obtain gene-level copy number value which is calculated as the average copy number of the genomic region of a gene. |
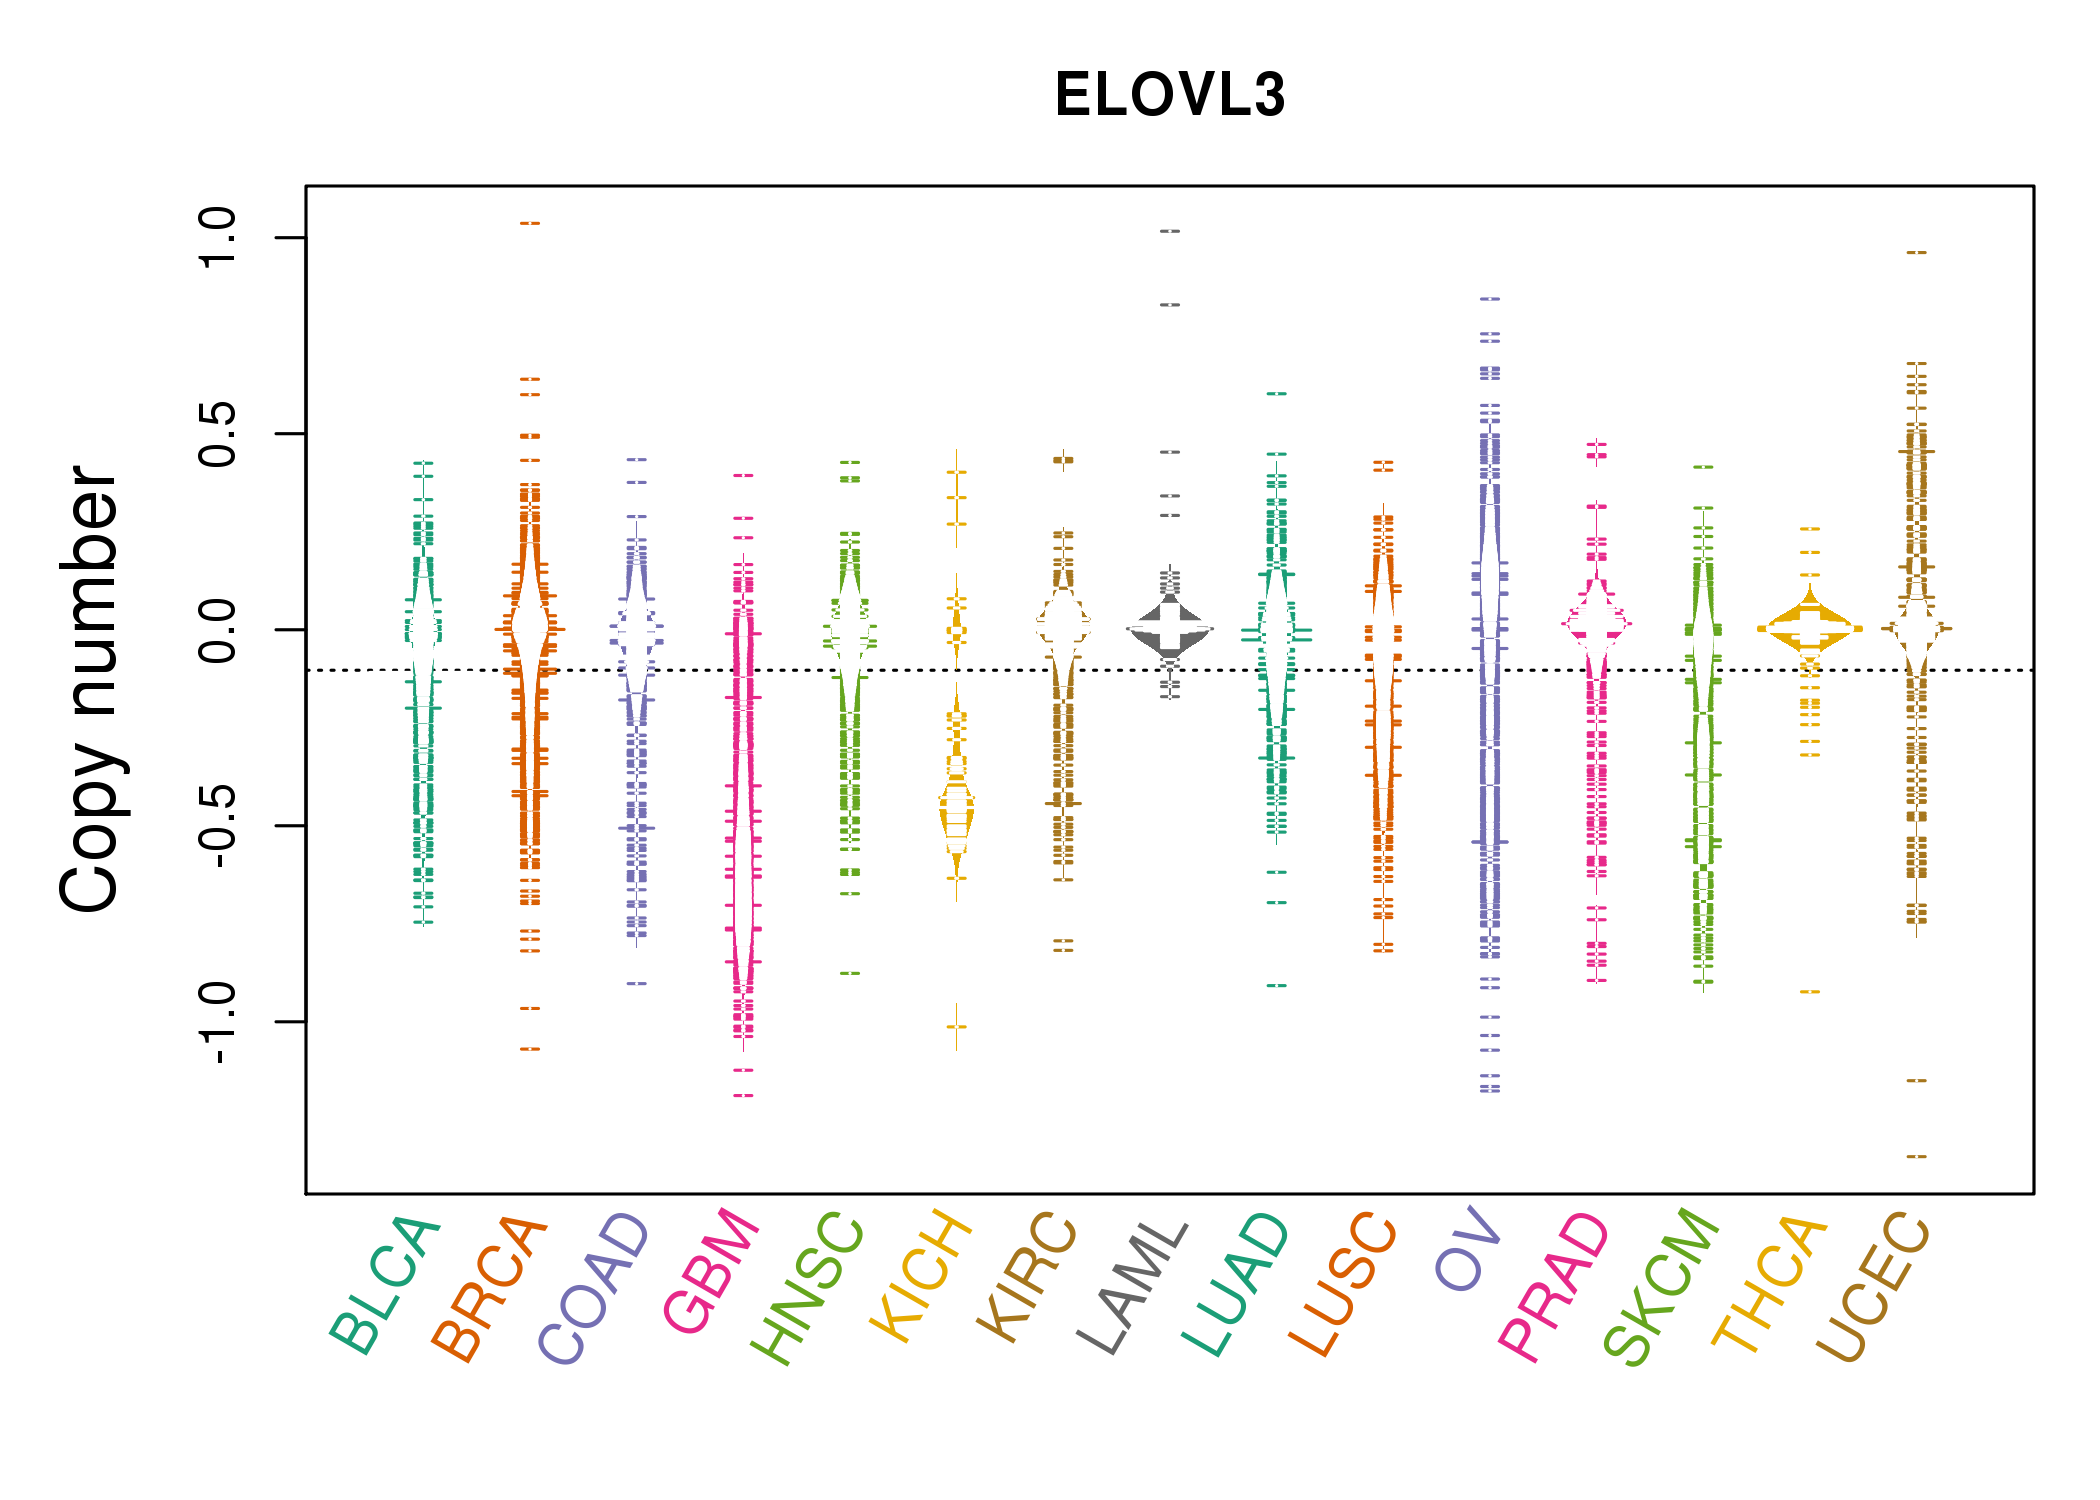 |
| cf) Tissue ID[Tissue type]: BLCA[Bladder Urothelial Carcinoma], BRCA[Breast invasive carcinoma], CESC[Cervical squamous cell carcinoma and endocervical adenocarcinoma], COAD[Colon adenocarcinoma], GBM[Glioblastoma multiforme], Glioma Low Grade, HNSC[Head and Neck squamous cell carcinoma], KICH[Kidney Chromophobe], KIRC[Kidney renal clear cell carcinoma], KIRP[Kidney renal papillary cell carcinoma], LAML[Acute Myeloid Leukemia], LUAD[Lung adenocarcinoma], LUSC[Lung squamous cell carcinoma], OV[Ovarian serous cystadenocarcinoma ], PAAD[Pancreatic adenocarcinoma], PRAD[Prostate adenocarcinoma], SKCM[Skin Cutaneous Melanoma], STAD[Stomach adenocarcinoma], THCA[Thyroid carcinoma], UCEC[Uterine Corpus Endometrial Carcinoma] |
| Top |
| Gene Expression for ELOVL3 |
| * CCLE gene expression data were extracted from CCLE_Expression_Entrez_2012-10-18.res: Gene-centric RMA-normalized mRNA expression data. |
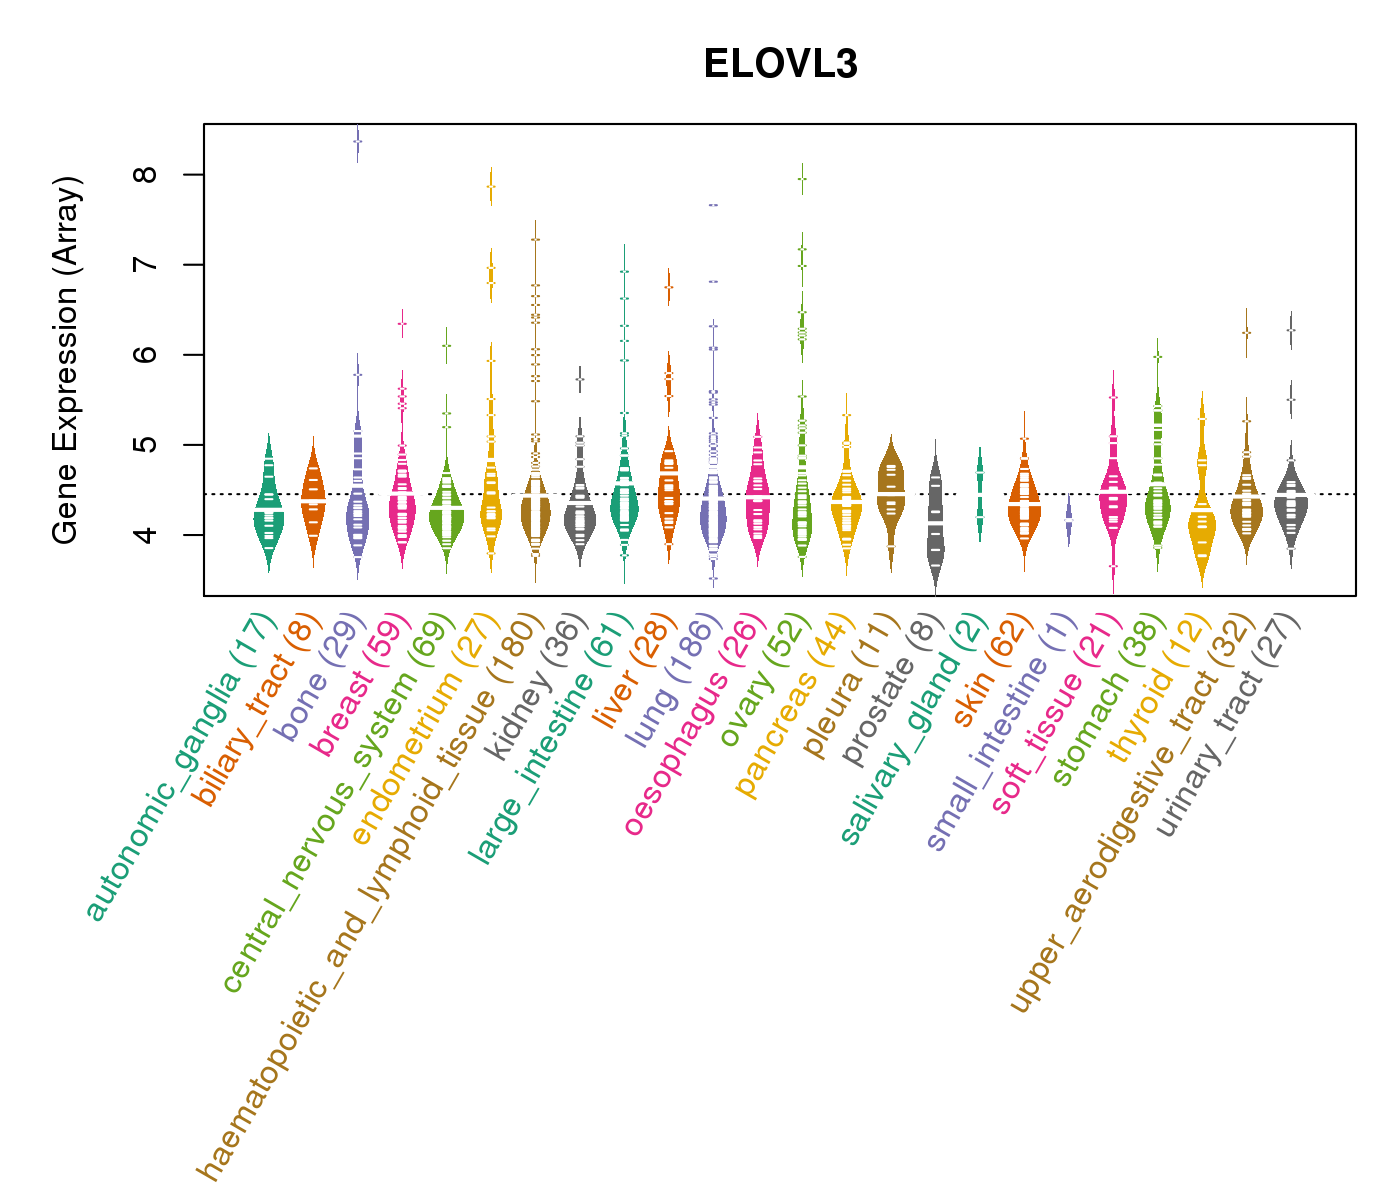 |
| * Normalized gene expression data of RNASeqV2 was extracted from TCGA using R package TCGA-Assembler. The URLs of all public data files on TCGA DCC data server were gathered at Jan-05-2015. Only eight cancer types have enough normal control samples for differential expression analysis. (t test, adjusted p<0.05 (using Benjamini-Hochberg FDR)) |
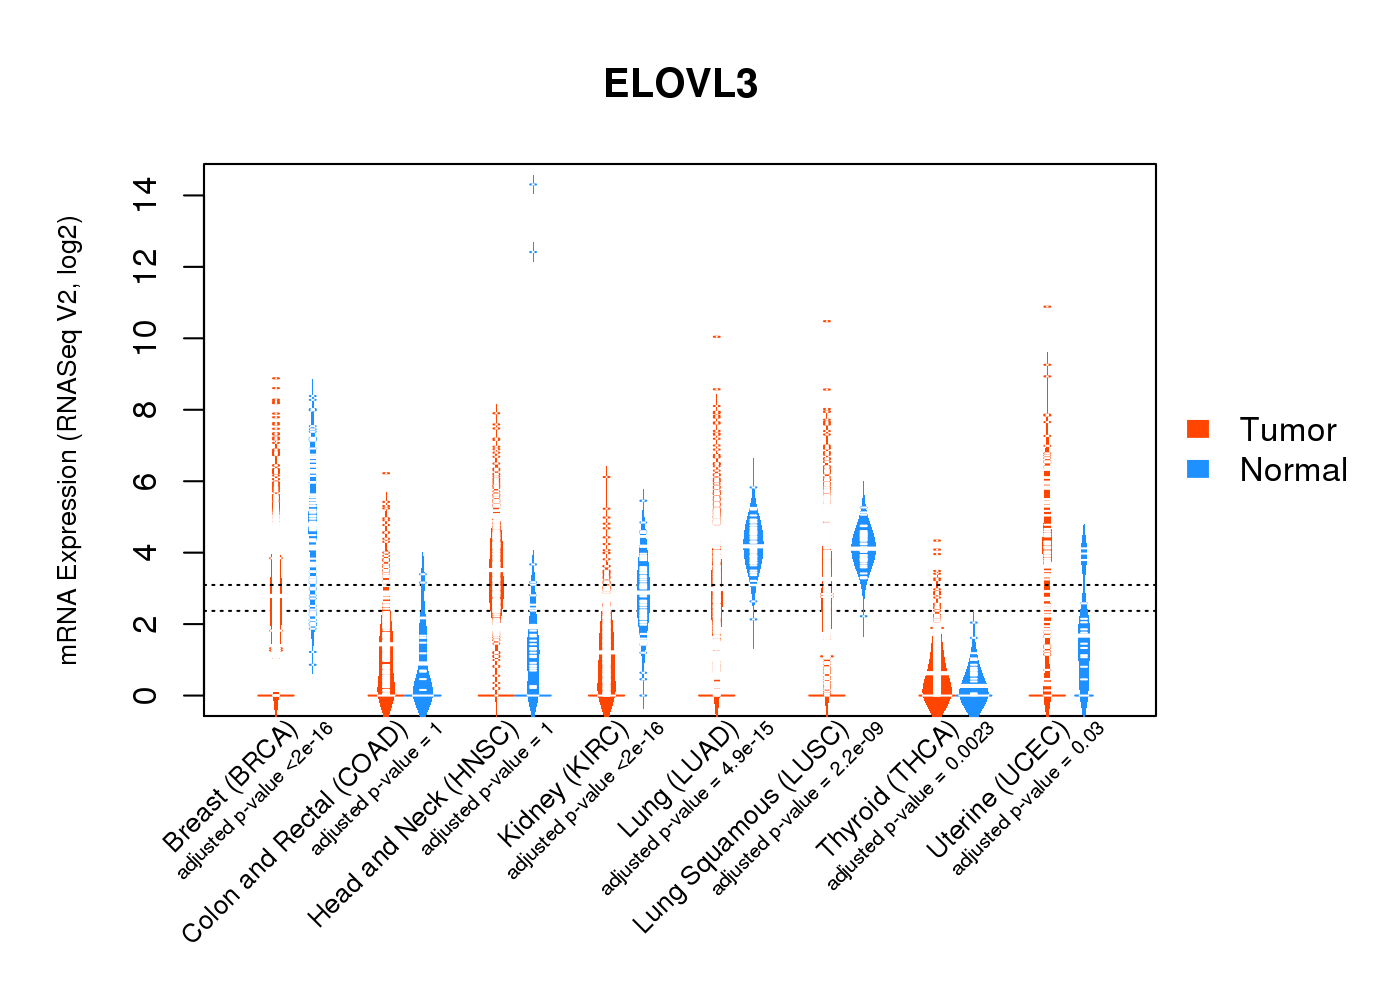 |
| Top |
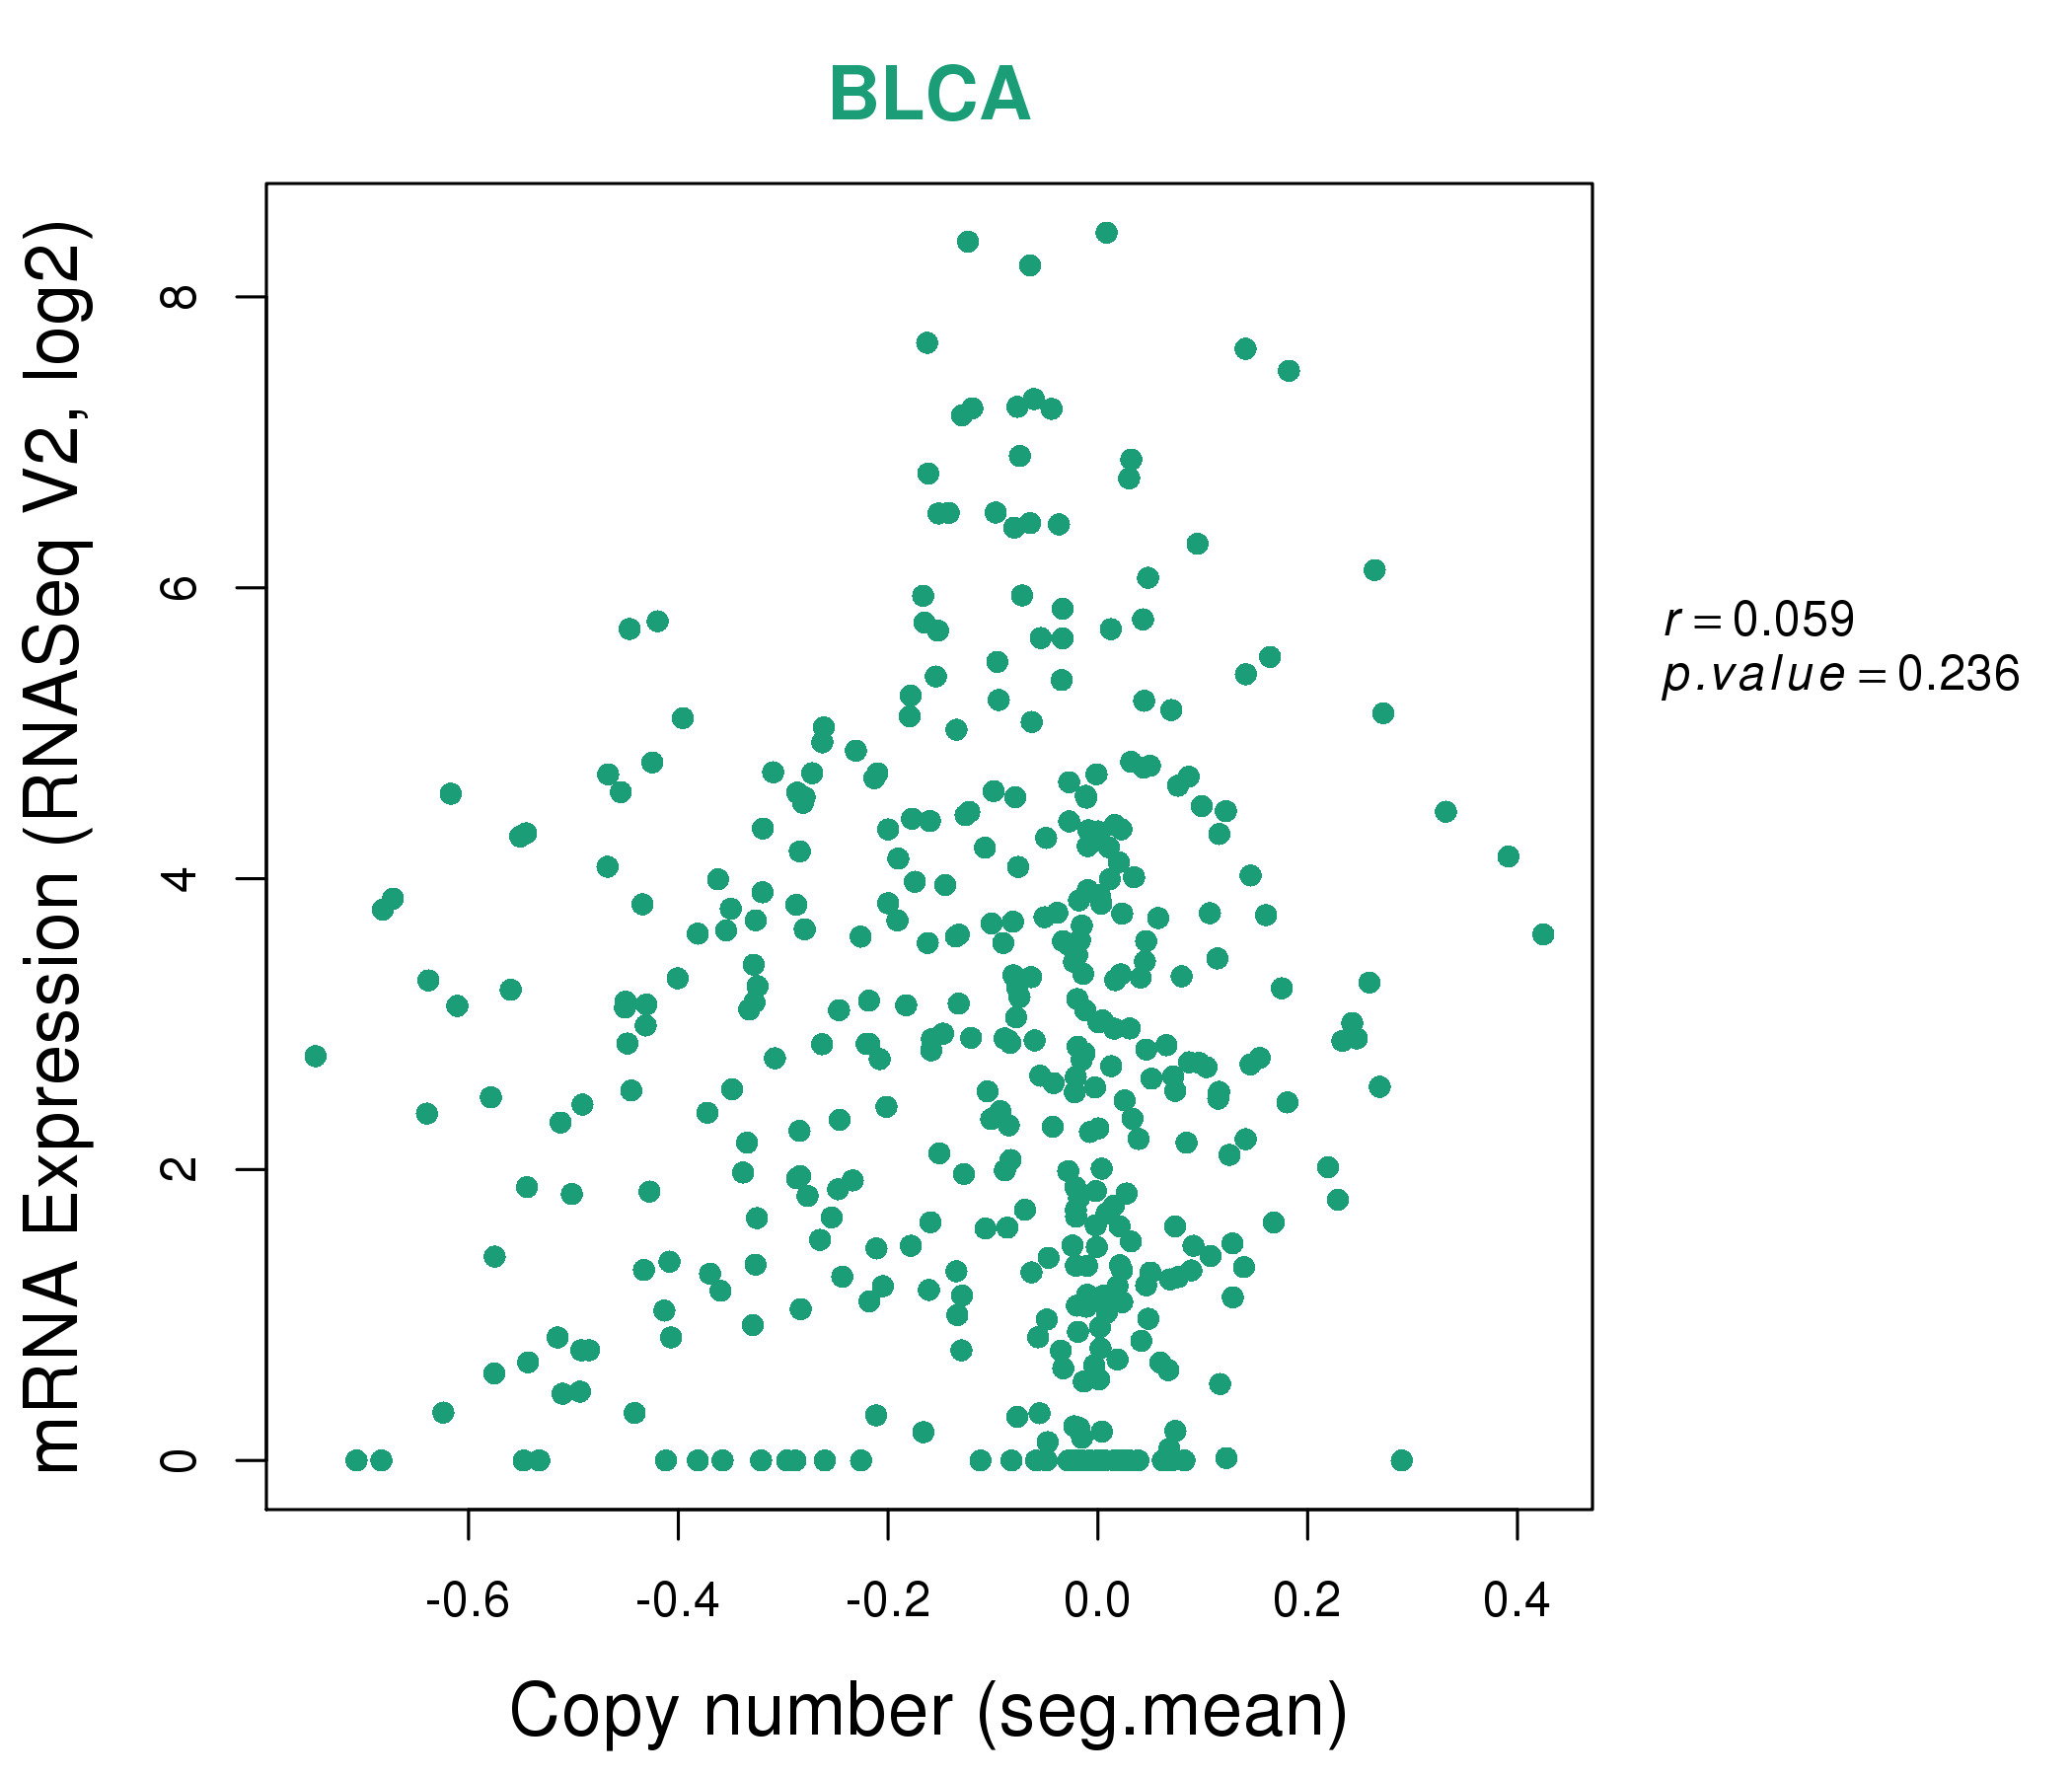
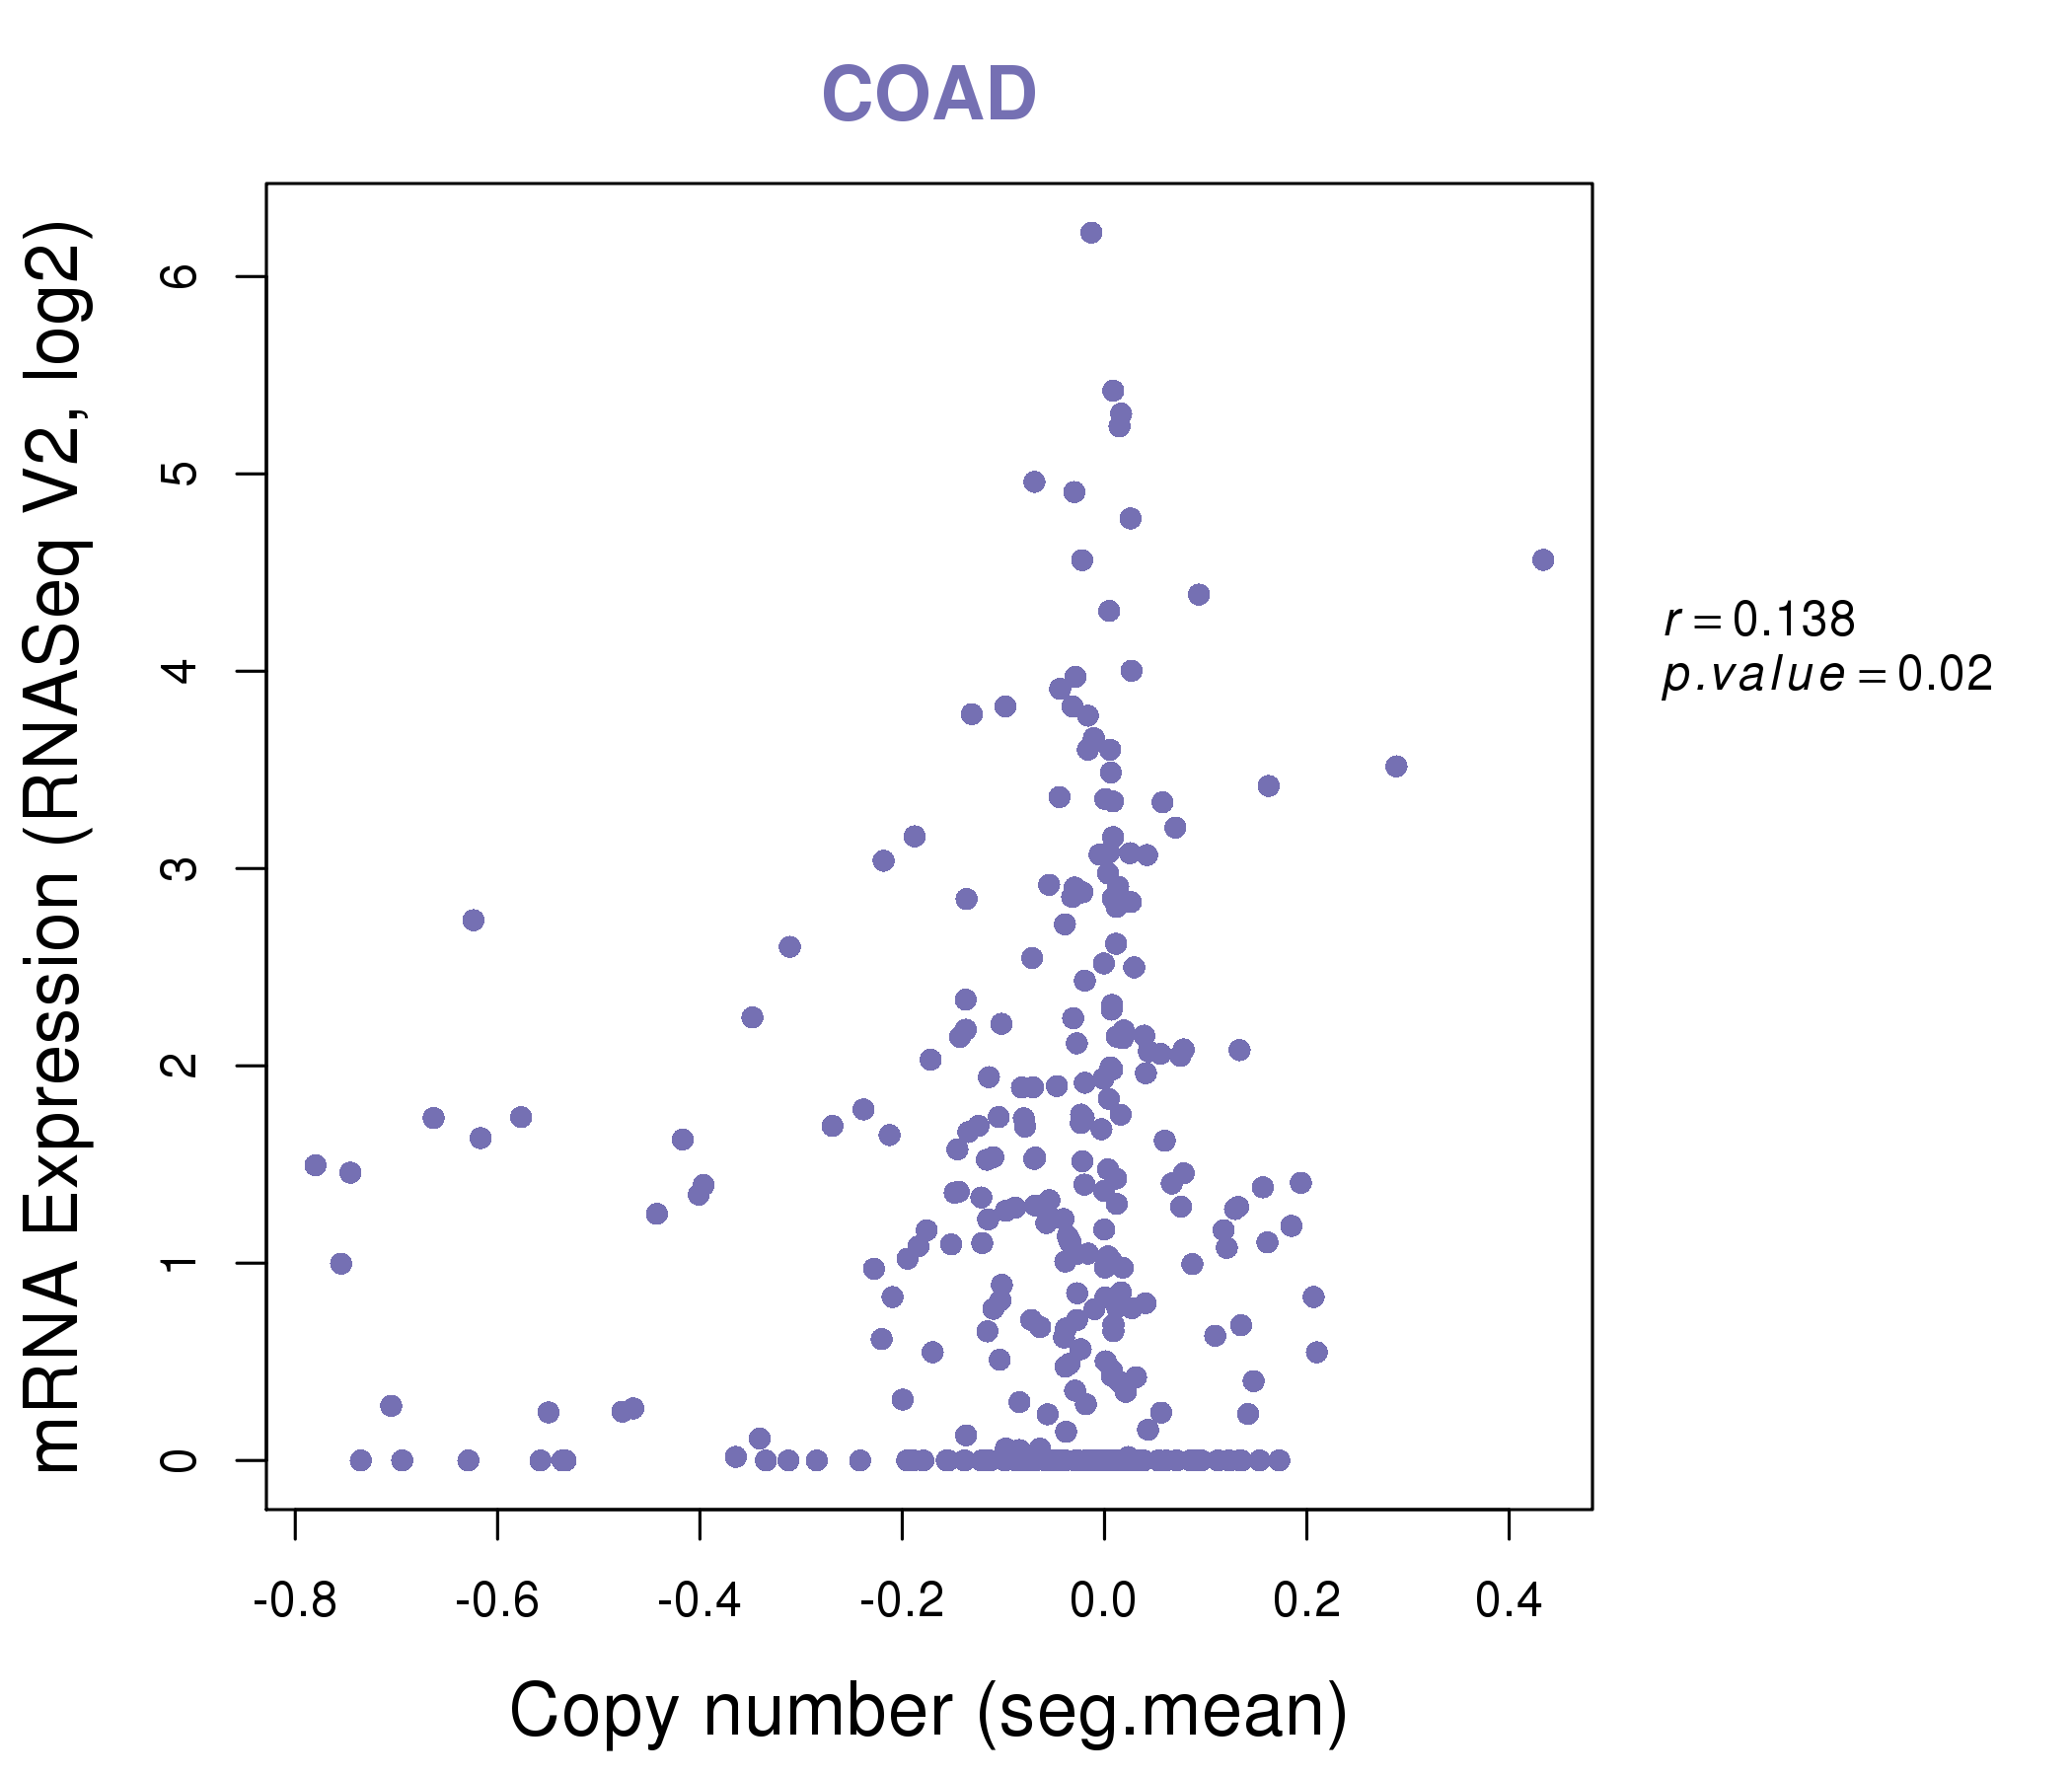
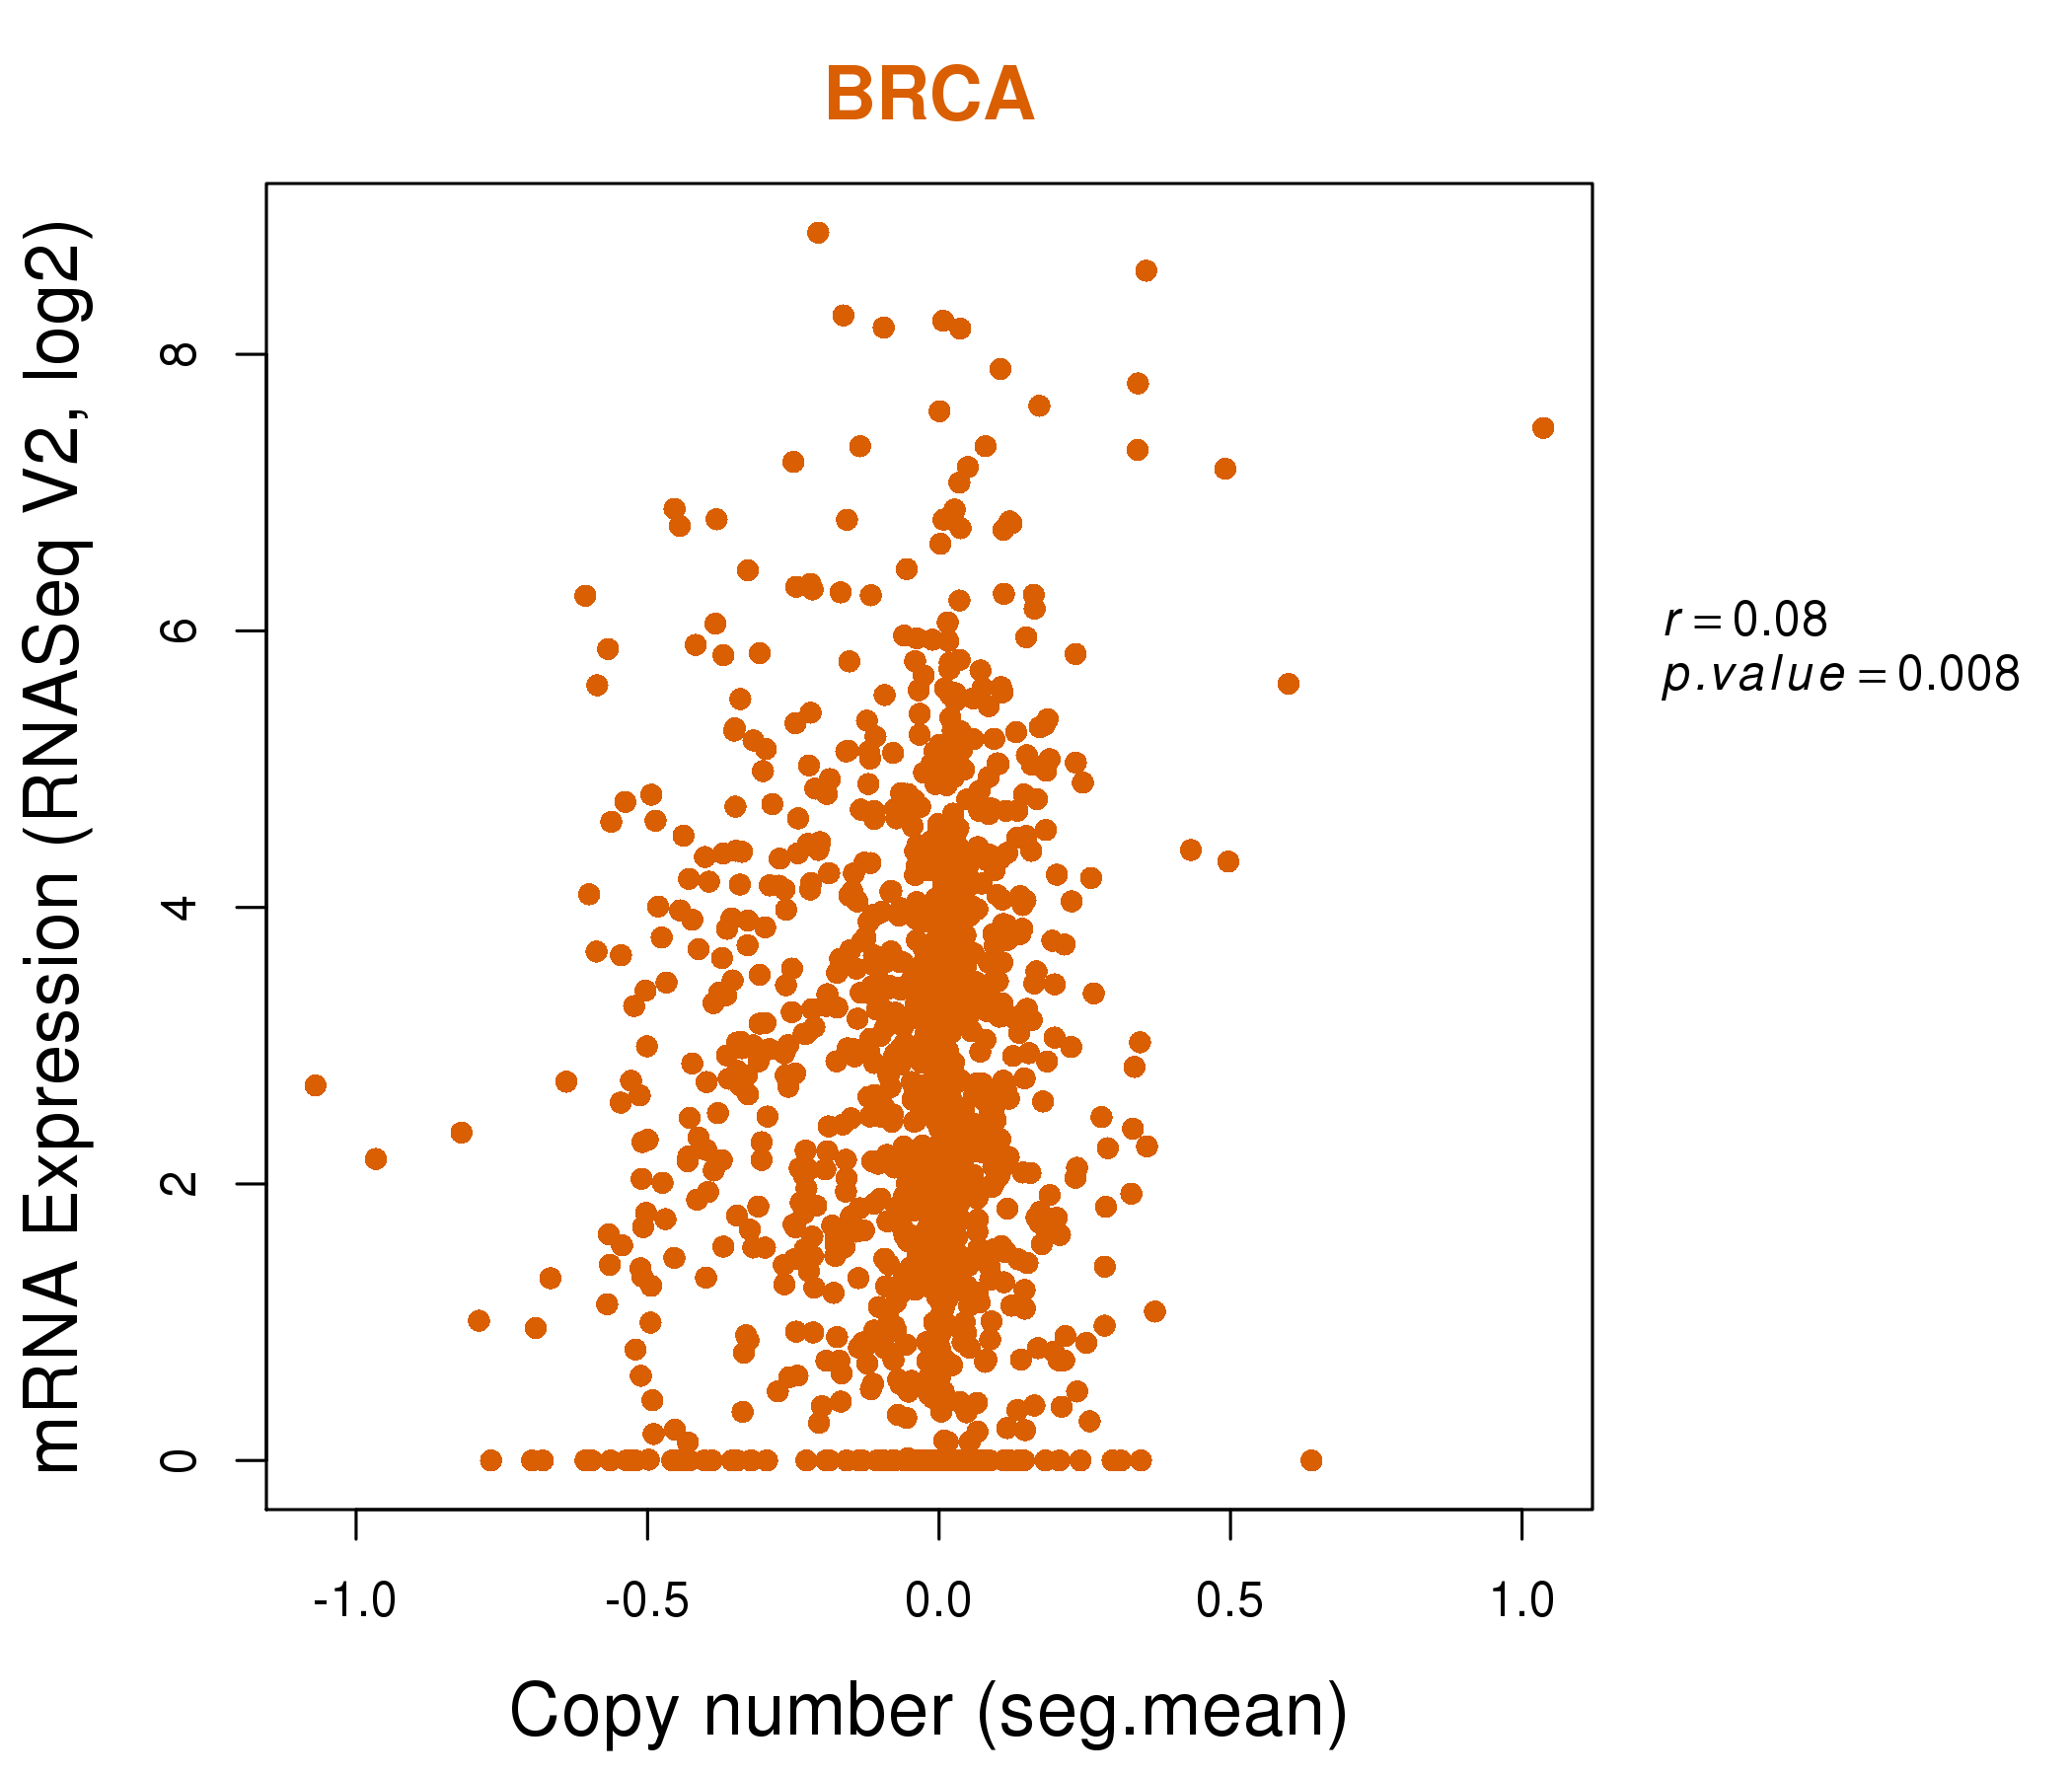
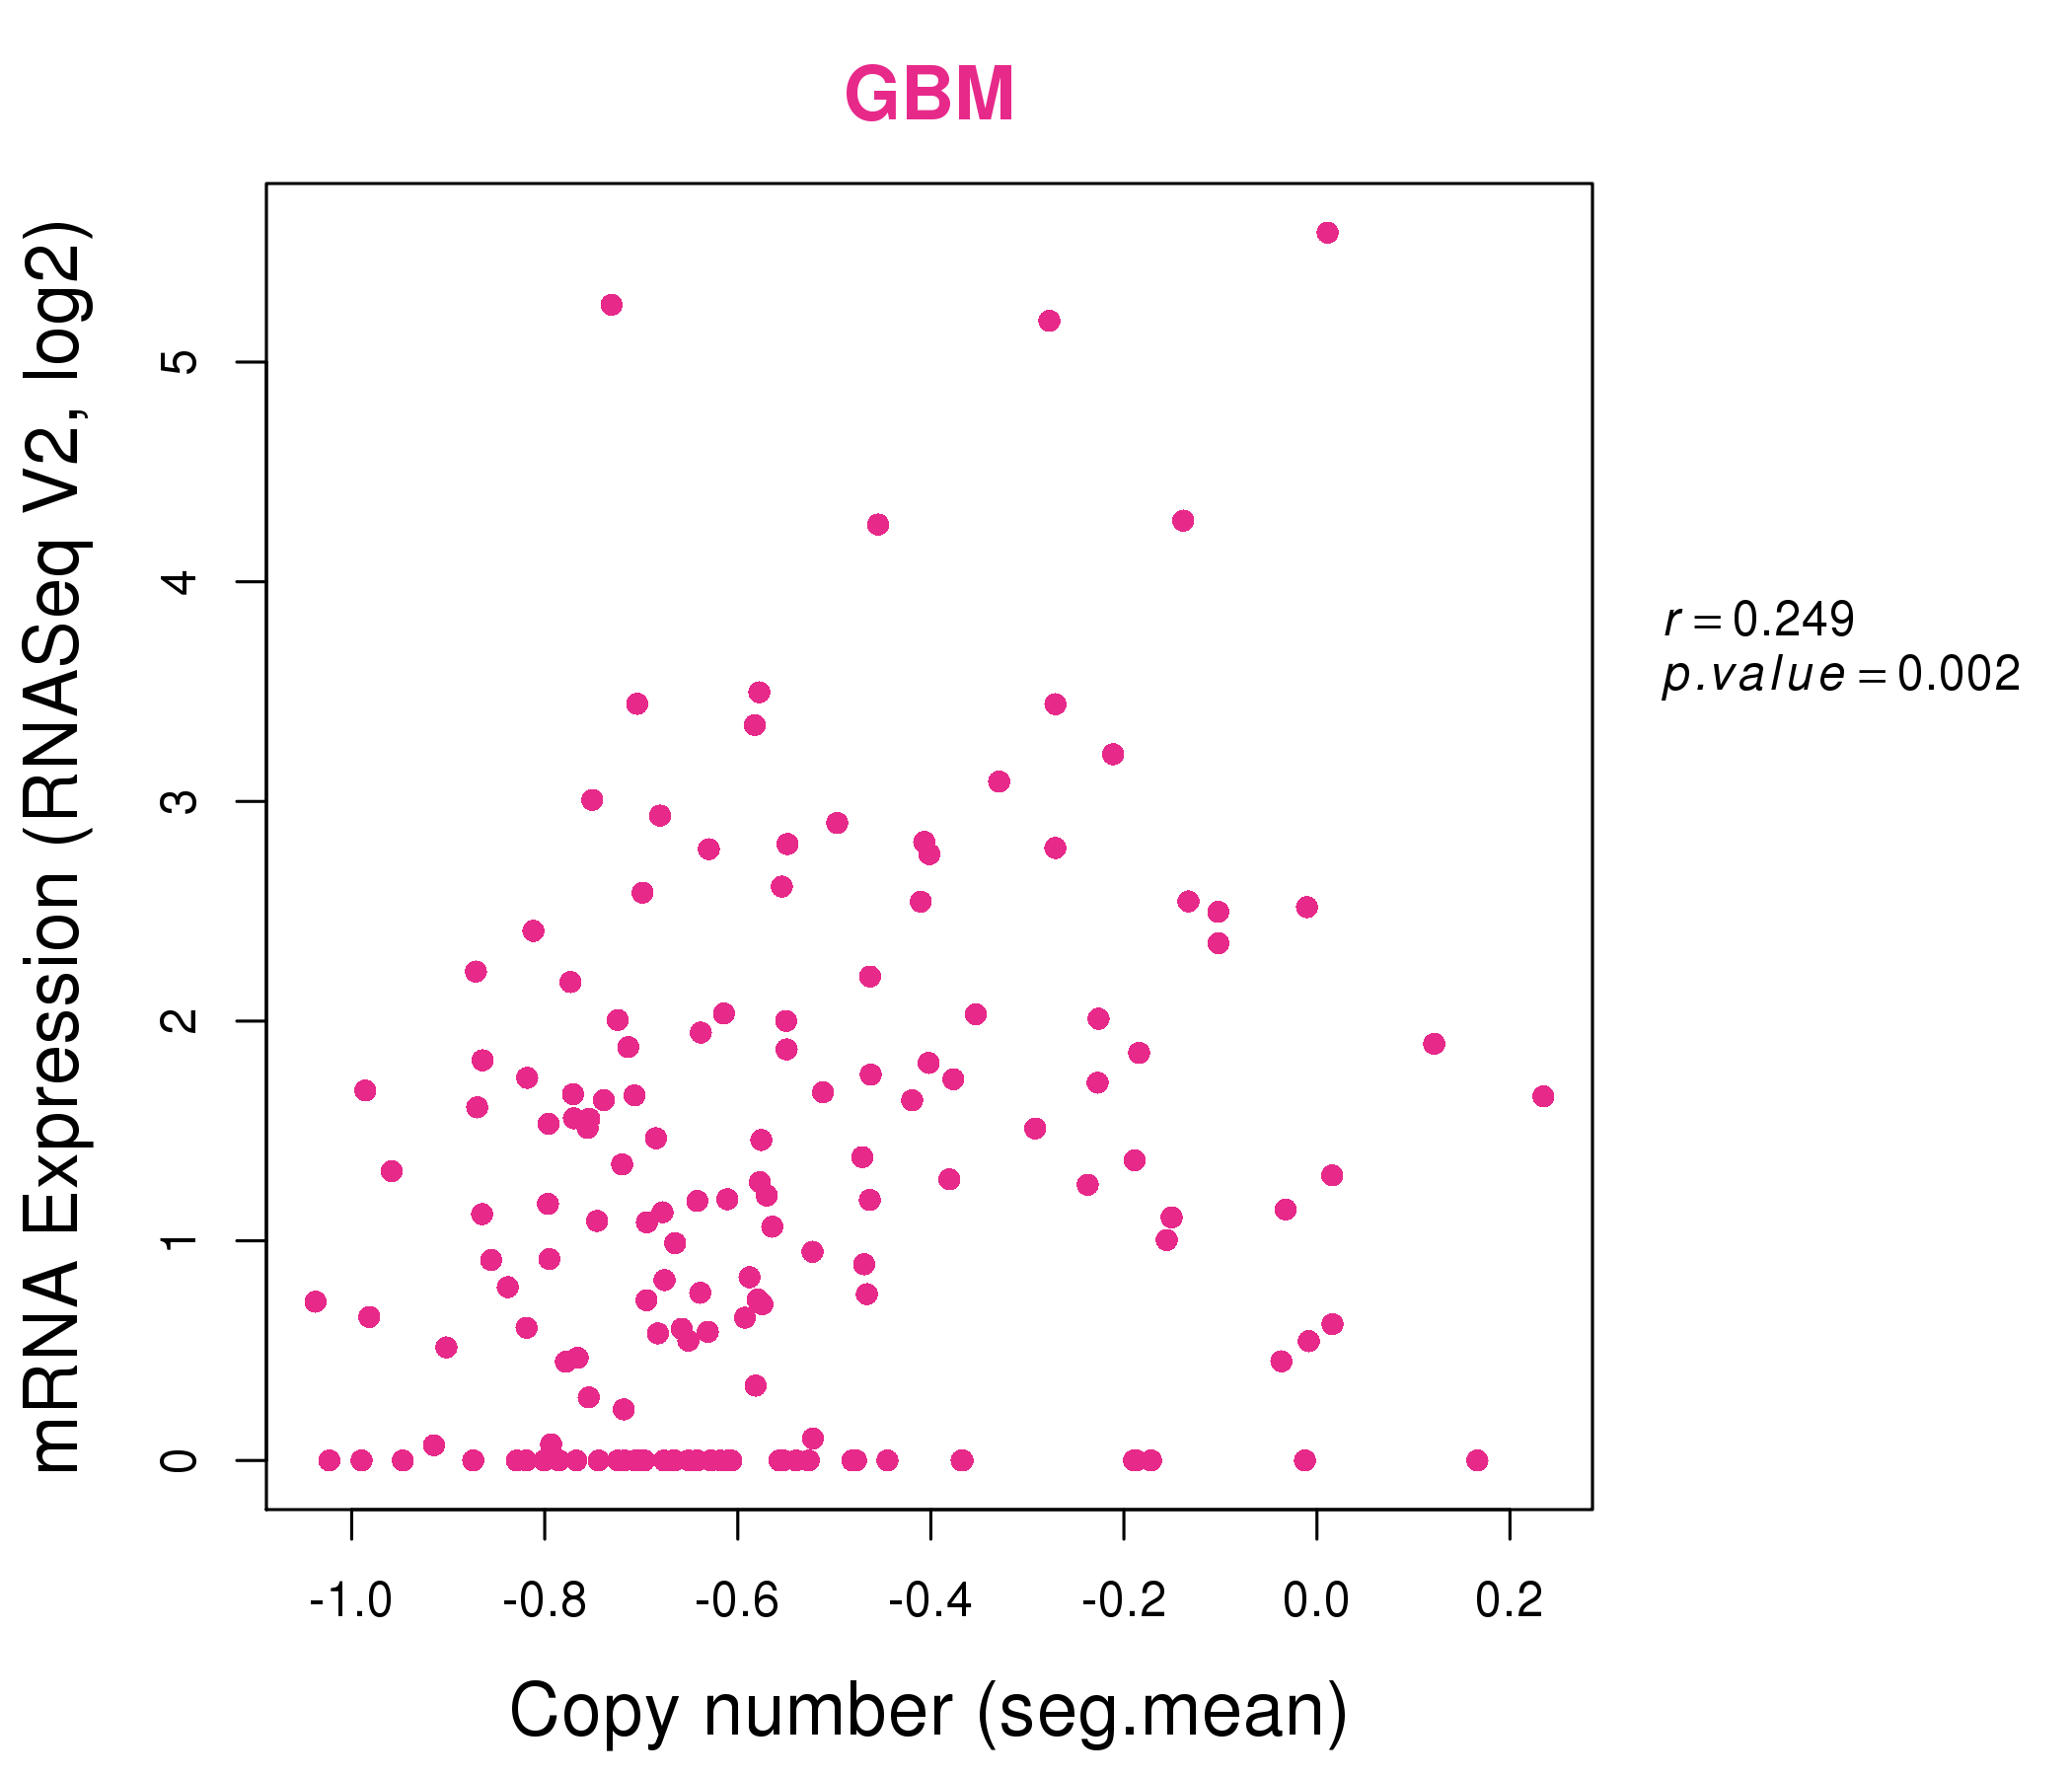
| * This plots show the correlation between CNV and gene expression. |
: Open all plots for all cancer types
 |
|
 |
|
| Top |
| Gene-Gene Network Information |
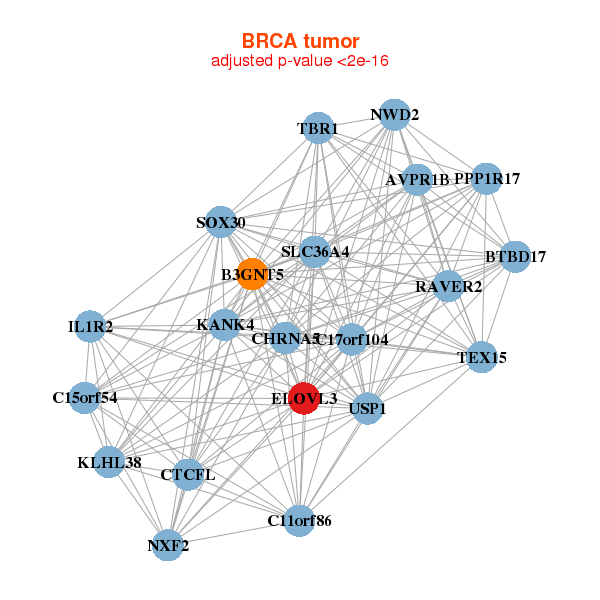
| * Co-Expression network figures were drawn using R package igraph. Only the top 20 genes with the highest correlations were shown. Red circle: input gene, orange circle: cell metabolism gene, sky circle: other gene |
: Open all plots for all cancer types
 |
|
| AVPR1B,B3GNT5,BTBD17,C11orf86,C15orf54,C17orf104,PPP1R17, CHRNA5,CTCFL,ELOVL3,IL1R2,KANK4,NWD2,KLHL38, NXF2,RAVER2,SLC36A4,SOX30,TBR1,TEX15,USP1 | ABHD15,ACACB,ACVR1C,ADH1A,ADH1B,ANKRD53,RHOV___CHP1, CIDEA,ELOVL3,FGFRL1,GHR,LGALS12,MLXIPL,MARC1, NXNL1,ORMDL3,PCK1,PECR,SLC19A3,SLC7A10,TMEM132C |
 |
|
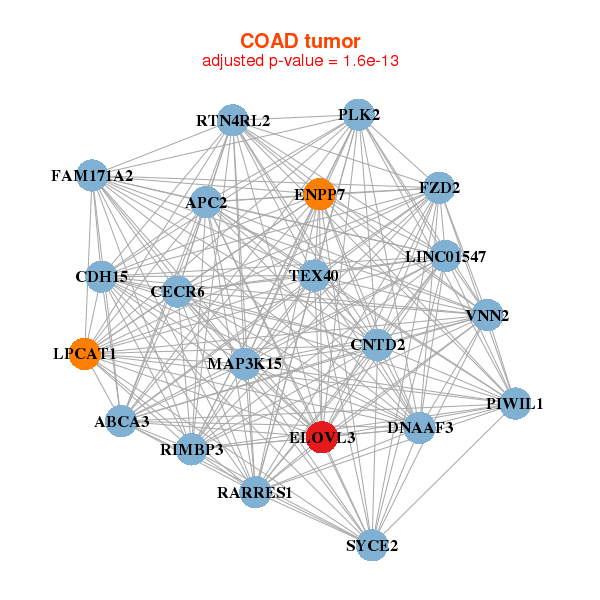
| ABCA3,APC2,TEX40,DNAAF3,LINC01547,CDH15,CECR6, CNTD2,ELOVL3,ENPP7,FAM171A2,FZD2,LPCAT1,MAP3K15, PIWIL1,PLK2,RARRES1,RIMBP3,RTN4RL2,SYCE2,VNN2 | ADIPOQ,TEX26,CIDEA,DEFB132,DGAT2,ELOVL3,FABP4, FAM26D,FCN2,G0S2,KCNIP2,LGALS12,LIPE,LOC283392, LPL,MRAP,PLIN1,SCD,SLC7A10,THRSP,TUSC5 |
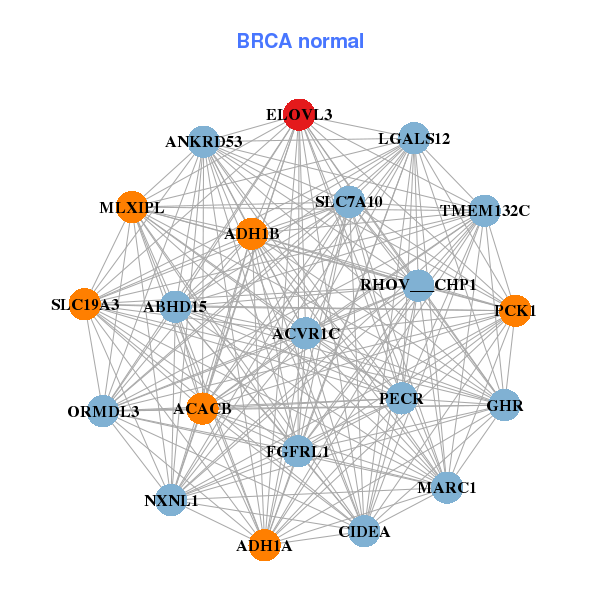
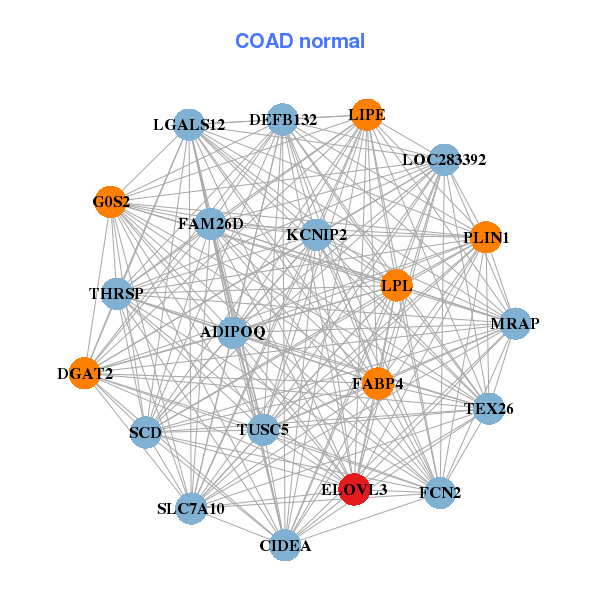
| * Co-Expression network figures were drawn using R package igraph. Only the top 20 genes with the highest correlations were shown. Red circle: input gene, orange circle: cell metabolism gene, sky circle: other gene |
: Open all plots for all cancer types
| Top |
: Open all interacting genes' information including KEGG pathway for all interacting genes from DAVID
| Top |
| Pharmacological Information for ELOVL3 |
| There's no related Drug. |
| Top |
| Cross referenced IDs for ELOVL3 |
| * We obtained these cross-references from Uniprot database. It covers 150 different DBs, 18 categories. http://www.uniprot.org/help/cross_references_section |
: Open all cross reference information
|
Copyright © 2016-Present - The Univsersity of Texas Health Science Center at Houston @ |