|
||||||||||||||||||||
| |
| Phenotypic Information (metabolism pathway, cancer, disease, phenome) |
| |
| |
| Gene-Gene Network Information: Co-Expression Network, Interacting Genes & KEGG |
| |
|


| Gene Summary for LONP2 |
| Top |
| Phenotypic Information for LONP2(metabolism pathway, cancer, disease, phenome) |
| Cancer | CGAP: LONP2 |
| Familial Cancer Database: LONP2 | |
| * This gene is included in those cancer gene databases. |
|
|
|
|
|
| . | ||||||||||||||
Oncogene 1 | Significant driver gene in | |||||||||||||||||||
| cf) number; DB name 1 Oncogene; http://nar.oxfordjournals.org/content/35/suppl_1/D721.long, 2 Tumor Suppressor gene; https://bioinfo.uth.edu/TSGene/, 3 Cancer Gene Census; http://www.nature.com/nrc/journal/v4/n3/abs/nrc1299.html, 4 CancerGenes; http://nar.oxfordjournals.org/content/35/suppl_1/D721.long, 5 Network of Cancer Gene; http://ncg.kcl.ac.uk/index.php, 1Therapeutic Vulnerabilities in Cancer; http://cbio.mskcc.org/cancergenomics/statius/ |
| REACTOME_METABOLISM_OF_PROTEINS | |
| OMIM | |
| Orphanet | |
| Disease | KEGG Disease: LONP2 |
| MedGen: LONP2 (Human Medical Genetics with Condition) | |
| ClinVar: LONP2 | |
| Phenotype | MGI: LONP2 (International Mouse Phenotyping Consortium) |
| PhenomicDB: LONP2 | |
| Mutations for LONP2 |
| * Under tables are showing count per each tissue to give us broad intuition about tissue specific mutation patterns.You can go to the detailed page for each mutation database's web site. |
| There's no structural variation information in COSMIC data for this gene. |
| * From mRNA Sanger sequences, Chitars2.0 arranged chimeric transcripts. This table shows LONP2 related fusion information. |
| ID | Head Gene | Tail Gene | Accession | Gene_a | qStart_a | qEnd_a | Chromosome_a | tStart_a | tEnd_a | Gene_a | qStart_a | qEnd_a | Chromosome_a | tStart_a | tEnd_a |
| Top |
| There's no copy number variation information in COSMIC data for this gene. |
| Top |
|
 |
| Top |
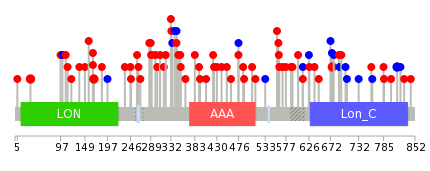
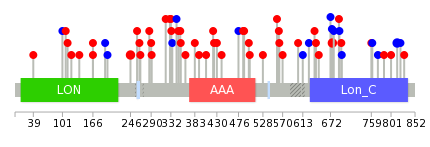
| Stat. for Non-Synonymous SNVs (# total SNVs=55) | (# total SNVs=12) |
 |  |
(# total SNVs=1) | (# total SNVs=0) |
 |
| Top |
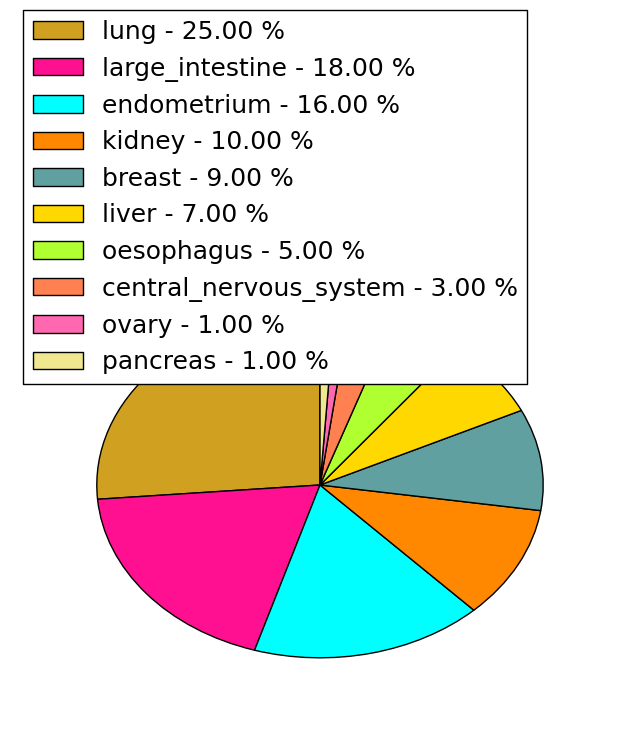
| * When you move the cursor on each content, you can see more deailed mutation information on the Tooltip. Those are primary_site,primary_histology,mutation(aa),pubmedID. |
| GRCh37 position | Mutation(aa) | Unique sampleID count |
| chr16:48381506-48381506 | p.R676Q | 2 |
| chr16:48385596-48385596 | p.N814N | 2 |
| chr16:48278396-48278396 | p.V33L | 2 |
| chr16:48290555-48290555 | p.V168D | 2 |
| chr16:48329968-48329968 | p.L476L | 2 |
| chr16:48303976-48303976 | p.Y344Y | 1 |
| chr16:48337184-48337184 | p.K588M | 1 |
| chr16:48286166-48286166 | p.P120S | 1 |
| chr16:48304164-48304164 | p.Q407R | 1 |
| chr16:48381505-48381505 | p.R676* | 1 |
| Top |
|
 |
| Point Mutation/ Tissue ID | 1 | 2 | 3 | 4 | 5 | 6 | 7 | 8 | 9 | 10 | 11 | 12 | 13 | 14 | 15 | 16 | 17 | 18 | 19 | 20 |
| # sample | 5 | 4 | 8 | 1 | 4 | 5 | 1 | 5 | 4 | 8 | 9 | 1 | 9 | |||||||
| # mutation | 5 | 4 | 8 | 1 | 4 | 5 | 1 | 8 | 4 | 9 | 9 | 1 | 9 | |||||||
| nonsynonymous SNV | 1 | 3 | 6 | 1 | 3 | 4 | 7 | 4 | 7 | 7 | 1 | 6 | ||||||||
| synonymous SNV | 4 | 1 | 2 | 1 | 1 | 1 | 1 | 2 | 2 | 3 |
| cf) Tissue ID; Tissue type (1; BLCA[Bladder Urothelial Carcinoma], 2; BRCA[Breast invasive carcinoma], 3; CESC[Cervical squamous cell carcinoma and endocervical adenocarcinoma], 4; COAD[Colon adenocarcinoma], 5; GBM[Glioblastoma multiforme], 6; Glioma Low Grade, 7; HNSC[Head and Neck squamous cell carcinoma], 8; KICH[Kidney Chromophobe], 9; KIRC[Kidney renal clear cell carcinoma], 10; KIRP[Kidney renal papillary cell carcinoma], 11; LAML[Acute Myeloid Leukemia], 12; LUAD[Lung adenocarcinoma], 13; LUSC[Lung squamous cell carcinoma], 14; OV[Ovarian serous cystadenocarcinoma ], 15; PAAD[Pancreatic adenocarcinoma], 16; PRAD[Prostate adenocarcinoma], 17; SKCM[Skin Cutaneous Melanoma], 18:STAD[Stomach adenocarcinoma], 19:THCA[Thyroid carcinoma], 20:UCEC[Uterine Corpus Endometrial Carcinoma]) |
| Top |
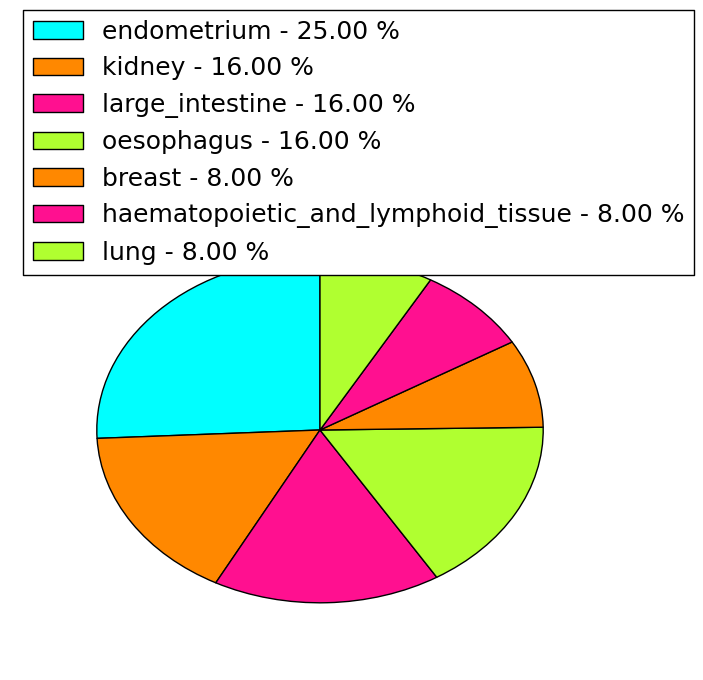
| * We represented just top 10 SNVs. When you move the cursor on each content, you can see more deailed mutation information on the Tooltip. Those are primary_site, primary_histology, mutation(aa), pubmedID. |
| Genomic Position | Mutation(aa) | Unique sampleID count |
| chr16:48381506 | p.R246H | 2 |
| chr16:48385596 | p.N814N | 2 |
| chr16:48295348 | p.R676Q | 2 |
| chr16:48330040 | p.V353L | 1 |
| chr16:48290548 | p.R562C | 1 |
| chr16:48381419 | p.S696S | 1 |
| chr16:48296762 | p.E197E | 1 |
| chr16:48304118 | p.K363E | 1 |
| chr16:48382183 | p.S563Y | 1 |
| chr16:48333621 | p.R759W | 1 |
| * Copy number data were extracted from TCGA using R package TCGA-Assembler. The URLs of all public data files on TCGA DCC data server were gathered on Jan-05-2015. Function ProcessCNAData in TCGA-Assembler package was used to obtain gene-level copy number value which is calculated as the average copy number of the genomic region of a gene. |
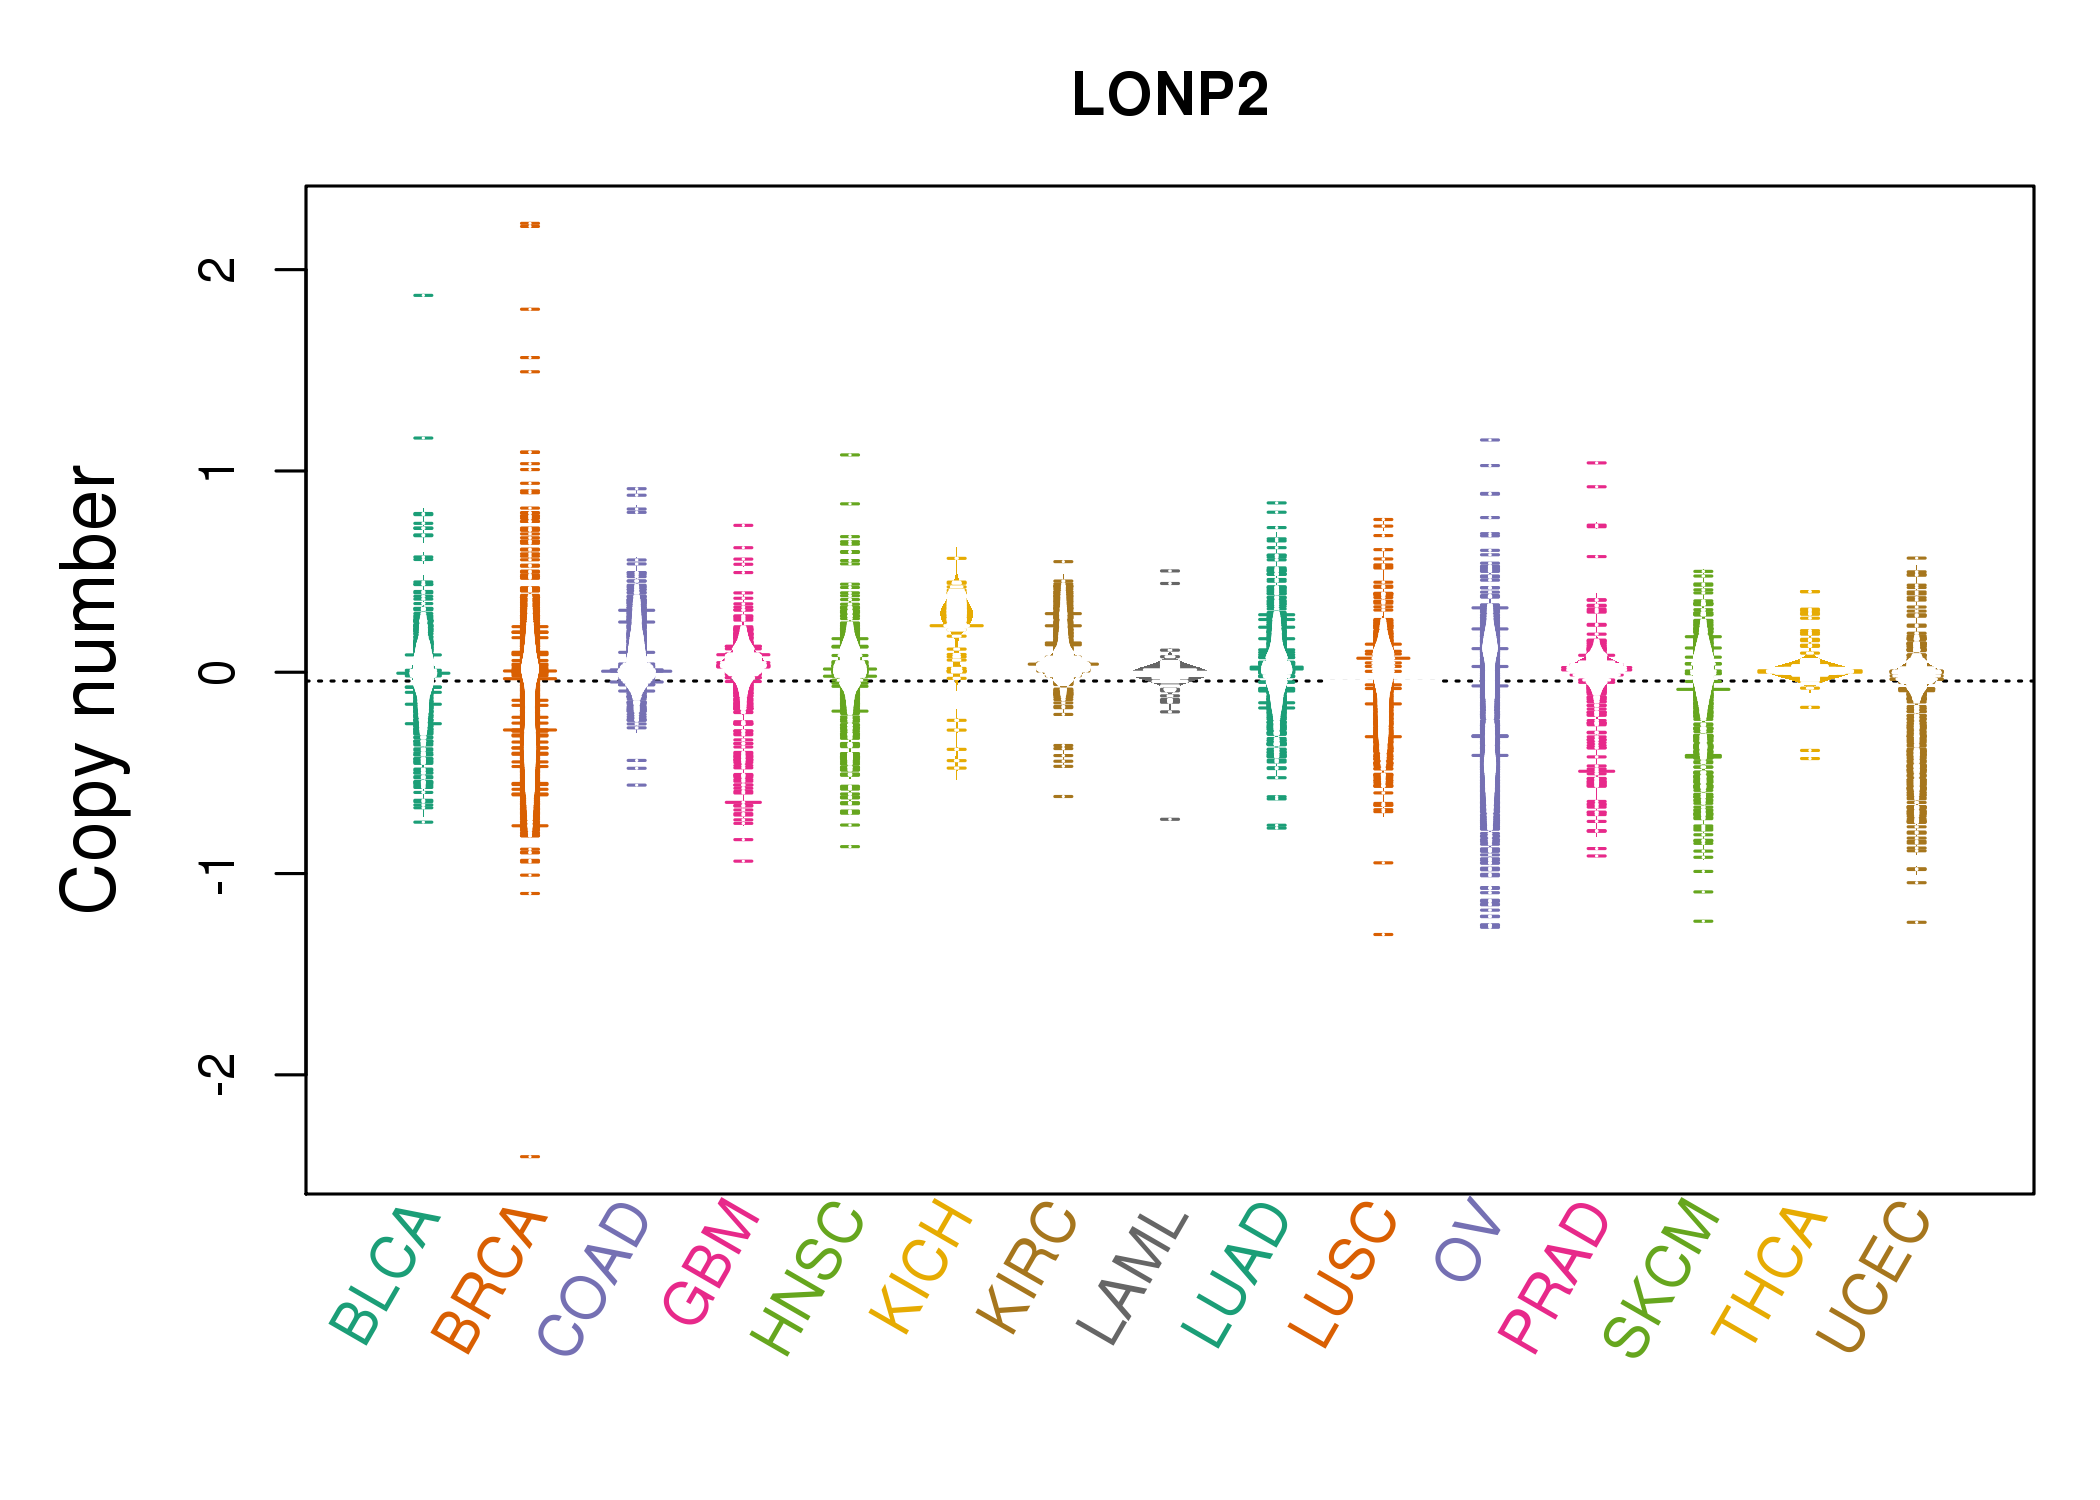 |
| cf) Tissue ID[Tissue type]: BLCA[Bladder Urothelial Carcinoma], BRCA[Breast invasive carcinoma], CESC[Cervical squamous cell carcinoma and endocervical adenocarcinoma], COAD[Colon adenocarcinoma], GBM[Glioblastoma multiforme], Glioma Low Grade, HNSC[Head and Neck squamous cell carcinoma], KICH[Kidney Chromophobe], KIRC[Kidney renal clear cell carcinoma], KIRP[Kidney renal papillary cell carcinoma], LAML[Acute Myeloid Leukemia], LUAD[Lung adenocarcinoma], LUSC[Lung squamous cell carcinoma], OV[Ovarian serous cystadenocarcinoma ], PAAD[Pancreatic adenocarcinoma], PRAD[Prostate adenocarcinoma], SKCM[Skin Cutaneous Melanoma], STAD[Stomach adenocarcinoma], THCA[Thyroid carcinoma], UCEC[Uterine Corpus Endometrial Carcinoma] |
| Top |
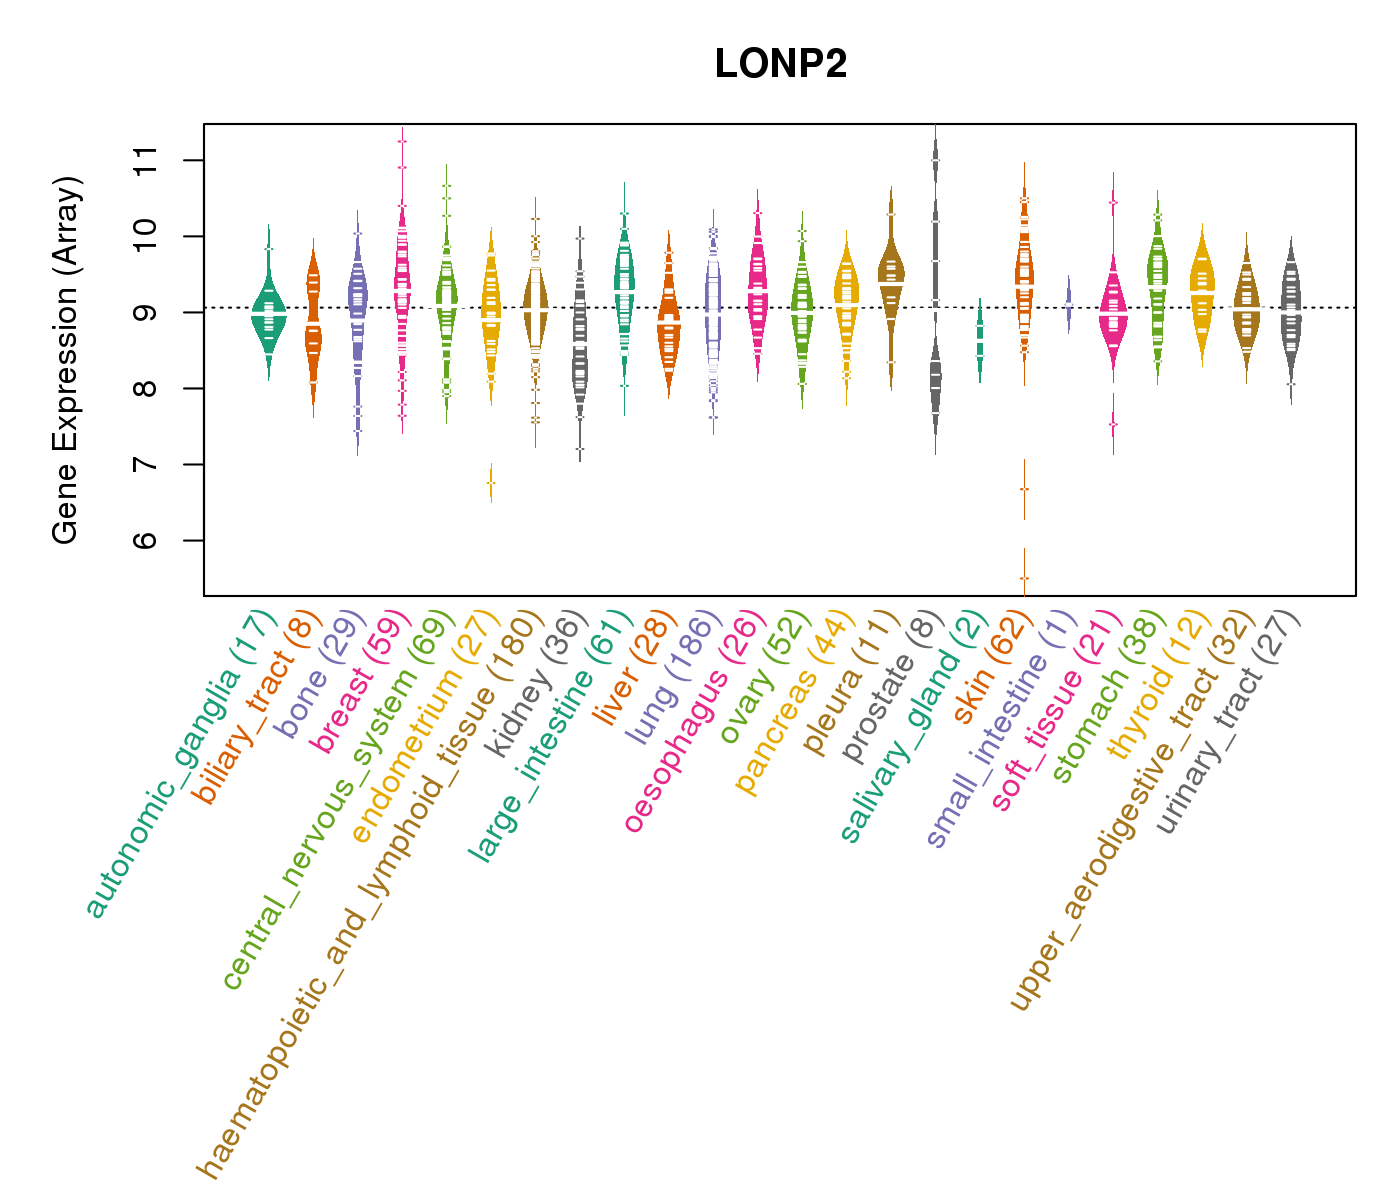
| Gene Expression for LONP2 |
| * CCLE gene expression data were extracted from CCLE_Expression_Entrez_2012-10-18.res: Gene-centric RMA-normalized mRNA expression data. |
 |
| * Normalized gene expression data of RNASeqV2 was extracted from TCGA using R package TCGA-Assembler. The URLs of all public data files on TCGA DCC data server were gathered at Jan-05-2015. Only eight cancer types have enough normal control samples for differential expression analysis. (t test, adjusted p<0.05 (using Benjamini-Hochberg FDR)) |
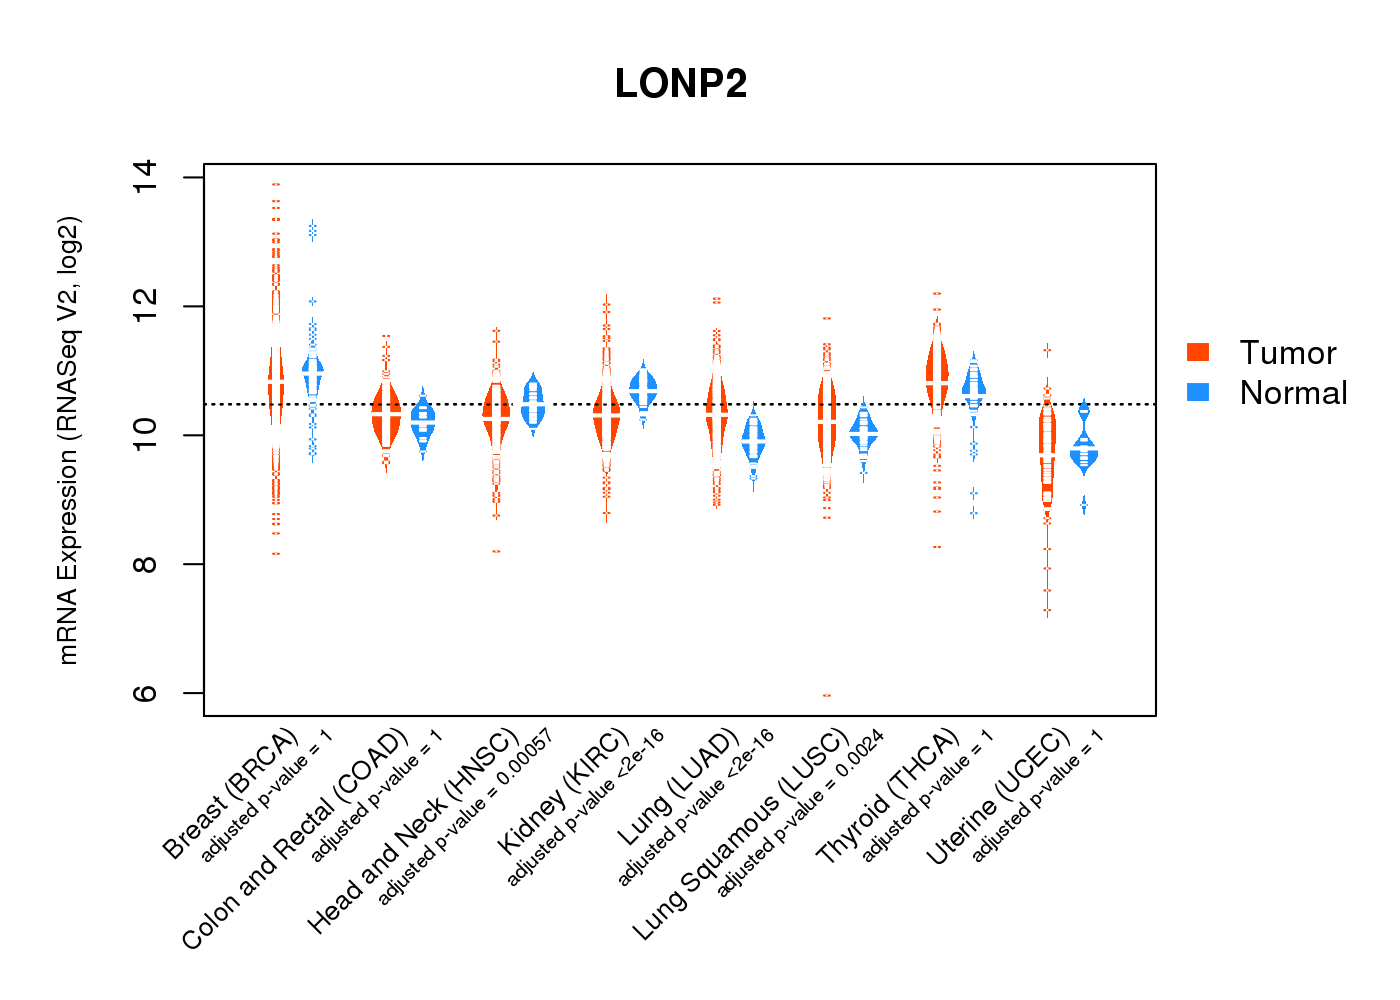 |
| Top |
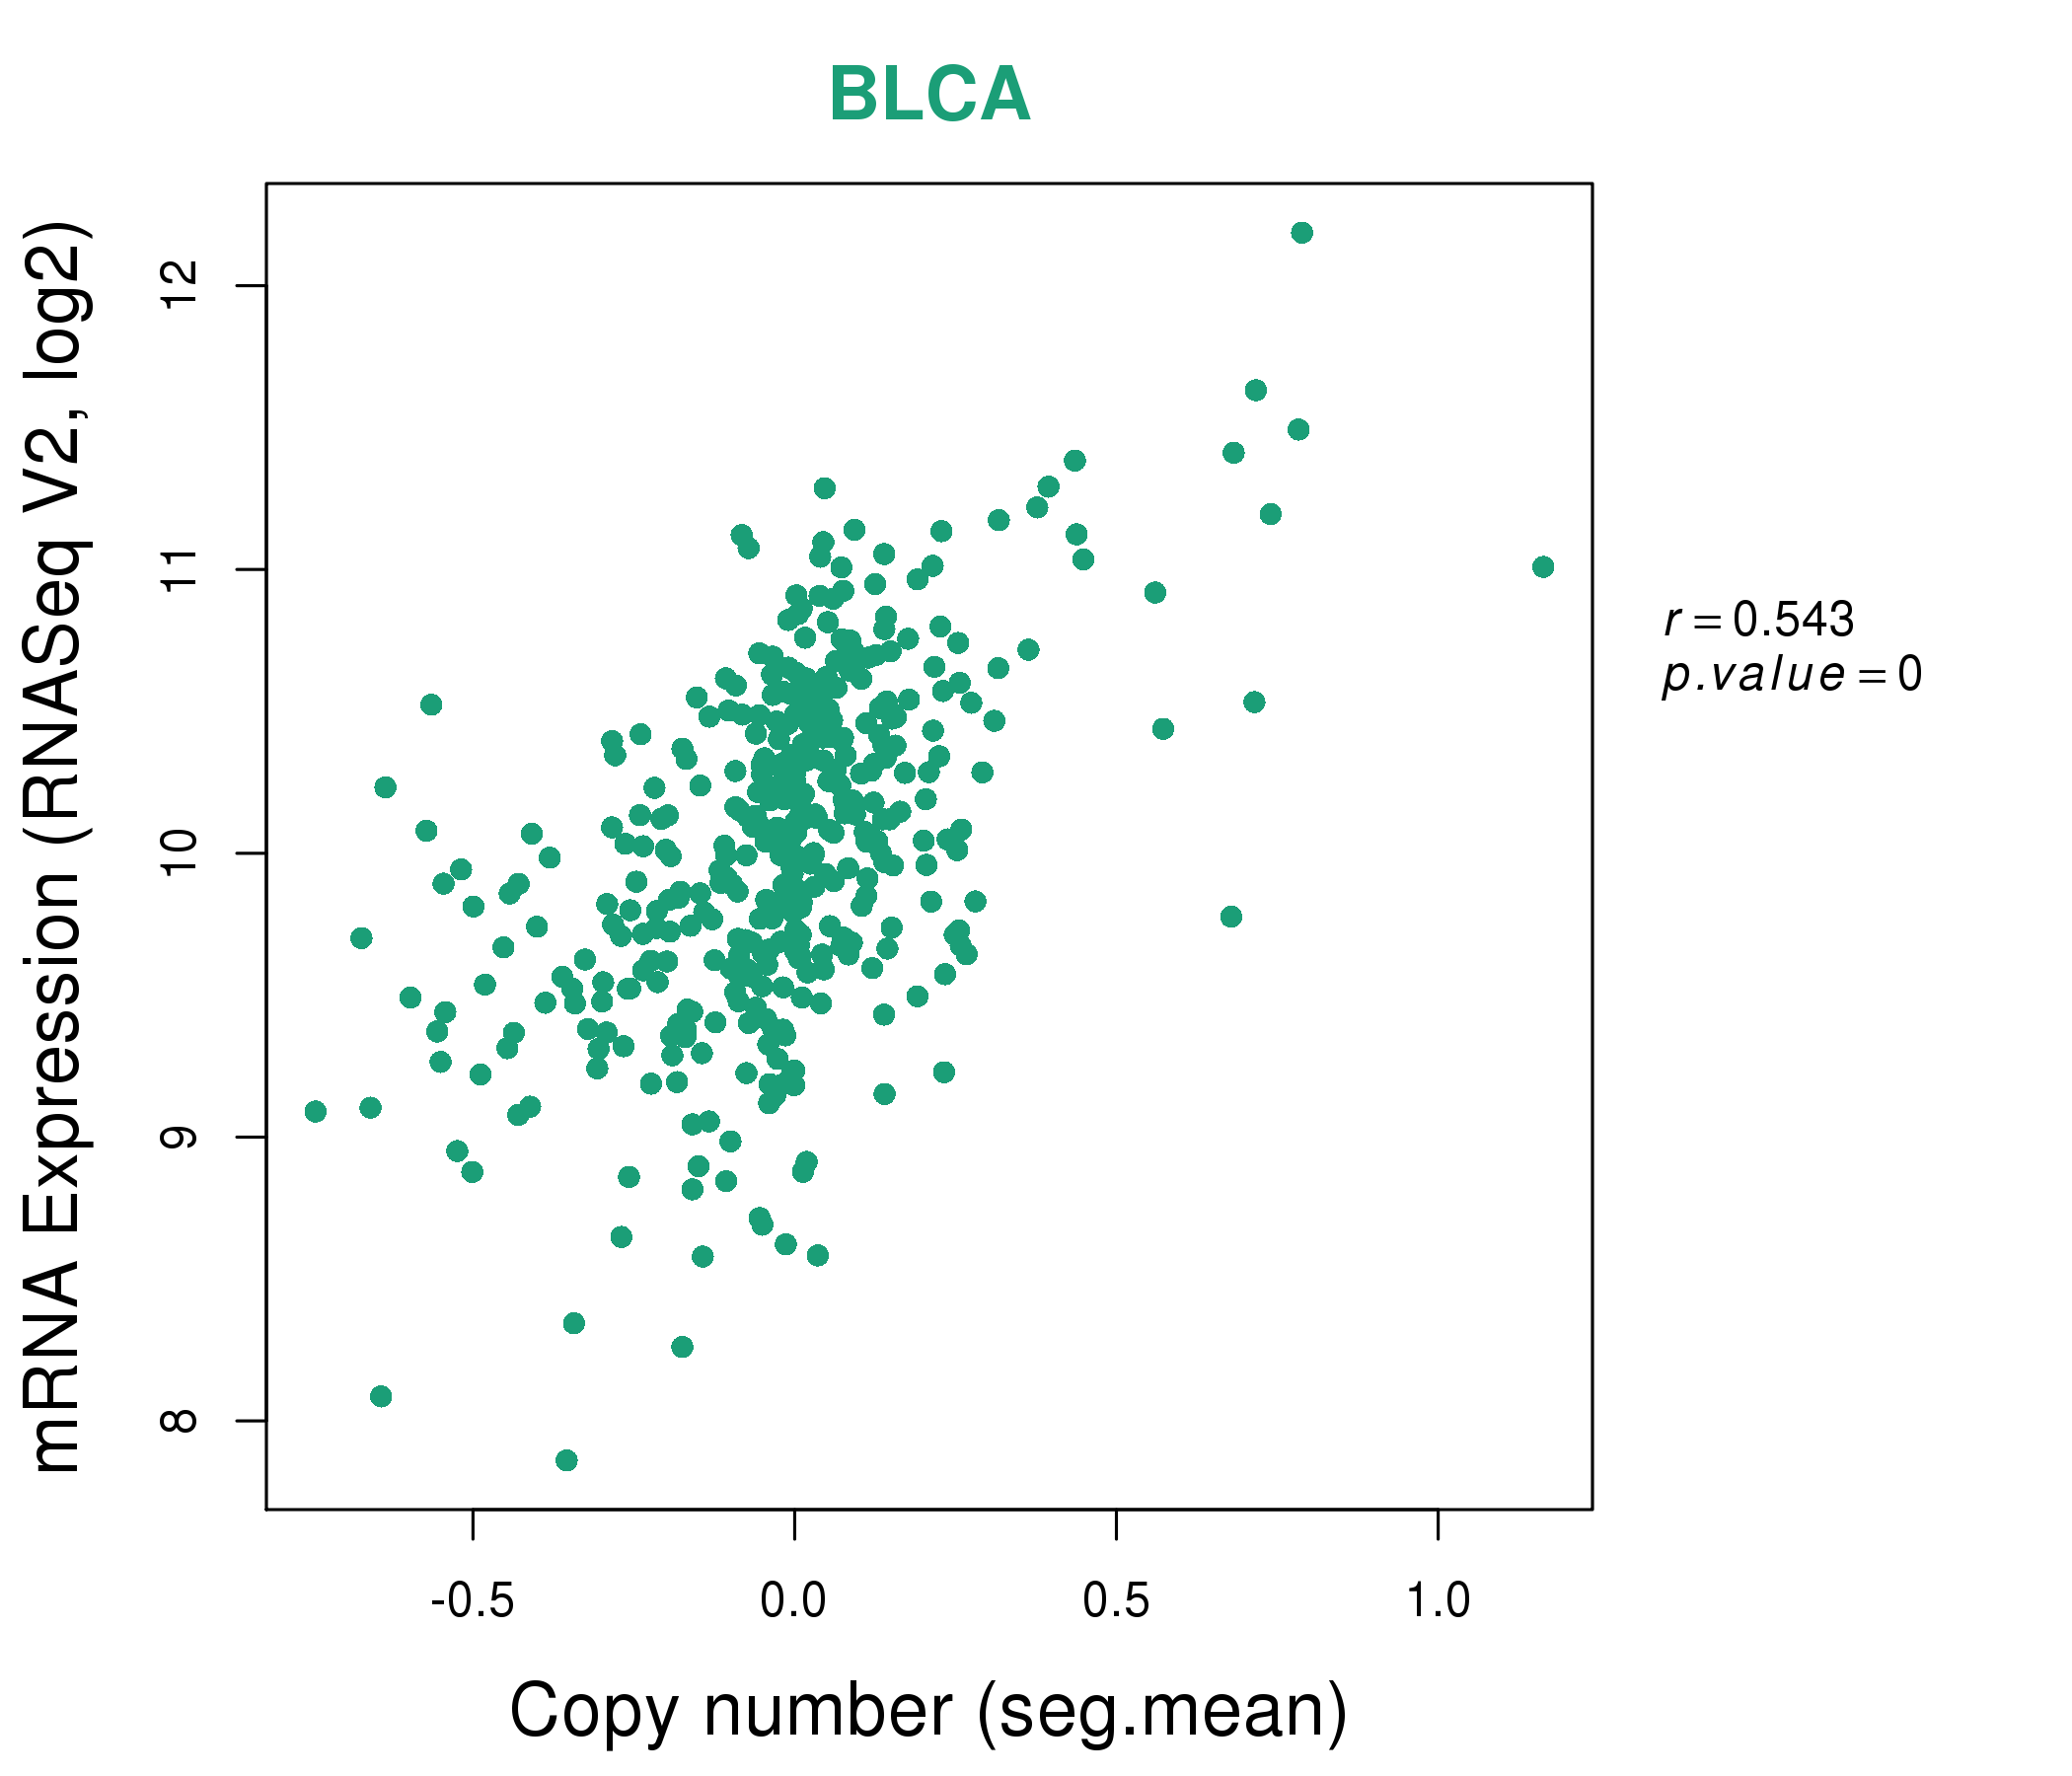
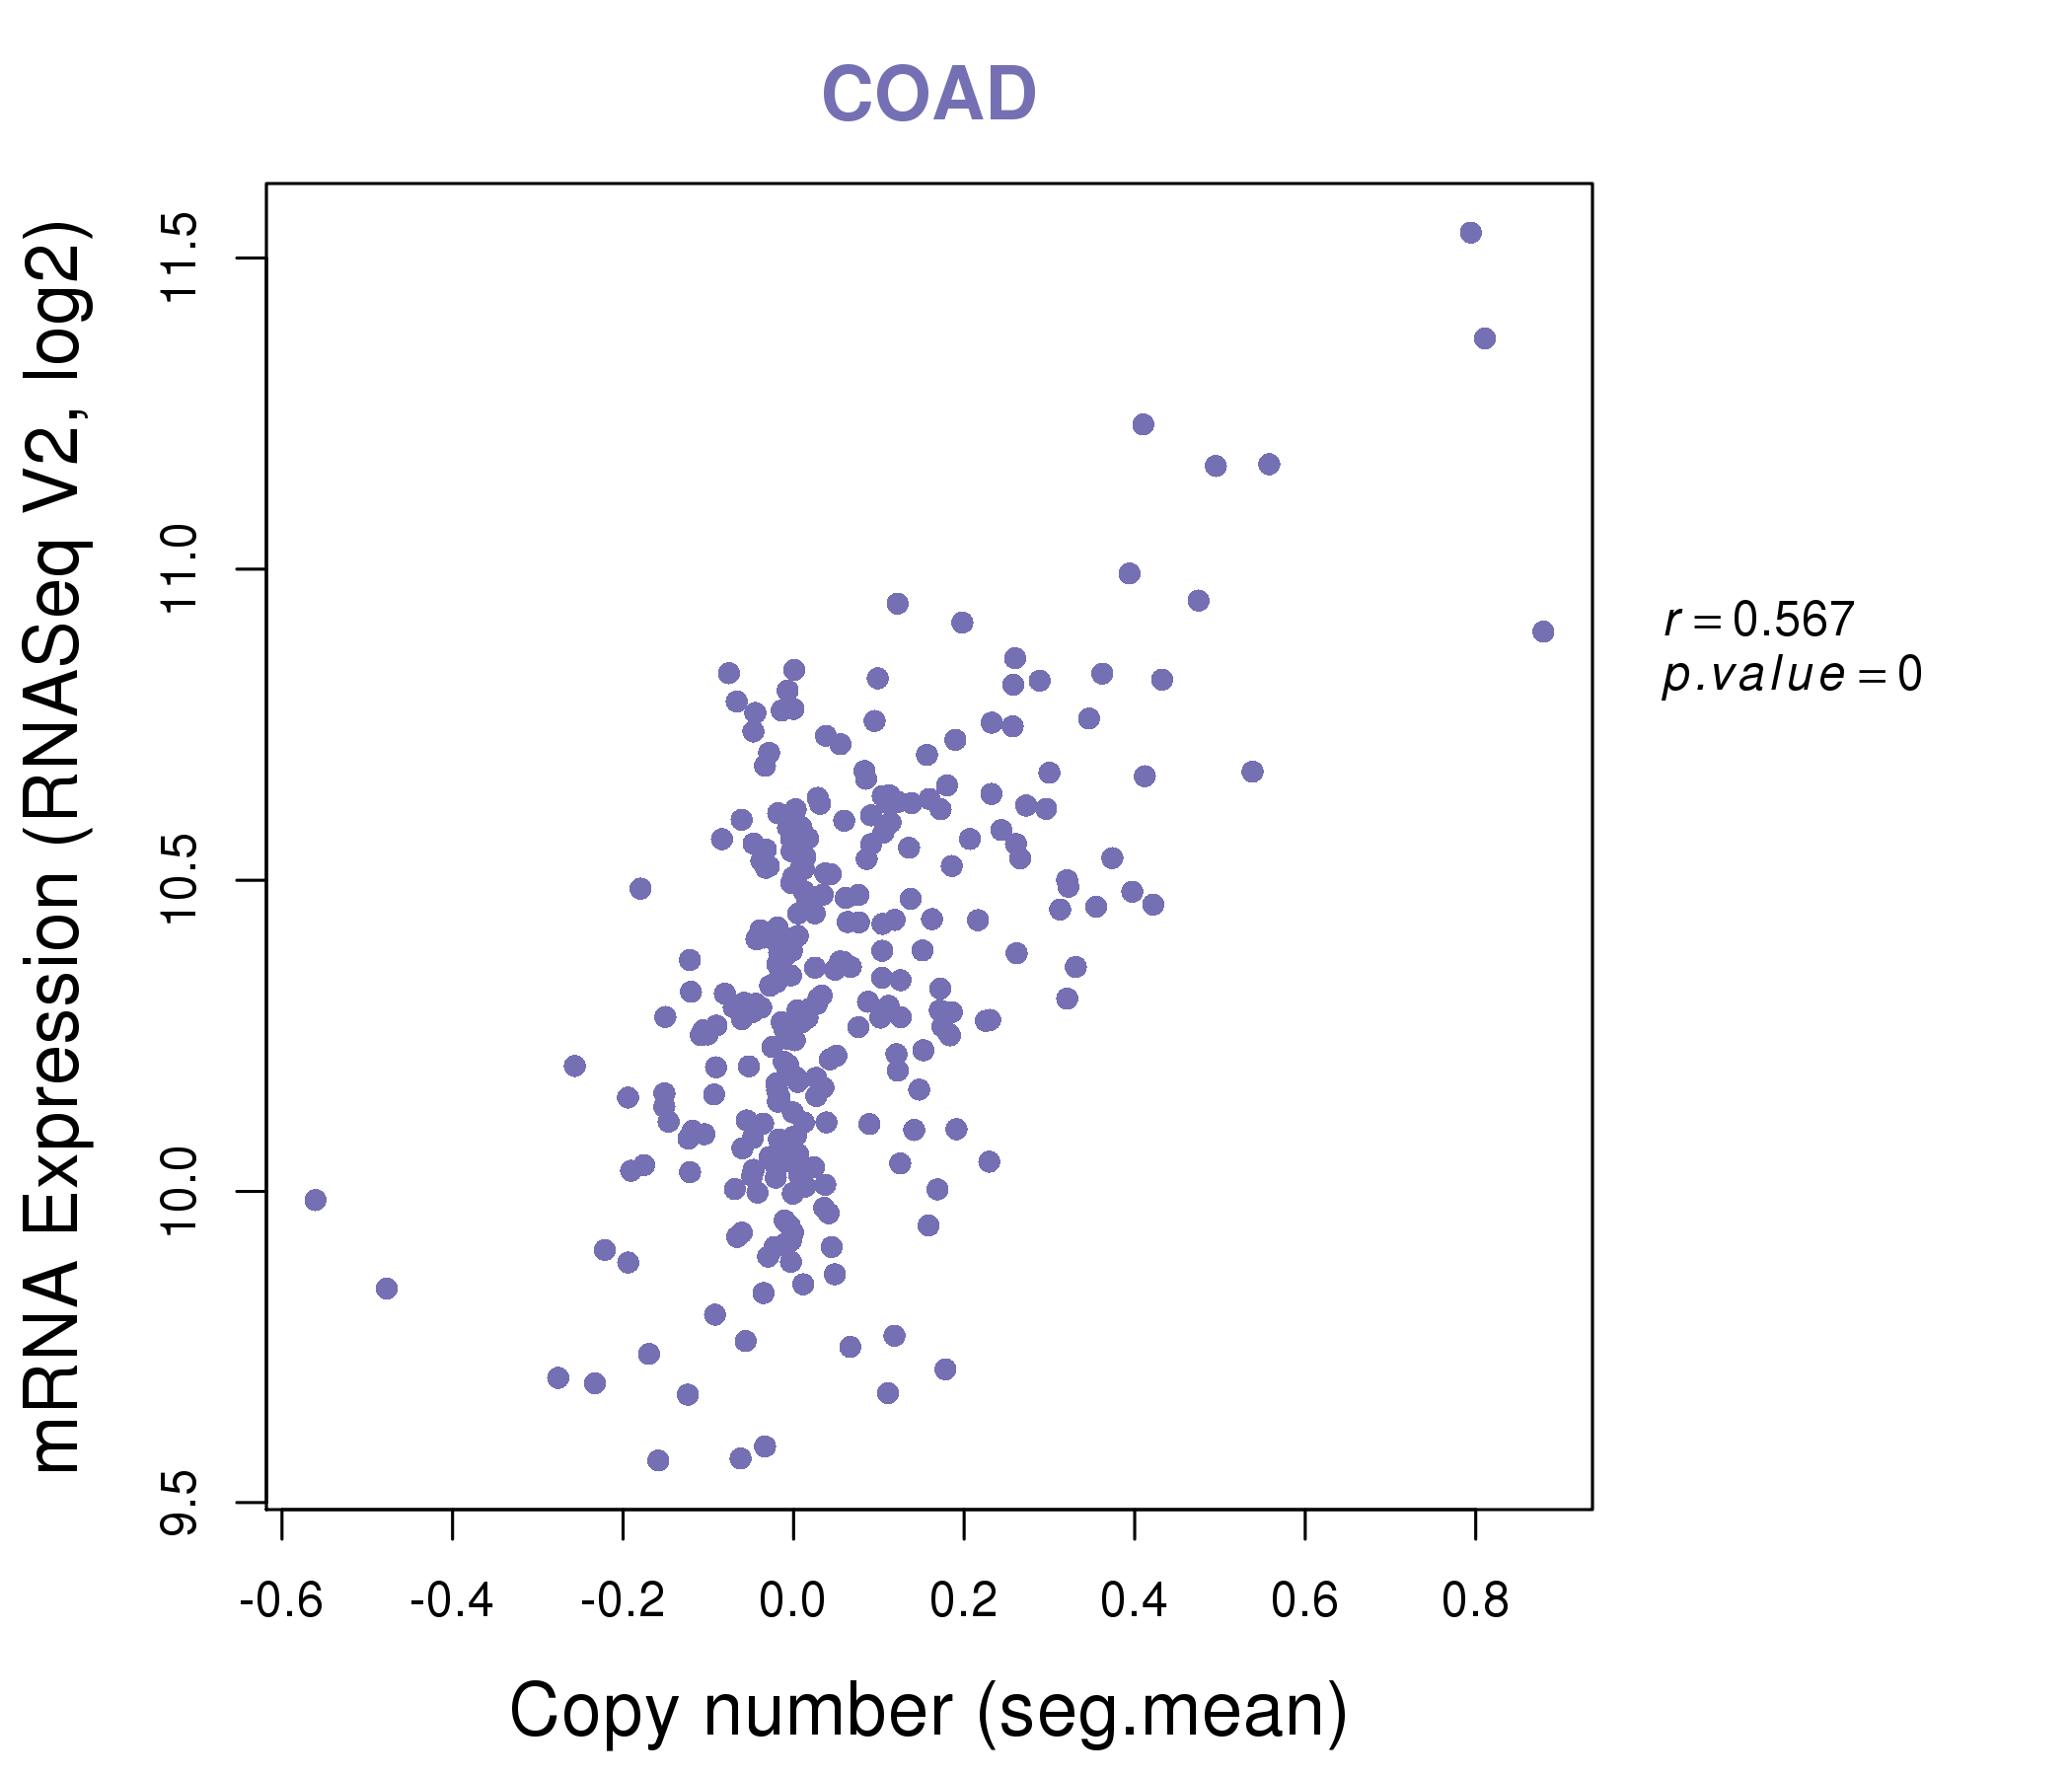
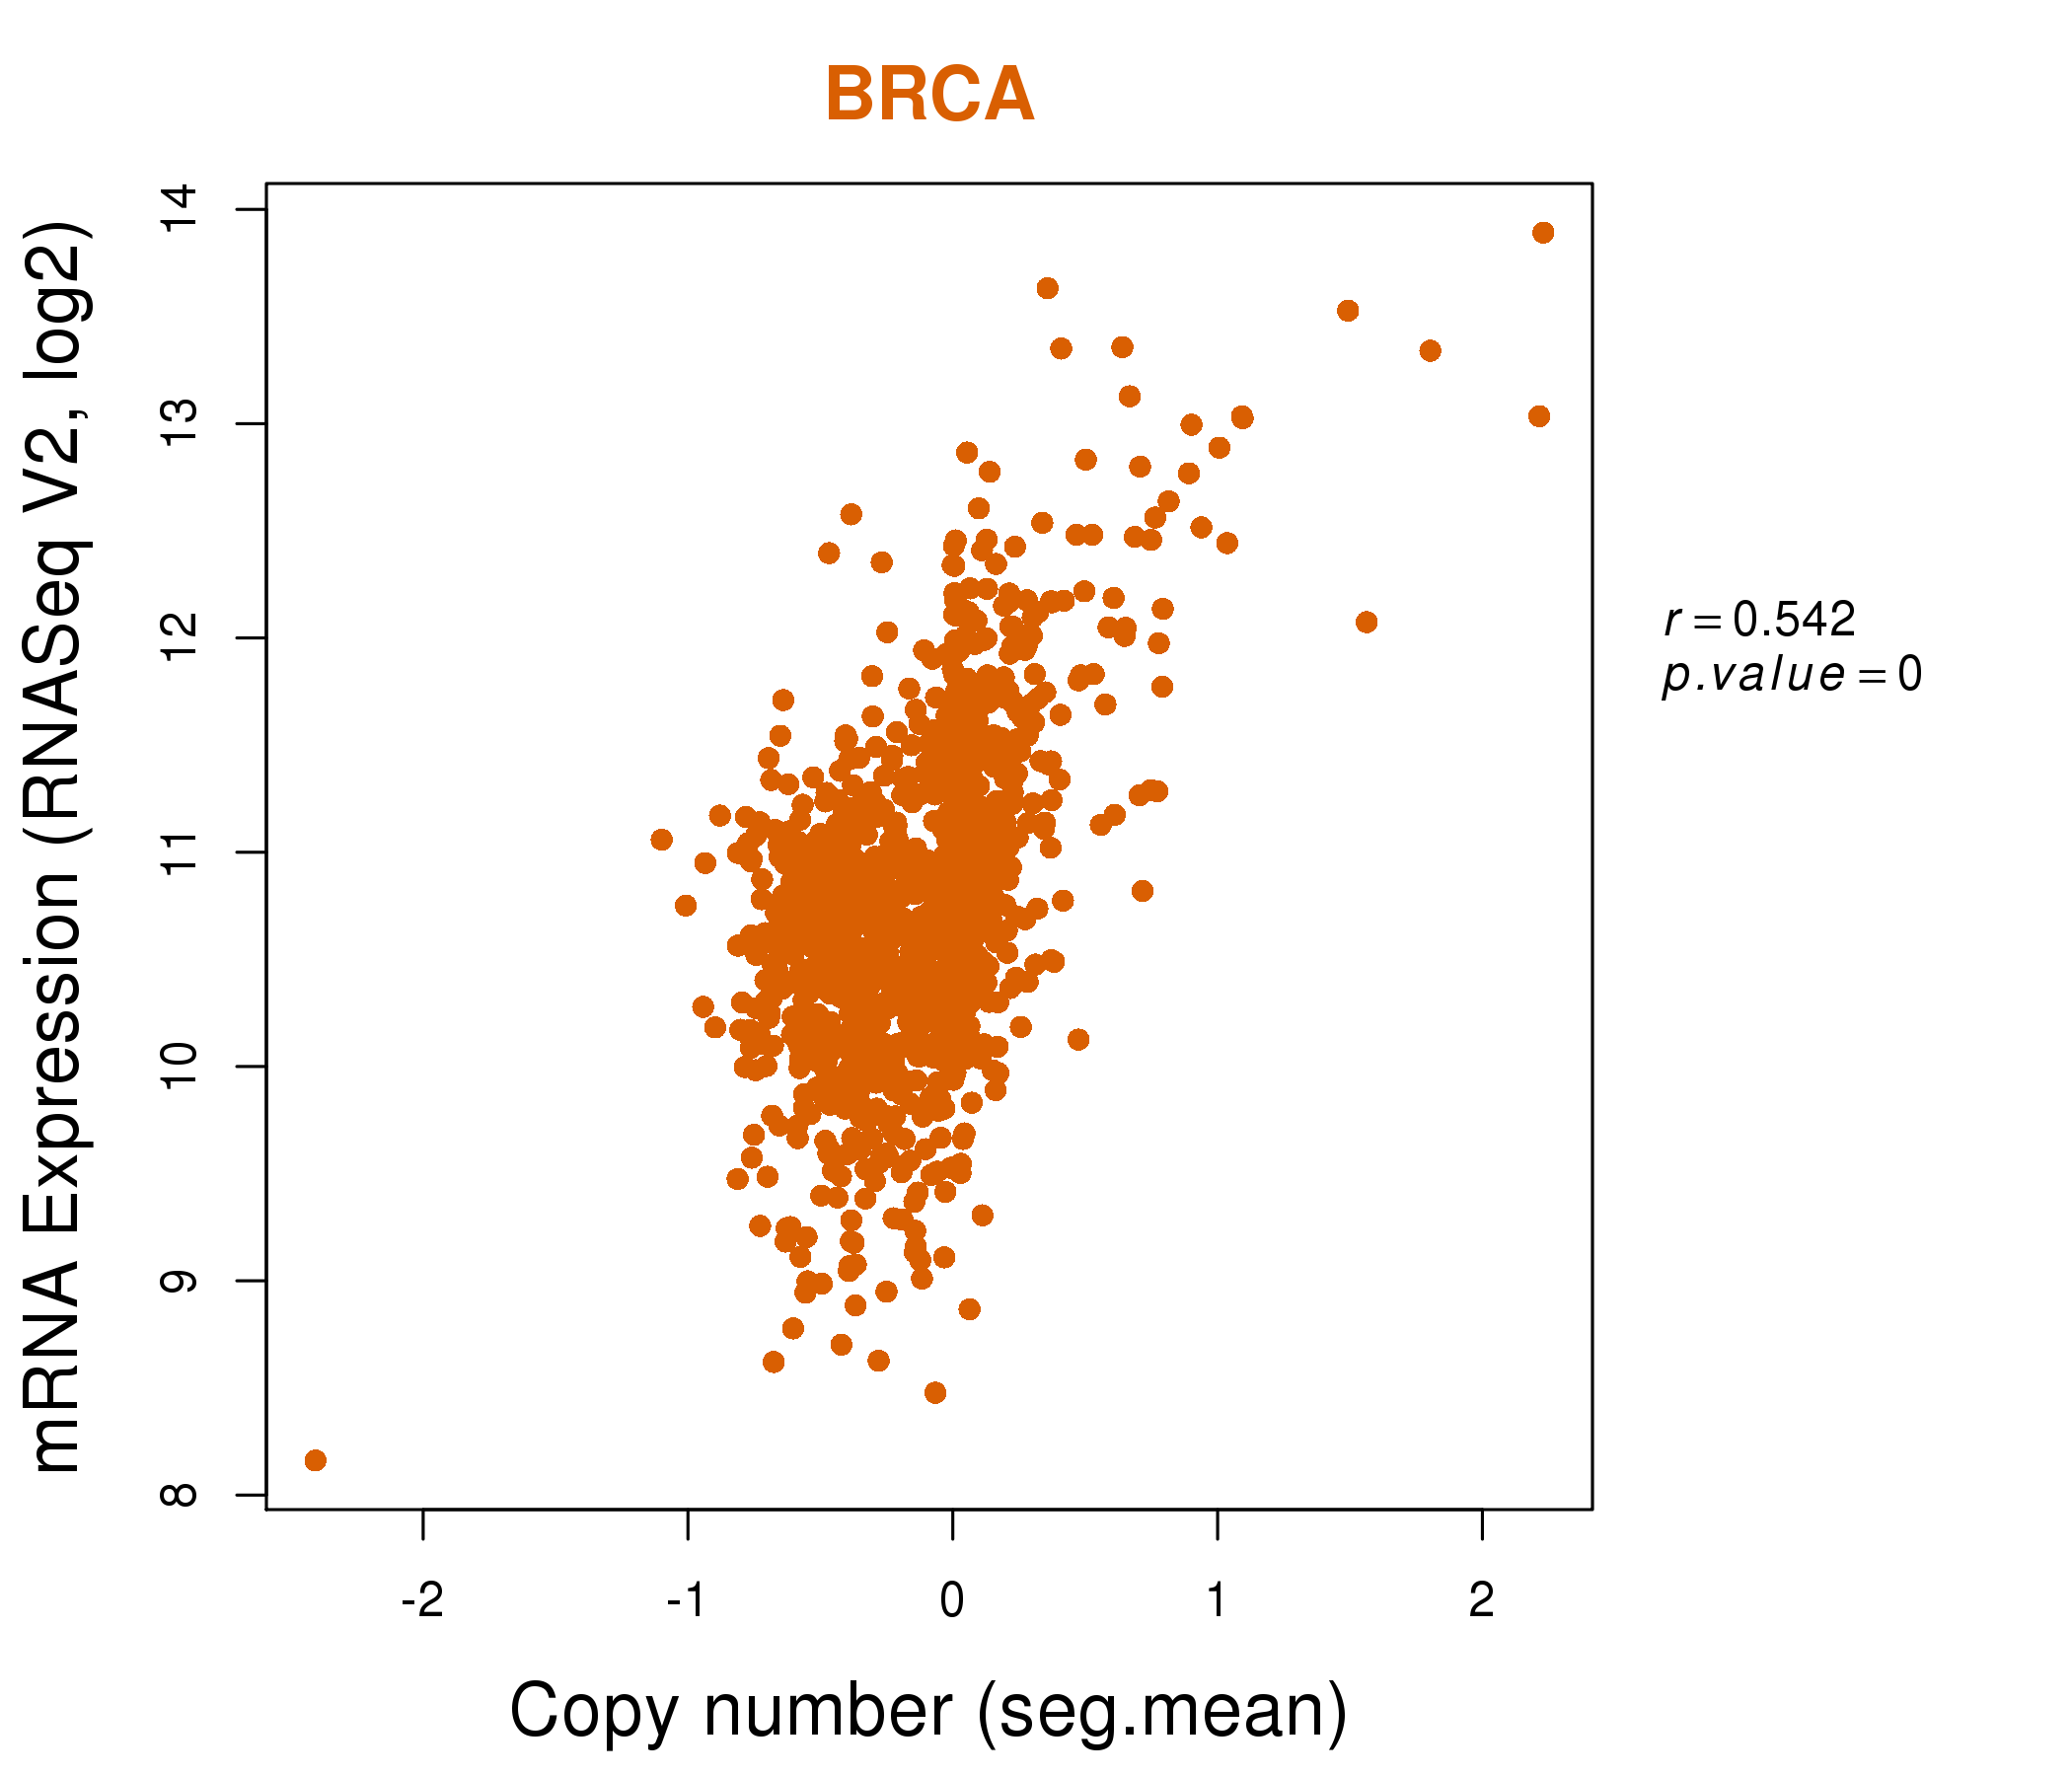
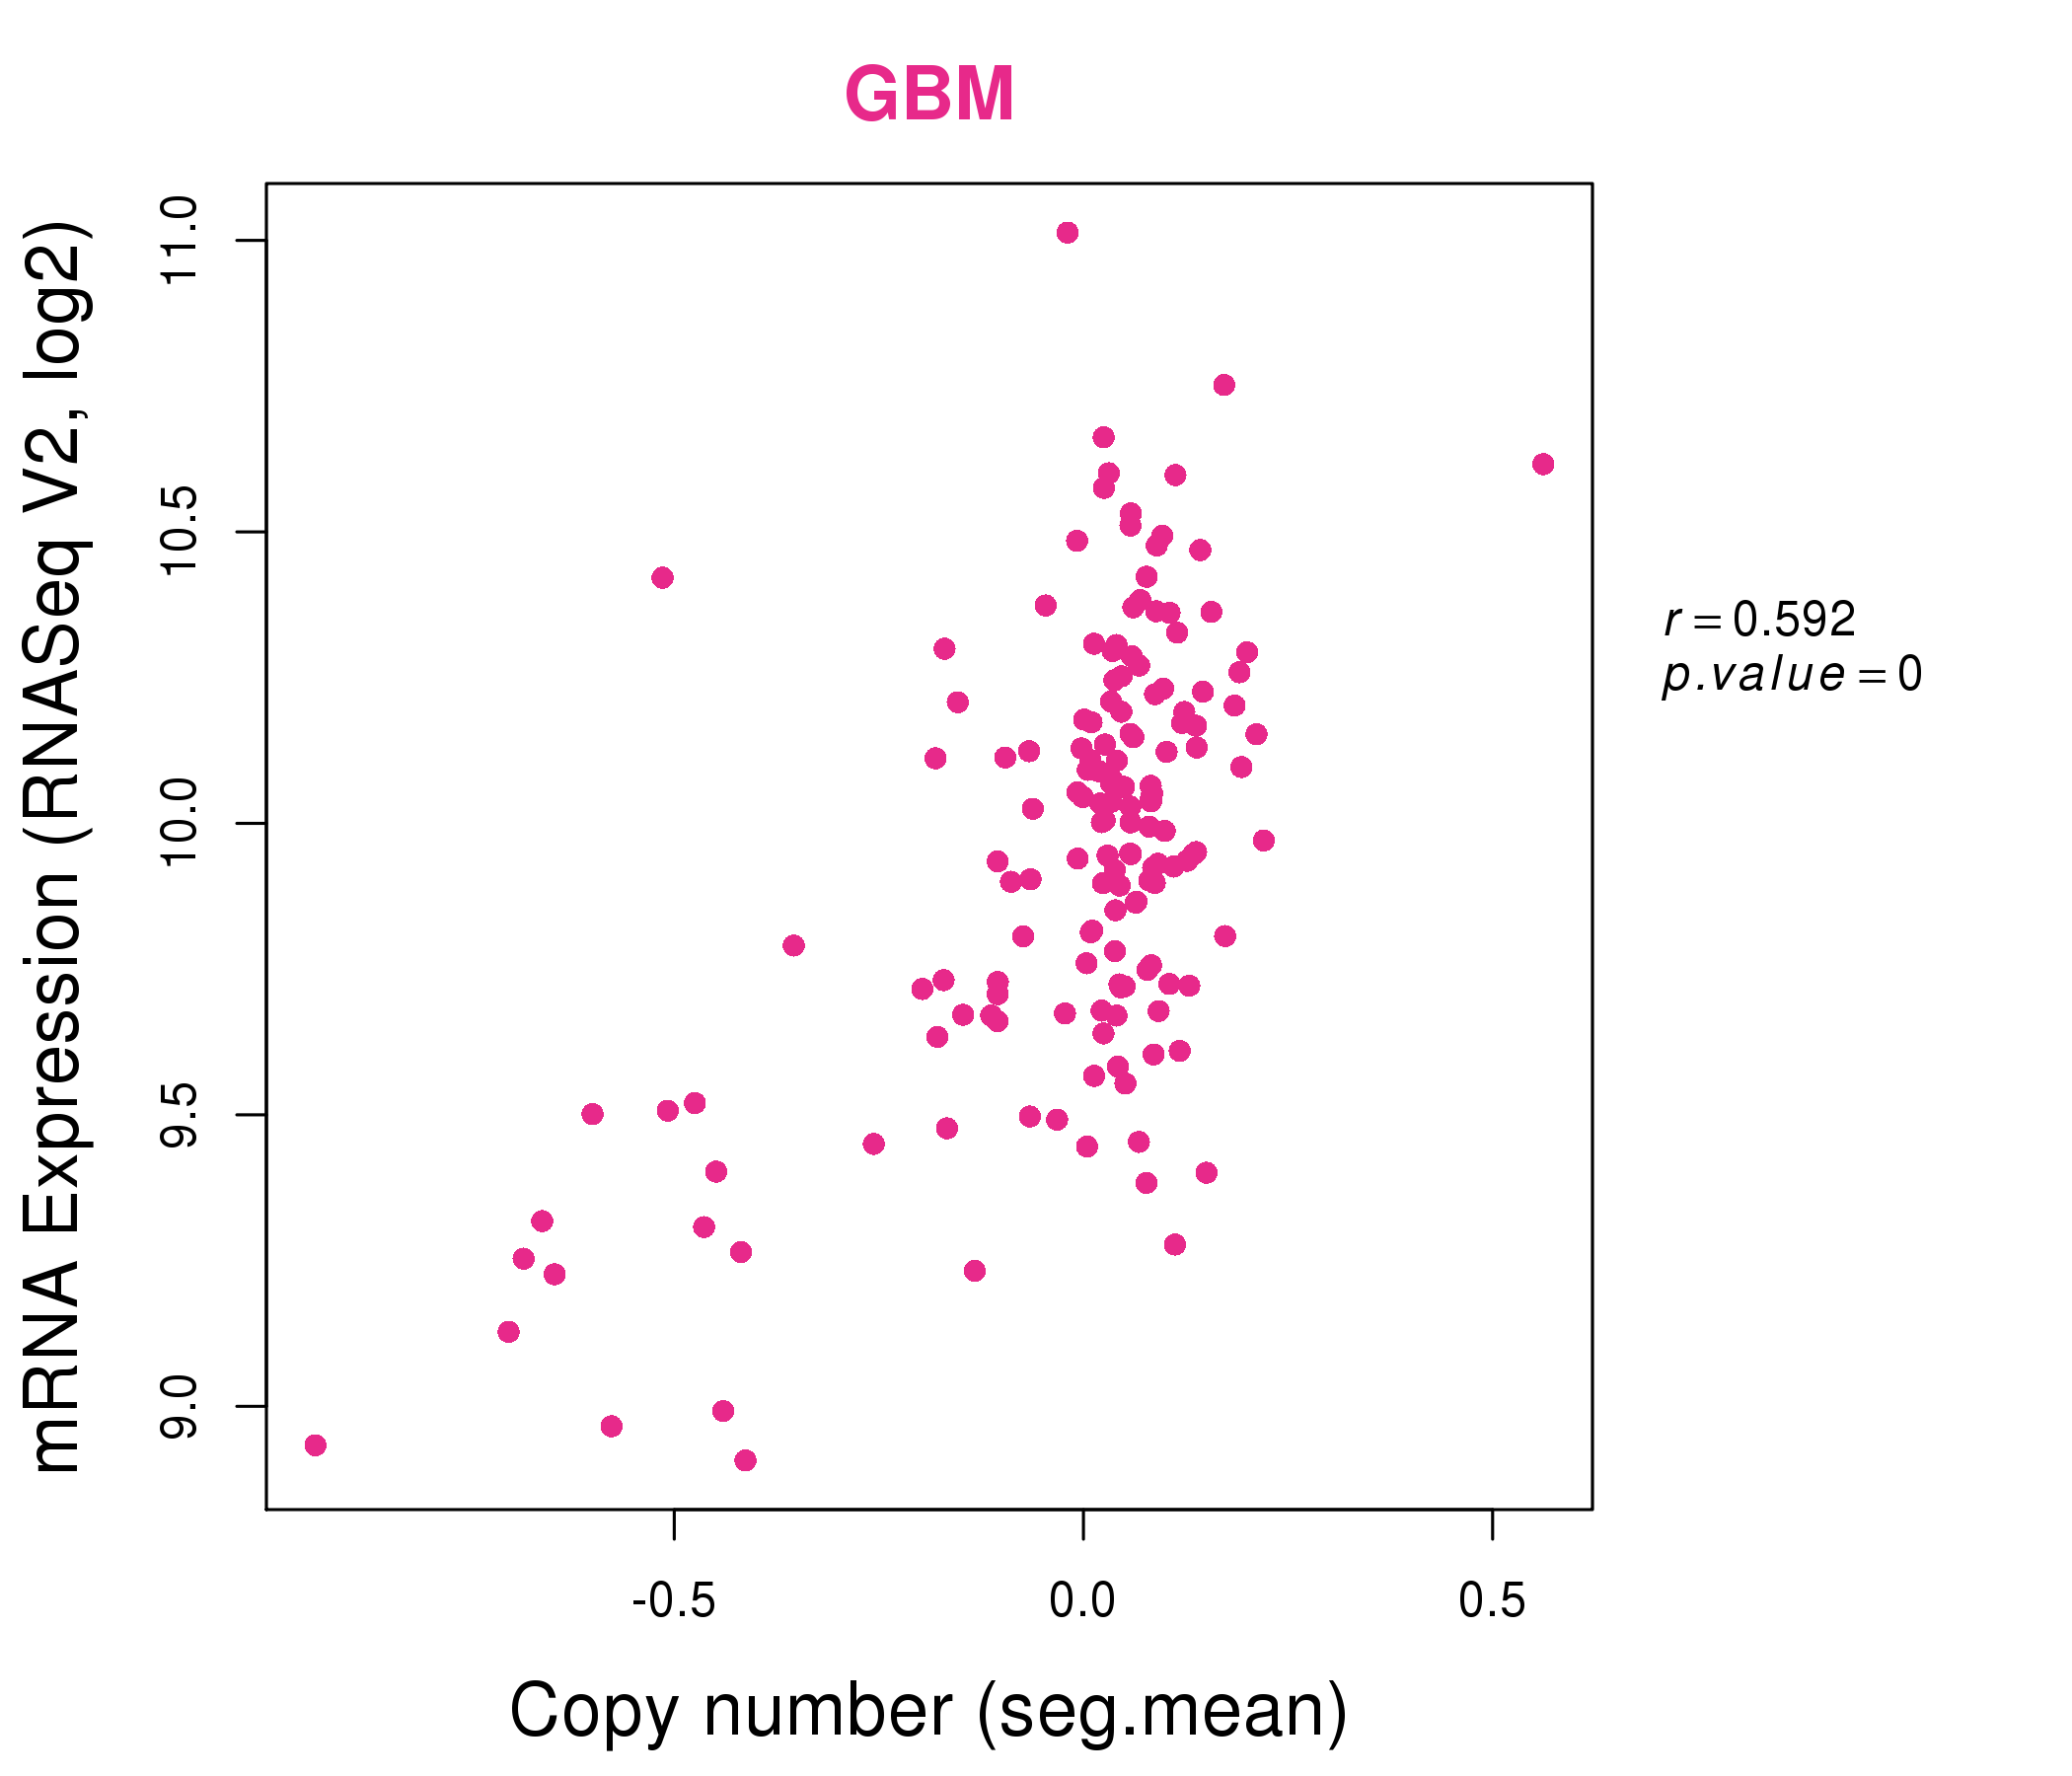
| * This plots show the correlation between CNV and gene expression. |
: Open all plots for all cancer types
 |
|
 |
|
| Top |
| Gene-Gene Network Information |
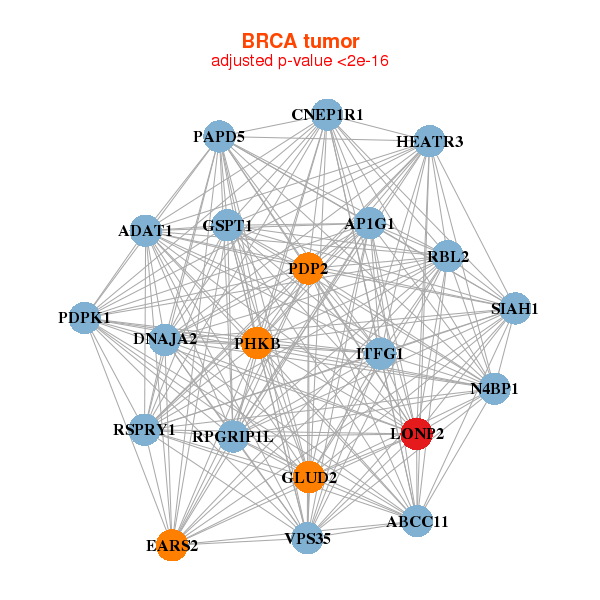
| * Co-Expression network figures were drawn using R package igraph. Only the top 20 genes with the highest correlations were shown. Red circle: input gene, orange circle: cell metabolism gene, sky circle: other gene |
: Open all plots for all cancer types
 |
|
| ABCC11,ADAT1,AP1G1,DNAJA2,EARS2,GLUD2,GSPT1, HEATR3,ITFG1,LONP2,N4BP1,PAPD5,PDP2,PDPK1, PHKB,RBL2,RPGRIP1L,RSPRY1,SIAH1,CNEP1R1,VPS35 | ABCC11,ACSL3,ADAM2,ALOX15B,B3GAT1,BRI3BP,C6orf223, DHRS2,HMGCS1,HPGD,IDI1,LONP2,MPV17L,PNLIPRP3, SERHL2,SERHL,SRD5A1,TARP,TMPRSS11F,UGT2B10,UGT2B28 |
 |
|
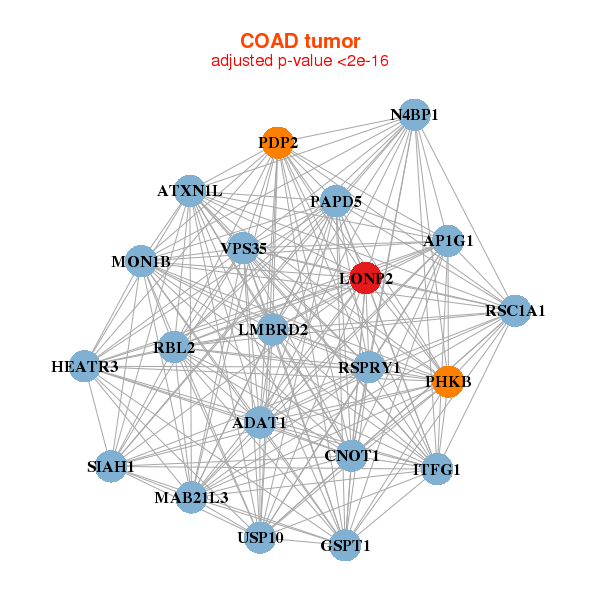
| ADAT1,AP1G1,ATXN1L,MAB21L3,CNOT1,GSPT1,HEATR3, ITFG1,LMBRD2,LONP2,MON1B,N4BP1,PAPD5,PDP2, PHKB,RBL2,RSC1A1,RSPRY1,SIAH1,USP10,VPS35 | ACO1,AHCYL1,ATF6,NRDE2,CREB3L2,DDB1,EPRS, EXOC6B,GGCX,GIGYF2,GLG1,GNS,GSK3B,ICMT, LONP2,NBAS,NFATC3,PIK3R4,RBM27,SMARCA5,SMC3 |
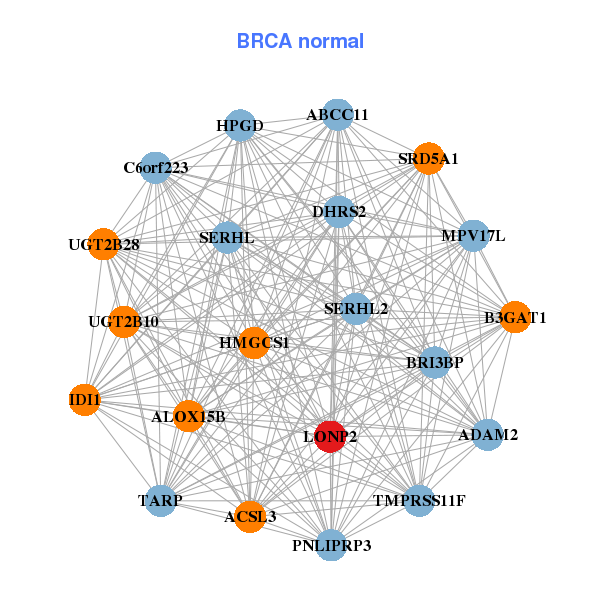
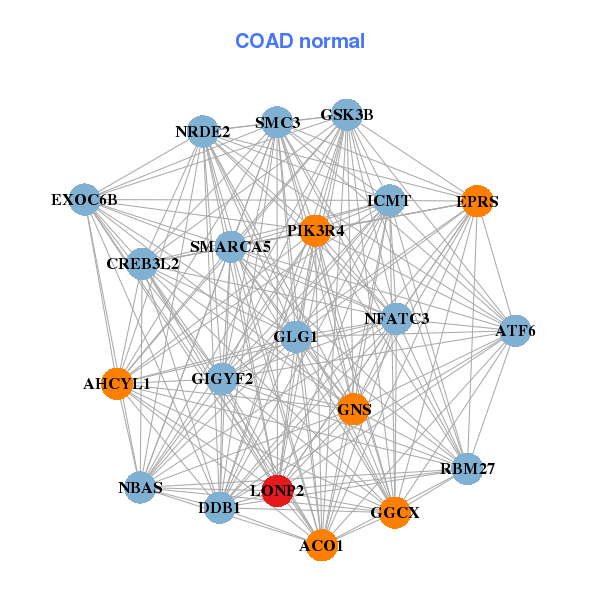
| * Co-Expression network figures were drawn using R package igraph. Only the top 20 genes with the highest correlations were shown. Red circle: input gene, orange circle: cell metabolism gene, sky circle: other gene |
: Open all plots for all cancer types
| Top |
: Open all interacting genes' information including KEGG pathway for all interacting genes from DAVID
| Top |
| Pharmacological Information for LONP2 |
| There's no related Drug. |
| Top |
| Cross referenced IDs for LONP2 |
| * We obtained these cross-references from Uniprot database. It covers 150 different DBs, 18 categories. http://www.uniprot.org/help/cross_references_section |
: Open all cross reference information
|
Copyright © 2016-Present - The Univsersity of Texas Health Science Center at Houston @ |