|
||||||||||||||||||||
| |
| Phenotypic Information (metabolism pathway, cancer, disease, phenome) |
| |
| |
| Gene-Gene Network Information: Co-Expression Network, Interacting Genes & KEGG |
| |
|


| Gene Summary for NME5 |
| Basic gene info. | Gene symbol | NME5 |
| Gene name | NME/NM23 family member 5 | |
| Synonyms | NM23-H5|NM23H5|RSPH23 | |
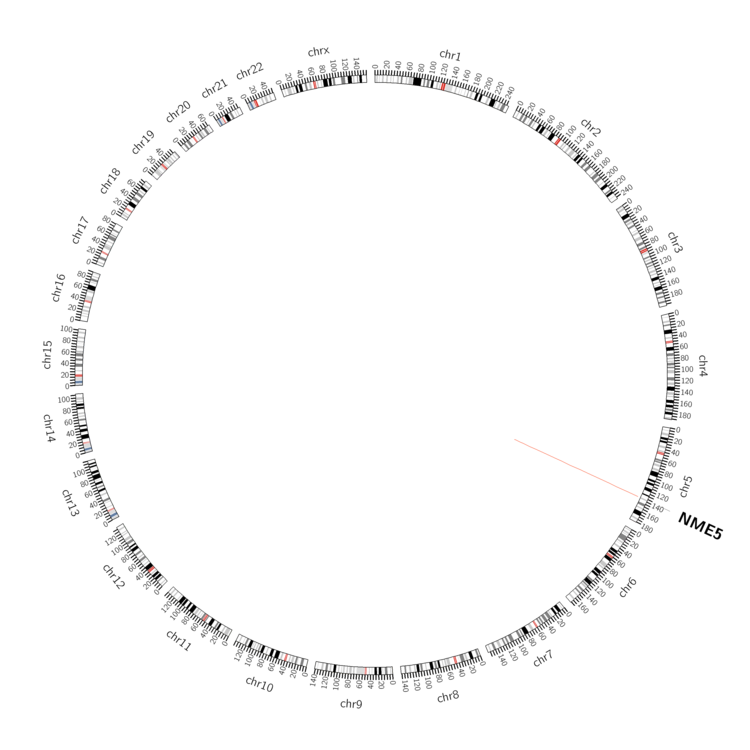
| Cytomap | UCSC genome browser: 5q31 | |
| Genomic location | chr5 :137450860-137475132 | |
| Type of gene | protein-coding | |
| RefGenes | NM_003551.2, | |
| Ensembl id | ENSG00000112981 | |
| Description | IPIA-betaNDK-H 5NDP kinase homolog 5inhibitor of p53-induced apoptosis-betanon-metastatic cells 5, protein expressed in (nucleoside-diphosphate kinase)nucleoside diphosphate kinase homolog 5radial spoke 23 homologtestis-specific nm23 homolog | |
| Modification date | 20141207 | |
| dbXrefs | MIM : 603575 | |
| HGNC : HGNC | ||
| Ensembl : ENSG00000112981 | ||
| HPRD : 04655 | ||
| Vega : OTTHUMG00000129207 | ||
| Protein | UniProt: go to UniProt's Cross Reference DB Table | |
| Expression | CleanEX: HS_NME5 | |
| BioGPS: 8382 | ||
| Gene Expression Atlas: ENSG00000112981 | ||
| The Human Protein Atlas: ENSG00000112981 | ||
| Pathway | NCI Pathway Interaction Database: NME5 | |
| KEGG: NME5 | ||
| REACTOME: NME5 | ||
| ConsensusPathDB | ||
| Pathway Commons: NME5 | ||
| Metabolism | MetaCyc: NME5 | |
| HUMANCyc: NME5 | ||
| Regulation | Ensembl's Regulation: ENSG00000112981 | |
| miRBase: chr5 :137,450,860-137,475,132 | ||
| TargetScan: NM_003551 | ||
| cisRED: ENSG00000112981 | ||
| Context | iHOP: NME5 | |
| cancer metabolism search in PubMed: NME5 | ||
| UCL Cancer Institute: NME5 | ||
| Assigned class in ccmGDB | C | |
| Top |
| Phenotypic Information for NME5(metabolism pathway, cancer, disease, phenome) |
| Cancer | CGAP: NME5 |
| Familial Cancer Database: NME5 | |
| * This gene is included in those cancer gene databases. |
|
|
|
|
|
| . | ||||||||||||||
Oncogene 1 | Significant driver gene in | |||||||||||||||||||
| cf) number; DB name 1 Oncogene; http://nar.oxfordjournals.org/content/35/suppl_1/D721.long, 2 Tumor Suppressor gene; https://bioinfo.uth.edu/TSGene/, 3 Cancer Gene Census; http://www.nature.com/nrc/journal/v4/n3/abs/nrc1299.html, 4 CancerGenes; http://nar.oxfordjournals.org/content/35/suppl_1/D721.long, 5 Network of Cancer Gene; http://ncg.kcl.ac.uk/index.php, 1Therapeutic Vulnerabilities in Cancer; http://cbio.mskcc.org/cancergenomics/statius/ |
| KEGG_PURINE_METABOLISM KEGG_PYRIMIDINE_METABOLISM | |
| OMIM | |
| Orphanet | |
| Disease | KEGG Disease: NME5 |
| MedGen: NME5 (Human Medical Genetics with Condition) | |
| ClinVar: NME5 | |
| Phenotype | MGI: NME5 (International Mouse Phenotyping Consortium) |
| PhenomicDB: NME5 | |
| Mutations for NME5 |
| * Under tables are showing count per each tissue to give us broad intuition about tissue specific mutation patterns.You can go to the detailed page for each mutation database's web site. |
| - Statistics for Tissue and Mutation type | Top |
 |
| - For Inter-chromosomal Variations |
| There's no inter-chromosomal structural variation. |
| - For Intra-chromosomal Variations |
| * Intra-chromosomal variantions includes 'intrachromosomal amplicon to amplicon', 'intrachromosomal amplicon to non-amplified dna', 'intrachromosomal deletion', 'intrachromosomal fold-back inversion', 'intrachromosomal inversion', 'intrachromosomal tandem duplication', 'Intrachromosomal unknown type', 'intrachromosomal with inverted orientation', 'intrachromosomal with non-inverted orientation'. |
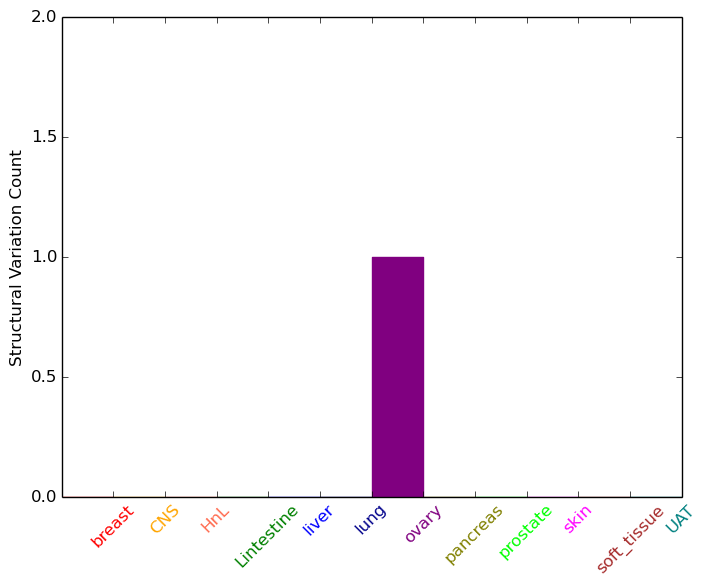 |
| Sample | Symbol_a | Chr_a | Start_a | End_a | Symbol_b | Chr_b | Start_b | End_b |
| ovary | NME5 | chr5 | 137469153 | 137469173 | NME5 | chr5 | 137456864 | 137456884 |
| cf) Tissue number; Tissue name (1;Breast, 2;Central_nervous_system, 3;Haematopoietic_and_lymphoid_tissue, 4;Large_intestine, 5;Liver, 6;Lung, 7;Ovary, 8;Pancreas, 9;Prostate, 10;Skin, 11;Soft_tissue, 12;Upper_aerodigestive_tract) |
| * From mRNA Sanger sequences, Chitars2.0 arranged chimeric transcripts. This table shows NME5 related fusion information. |
| ID | Head Gene | Tail Gene | Accession | Gene_a | qStart_a | qEnd_a | Chromosome_a | tStart_a | tEnd_a | Gene_a | qStart_a | qEnd_a | Chromosome_a | tStart_a | tEnd_a |
| Top |
| There's no copy number variation information in COSMIC data for this gene. |
| Top |
|
 |
| Top |
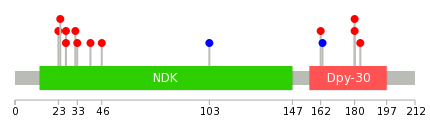
| Stat. for Non-Synonymous SNVs (# total SNVs=8) | (# total SNVs=0) |
 | |
(# total SNVs=1) | (# total SNVs=1) |
 |  |
| Top |
| * When you move the cursor on each content, you can see more deailed mutation information on the Tooltip. Those are primary_site,primary_histology,mutation(aa),pubmedID. |
| GRCh37 position | Mutation(aa) | Unique sampleID count |
| chr5:137451406-137451406 | p.K201fs*8 | 2 |
| chr5:137474391-137474391 | p.E27K | 2 |
| chr5:137454523-137454523 | p.K180T | 2 |
| chr5:137474445-137474445 | p.Q9* | 2 |
| chr5:137474376-137474376 | p.D32N | 1 |
| chr5:137451461-137451461 | p.? | 1 |
| chr5:137474385-137474385 | p.E29* | 1 |
| chr5:137454515-137454515 | p.D183Y | 1 |
| chr5:137474399-137474399 | p.V24A | 1 |
| chr5:137454564-137454565 | p.M166fs*6 | 1 |
| Top |
|
 |
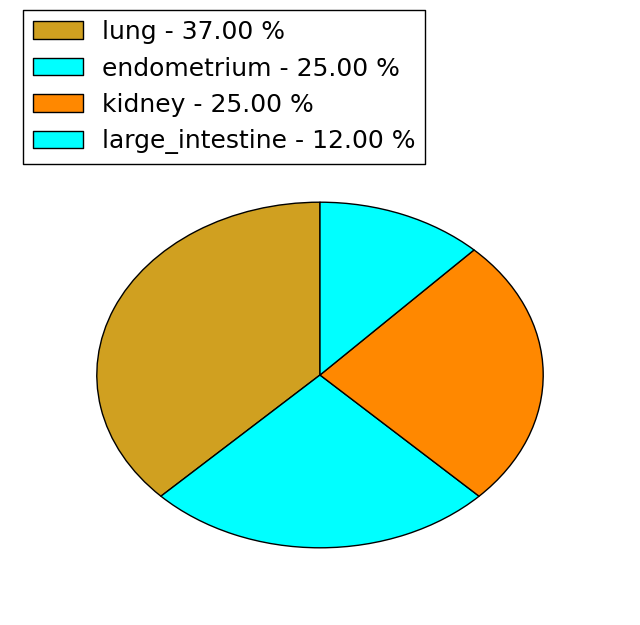
| Point Mutation/ Tissue ID | 1 | 2 | 3 | 4 | 5 | 6 | 7 | 8 | 9 | 10 | 11 | 12 | 13 | 14 | 15 | 16 | 17 | 18 | 19 | 20 |
| # sample | 1 | 1 | 1 | 2 | 4 | 1 | ||||||||||||||
| # mutation | 1 | 1 | 1 | 2 | 3 | 1 | ||||||||||||||
| nonsynonymous SNV | 1 | 1 | 1 | 2 | 2 | 1 | ||||||||||||||
| synonymous SNV | 1 |
| cf) Tissue ID; Tissue type (1; BLCA[Bladder Urothelial Carcinoma], 2; BRCA[Breast invasive carcinoma], 3; CESC[Cervical squamous cell carcinoma and endocervical adenocarcinoma], 4; COAD[Colon adenocarcinoma], 5; GBM[Glioblastoma multiforme], 6; Glioma Low Grade, 7; HNSC[Head and Neck squamous cell carcinoma], 8; KICH[Kidney Chromophobe], 9; KIRC[Kidney renal clear cell carcinoma], 10; KIRP[Kidney renal papillary cell carcinoma], 11; LAML[Acute Myeloid Leukemia], 12; LUAD[Lung adenocarcinoma], 13; LUSC[Lung squamous cell carcinoma], 14; OV[Ovarian serous cystadenocarcinoma ], 15; PAAD[Pancreatic adenocarcinoma], 16; PRAD[Prostate adenocarcinoma], 17; SKCM[Skin Cutaneous Melanoma], 18:STAD[Stomach adenocarcinoma], 19:THCA[Thyroid carcinoma], 20:UCEC[Uterine Corpus Endometrial Carcinoma]) |
| Top |
| * We represented just top 10 SNVs. When you move the cursor on each content, you can see more deailed mutation information on the Tooltip. Those are primary_site, primary_histology, mutation(aa), pubmedID. |
| Genomic Position | Mutation(aa) | Unique sampleID count |
| chr5:137474391 | p.K180T | 2 |
| chr5:137454523 | p.E27K | 2 |
| chr5:137454573 | p.L163L | 1 |
| chr5:137454576 | p.N162K | 1 |
| chr5:137465150 | p.K46I | 1 |
| chr5:137474373 | p.I33V | 1 |
| chr5:137474399 | p.V24A | 1 |
| chr5:137454515 | p.D183Y | 1 |
| * Copy number data were extracted from TCGA using R package TCGA-Assembler. The URLs of all public data files on TCGA DCC data server were gathered on Jan-05-2015. Function ProcessCNAData in TCGA-Assembler package was used to obtain gene-level copy number value which is calculated as the average copy number of the genomic region of a gene. |
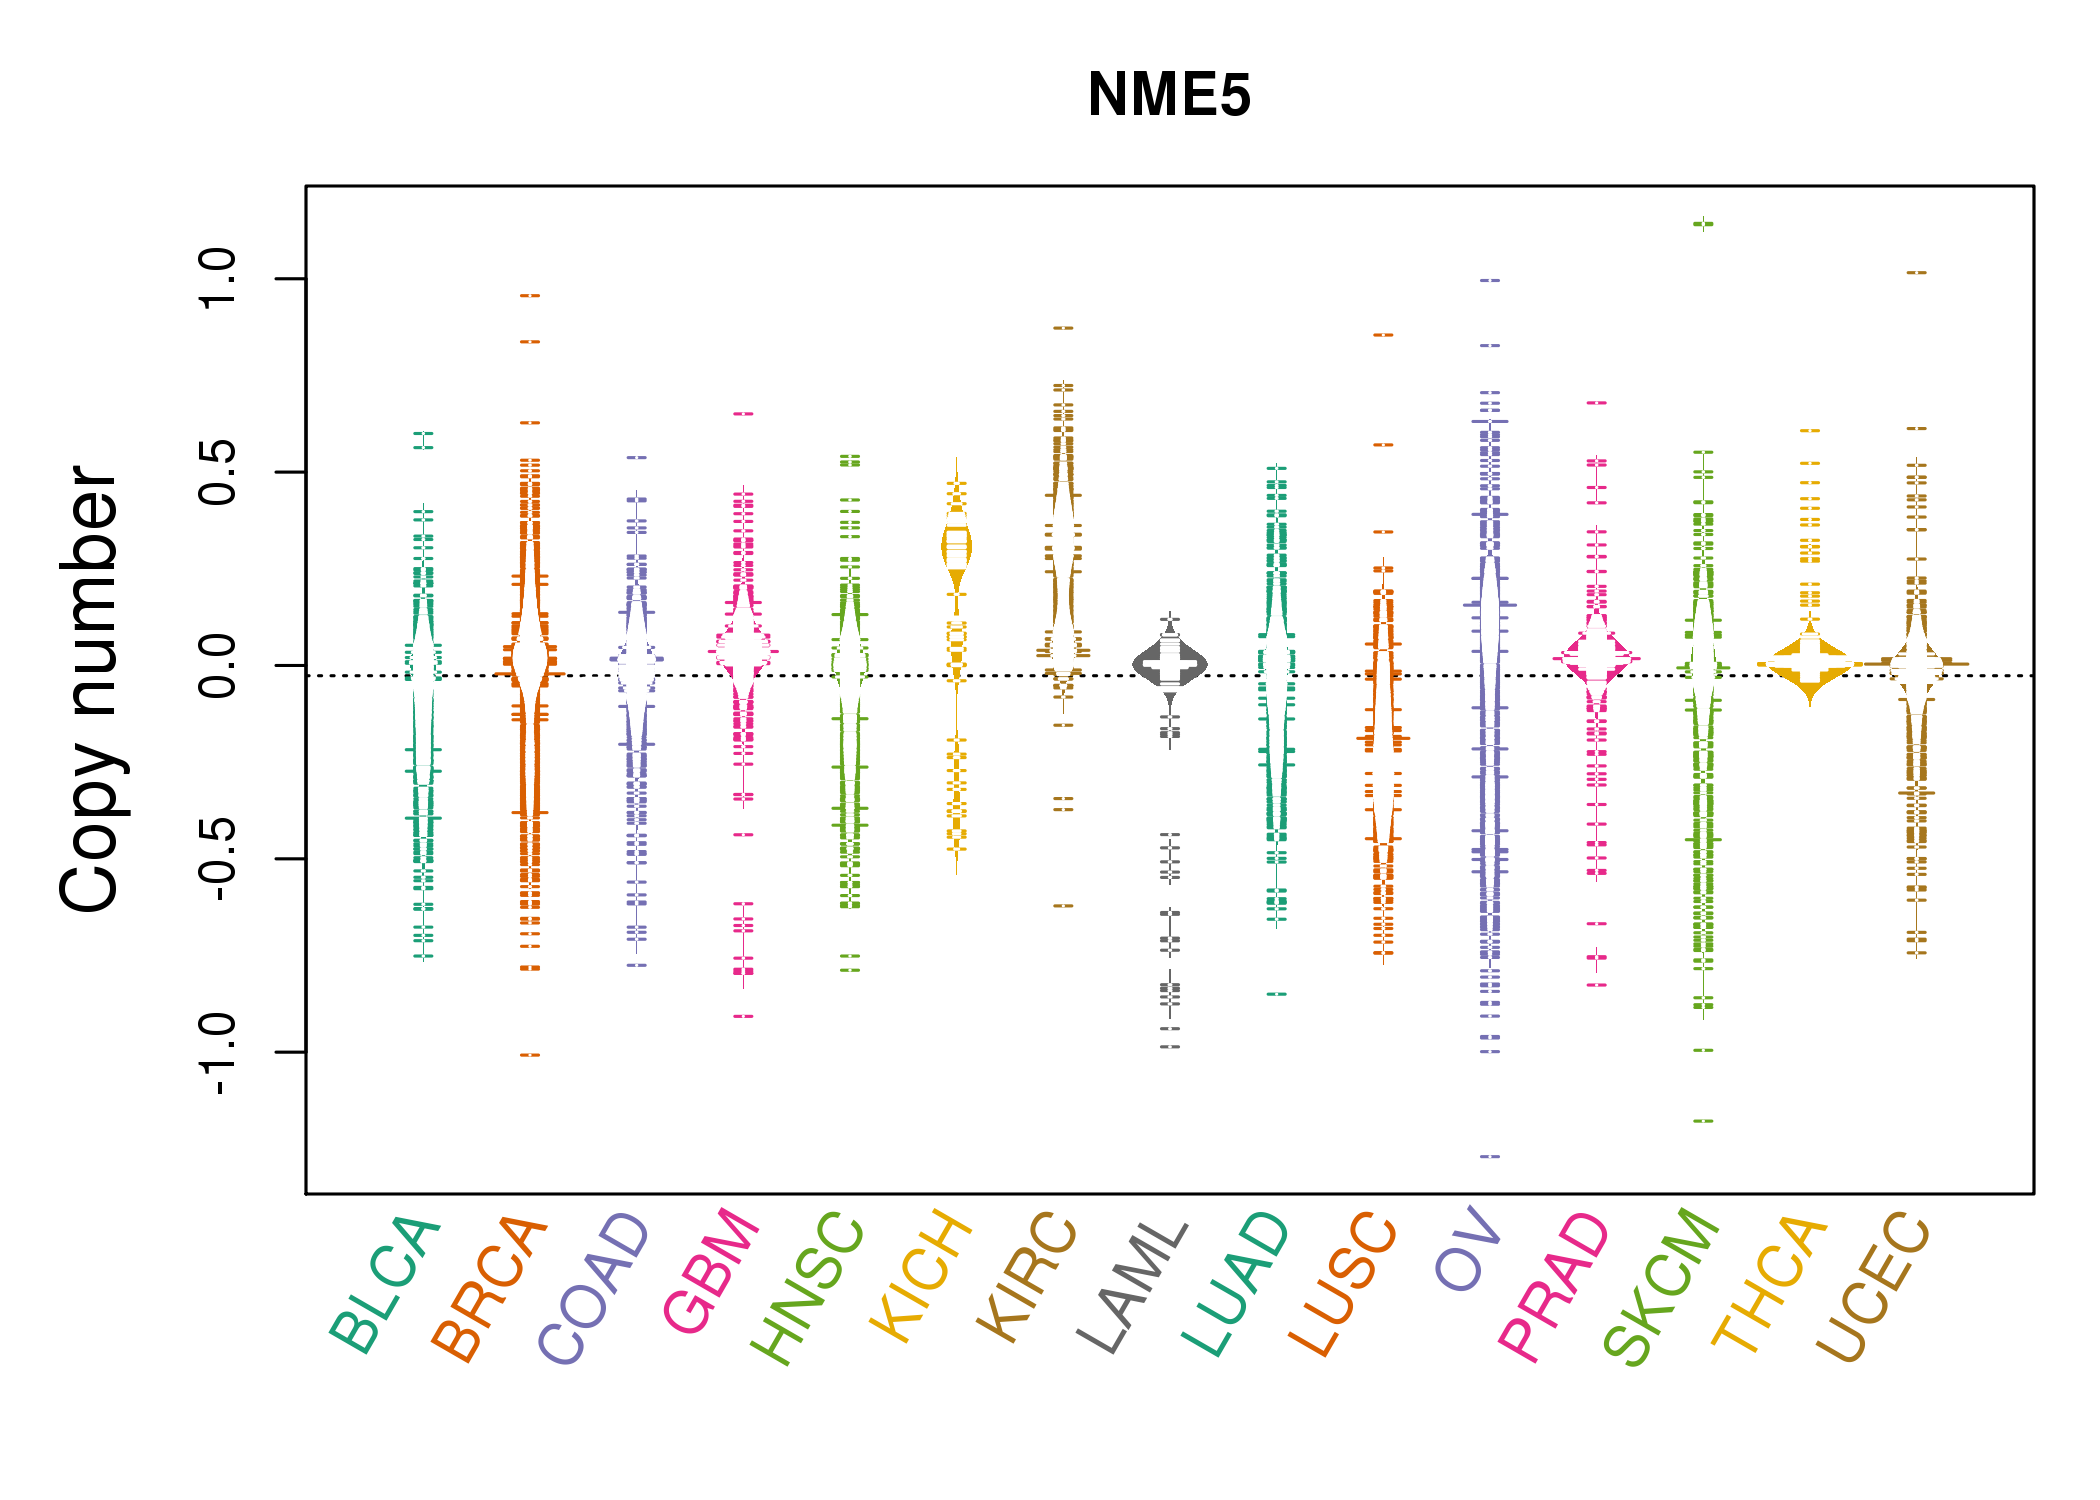 |
| cf) Tissue ID[Tissue type]: BLCA[Bladder Urothelial Carcinoma], BRCA[Breast invasive carcinoma], CESC[Cervical squamous cell carcinoma and endocervical adenocarcinoma], COAD[Colon adenocarcinoma], GBM[Glioblastoma multiforme], Glioma Low Grade, HNSC[Head and Neck squamous cell carcinoma], KICH[Kidney Chromophobe], KIRC[Kidney renal clear cell carcinoma], KIRP[Kidney renal papillary cell carcinoma], LAML[Acute Myeloid Leukemia], LUAD[Lung adenocarcinoma], LUSC[Lung squamous cell carcinoma], OV[Ovarian serous cystadenocarcinoma ], PAAD[Pancreatic adenocarcinoma], PRAD[Prostate adenocarcinoma], SKCM[Skin Cutaneous Melanoma], STAD[Stomach adenocarcinoma], THCA[Thyroid carcinoma], UCEC[Uterine Corpus Endometrial Carcinoma] |
| Top |
| Gene Expression for NME5 |
| * CCLE gene expression data were extracted from CCLE_Expression_Entrez_2012-10-18.res: Gene-centric RMA-normalized mRNA expression data. |
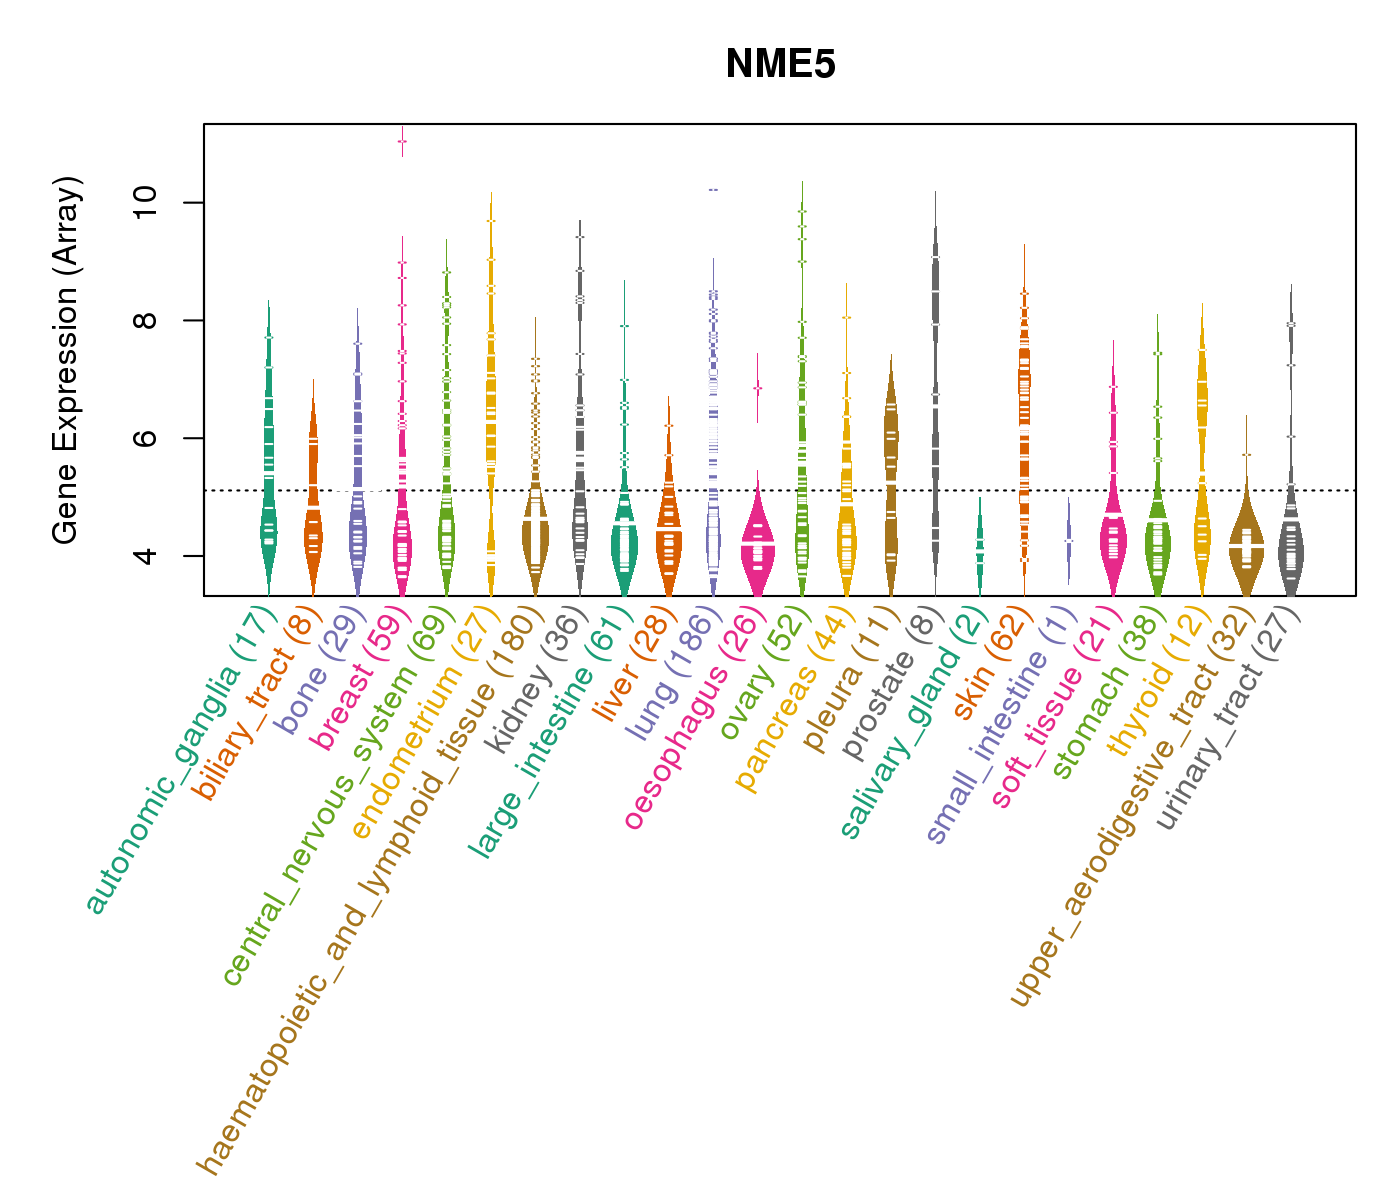 |
| * Normalized gene expression data of RNASeqV2 was extracted from TCGA using R package TCGA-Assembler. The URLs of all public data files on TCGA DCC data server were gathered at Jan-05-2015. Only eight cancer types have enough normal control samples for differential expression analysis. (t test, adjusted p<0.05 (using Benjamini-Hochberg FDR)) |
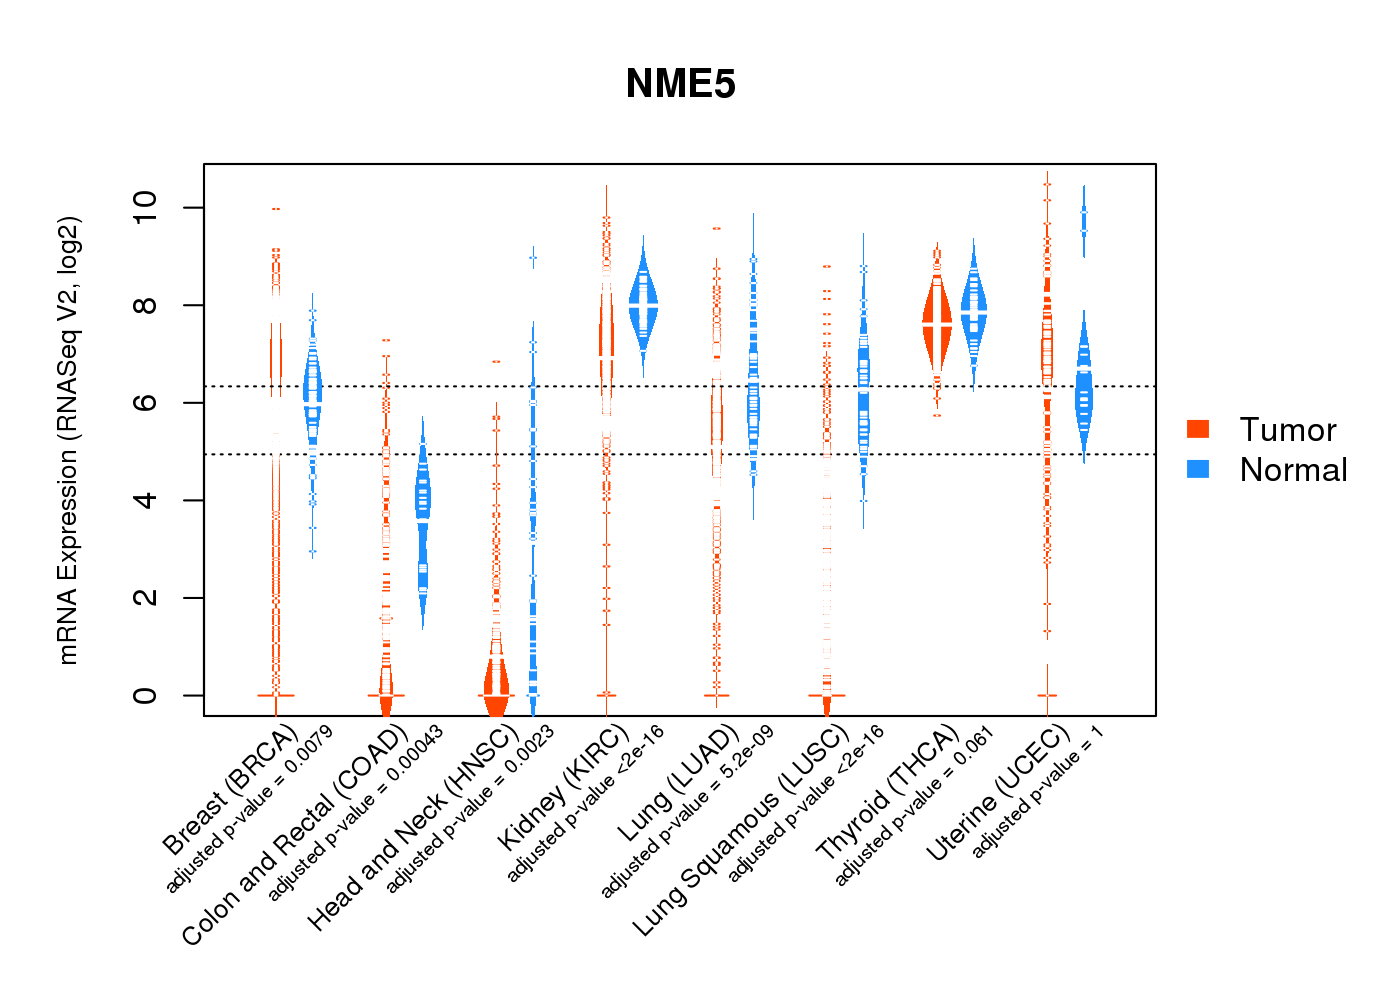 |
| Top |
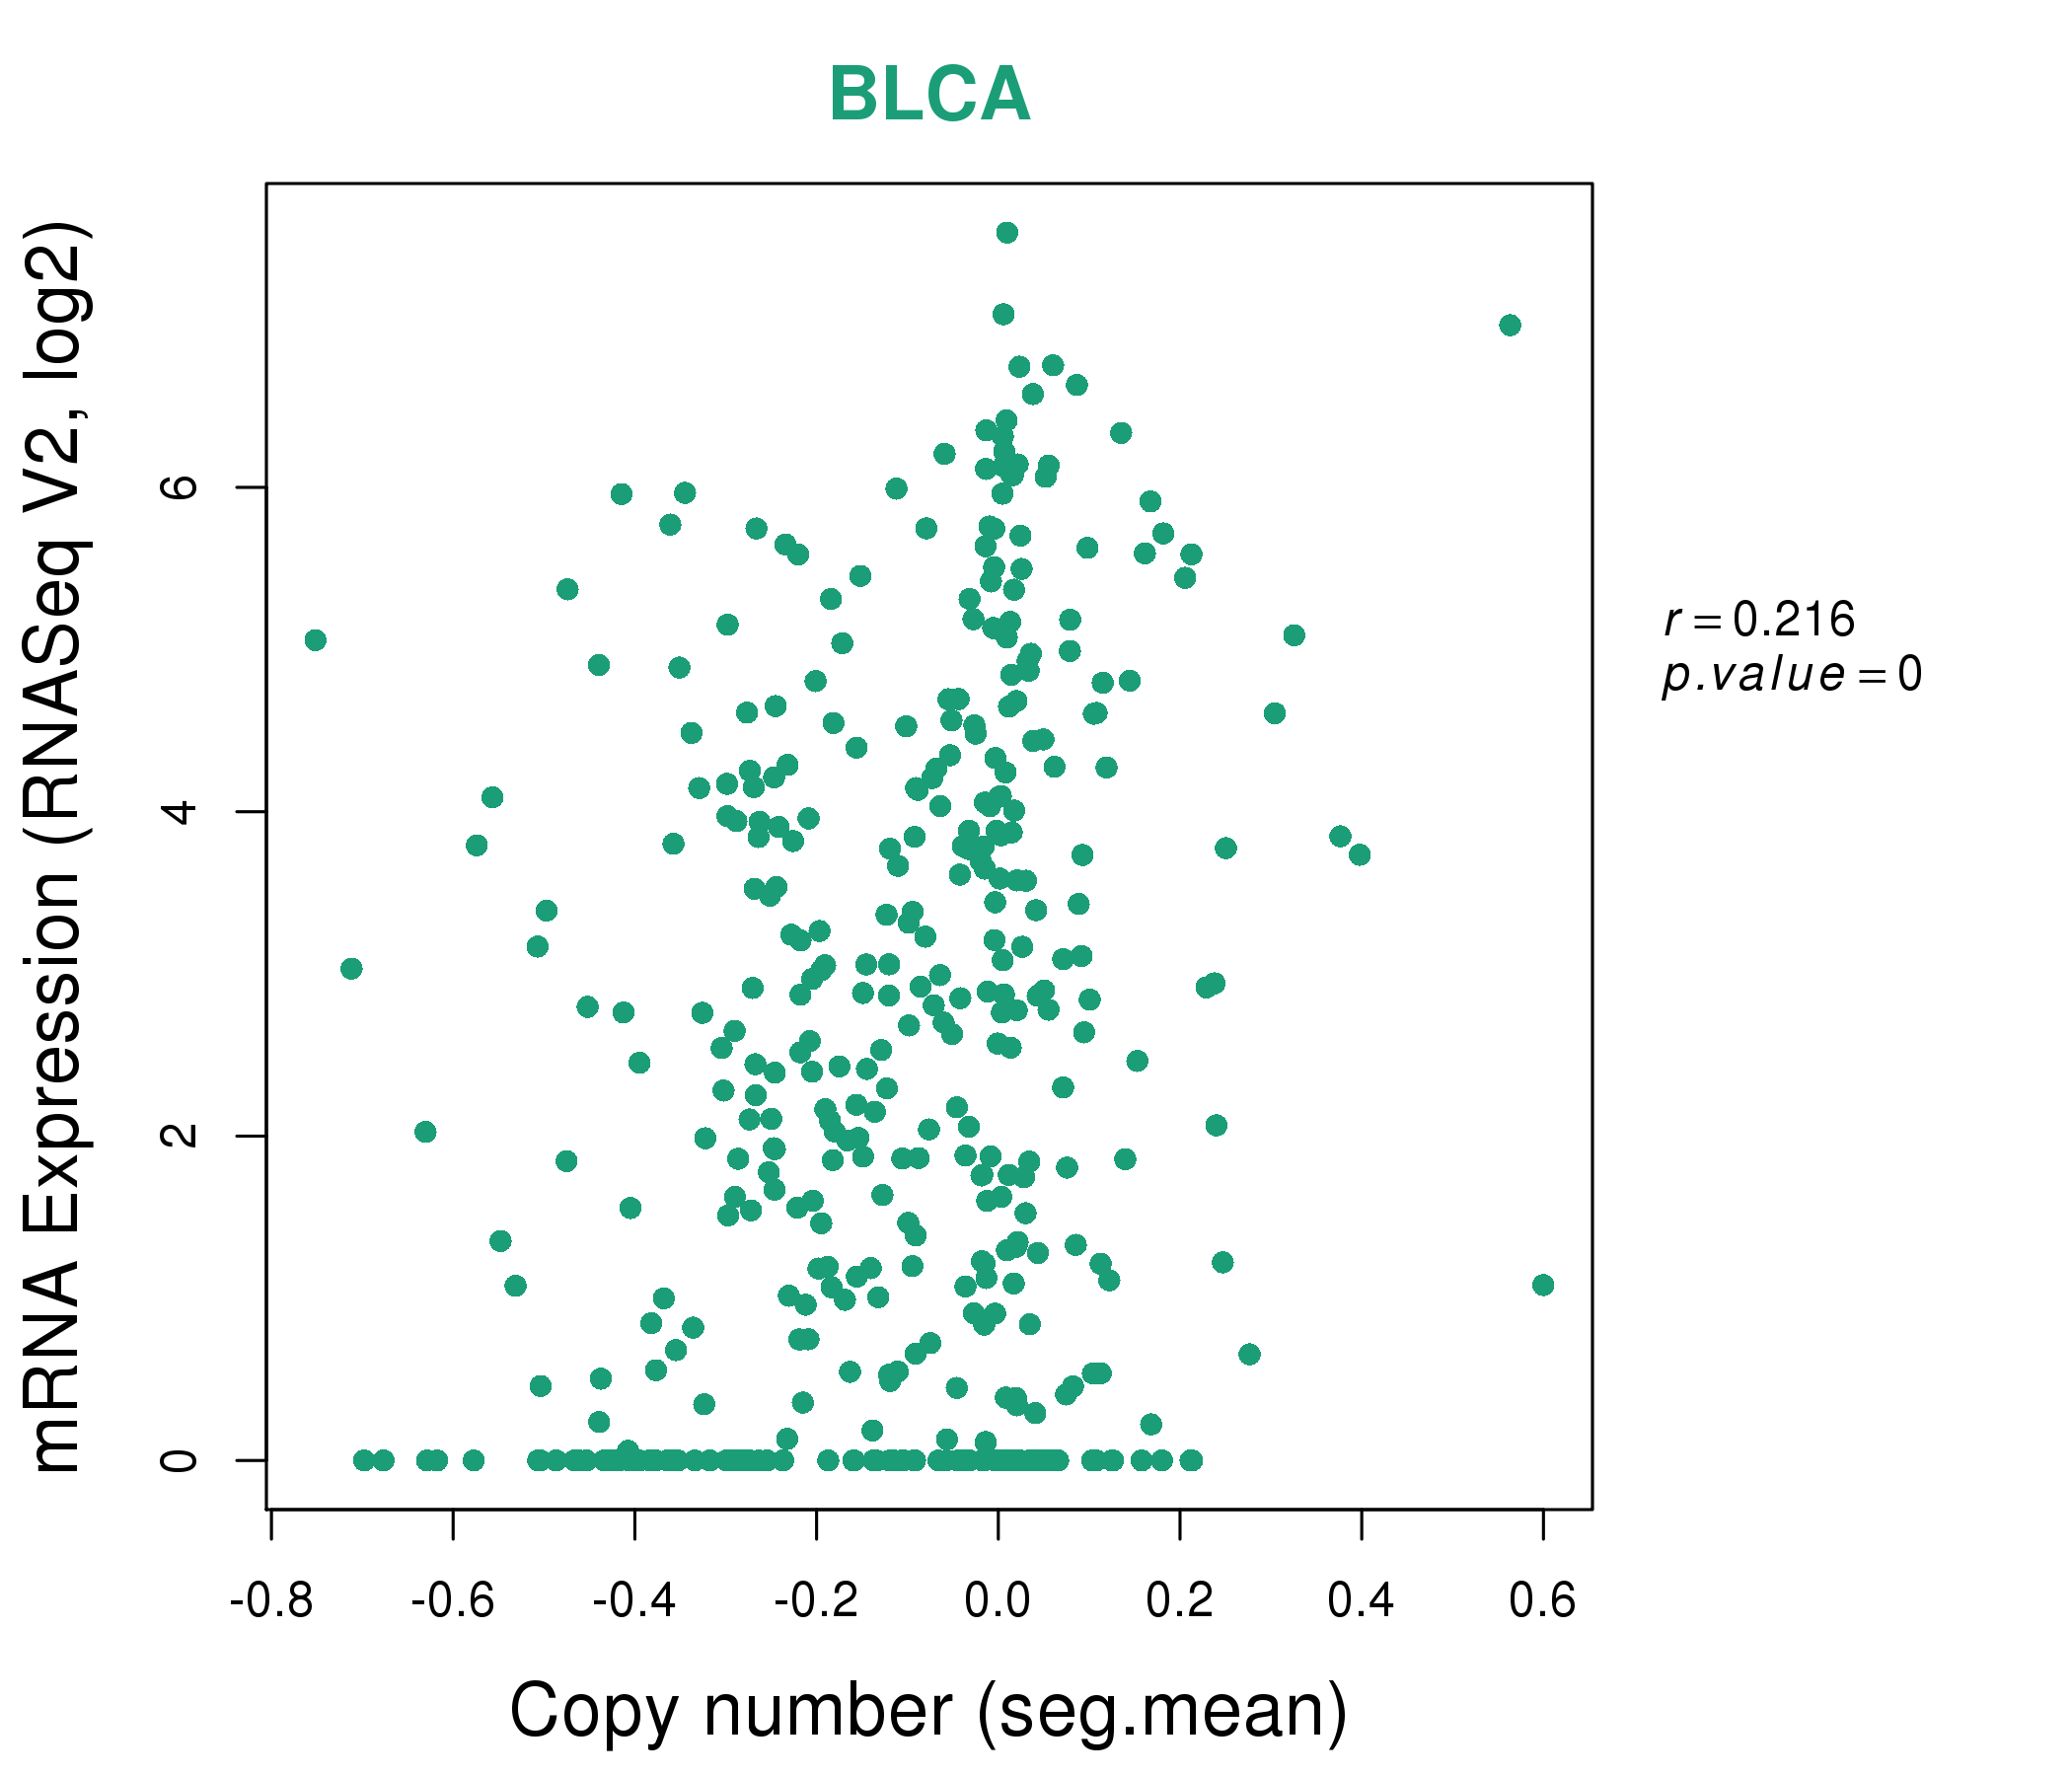
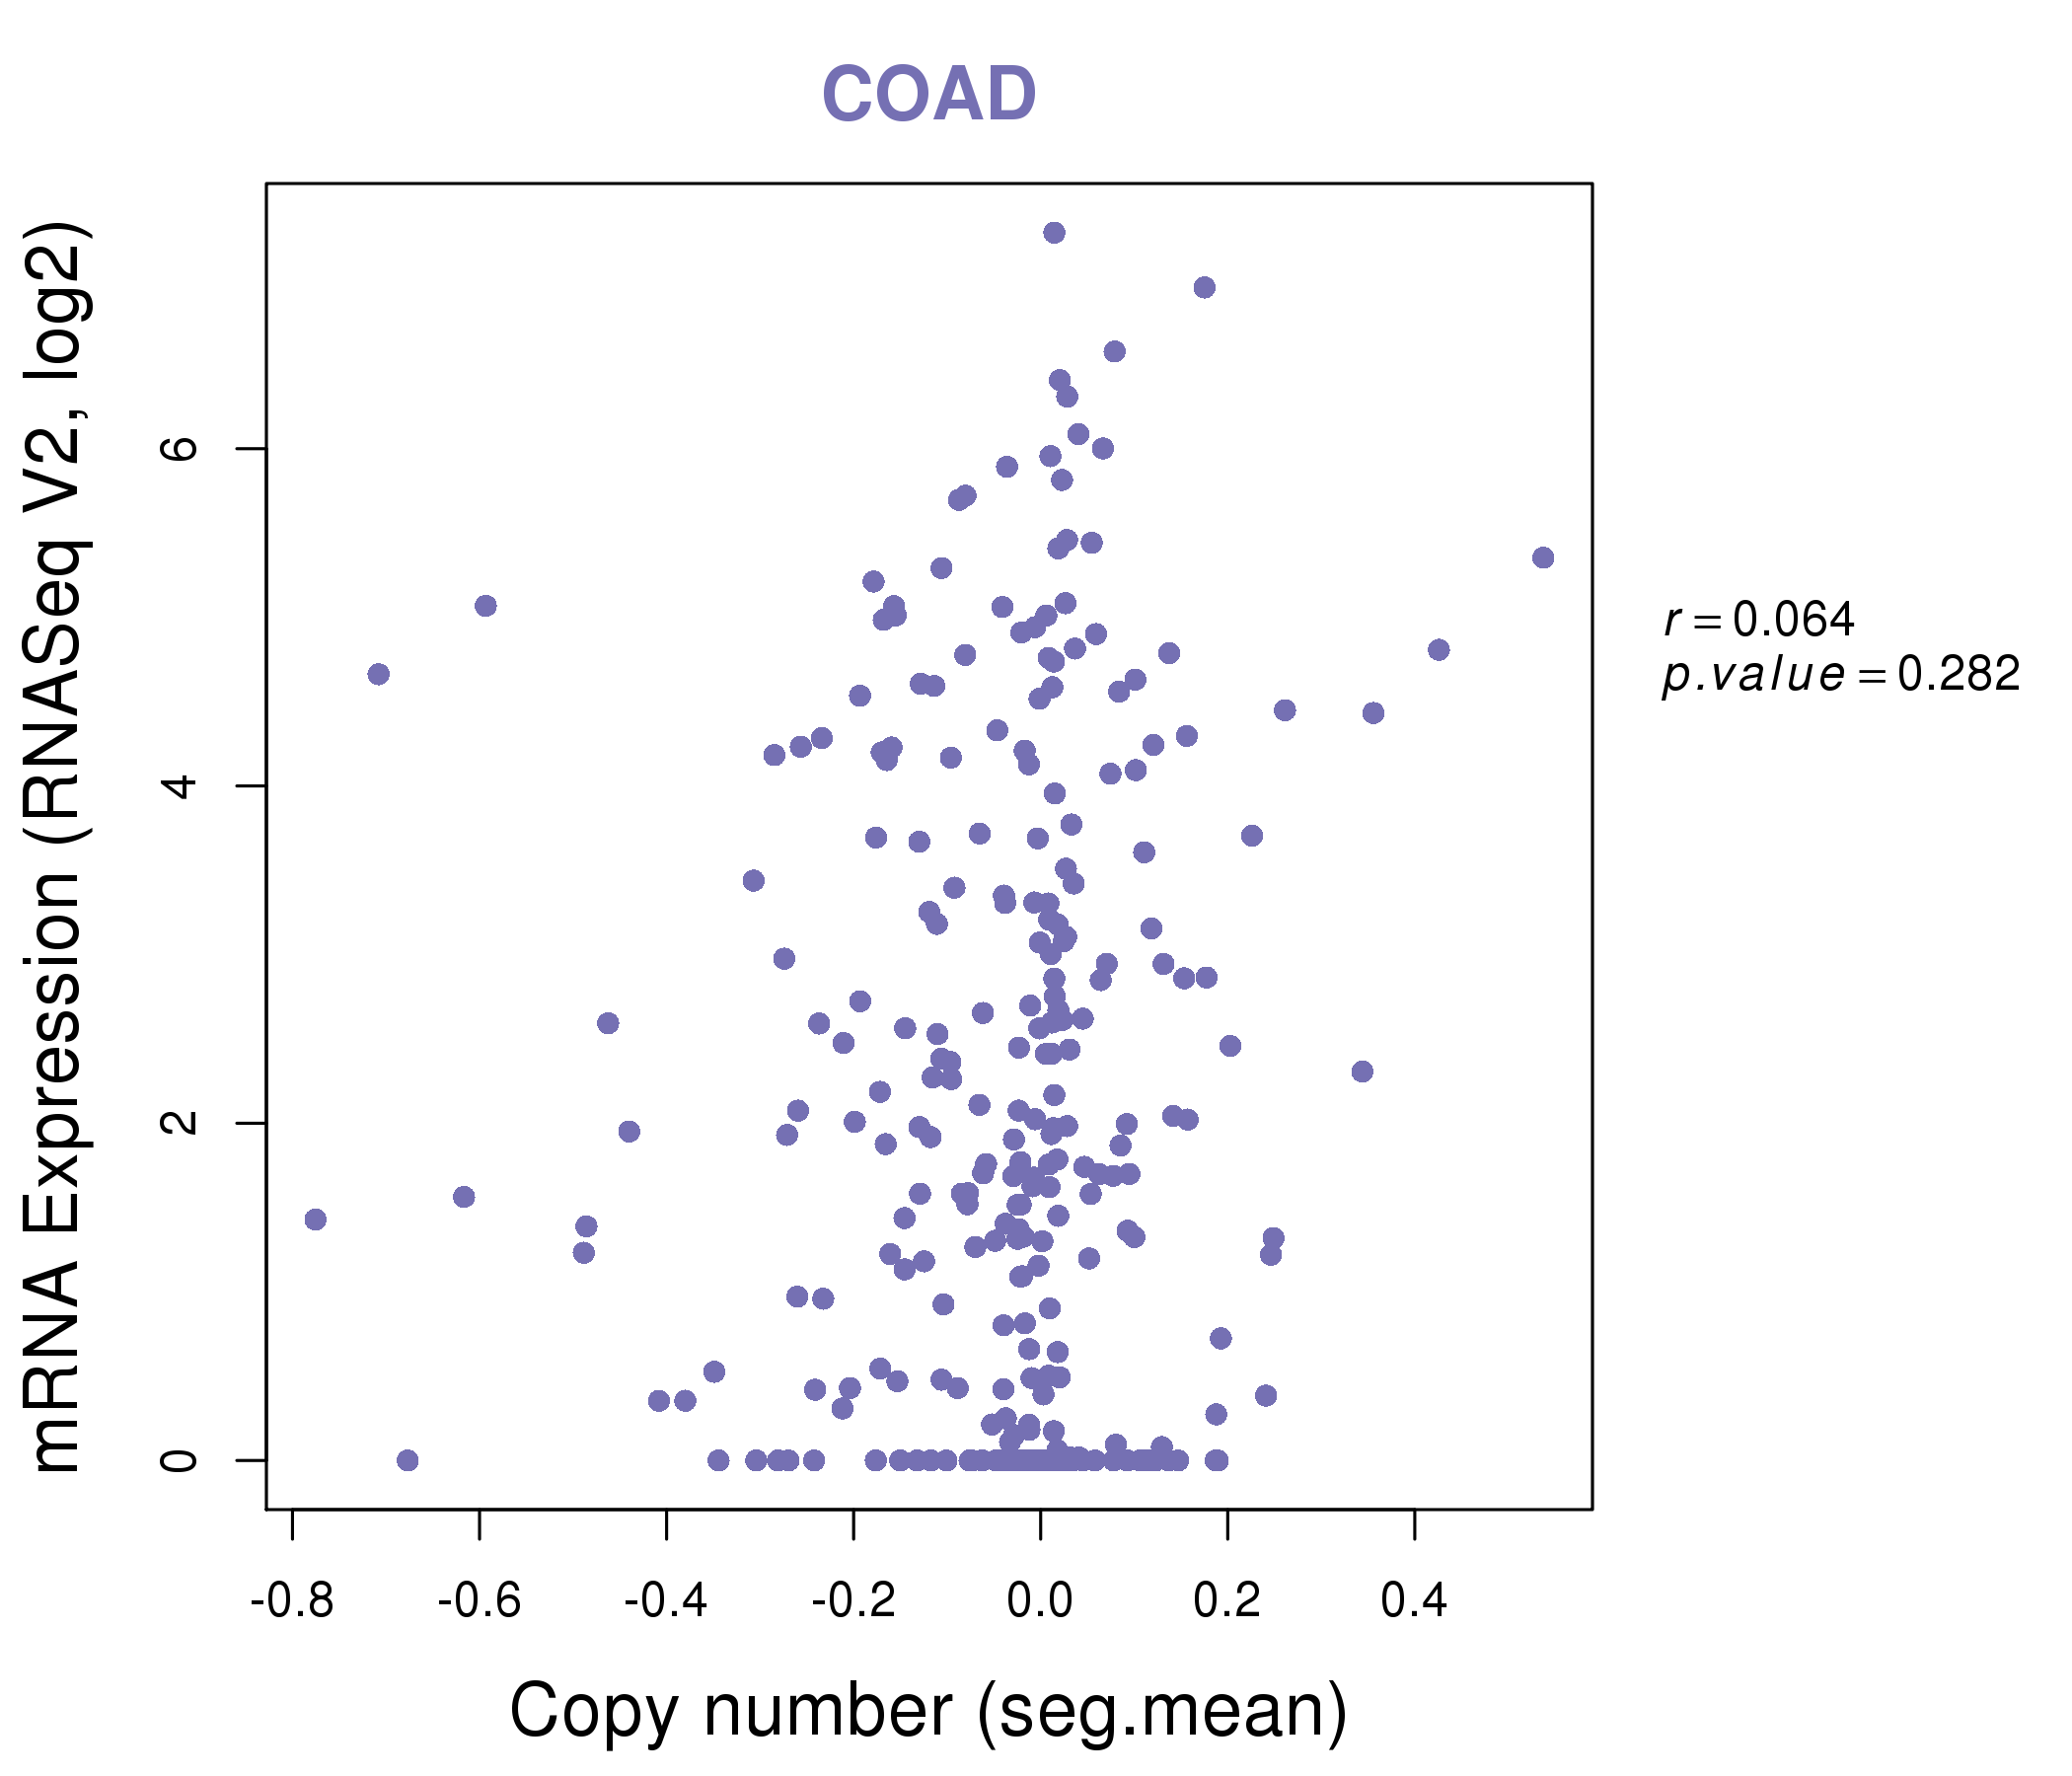
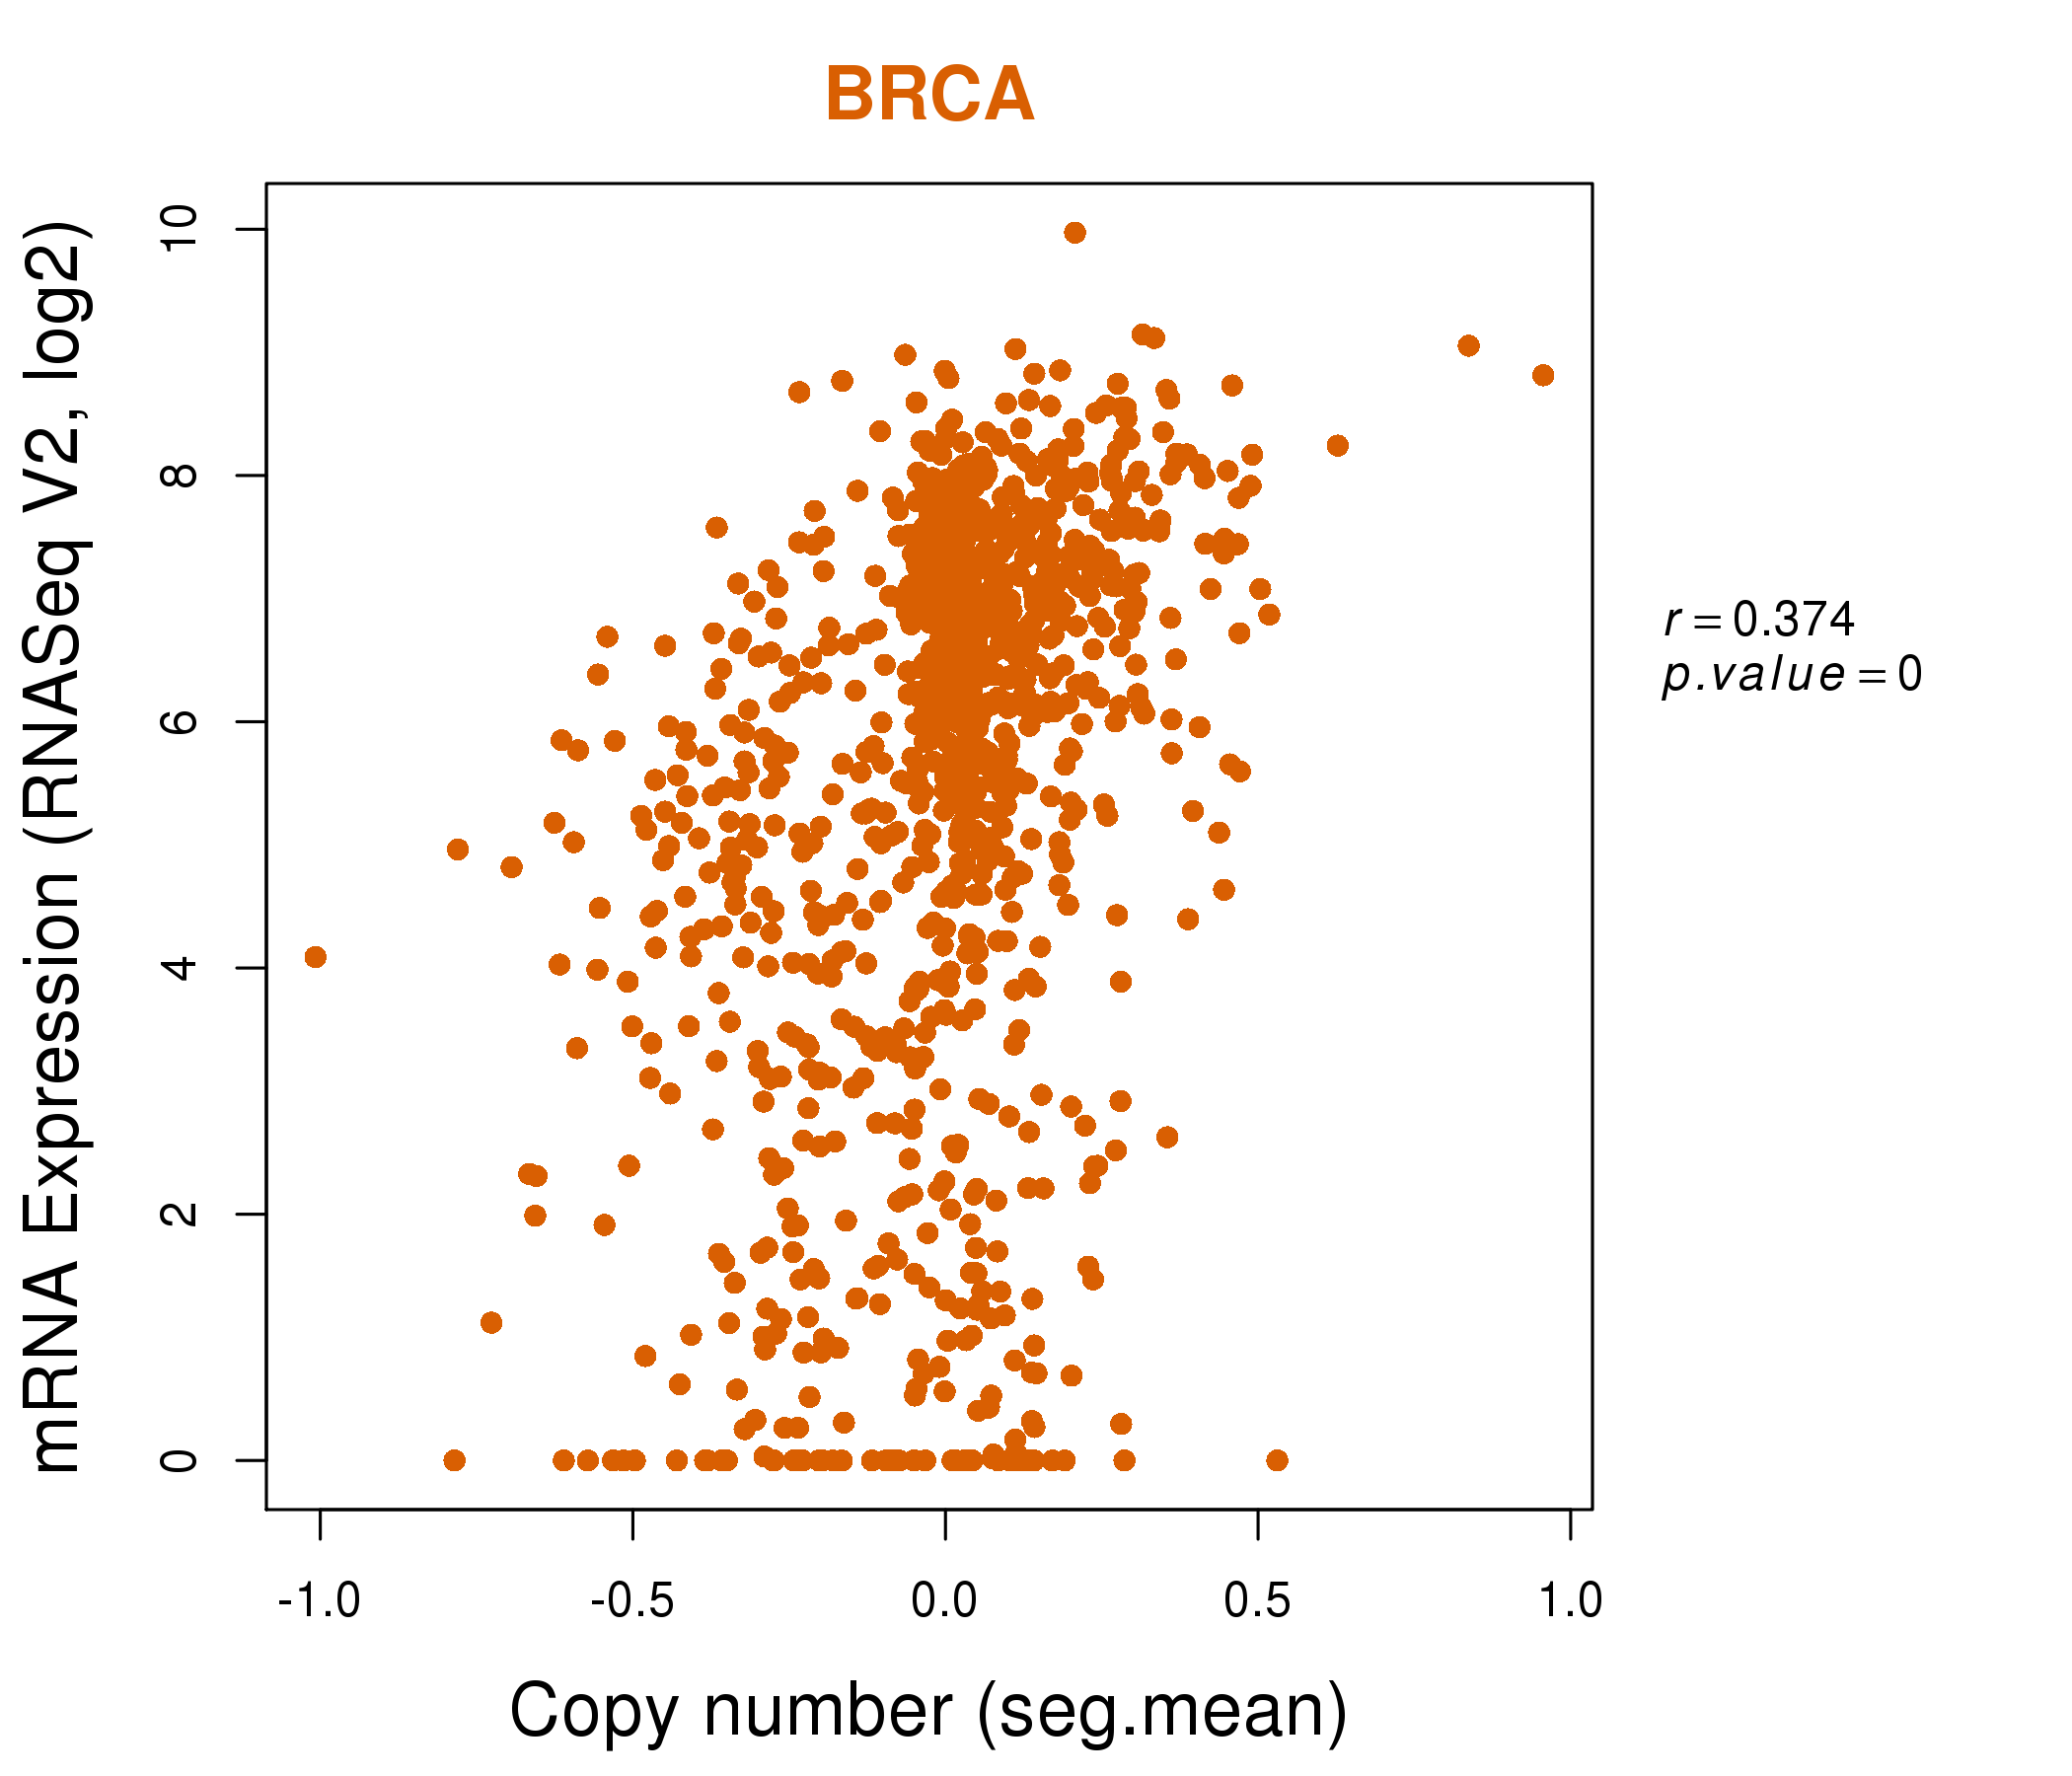
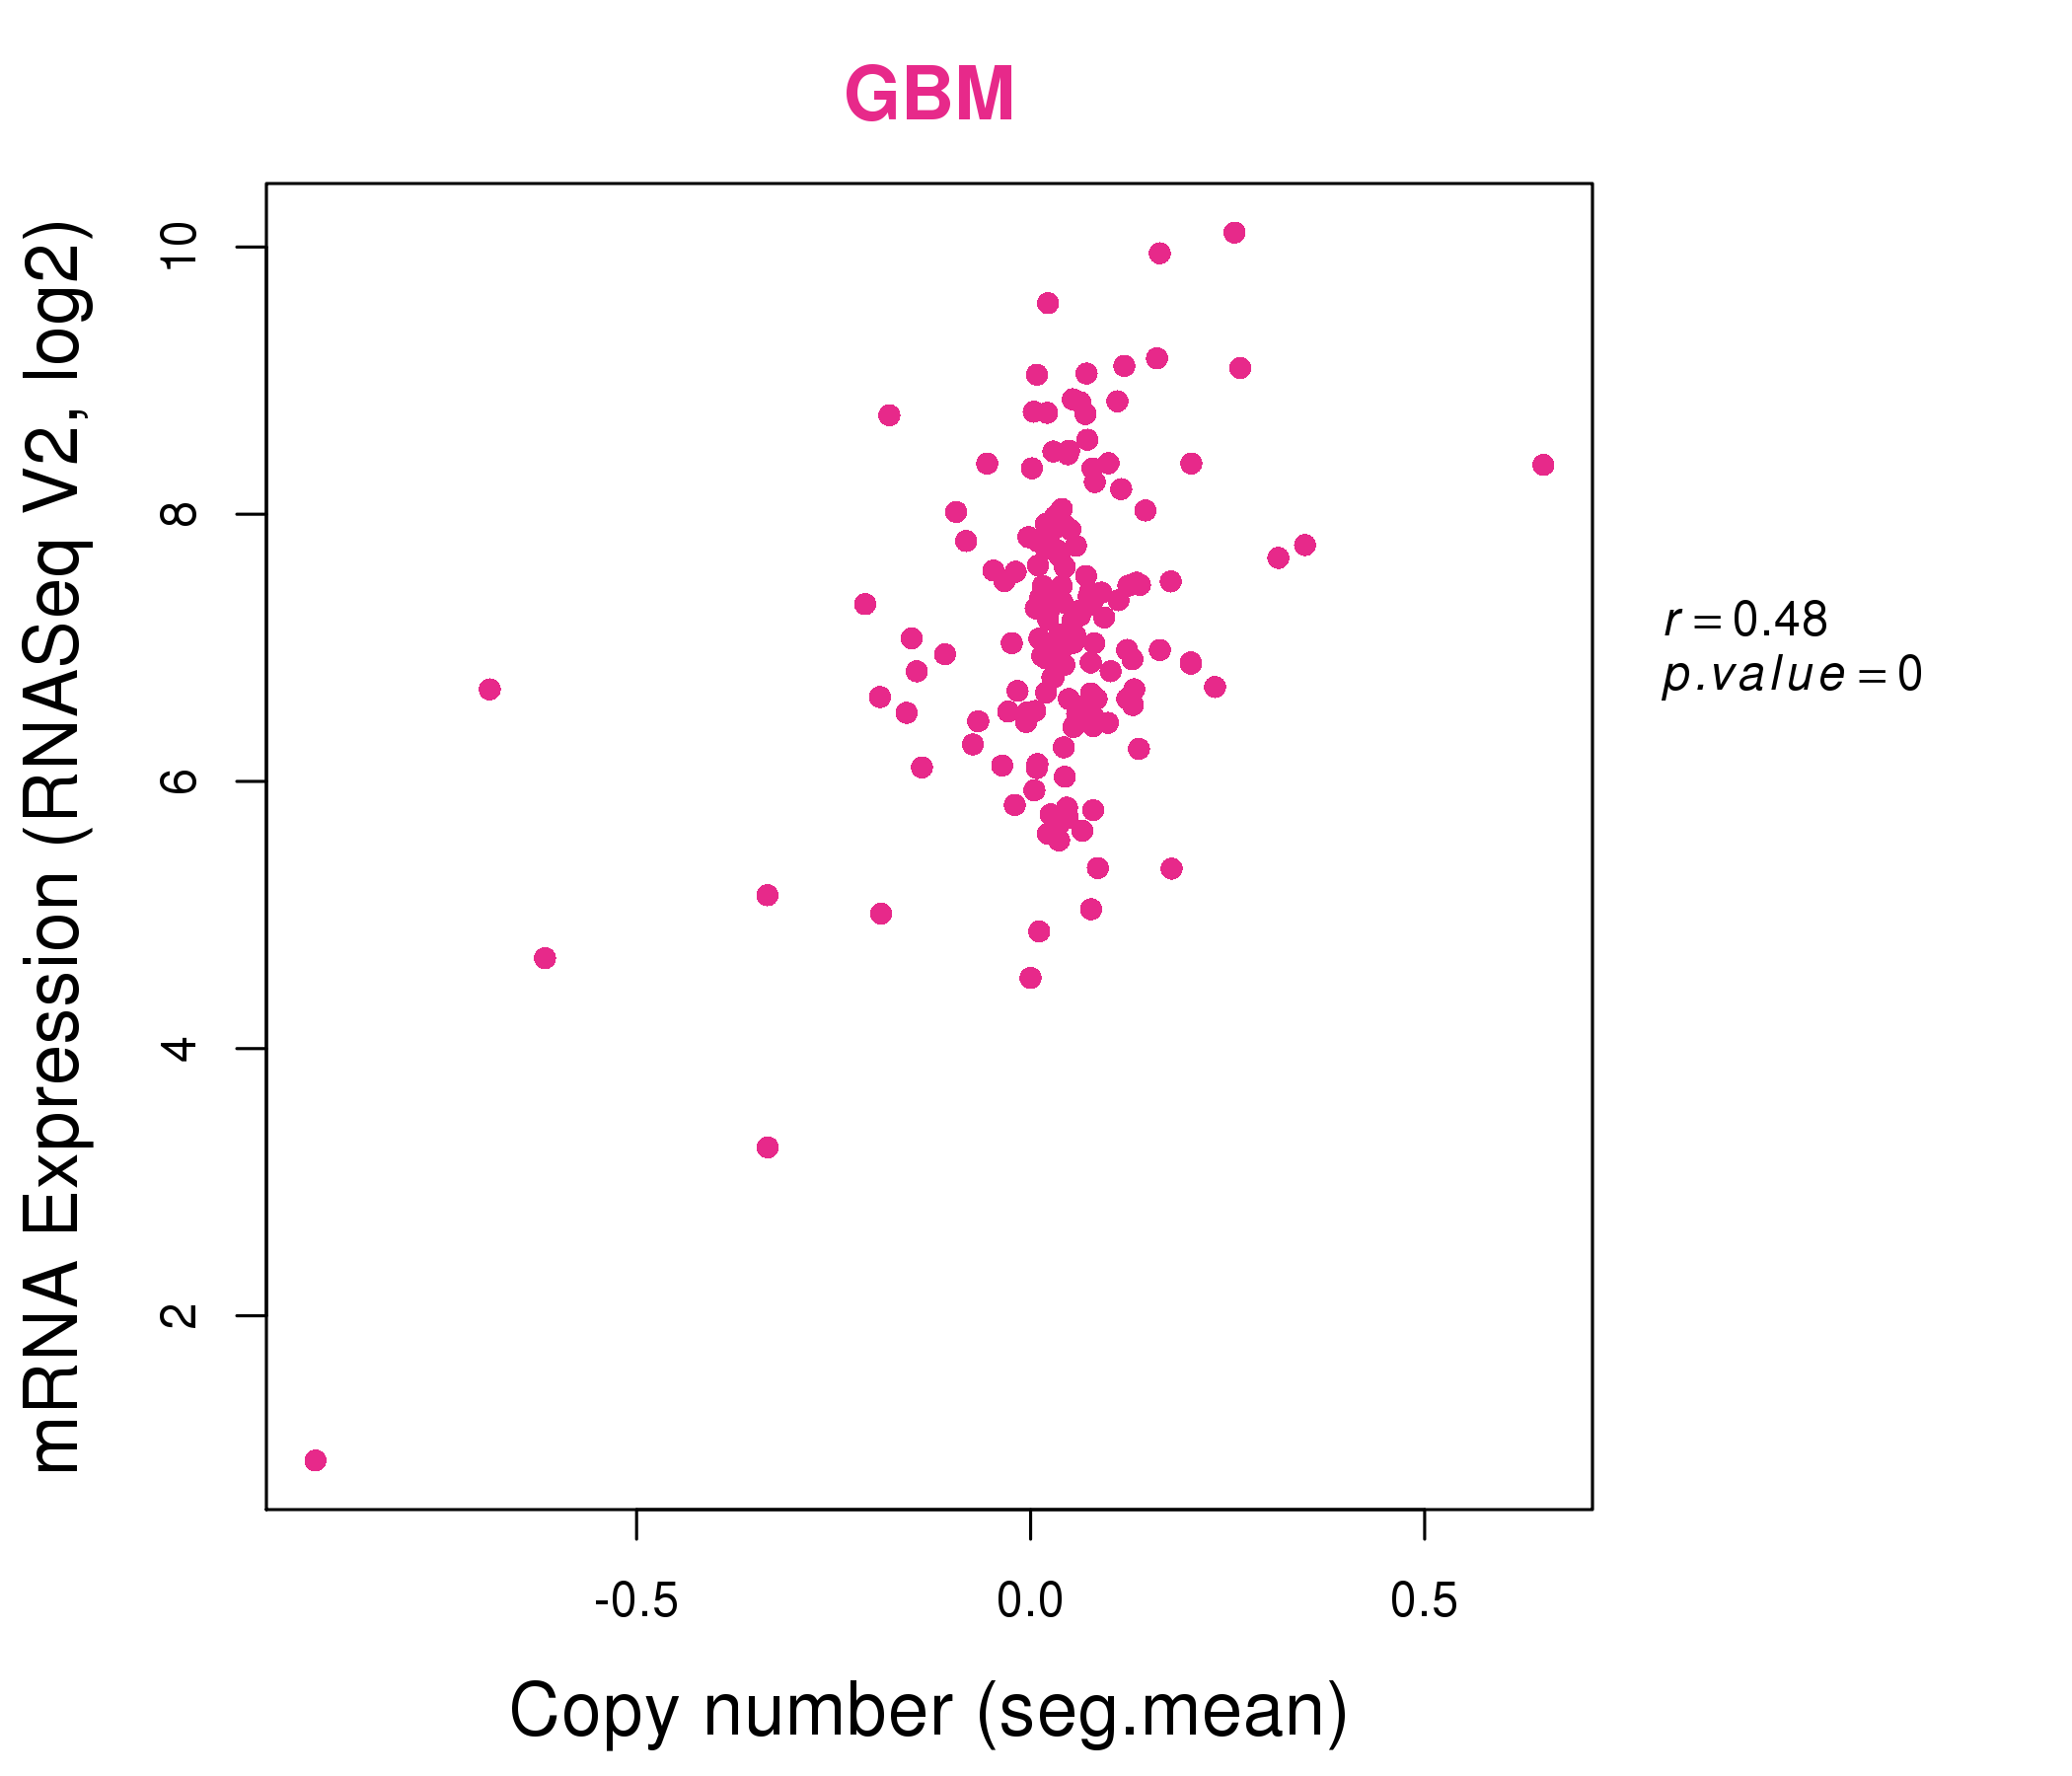
| * This plots show the correlation between CNV and gene expression. |
: Open all plots for all cancer types
 |
|
 |
|
| Top |
| Gene-Gene Network Information |
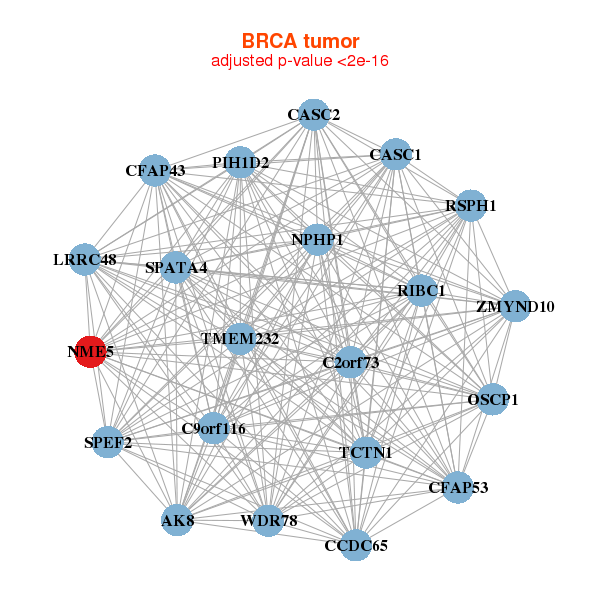
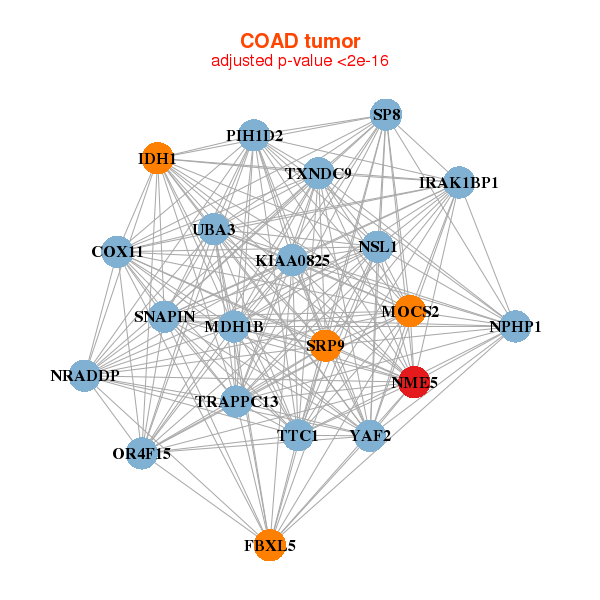
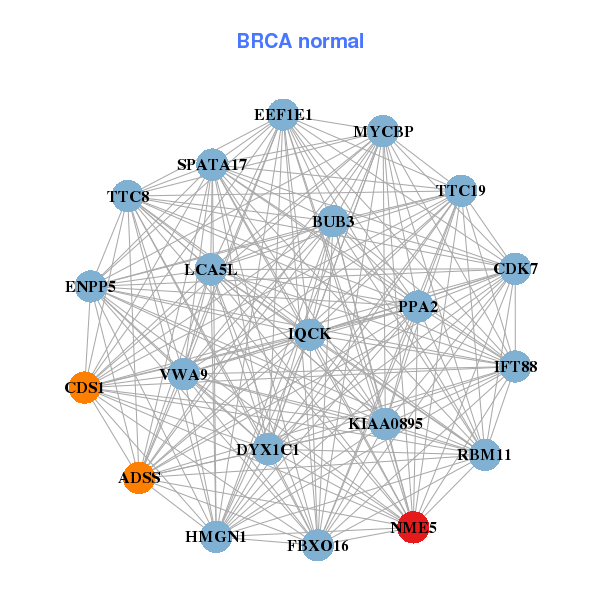
| * Co-Expression network figures were drawn using R package igraph. Only the top 20 genes with the highest correlations were shown. Red circle: input gene, orange circle: cell metabolism gene, sky circle: other gene |
: Open all plots for all cancer types
 |
|
| CFAP43,C2orf73,C9orf116,AK8,CASC1,CASC2,CFAP53, CCDC65,LRRC48,NME5,NPHP1,OSCP1,PIH1D2,RIBC1, RSPH1,SPATA4,SPEF2,TCTN1,TMEM232,WDR78,ZMYND10 | ADSS,BUB3,VWA9,CDK7,CDS1,DYX1C1,EEF1E1, ENPP5,FBXO16,HMGN1,IFT88,IQCK,KIAA0895,LCA5L, MYCBP,NME5,PPA2,RBM11,SPATA17,TTC19,TTC8 |
 |
|
| KIAA0825,TRAPPC13,COX11,FBXL5,IDH1,IRAK1BP1,MDH1B, MOCS2,NME5,NPHP1,NRADDP,NSL1,OR4F15,PIH1D2, SNAPIN,SP8,SRP9,TTC1,TXNDC9,UBA3,YAF2 | TMEM237,ASB5,B3GALNT1,CCDC169,FAM229B,CFAP36,MICU3, EIF5A2,FGF10,FKBP7,FXYD1,GNG11,HDGFRP3,KIAA0895, LOH12CR2,NME4,NME5,PTN,SNCA,TCEAL1,TPD52L1 |
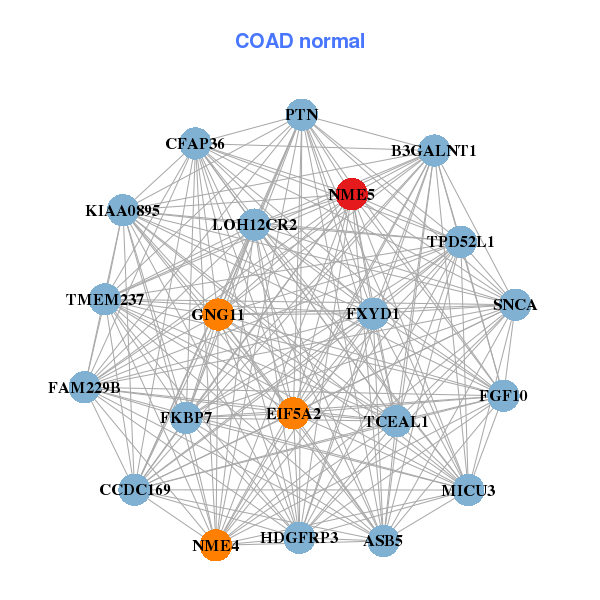
| * Co-Expression network figures were drawn using R package igraph. Only the top 20 genes with the highest correlations were shown. Red circle: input gene, orange circle: cell metabolism gene, sky circle: other gene |
: Open all plots for all cancer types
| Top |
: Open all interacting genes' information including KEGG pathway for all interacting genes from DAVID
| Top |
| Pharmacological Information for NME5 |
| There's no related Drug. |
| Top |
| Cross referenced IDs for NME5 |
| * We obtained these cross-references from Uniprot database. It covers 150 different DBs, 18 categories. http://www.uniprot.org/help/cross_references_section |
: Open all cross reference information
|
Copyright © 2016-Present - The Univsersity of Texas Health Science Center at Houston @ |