|
|||||||||||||||||||||||||||||||||||||||||||||||||||||||||||||||||||||||||||||||||||||||||||||||||||||||||||||||||||||||||||||||||||||||||||||||||||||||||||||||||||||||||||||||||||||||||||||||||||||||||||||||||||||||||||||||||||||||||||||||||||||||||||||||||||||||||||||||||||||||||||||||||||||||||||||||||||||||||||||||||||||||||||||
| |
| Phenotypic Information (metabolism pathway, cancer, disease, phenome) |
| |
| |
| Gene-Gene Network Information: Co-Expression Network, Interacting Genes & KEGG |
| |
|


| Gene Summary for PIP5K1A |
| Basic gene info. | Gene symbol | PIP5K1A |
| Gene name | phosphatidylinositol-4-phosphate 5-kinase, type I, alpha | |
| Synonyms | - | |
| Cytomap | UCSC genome browser: 1q21.3 | |
| Genomic location | chr1 :151171020-151222007 | |
| Type of gene | protein-coding | |
| RefGenes | NM_001135636.1, NM_001135637.1,NM_001135638.1,NM_003557.2, | |
| Ensembl id | ENSG00000143398 | |
| Description | 68 kDa type I phosphatidylinositol 4-phosphate 5-kinase alpha68 kDa type I phosphatidylinositol-4-phosphate 5-kinase alphaPIP5K1-alphaPIP5KIalphaphosphatidylinositol 4-phosphate 5-kinase type I alphaphosphatidylinositol 4-phosphate 5-kinase type-1 al | |
| Modification date | 20141207 | |
| dbXrefs | MIM : 603275 | |
| HGNC : HGNC | ||
| Ensembl : ENSG00000143398 | ||
| Vega : OTTHUMG00000012351 | ||
| Protein | UniProt: Q99755 go to UniProt's Cross Reference DB Table | |
| Expression | CleanEX: HS_PIP5K1A | |
| BioGPS: 8394 | ||
| Gene Expression Atlas: ENSG00000143398 | ||
| The Human Protein Atlas: ENSG00000143398 | ||
| Pathway | NCI Pathway Interaction Database: PIP5K1A | |
| KEGG: PIP5K1A | ||
| REACTOME: PIP5K1A | ||
| ConsensusPathDB | ||
| Pathway Commons: PIP5K1A | ||
| Metabolism | MetaCyc: PIP5K1A | |
| HUMANCyc: PIP5K1A | ||
| Regulation | Ensembl's Regulation: ENSG00000143398 | |
| miRBase: chr1 :151,171,020-151,222,007 | ||
| TargetScan: NM_001135636 | ||
| cisRED: ENSG00000143398 | ||
| Context | iHOP: PIP5K1A | |
| cancer metabolism search in PubMed: PIP5K1A | ||
| UCL Cancer Institute: PIP5K1A | ||
| Assigned class in ccmGDB | B - This gene belongs to cancer gene. | |
| Top |
| Phenotypic Information for PIP5K1A(metabolism pathway, cancer, disease, phenome) |
| Cancer | CGAP: PIP5K1A |
| Familial Cancer Database: PIP5K1A | |
| * This gene is included in those cancer gene databases. |
|
|
|
|
|
|
| |||||||||||||||||||||||||||||||||||||||||||||||||||||||||||||||||||||||||||||||||||||||||||||||||||||||||||||||||||||||||||||||||||||||||||||||||||||||||||||||||||||||||||||||||||||||||||||||||||||||||||||||||||||||||||||||||||||||||||||||||||||||||||||||||||||||||||||||||||||||||||||||||||||||||||||||||||||||||||||||||||||||
Oncogene 1 | Significant driver gene in | ||||||||||||||||||||||||||||||||||||||||||||||||||||||||||||||||||||||||||||||||||||||||||||||||||||||||||||||||||||||||||||||||||||||||||||||||||||||||||||||||||||||||||||||||||||||||||||||||||||||||||||||||||||||||||||||||||||||||||||||||||||||||||||||||||||||||||||||||||||||||||||||||||||||||||||||||||||||||||||||||||||||||||||
| cf) number; DB name 1 Oncogene; http://nar.oxfordjournals.org/content/35/suppl_1/D721.long, 2 Tumor Suppressor gene; https://bioinfo.uth.edu/TSGene/, 3 Cancer Gene Census; http://www.nature.com/nrc/journal/v4/n3/abs/nrc1299.html, 4 CancerGenes; http://nar.oxfordjournals.org/content/35/suppl_1/D721.long, 5 Network of Cancer Gene; http://ncg.kcl.ac.uk/index.php, 1Therapeutic Vulnerabilities in Cancer; http://cbio.mskcc.org/cancergenomics/statius/ |
| KEGG_INOSITOL_PHOSPHATE_METABOLISM KEGG_FC_GAMMA_R_MEDIATED_PHAGOCYTOSIS | |
| OMIM | 603275; gene. |
| Orphanet | |
| Disease | KEGG Disease: PIP5K1A |
| MedGen: PIP5K1A (Human Medical Genetics with Condition) | |
| ClinVar: PIP5K1A | |
| Phenotype | MGI: PIP5K1A (International Mouse Phenotyping Consortium) |
| PhenomicDB: PIP5K1A | |
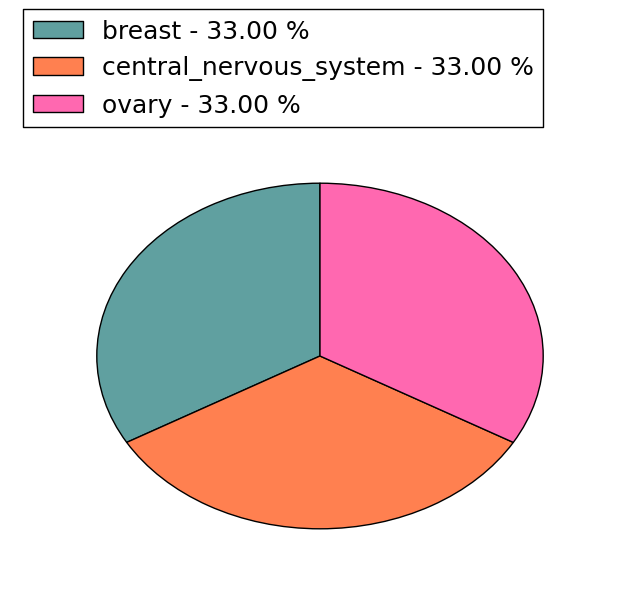
| Mutations for PIP5K1A |
| * Under tables are showing count per each tissue to give us broad intuition about tissue specific mutation patterns.You can go to the detailed page for each mutation database's web site. |
| - Statistics for Tissue and Mutation type | Top |
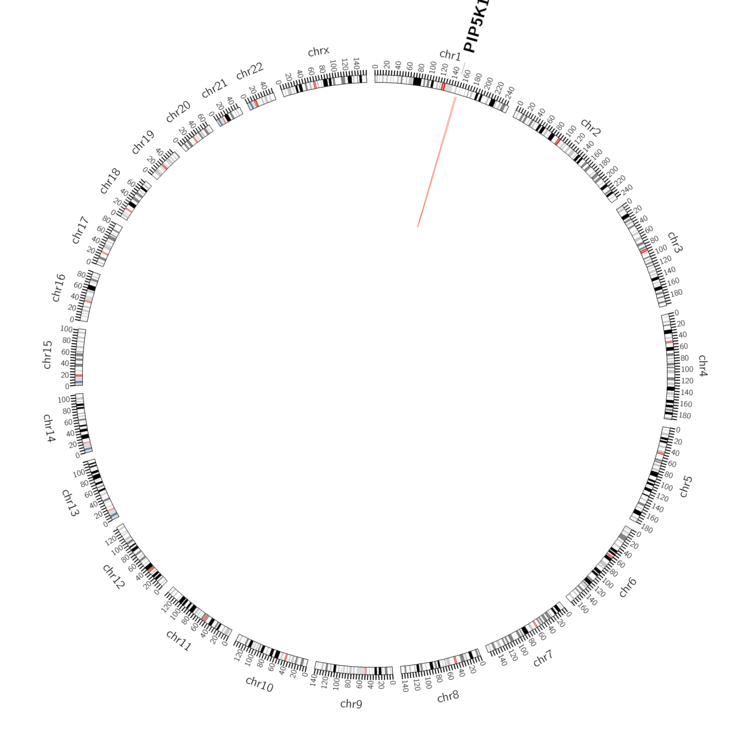 |
| - For Inter-chromosomal Variations |
| There's no inter-chromosomal structural variation. |
| - For Intra-chromosomal Variations |
| There's no intra-chromosomal structural variation. |
| Sample | Symbol_a | Chr_a | Start_a | End_a | Symbol_b | Chr_b | Start_b | End_b |
| ovary | PIP5K1A | chr1 | 151211579 | 151211599 | PIP5K1A | chr1 | 151214312 | 151214332 |
| pancreas | PIP5K1A | chr1 | 151212636 | 151212656 | chr1 | 153400235 | 153400255 |
| cf) Tissue number; Tissue name (1;Breast, 2;Central_nervous_system, 3;Haematopoietic_and_lymphoid_tissue, 4;Large_intestine, 5;Liver, 6;Lung, 7;Ovary, 8;Pancreas, 9;Prostate, 10;Skin, 11;Soft_tissue, 12;Upper_aerodigestive_tract) |
| * From mRNA Sanger sequences, Chitars2.0 arranged chimeric transcripts. This table shows PIP5K1A related fusion information. |
| ID | Head Gene | Tail Gene | Accession | Gene_a | qStart_a | qEnd_a | Chromosome_a | tStart_a | tEnd_a | Gene_a | qStart_a | qEnd_a | Chromosome_a | tStart_a | tEnd_a |
| CD388184 | NSF | 103 | 613 | 17 | 44798995 | 44799500 | PIP5K1A | 609 | 632 | 1 | 151210665 | 151210701 | |
| BQ321472 | CAMKK2 | 120 | 350 | 12 | 121698291 | 121698521 | PIP5K1A | 344 | 508 | 1 | 151171640 | 151171802 | |
| BE172039 | NEDD4L | 1 | 325 | 18 | 56064705 | 56065256 | PIP5K1A | 312 | 400 | 1 | 151172777 | 151172868 | |
| Top |
| Mutation type/ Tissue ID | brca | cns | cerv | endome | haematopo | kidn | Lintest | liver | lung | ns | ovary | pancre | prost | skin | stoma | thyro | urina | |||
| Total # sample | 1 | |||||||||||||||||||
| GAIN (# sample) | 1 | |||||||||||||||||||
| LOSS (# sample) |
| cf) Tissue ID; Tissue type (1; Breast, 2; Central_nervous_system, 3; Cervix, 4; Endometrium, 5; Haematopoietic_and_lymphoid_tissue, 6; Kidney, 7; Large_intestine, 8; Liver, 9; Lung, 10; NS, 11; Ovary, 12; Pancreas, 13; Prostate, 14; Skin, 15; Stomach, 16; Thyroid, 17; Urinary_tract) |
| Top |
|
 |
| Top |
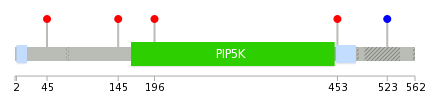
| Stat. for Non-Synonymous SNVs (# total SNVs=3) | (# total SNVs=0) |
 | |
(# total SNVs=0) | (# total SNVs=0) |
| Top |
| * When you move the cursor on each content, you can see more deailed mutation information on the Tooltip. Those are primary_site,primary_histology,mutation(aa),pubmedID. |
| GRCh37 position | Mutation(aa) | Unique sampleID count |
| chr1:151199812-151199812 | p.G45D | 1 |
| chr1:151204828-151204828 | p.P145L | 1 |
| chr1:151205165-151205165 | p.P196A | 1 |
| chr1:151214632-151214632 | p.G453D | 1 |
| chr1:151215011-151215011 | p.L523L | 1 |
| Top |
|
 |
| Point Mutation/ Tissue ID | 1 | 2 | 3 | 4 | 5 | 6 | 7 | 8 | 9 | 10 | 11 | 12 | 13 | 14 | 15 | 16 | 17 | 18 | 19 | 20 |
| # sample | 3 | 3 | 1 | 7 | 3 | 6 | 6 | 1 | 6 | 5 | 9 | |||||||||
| # mutation | 6 | 3 | 3 | 7 | 3 | 6 | 6 | 1 | 7 | 5 | 10 | |||||||||
| nonsynonymous SNV | 4 | 1 | 1 | 5 | 3 | 5 | 6 | 1 | 5 | 4 | 8 | |||||||||
| synonymous SNV | 2 | 2 | 2 | 2 | 1 | 2 | 1 | 2 |
| cf) Tissue ID; Tissue type (1; BLCA[Bladder Urothelial Carcinoma], 2; BRCA[Breast invasive carcinoma], 3; CESC[Cervical squamous cell carcinoma and endocervical adenocarcinoma], 4; COAD[Colon adenocarcinoma], 5; GBM[Glioblastoma multiforme], 6; Glioma Low Grade, 7; HNSC[Head and Neck squamous cell carcinoma], 8; KICH[Kidney Chromophobe], 9; KIRC[Kidney renal clear cell carcinoma], 10; KIRP[Kidney renal papillary cell carcinoma], 11; LAML[Acute Myeloid Leukemia], 12; LUAD[Lung adenocarcinoma], 13; LUSC[Lung squamous cell carcinoma], 14; OV[Ovarian serous cystadenocarcinoma ], 15; PAAD[Pancreatic adenocarcinoma], 16; PRAD[Prostate adenocarcinoma], 17; SKCM[Skin Cutaneous Melanoma], 18:STAD[Stomach adenocarcinoma], 19:THCA[Thyroid carcinoma], 20:UCEC[Uterine Corpus Endometrial Carcinoma]) |
| Top |
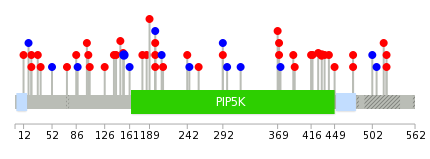
| * We represented just top 10 SNVs. When you move the cursor on each content, you can see more deailed mutation information on the Tooltip. Those are primary_site, primary_histology, mutation(aa), pubmedID. |
| Genomic Position | Mutation(aa) | Unique sampleID count |
| chr1:151214646 | p.L153L,PIP5K1A | 2 |
| chr1:151205165 | p.S23C,PIP5K1A | 2 |
| chr1:151171540 | p.P197A,PIP5K1A | 2 |
| chr1:151205035 | p.R431W,PIP5K1A | 2 |
| chr1:151205130 | p.R126C,PIP5K1A | 1 |
| chr1:151219439 | p.K245K,PIP5K1A | 1 |
| chr1:151206945 | p.S435F,PIP5K1A | 1 |
| chr1:151204252 | p.R139P,PIP5K1A | 1 |
| chr1:151214631 | p.S258A,PIP5K1A | 1 |
| chr1:151205142 | p.I441V,PIP5K1A | 1 |
| * Copy number data were extracted from TCGA using R package TCGA-Assembler. The URLs of all public data files on TCGA DCC data server were gathered on Jan-05-2015. Function ProcessCNAData in TCGA-Assembler package was used to obtain gene-level copy number value which is calculated as the average copy number of the genomic region of a gene. |
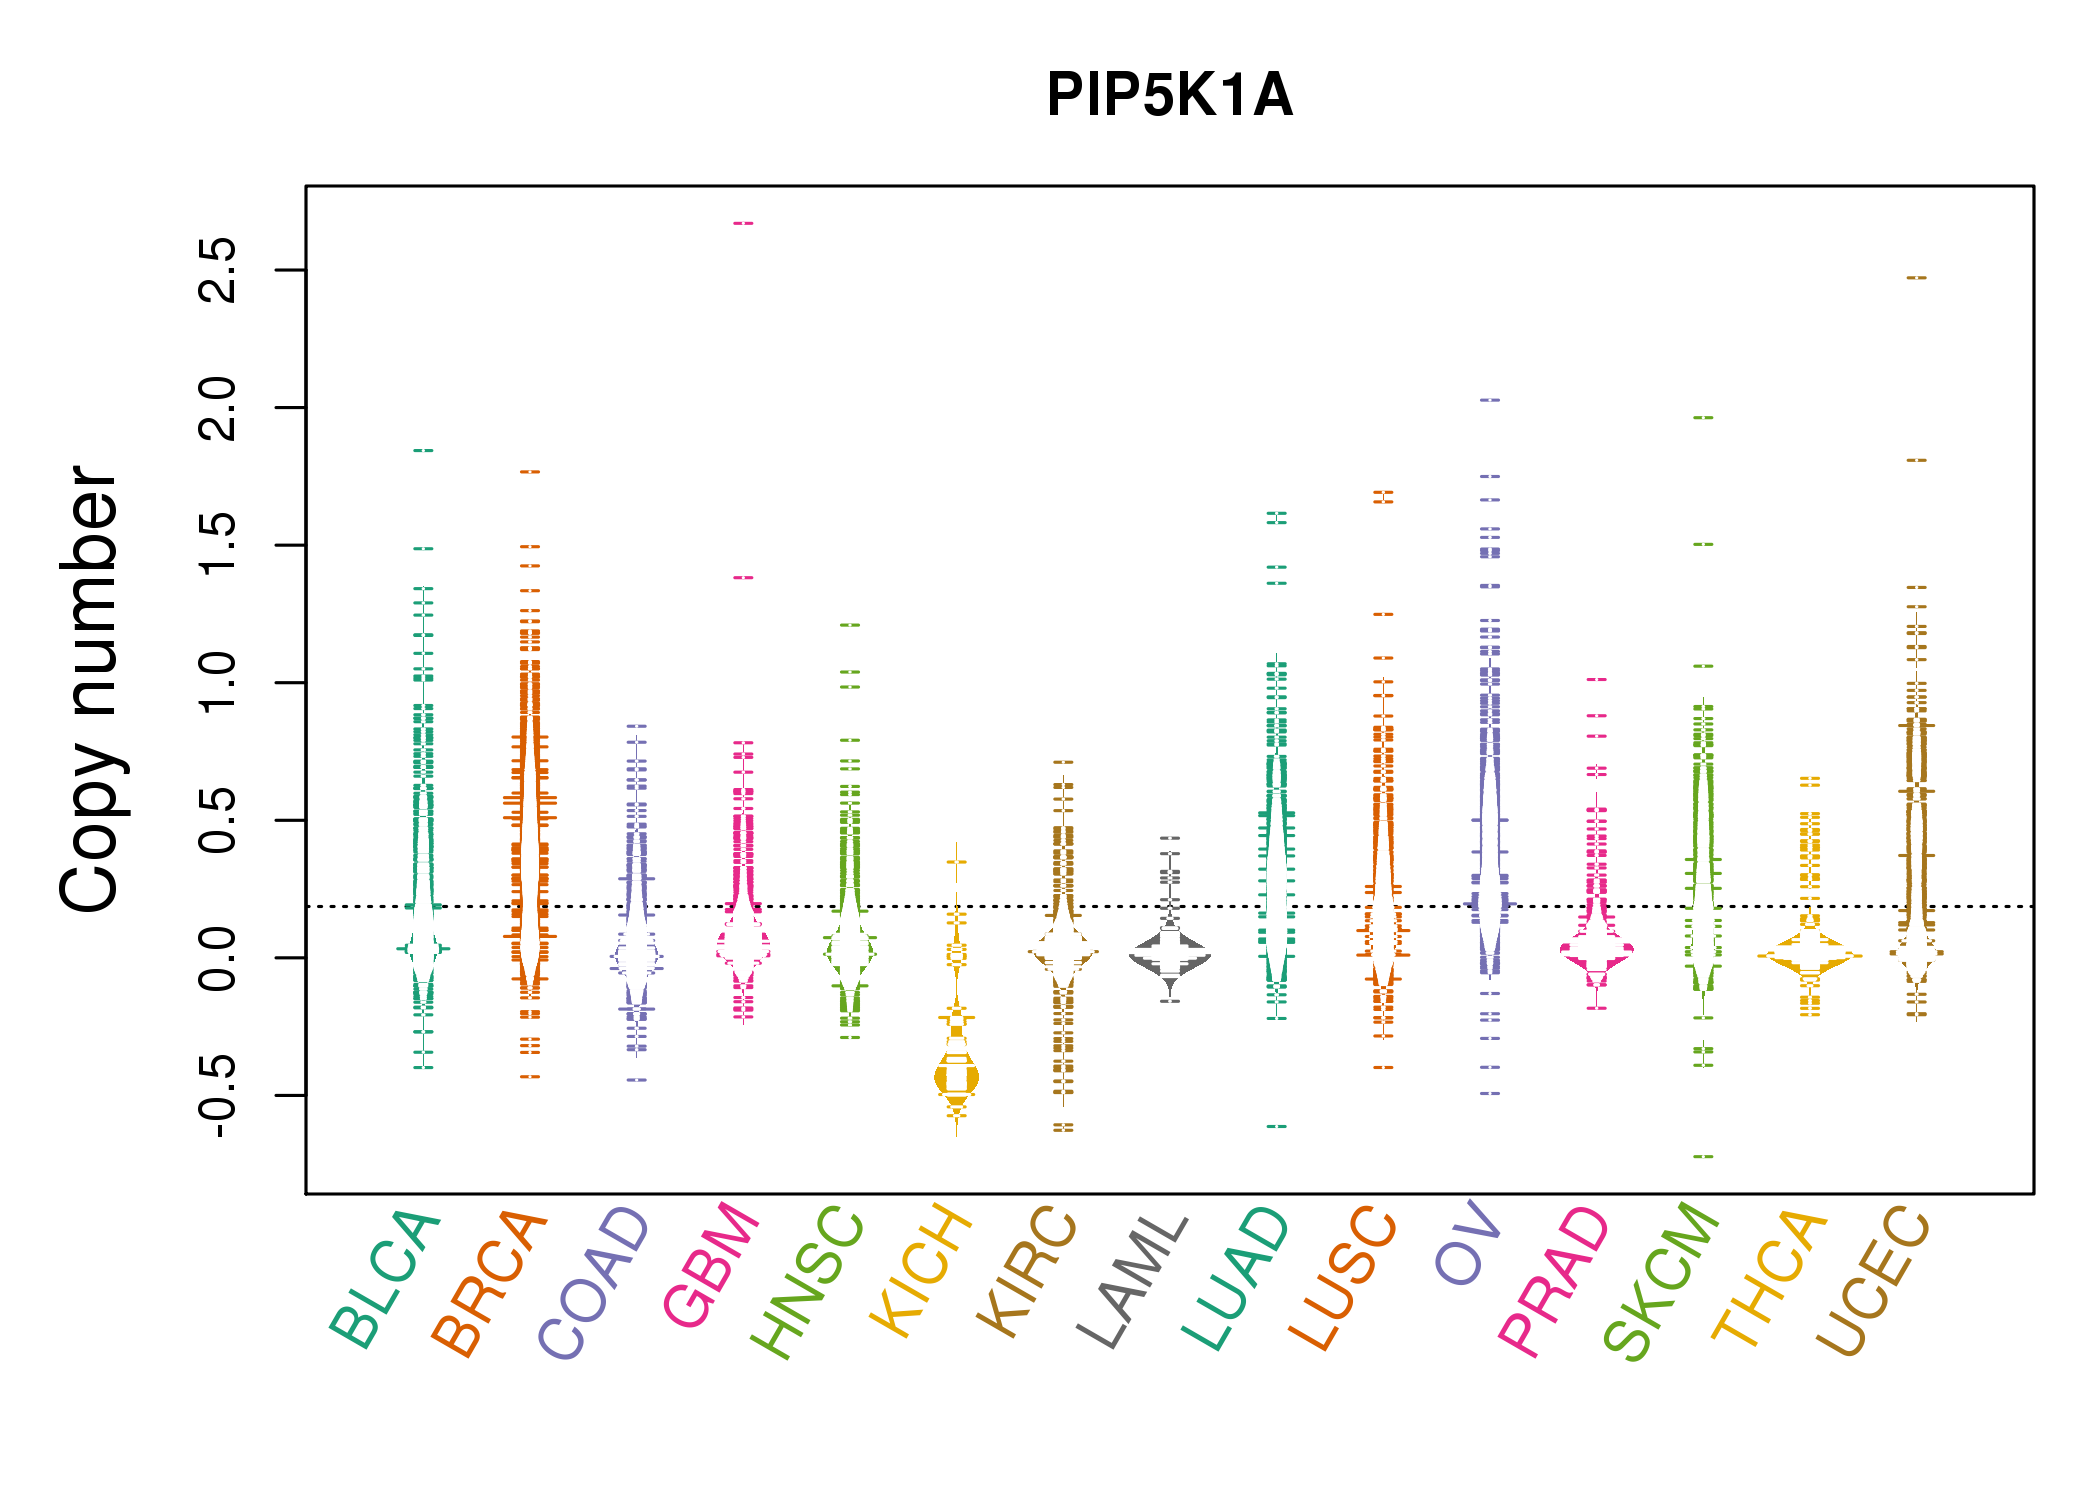 |
| cf) Tissue ID[Tissue type]: BLCA[Bladder Urothelial Carcinoma], BRCA[Breast invasive carcinoma], CESC[Cervical squamous cell carcinoma and endocervical adenocarcinoma], COAD[Colon adenocarcinoma], GBM[Glioblastoma multiforme], Glioma Low Grade, HNSC[Head and Neck squamous cell carcinoma], KICH[Kidney Chromophobe], KIRC[Kidney renal clear cell carcinoma], KIRP[Kidney renal papillary cell carcinoma], LAML[Acute Myeloid Leukemia], LUAD[Lung adenocarcinoma], LUSC[Lung squamous cell carcinoma], OV[Ovarian serous cystadenocarcinoma ], PAAD[Pancreatic adenocarcinoma], PRAD[Prostate adenocarcinoma], SKCM[Skin Cutaneous Melanoma], STAD[Stomach adenocarcinoma], THCA[Thyroid carcinoma], UCEC[Uterine Corpus Endometrial Carcinoma] |
| Top |
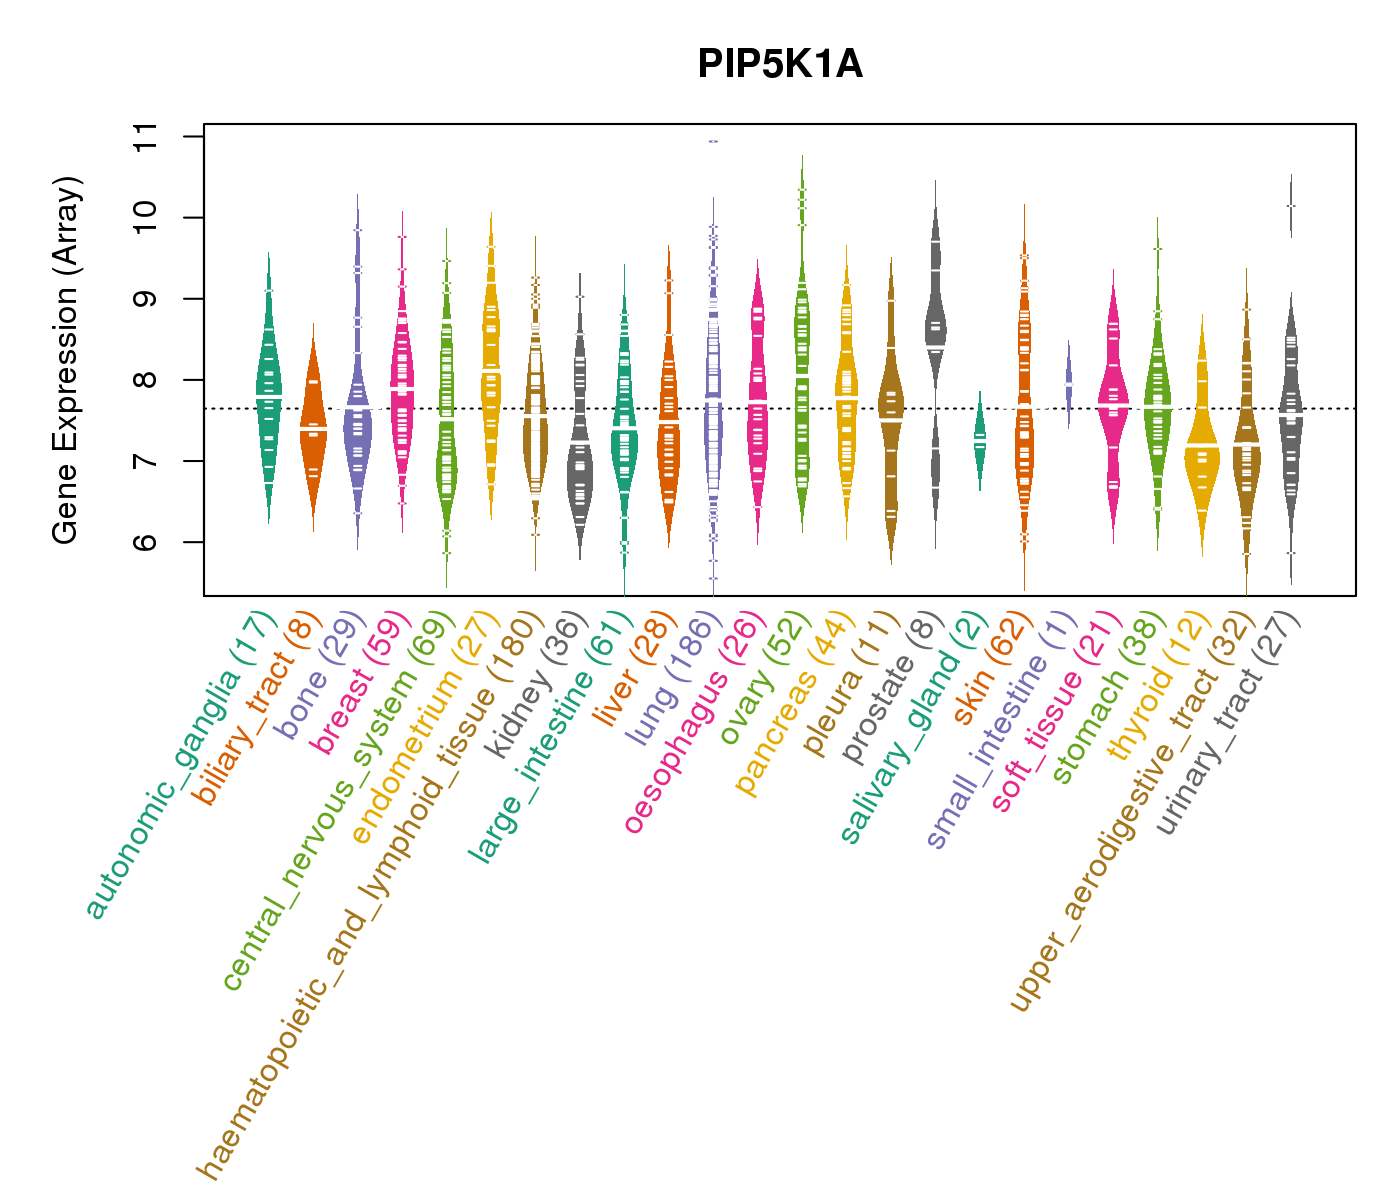
| Gene Expression for PIP5K1A |
| * CCLE gene expression data were extracted from CCLE_Expression_Entrez_2012-10-18.res: Gene-centric RMA-normalized mRNA expression data. |
 |
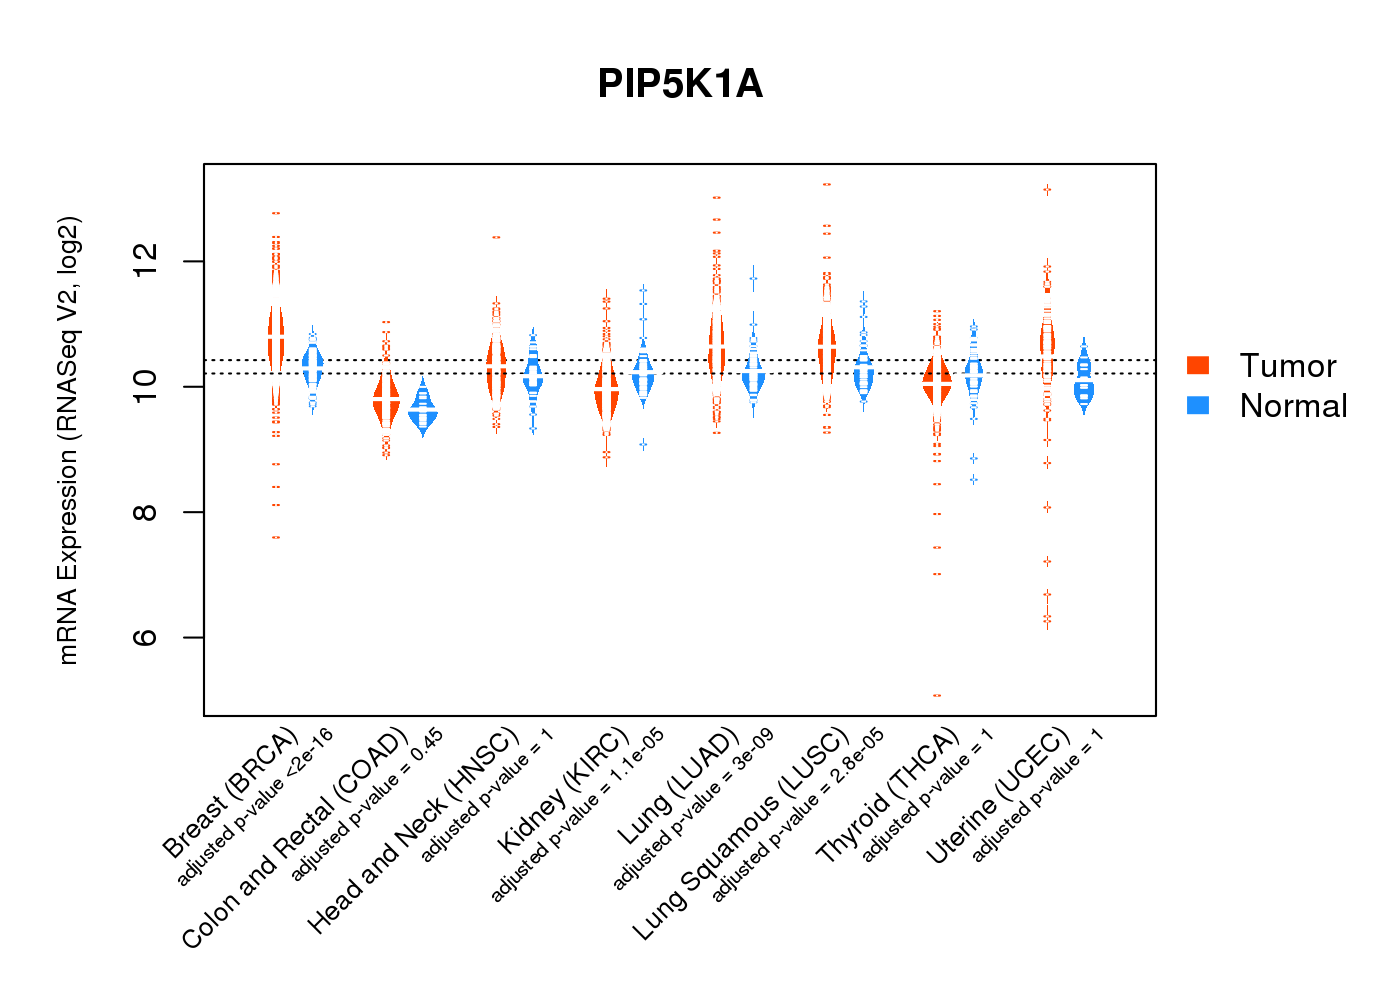
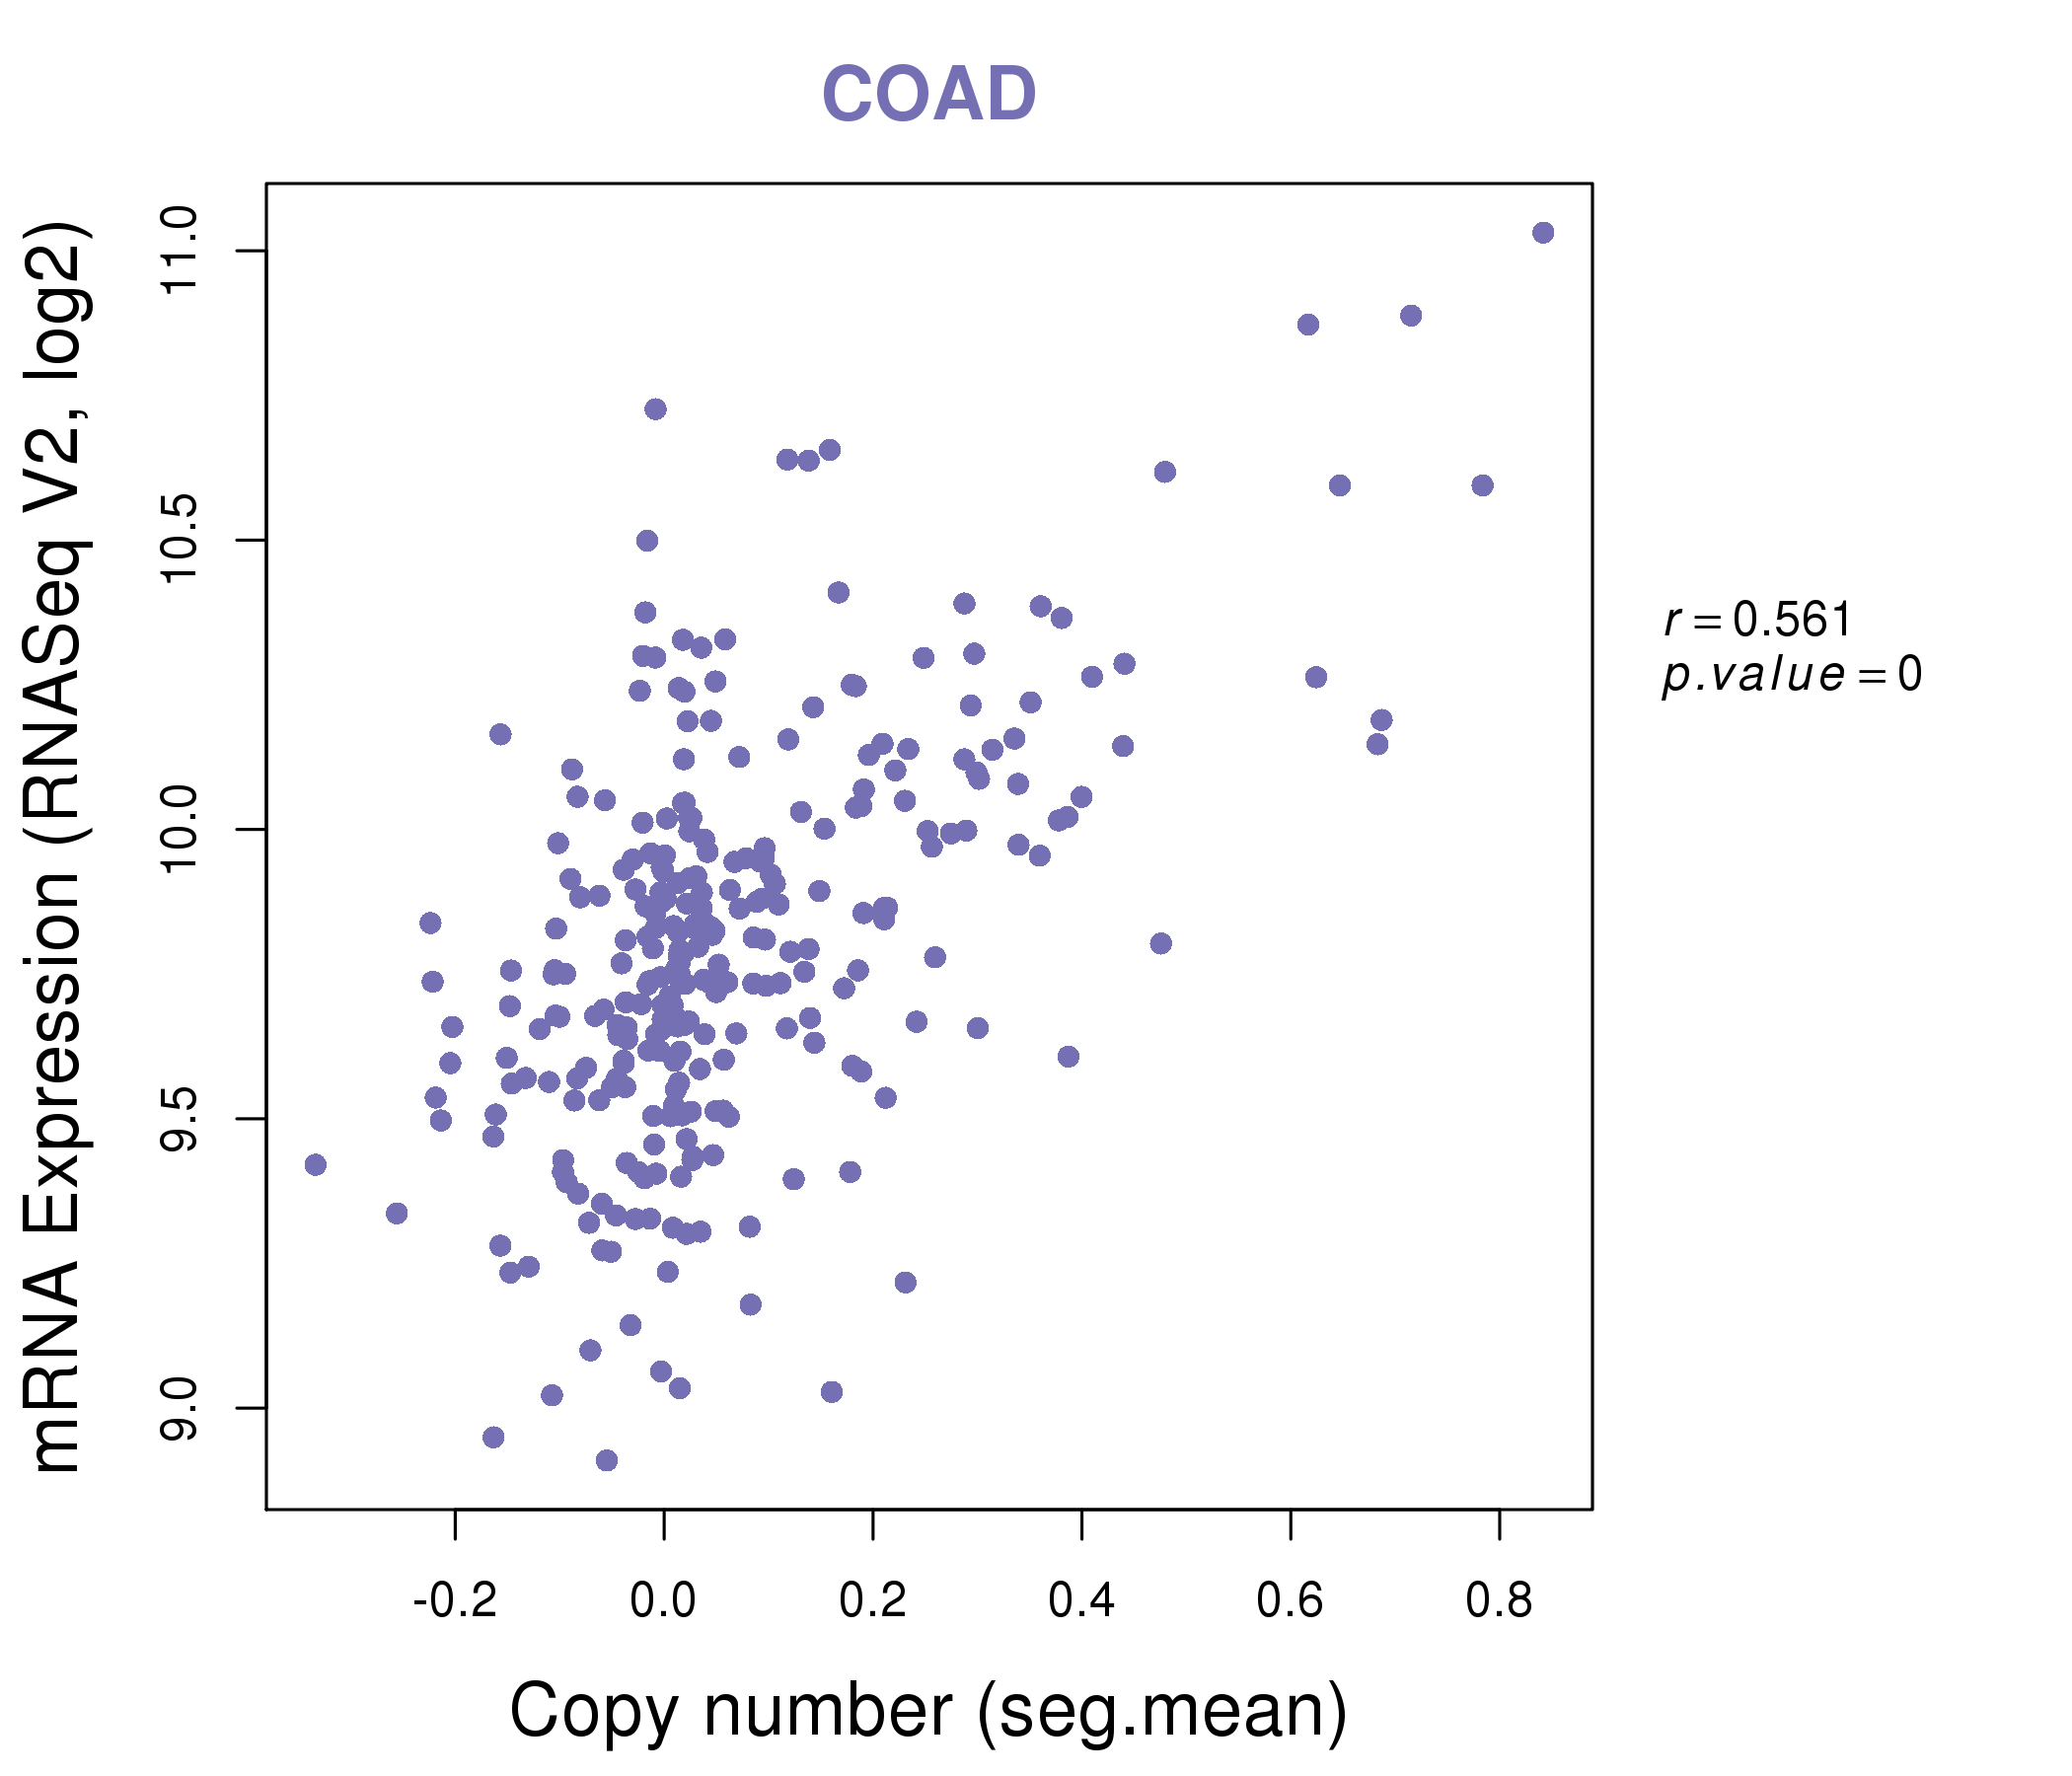
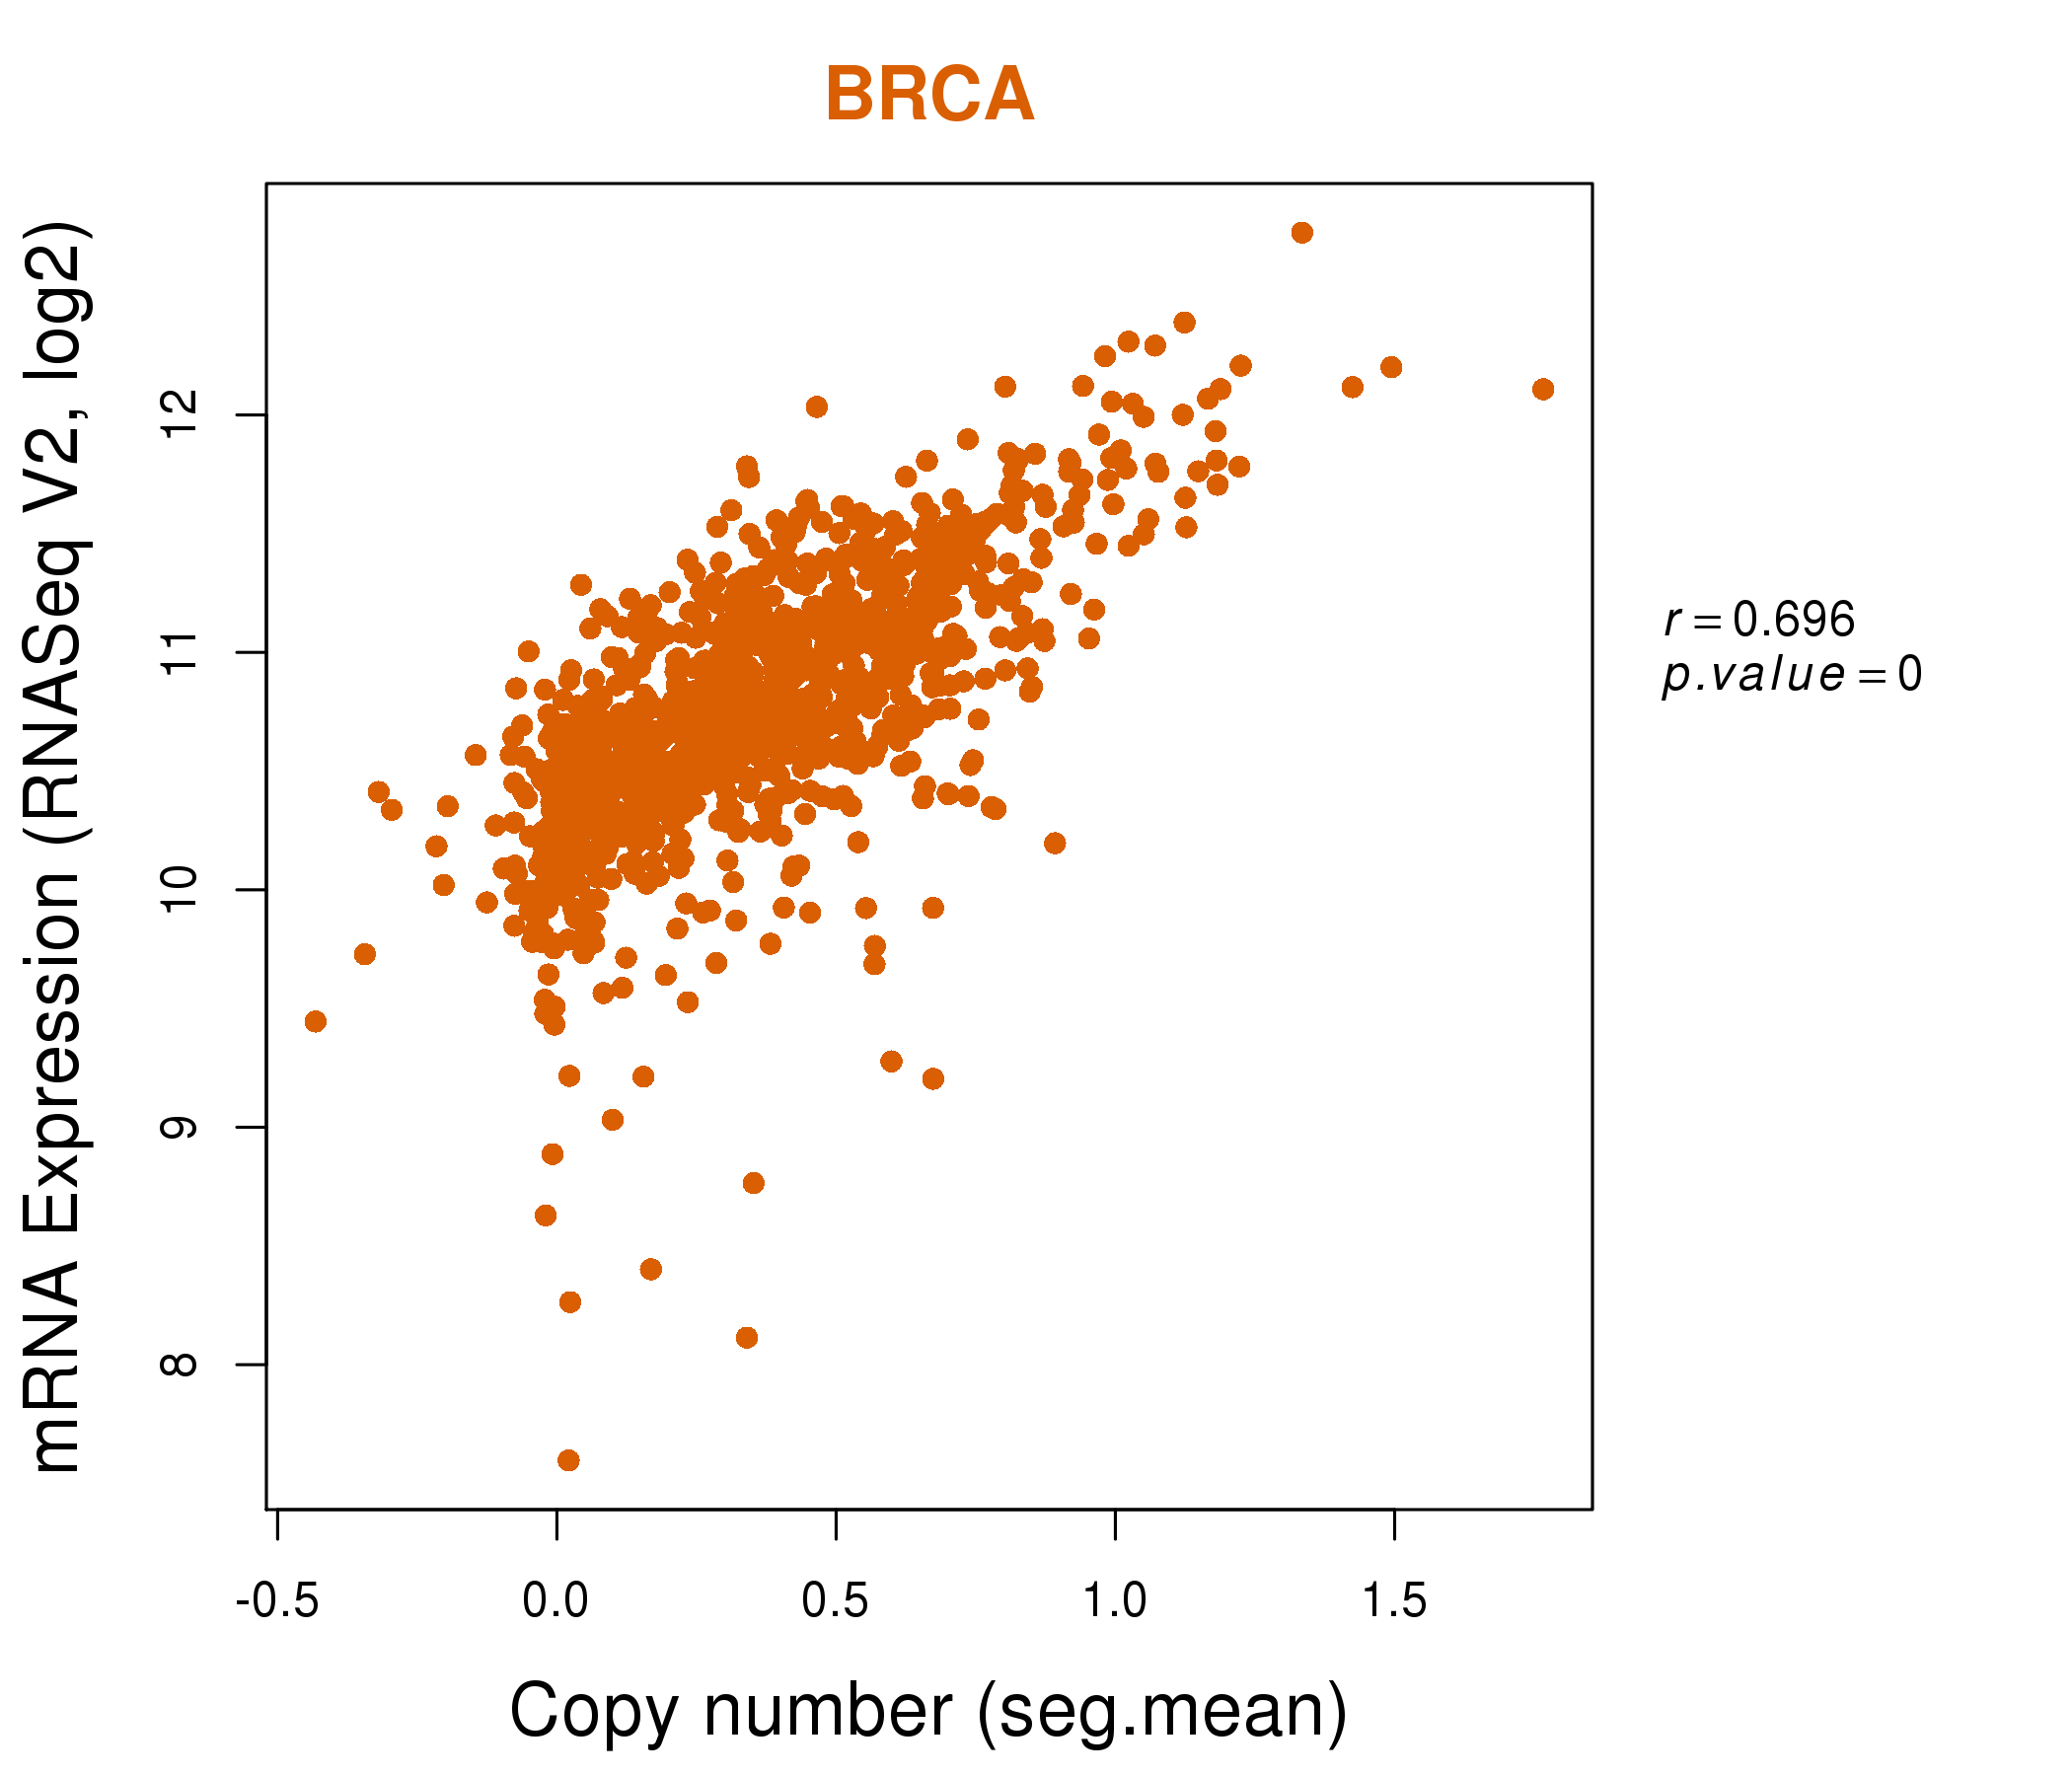
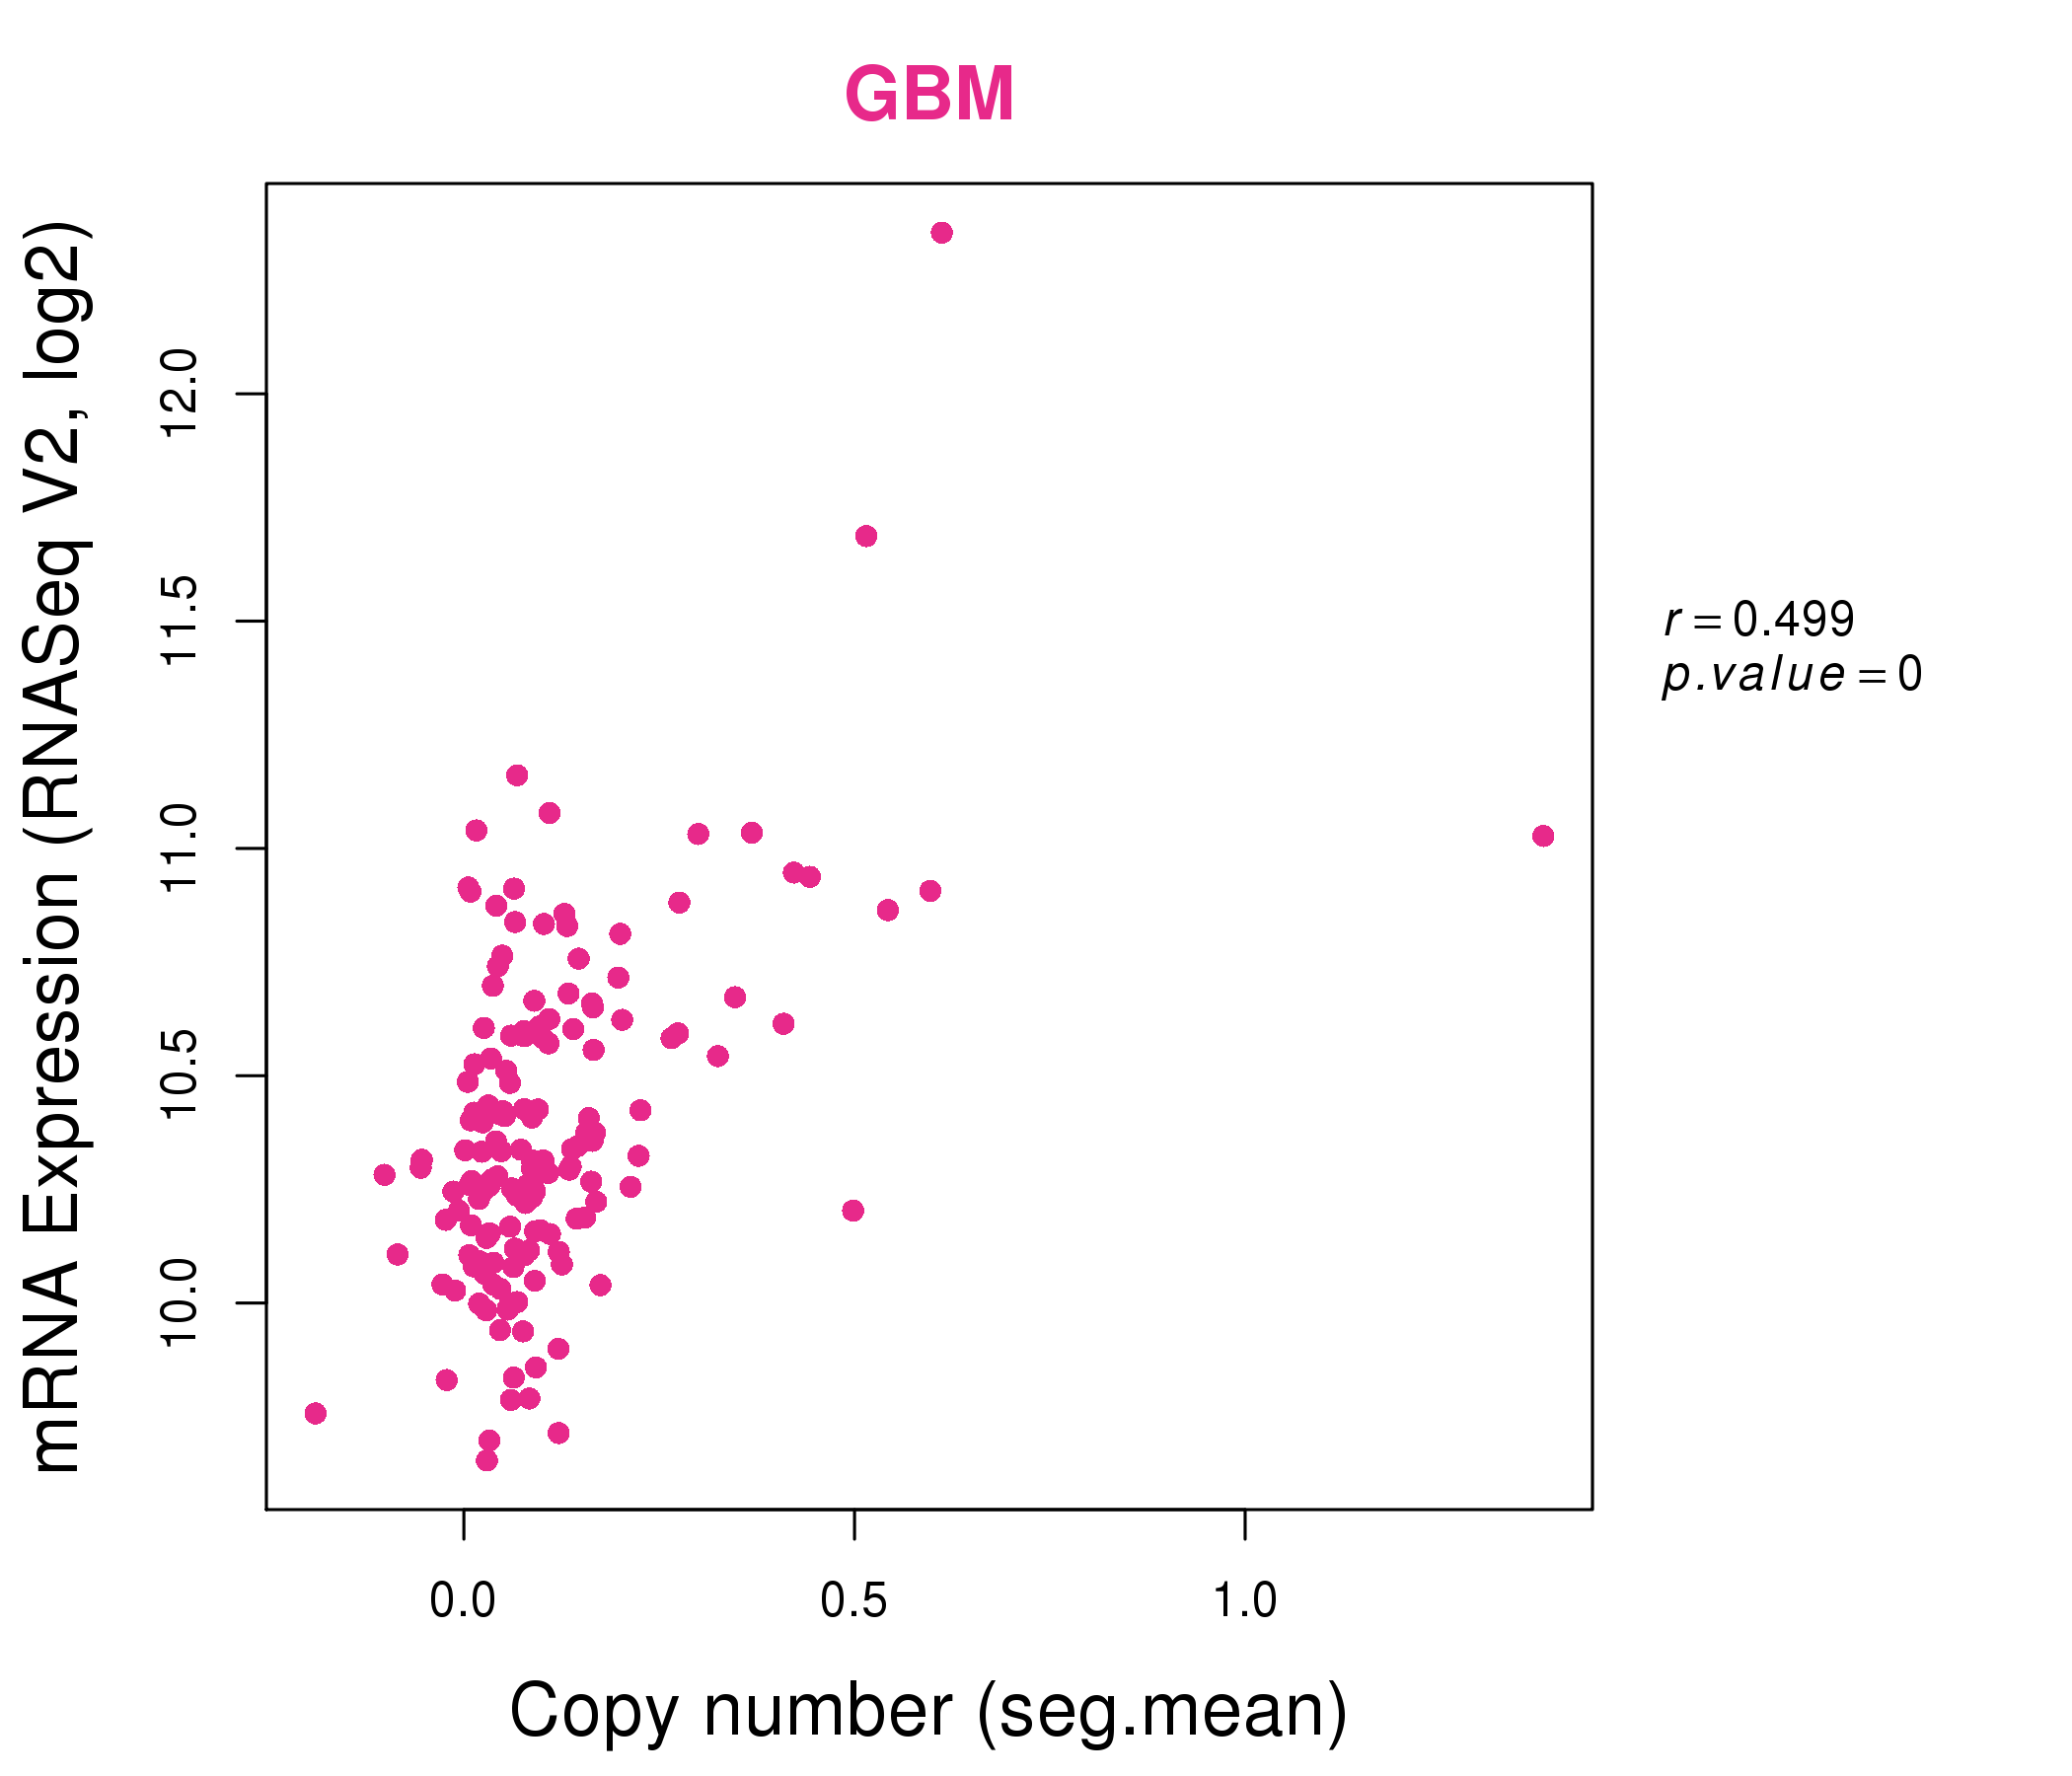
| * Normalized gene expression data of RNASeqV2 was extracted from TCGA using R package TCGA-Assembler. The URLs of all public data files on TCGA DCC data server were gathered at Jan-05-2015. Only eight cancer types have enough normal control samples for differential expression analysis. (t test, adjusted p<0.05 (using Benjamini-Hochberg FDR)) |
 |
| Top |
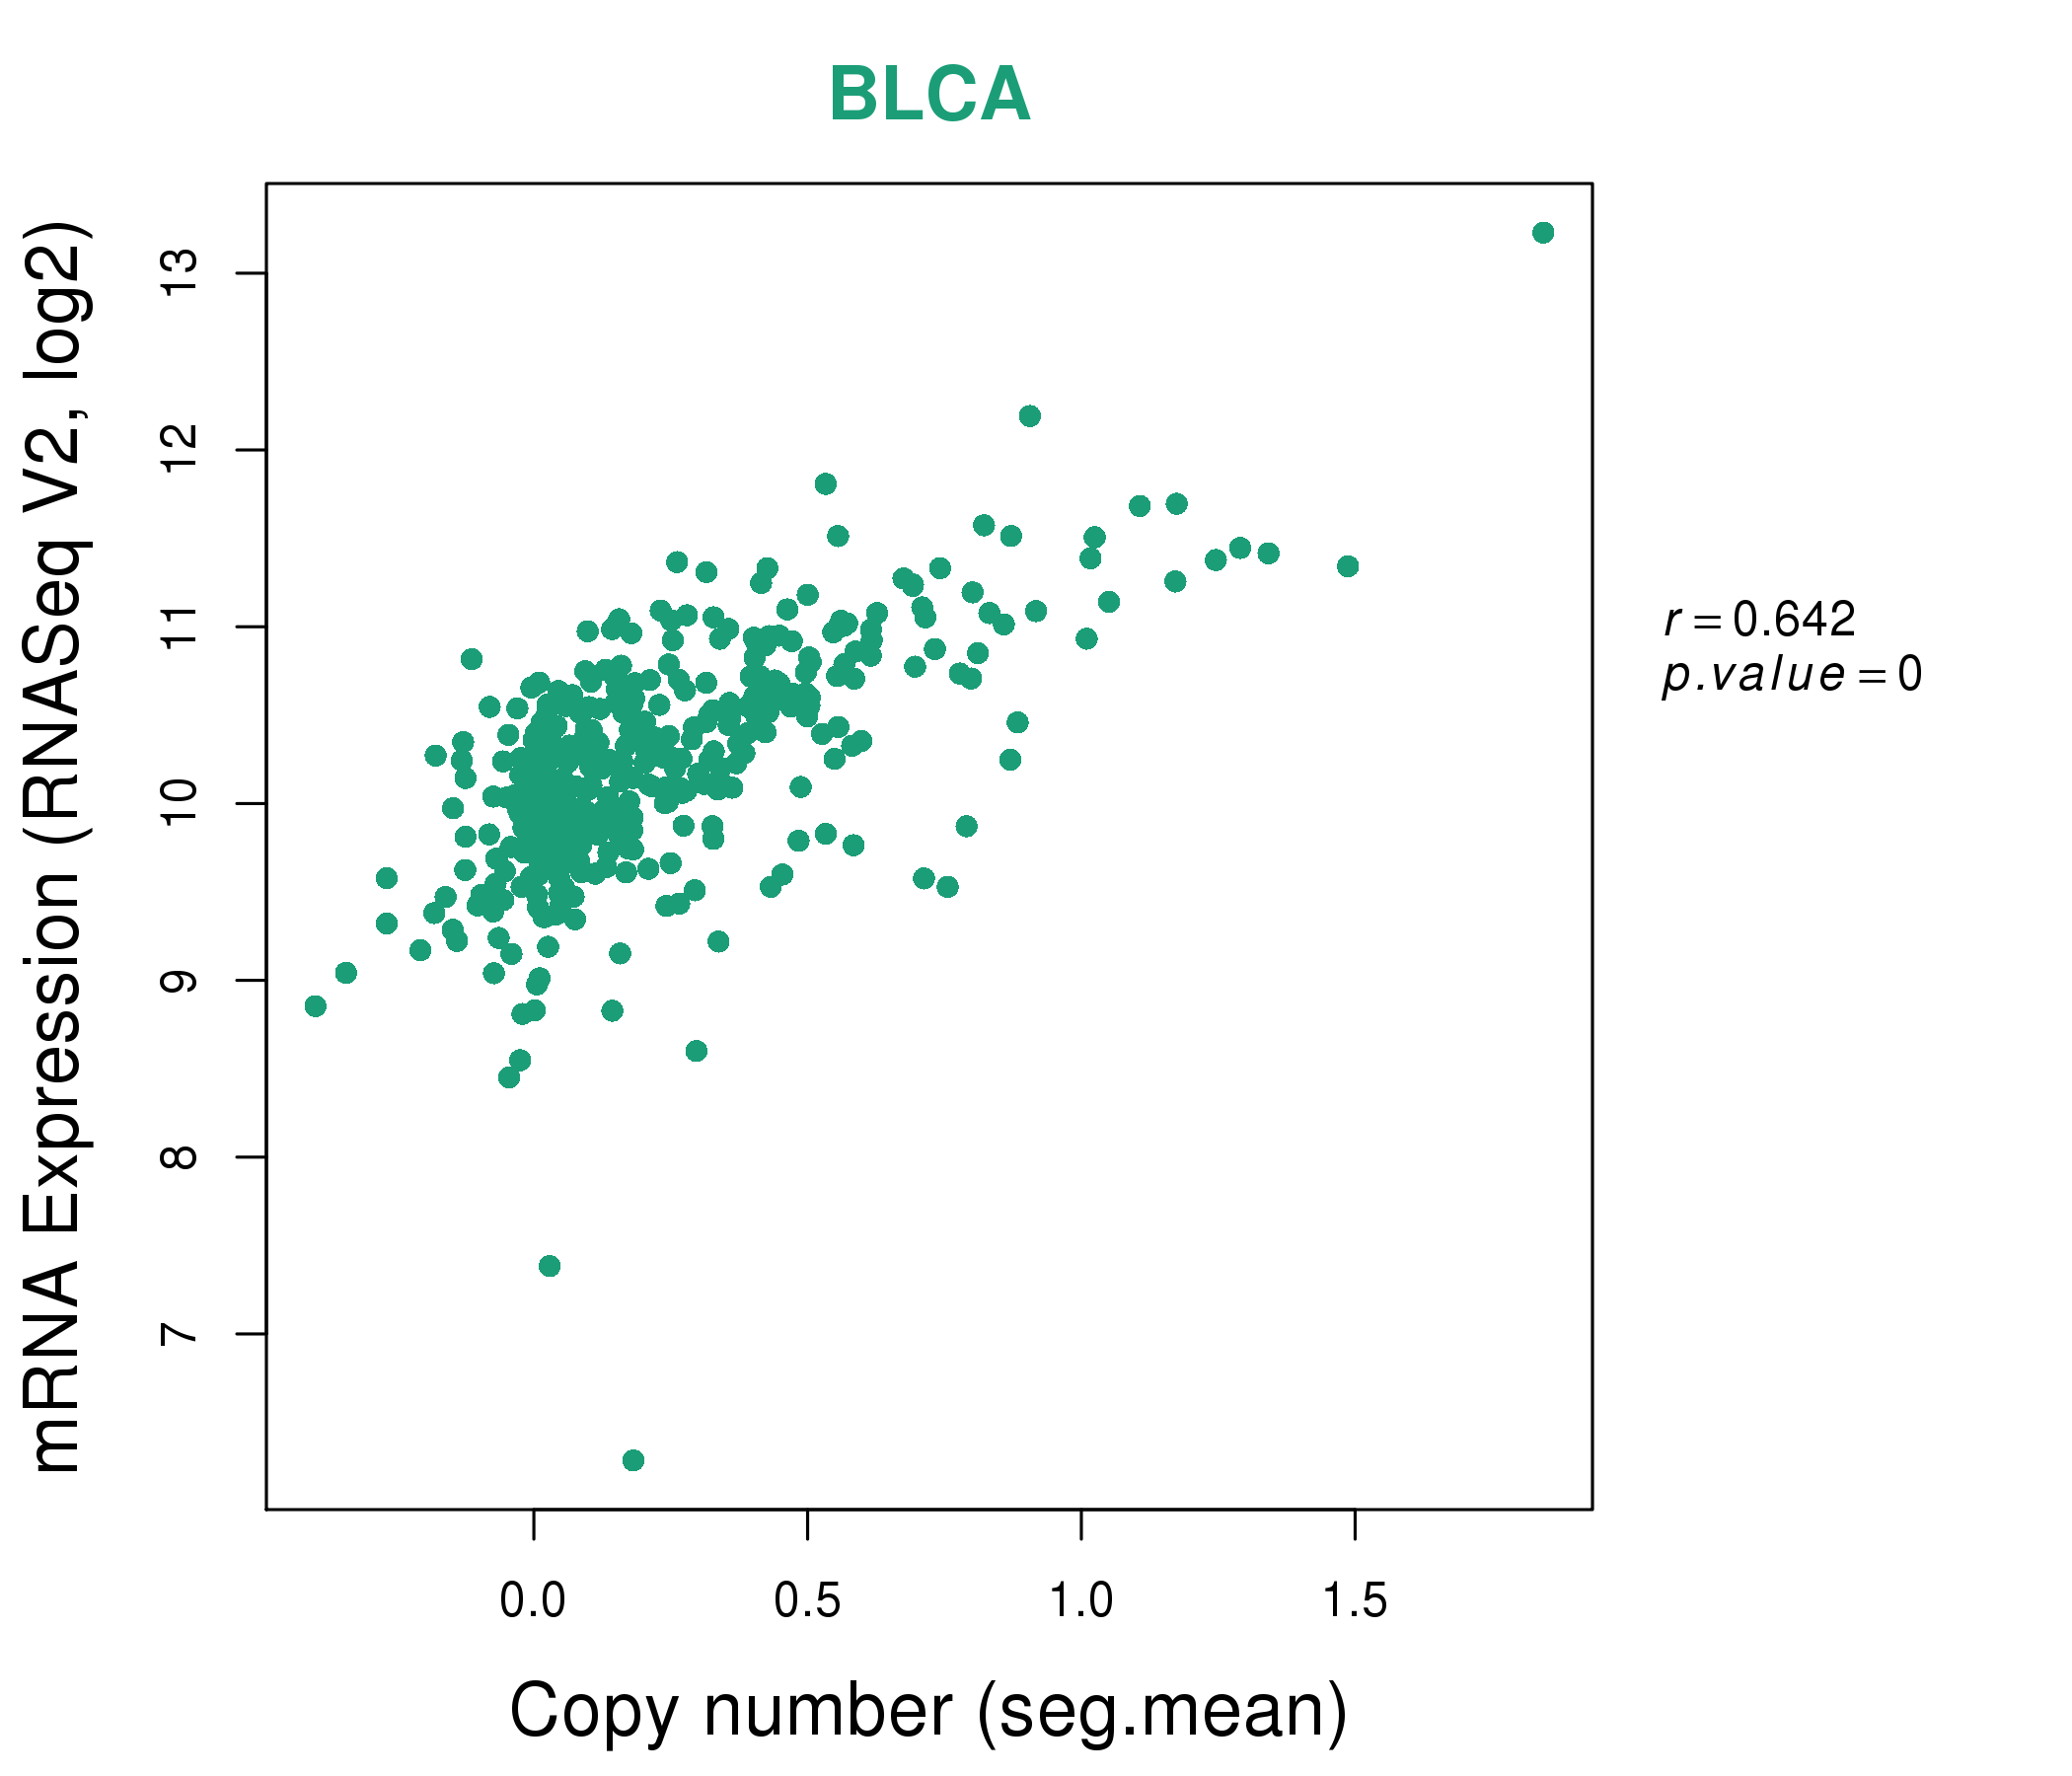
| * This plots show the correlation between CNV and gene expression. |
: Open all plots for all cancer types
 |
|
 |
|
| Top |
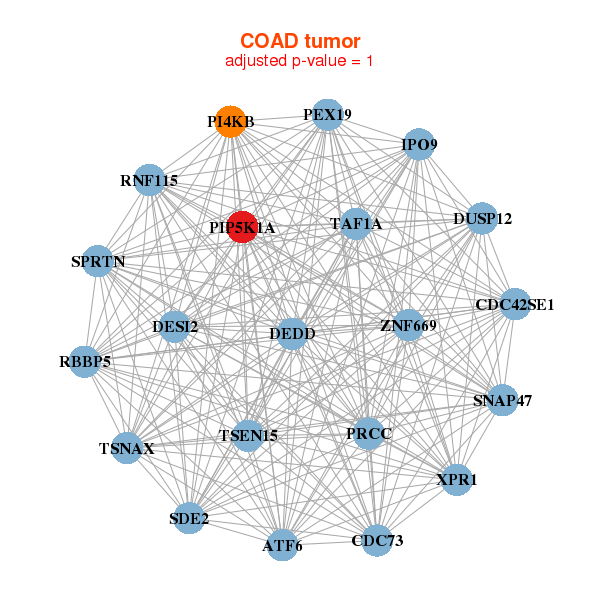
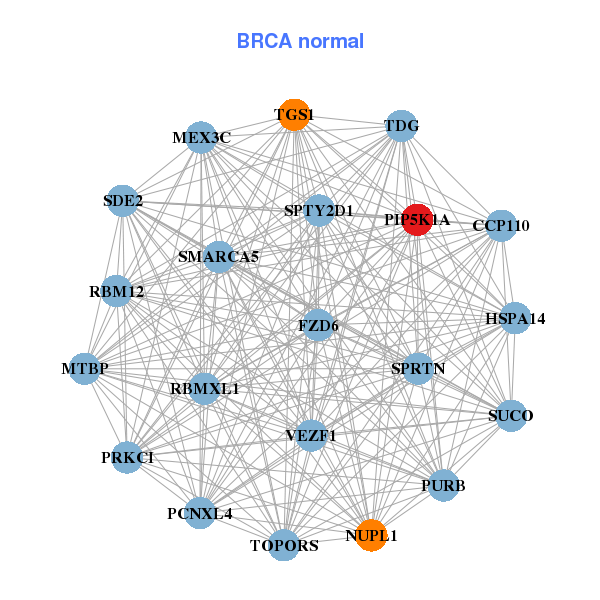
| Gene-Gene Network Information |
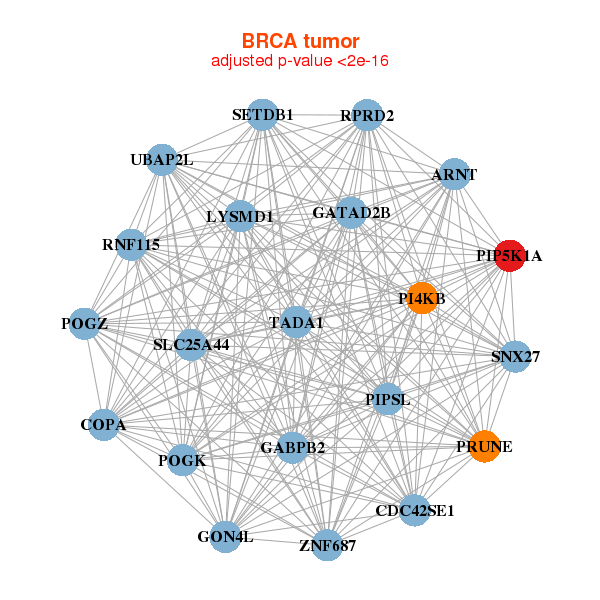
| * Co-Expression network figures were drawn using R package igraph. Only the top 20 genes with the highest correlations were shown. Red circle: input gene, orange circle: cell metabolism gene, sky circle: other gene |
: Open all plots for all cancer types
 |
| ||||
| ARNT,CDC42SE1,COPA,GABPB2,GATAD2B,GON4L,LYSMD1, PI4KB,PIP5K1A,PIPSL,POGK,POGZ,PRUNE,RNF115, RPRD2,SETDB1,SLC25A44,SNX27,TADA1,UBAP2L,ZNF687 | PCNXL4,SPRTN,SDE2,SUCO,CCP110,FZD6,HSPA14, MEX3C,MTBP,NUPL1,PIP5K1A,PRKCI,PURB,RBM12, RBMXL1,SMARCA5,SPTY2D1,TDG,TGS1,TOPORS,VEZF1 | ||||
 |
| ||||
| ATF6,SPRTN,SDE2,CDC42SE1,CDC73,DEDD,DUSP12, IPO9,PEX19,PI4KB,PIP5K1A,DESI2,PRCC,RBBP5, RNF115,SNAP47,TAF1A,TSEN15,TSNAX,XPR1,ZNF669 | AP1S3,ARL5B,VCPKMT,MIR22HG,C1orf27,SDE2,TYW5, CCNH,CCNL1,DDX5,IFRD1,LARP1B,PIP5K1A,PRPF39, RGS1,SLC19A2,TDG,TIPARP,TUBE1,UFM1,YRDC |
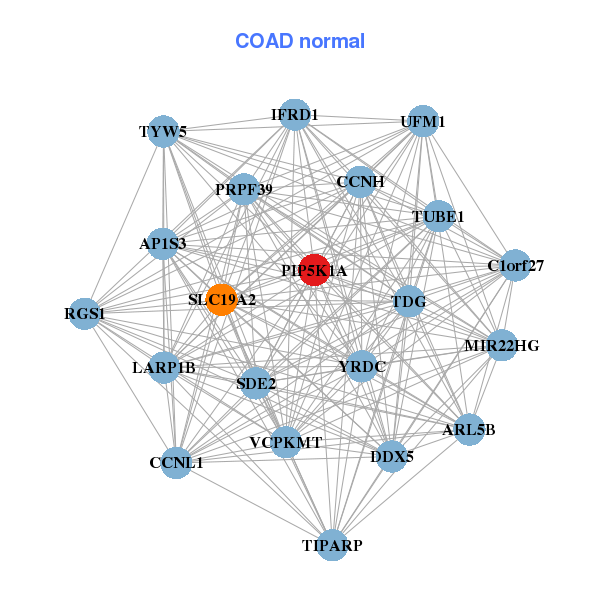
| * Co-Expression network figures were drawn using R package igraph. Only the top 20 genes with the highest correlations were shown. Red circle: input gene, orange circle: cell metabolism gene, sky circle: other gene |
: Open all plots for all cancer types
| Top |
: Open all interacting genes' information including KEGG pathway for all interacting genes from DAVID
| Top |
| Pharmacological Information for PIP5K1A |
| DB Category | DB Name | DB's ID and Url link |
| Chemistry | BindingDB | Q99755; -. |
| Chemistry | ChEMBL | CHEMBL5969; -. |
| Chemistry | GuidetoPHARMACOLOGY | 2164; -. |
| Organism-specific databases | PharmGKB | PA33327; -. |
| Organism-specific databases | CTD | 8394; -. |
| * Gene Centered Interaction Network. |
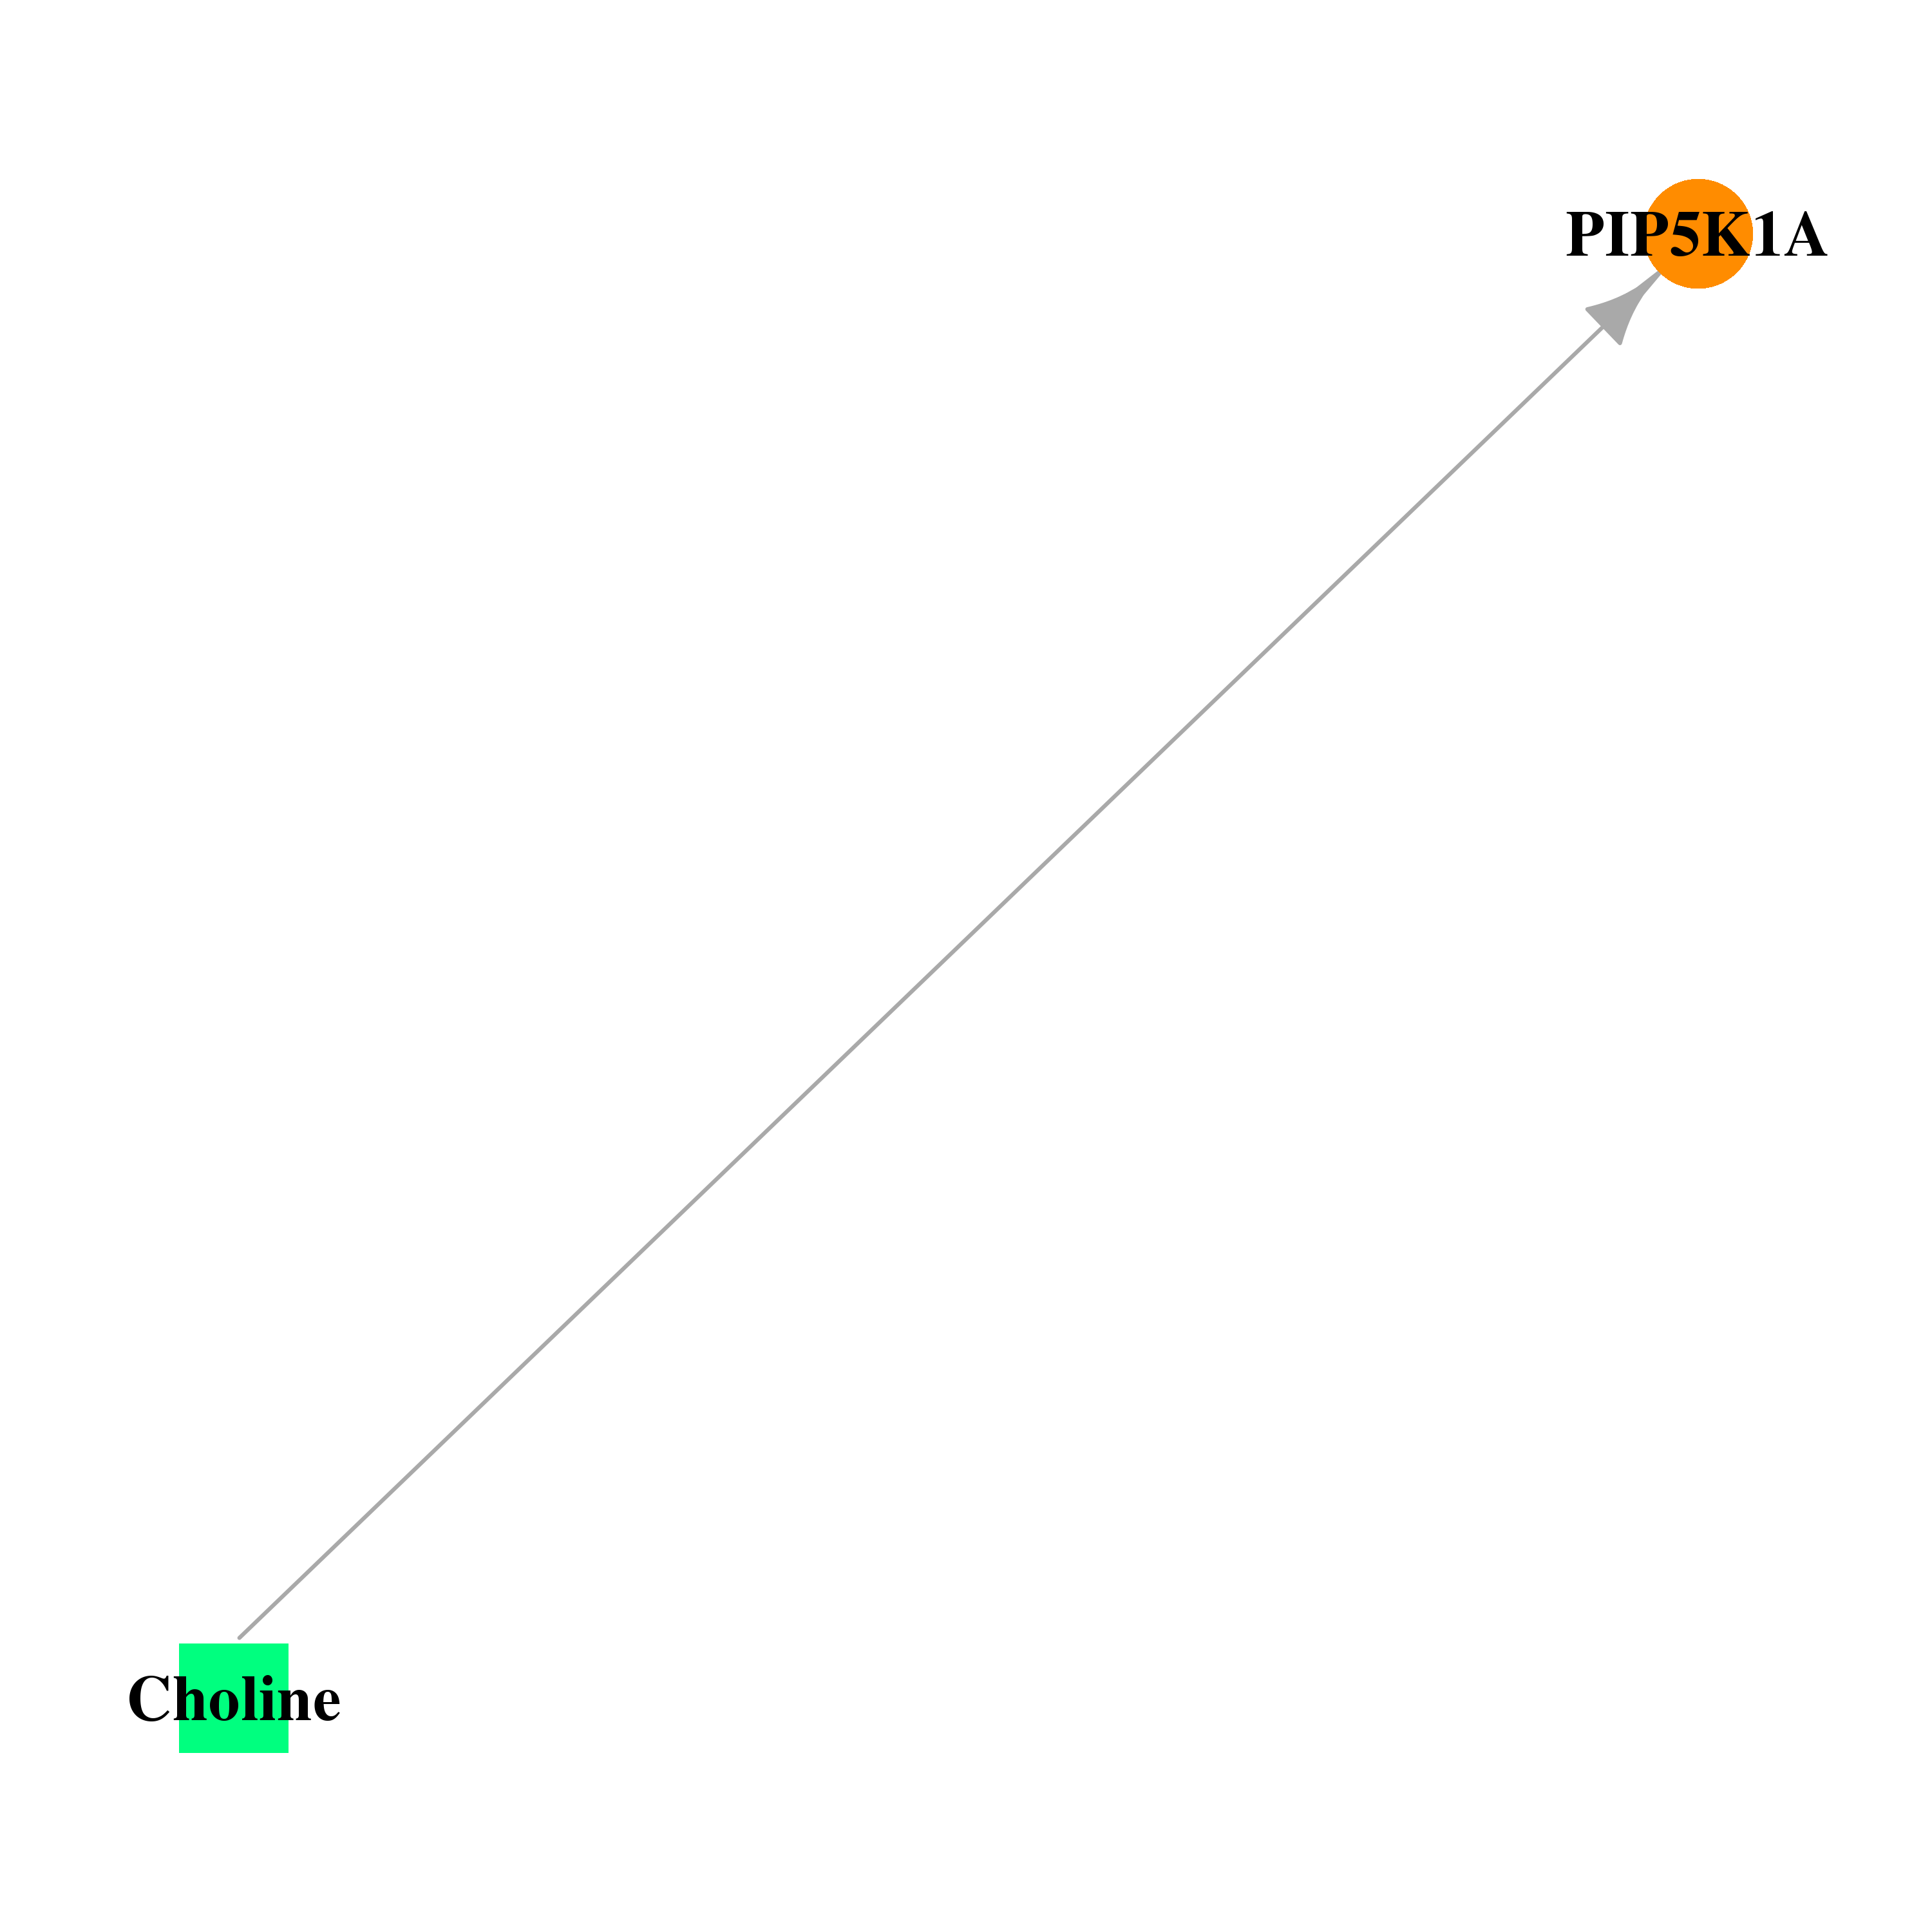 |
| * Drug Centered Interaction Network. |
| DrugBank ID | Target Name | Drug Groups | Generic Name | Drug Centered Network | Drug Structure |
| DB00122 | phosphatidylinositol-4-phosphate 5-kinase, type I, alpha | approved; nutraceutical | Choline | 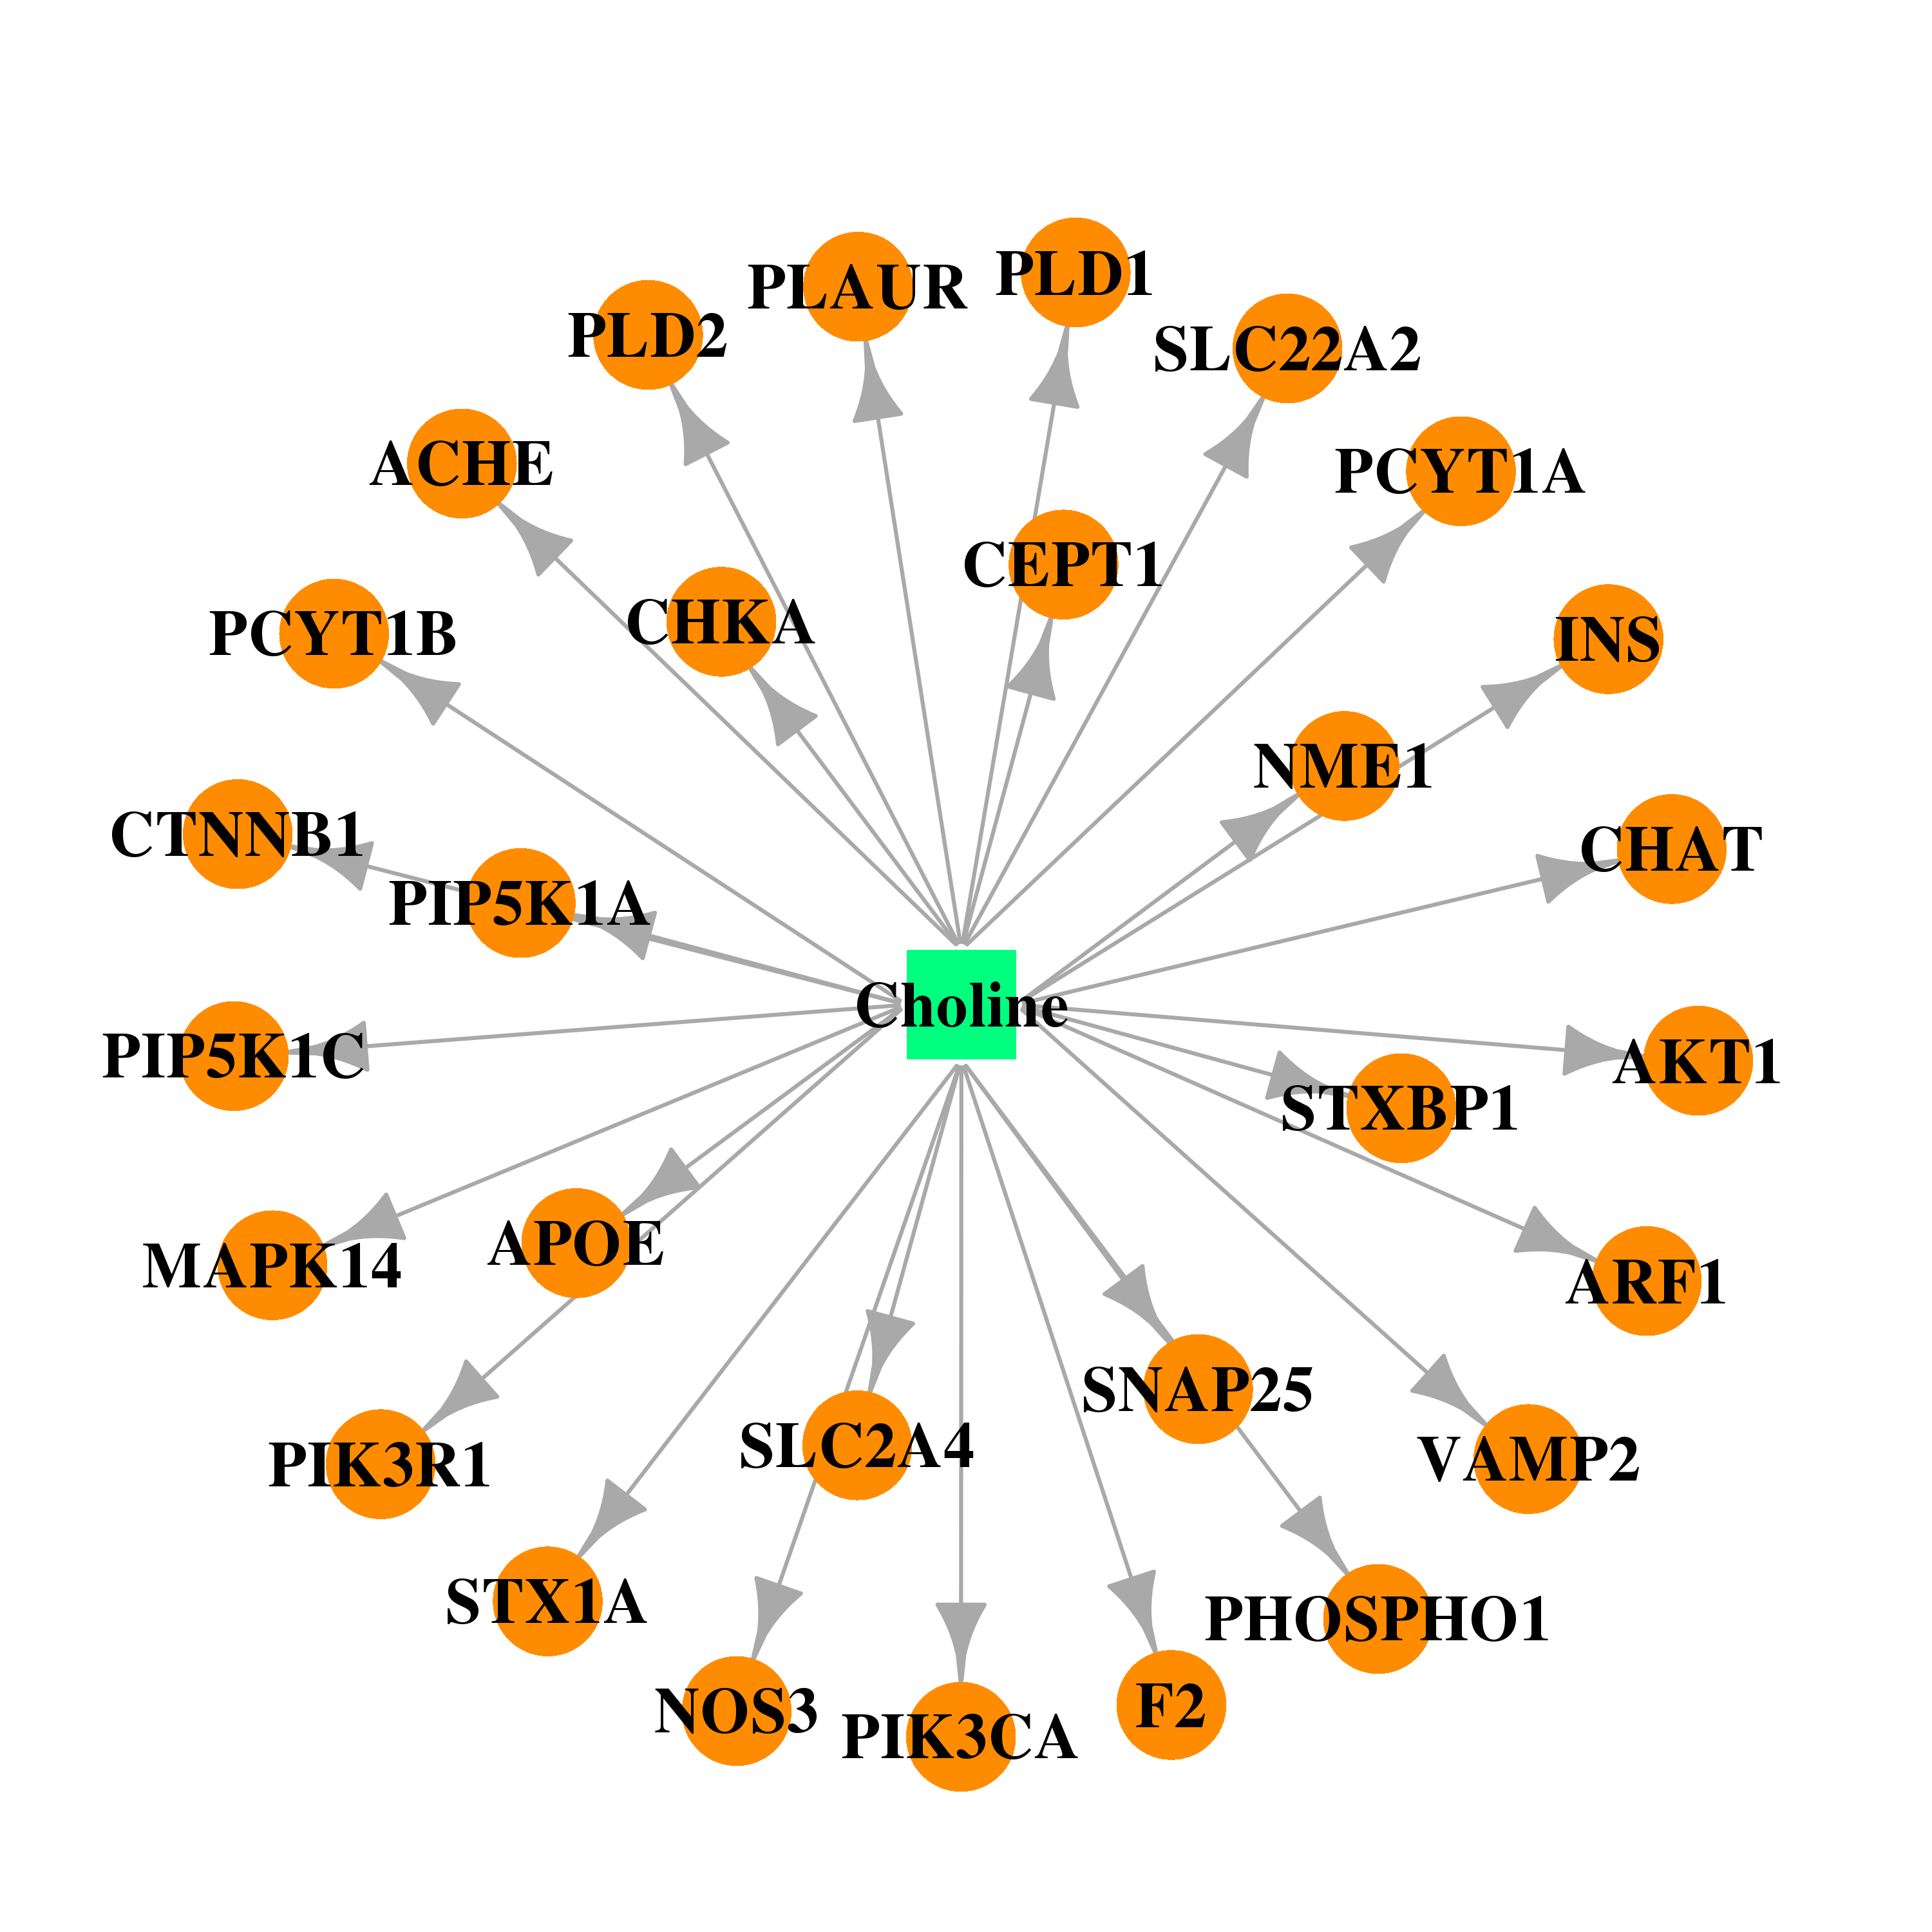 | 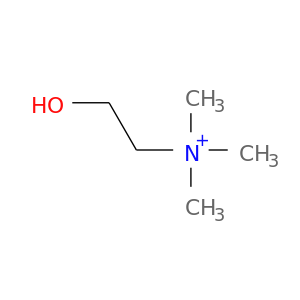 |
| Top |
| Cross referenced IDs for PIP5K1A |
| * We obtained these cross-references from Uniprot database. It covers 150 different DBs, 18 categories. http://www.uniprot.org/help/cross_references_section |
: Open all cross reference information
|
Copyright © 2016-Present - The Univsersity of Texas Health Science Center at Houston @ |