|
||||||||||||||||||||||||||||||||||||||||||||||||||||||||||||||||||||||||||||||||||||||||||||||||||||||||||||||||||||||||||||||||||||||||||||||||||||||||||||||||||||||||||||||||||||||||||||||||||||||||||||||||||||||||||||||||||||||||||||||||||||||||||||||||||||||||||||||||||||||||||||||||||||||||
| |
| Phenotypic Information (metabolism pathway, cancer, disease, phenome) |
| |
| |
| Gene-Gene Network Information: Co-Expression Network, Interacting Genes & KEGG |
| |
|


| Gene Summary for PIP5K1B |
| Basic gene info. | Gene symbol | PIP5K1B |
| Gene name | phosphatidylinositol-4-phosphate 5-kinase, type I, beta | |
| Synonyms | MSS4|STM7 | |
| Cytomap | UCSC genome browser: 9q13 | |
| Genomic location | chr9 :71320615-71624091 | |
| Type of gene | protein-coding | |
| RefGenes | NM_001031687.1, NM_001278253.1,NM_003558.3, | |
| Ensembl id | ENSG00000107242 | |
| Description | PIP5K1-betaPIP5KIbetaphosphatidylinositol 4-phosphate 5-kinase type I betaphosphatidylinositol 4-phosphate 5-kinase type-1 betaphosphatidylinositol-4-phosphate 5-kinase type-1 betaprotein STM-7ptdIns(4)P-5-kinase 1 betatype I phosphatidylinositol 4 | |
| Modification date | 20141207 | |
| dbXrefs | MIM : 602745 | |
| HGNC : HGNC | ||
| Ensembl : ENSG00000107242 | ||
| HPRD : 04121 | ||
| Vega : OTTHUMG00000019976 | ||
| Protein | UniProt: go to UniProt's Cross Reference DB Table | |
| Expression | CleanEX: HS_PIP5K1B | |
| BioGPS: 8395 | ||
| Gene Expression Atlas: ENSG00000107242 | ||
| The Human Protein Atlas: ENSG00000107242 | ||
| Pathway | NCI Pathway Interaction Database: PIP5K1B | |
| KEGG: PIP5K1B | ||
| REACTOME: PIP5K1B | ||
| ConsensusPathDB | ||
| Pathway Commons: PIP5K1B | ||
| Metabolism | MetaCyc: PIP5K1B | |
| HUMANCyc: PIP5K1B | ||
| Regulation | Ensembl's Regulation: ENSG00000107242 | |
| miRBase: chr9 :71,320,615-71,624,091 | ||
| TargetScan: NM_001031687 | ||
| cisRED: ENSG00000107242 | ||
| Context | iHOP: PIP5K1B | |
| cancer metabolism search in PubMed: PIP5K1B | ||
| UCL Cancer Institute: PIP5K1B | ||
| Assigned class in ccmGDB | C | |
| Top |
| Phenotypic Information for PIP5K1B(metabolism pathway, cancer, disease, phenome) |
| Cancer | CGAP: PIP5K1B |
| Familial Cancer Database: PIP5K1B | |
| * This gene is included in those cancer gene databases. |
|
|
|
|
|
|
| ||||||||||||||||||||||||||||||||||||||||||||||||||||||||||||||||||||||||||||||||||||||||||||||||||||||||||||||||||||||||||||||||||||||||||||||||||||||||||||||||||||||||||||||||||||||||||||||||||||||||||||||||||||||||||||||||||||||||||||||||||||||||||||||||||||||||||||||||||||||||||||||||||
Oncogene 1 | Significant driver gene in | |||||||||||||||||||||||||||||||||||||||||||||||||||||||||||||||||||||||||||||||||||||||||||||||||||||||||||||||||||||||||||||||||||||||||||||||||||||||||||||||||||||||||||||||||||||||||||||||||||||||||||||||||||||||||||||||||||||||||||||||||||||||||||||||||||||||||||||||||||||||||||||||||||||||
| cf) number; DB name 1 Oncogene; http://nar.oxfordjournals.org/content/35/suppl_1/D721.long, 2 Tumor Suppressor gene; https://bioinfo.uth.edu/TSGene/, 3 Cancer Gene Census; http://www.nature.com/nrc/journal/v4/n3/abs/nrc1299.html, 4 CancerGenes; http://nar.oxfordjournals.org/content/35/suppl_1/D721.long, 5 Network of Cancer Gene; http://ncg.kcl.ac.uk/index.php, 1Therapeutic Vulnerabilities in Cancer; http://cbio.mskcc.org/cancergenomics/statius/ |
| KEGG_INOSITOL_PHOSPHATE_METABOLISM KEGG_FC_GAMMA_R_MEDIATED_PHAGOCYTOSIS REACTOME_PHOSPHOLIPID_METABOLISM REACTOME_PI_METABOLISM REACTOME_METABOLISM_OF_LIPIDS_AND_LIPOPROTEINS | |
| Mutations for PIP5K1B |
| * Under tables are showing count per each tissue to give us broad intuition about tissue specific mutation patterns.You can go to the detailed page for each mutation database's web site. |
| - Statistics for Tissue and Mutation type | Top |
 |
| - For Inter-chromosomal Variations |
| * Inter-chromosomal variantions includes 'interchromosomal amplicon to amplicon', 'interchromosomal amplicon to non-amplified dna', 'interchromosomal insertion', 'Interchromosomal unknown type'. |
 |
| - For Intra-chromosomal Variations |
| * Intra-chromosomal variantions includes 'intrachromosomal amplicon to amplicon', 'intrachromosomal amplicon to non-amplified dna', 'intrachromosomal deletion', 'intrachromosomal fold-back inversion', 'intrachromosomal inversion', 'intrachromosomal tandem duplication', 'Intrachromosomal unknown type', 'intrachromosomal with inverted orientation', 'intrachromosomal with non-inverted orientation'. |
 |
| Sample | Symbol_a | Chr_a | Start_a | End_a | Symbol_b | Chr_b | Start_b | End_b |
| breast | PIP5K1B | chr9 | 71393266 | 71393266 | PIP5K1B | chr9 | 71406339 | 71406339 |
| ovary | PIP5K1B | chr9 | 71386547 | 71386567 | COL11A1 | chr1 | 103567281 | 103567301 |
| cf) Tissue number; Tissue name (1;Breast, 2;Central_nervous_system, 3;Haematopoietic_and_lymphoid_tissue, 4;Large_intestine, 5;Liver, 6;Lung, 7;Ovary, 8;Pancreas, 9;Prostate, 10;Skin, 11;Soft_tissue, 12;Upper_aerodigestive_tract) |
| * From mRNA Sanger sequences, Chitars2.0 arranged chimeric transcripts. This table shows PIP5K1B related fusion information. |
| ID | Head Gene | Tail Gene | Accession | Gene_a | qStart_a | qEnd_a | Chromosome_a | tStart_a | tEnd_a | Gene_a | qStart_a | qEnd_a | Chromosome_a | tStart_a | tEnd_a |
| BF358668 | PIP5K1B | 102 | 129 | 9 | 71582212 | 71582242 | ABHD15 | 114 | 377 | 17 | 27889217 | 27889480 | |
| X92493 | CNKSR2 | 7 | 116 | X | 21672556 | 21672665 | PIP5K1B | 115 | 2764 | 9 | 71320616 | 71624091 | |
| Top |
| Mutation type/ Tissue ID | brca | cns | cerv | endome | haematopo | kidn | Lintest | liver | lung | ns | ovary | pancre | prost | skin | stoma | thyro | urina | |||
| Total # sample | 1 | 1 | 2 | 16 | 3 | 1 | ||||||||||||||
| GAIN (# sample) | 1 | 1 | 1 | |||||||||||||||||
| LOSS (# sample) | 1 | 1 | 1 | 15 | 2 | 1 |
| cf) Tissue ID; Tissue type (1; Breast, 2; Central_nervous_system, 3; Cervix, 4; Endometrium, 5; Haematopoietic_and_lymphoid_tissue, 6; Kidney, 7; Large_intestine, 8; Liver, 9; Lung, 10; NS, 11; Ovary, 12; Pancreas, 13; Prostate, 14; Skin, 15; Stomach, 16; Thyroid, 17; Urinary_tract) |
| Top |
|
 |
| Top |
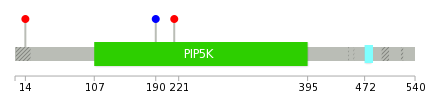
| Stat. for Non-Synonymous SNVs (# total SNVs=2) | (# total SNVs=1) |
 |  |
(# total SNVs=0) | (# total SNVs=0) |
| Top |
| * When you move the cursor on each content, you can see more deailed mutation information on the Tooltip. Those are primary_site,primary_histology,mutation(aa),pubmedID. |
| GRCh37 position | Mutation(aa) | Unique sampleID count |
| chr9:71437571-71437571 | p.K14R | 1 |
| chr9:71509318-71509318 | p.G179* | 1 |
| chr9:71509353-71509353 | p.N190N | 1 |
| chr9:71509426-71509426 | p.R215C | 1 |
| Top |
|
 |
| Point Mutation/ Tissue ID | 1 | 2 | 3 | 4 | 5 | 6 | 7 | 8 | 9 | 10 | 11 | 12 | 13 | 14 | 15 | 16 | 17 | 18 | 19 | 20 |
| # sample | 2 | 1 | 5 | 3 | 7 | 6 | 4 | 14 | 1 | 7 | ||||||||||
| # mutation | 2 | 1 | 4 | 3 | 7 | 9 | 4 | 20 | 1 | 8 | ||||||||||
| nonsynonymous SNV | 1 | 3 | 2 | 4 | 8 | 2 | 16 | 1 | 5 | |||||||||||
| synonymous SNV | 1 | 1 | 1 | 1 | 3 | 1 | 2 | 4 | 3 |
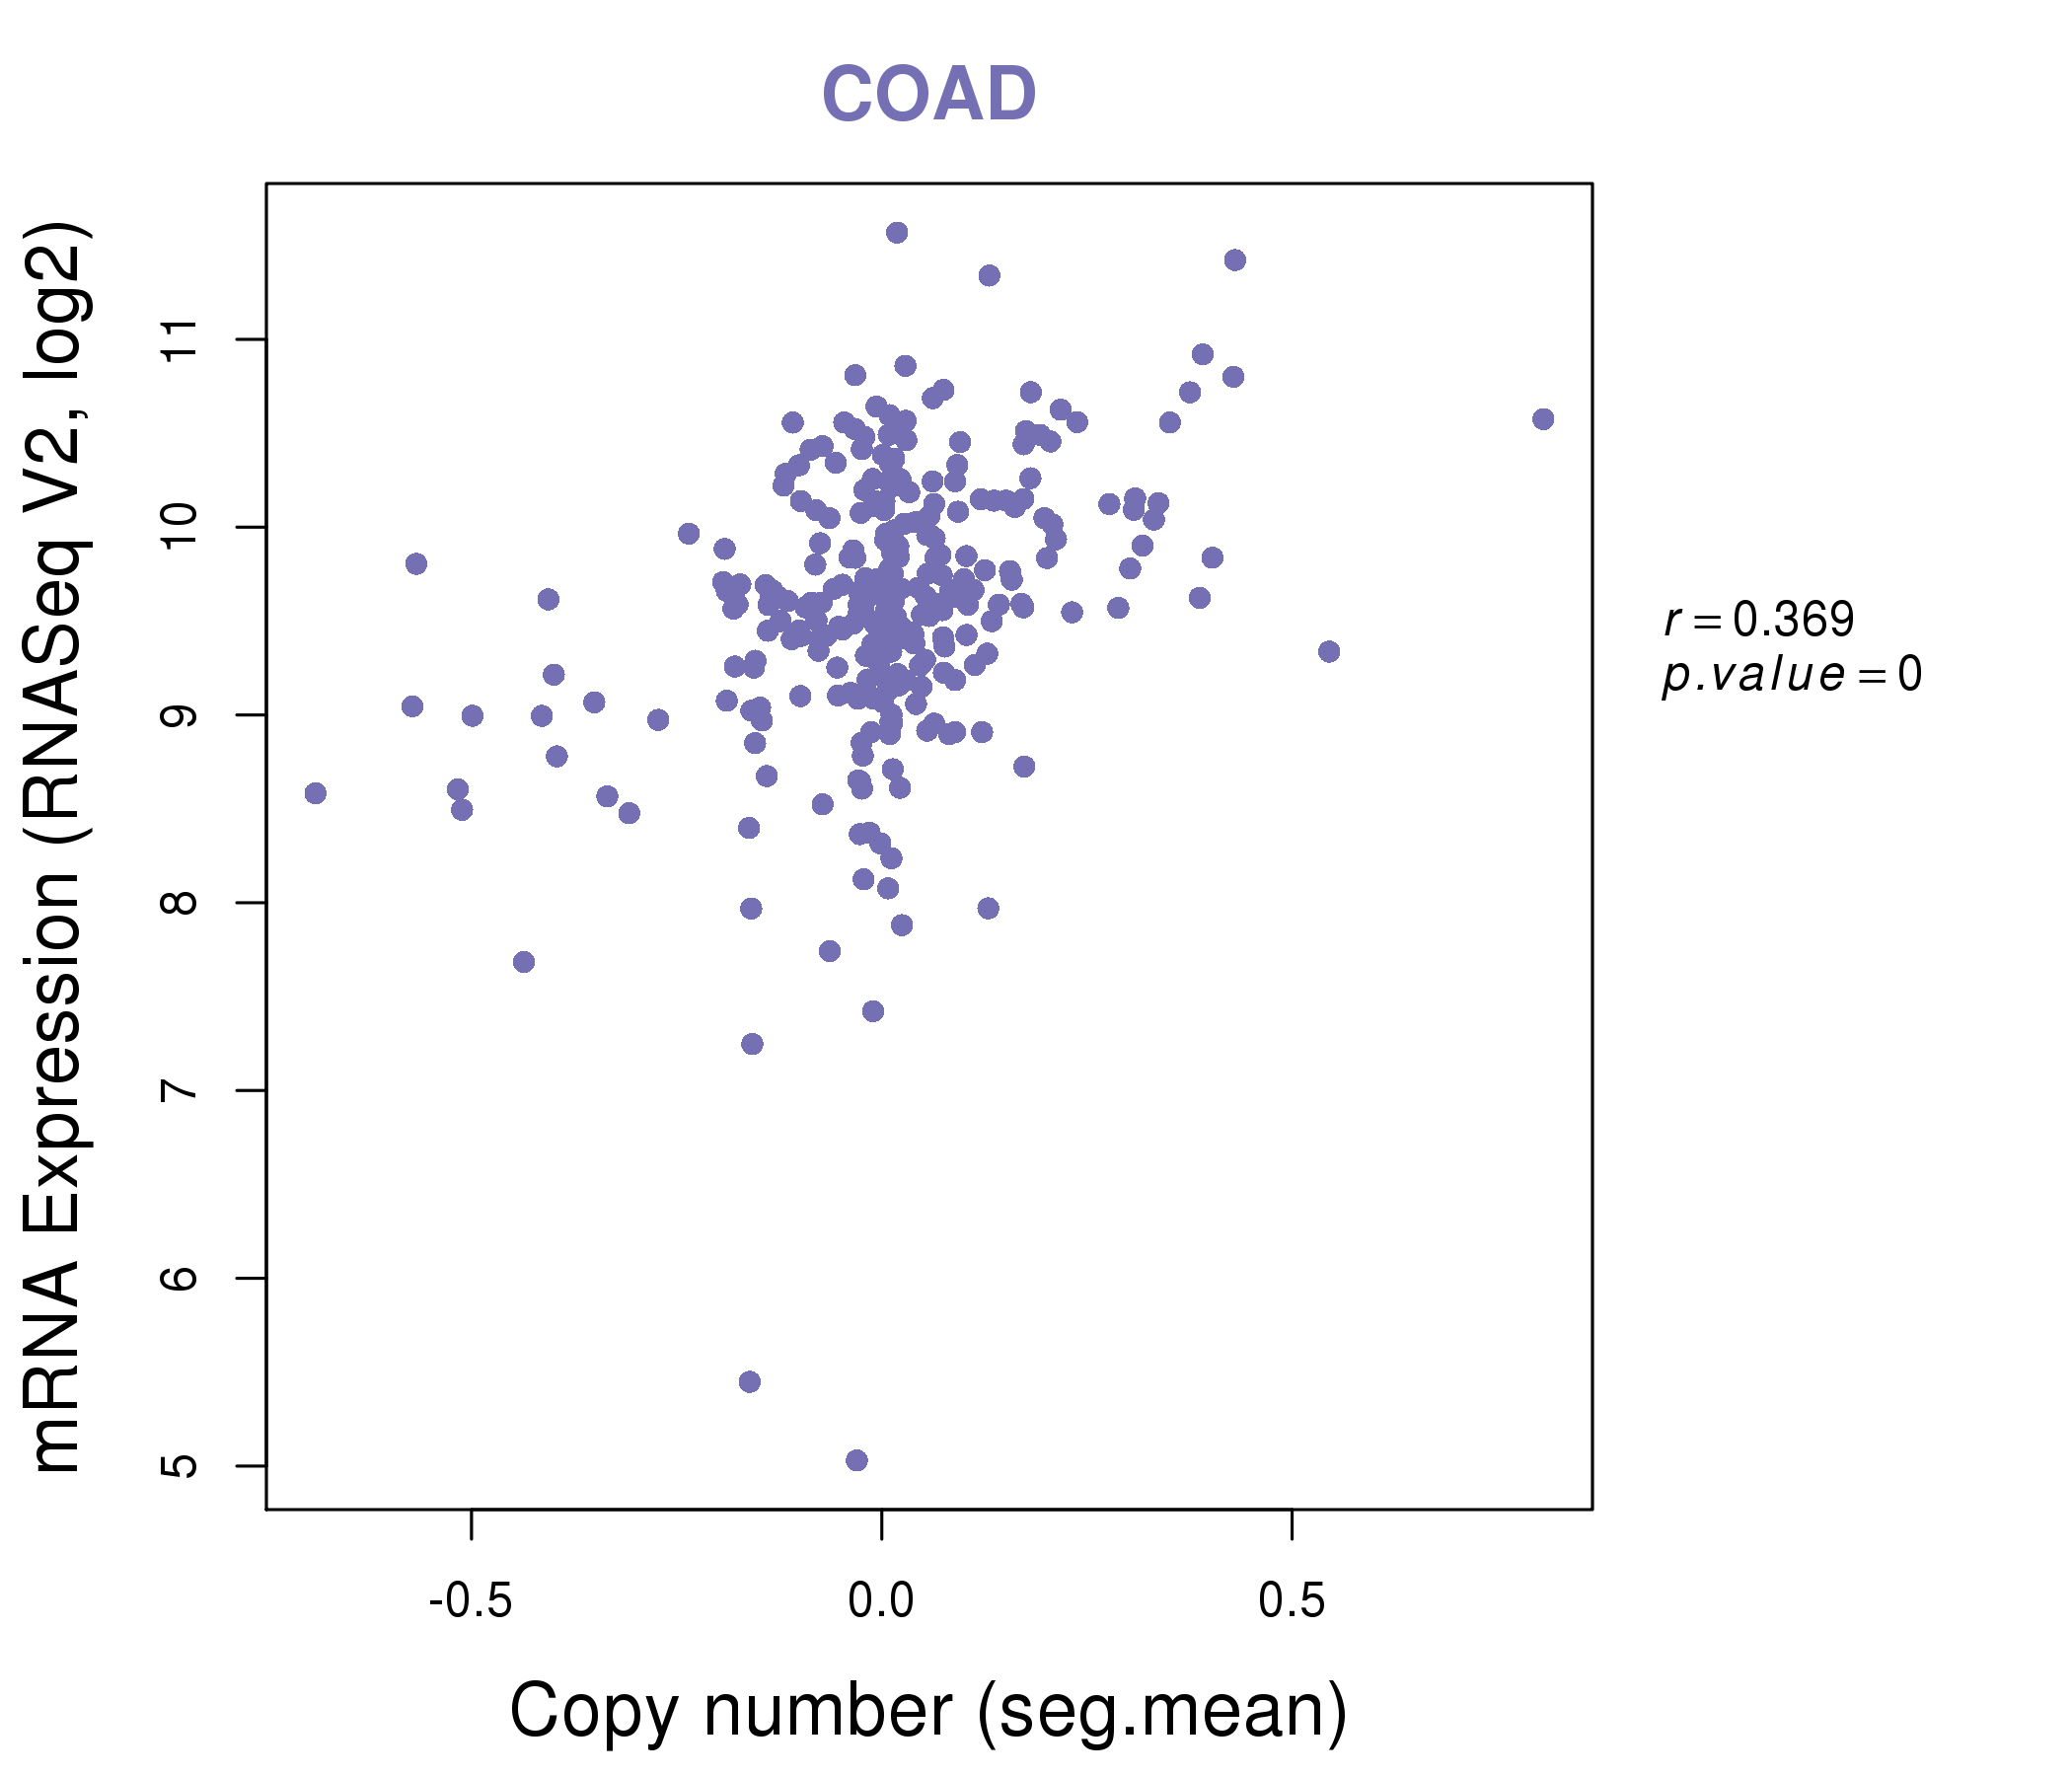
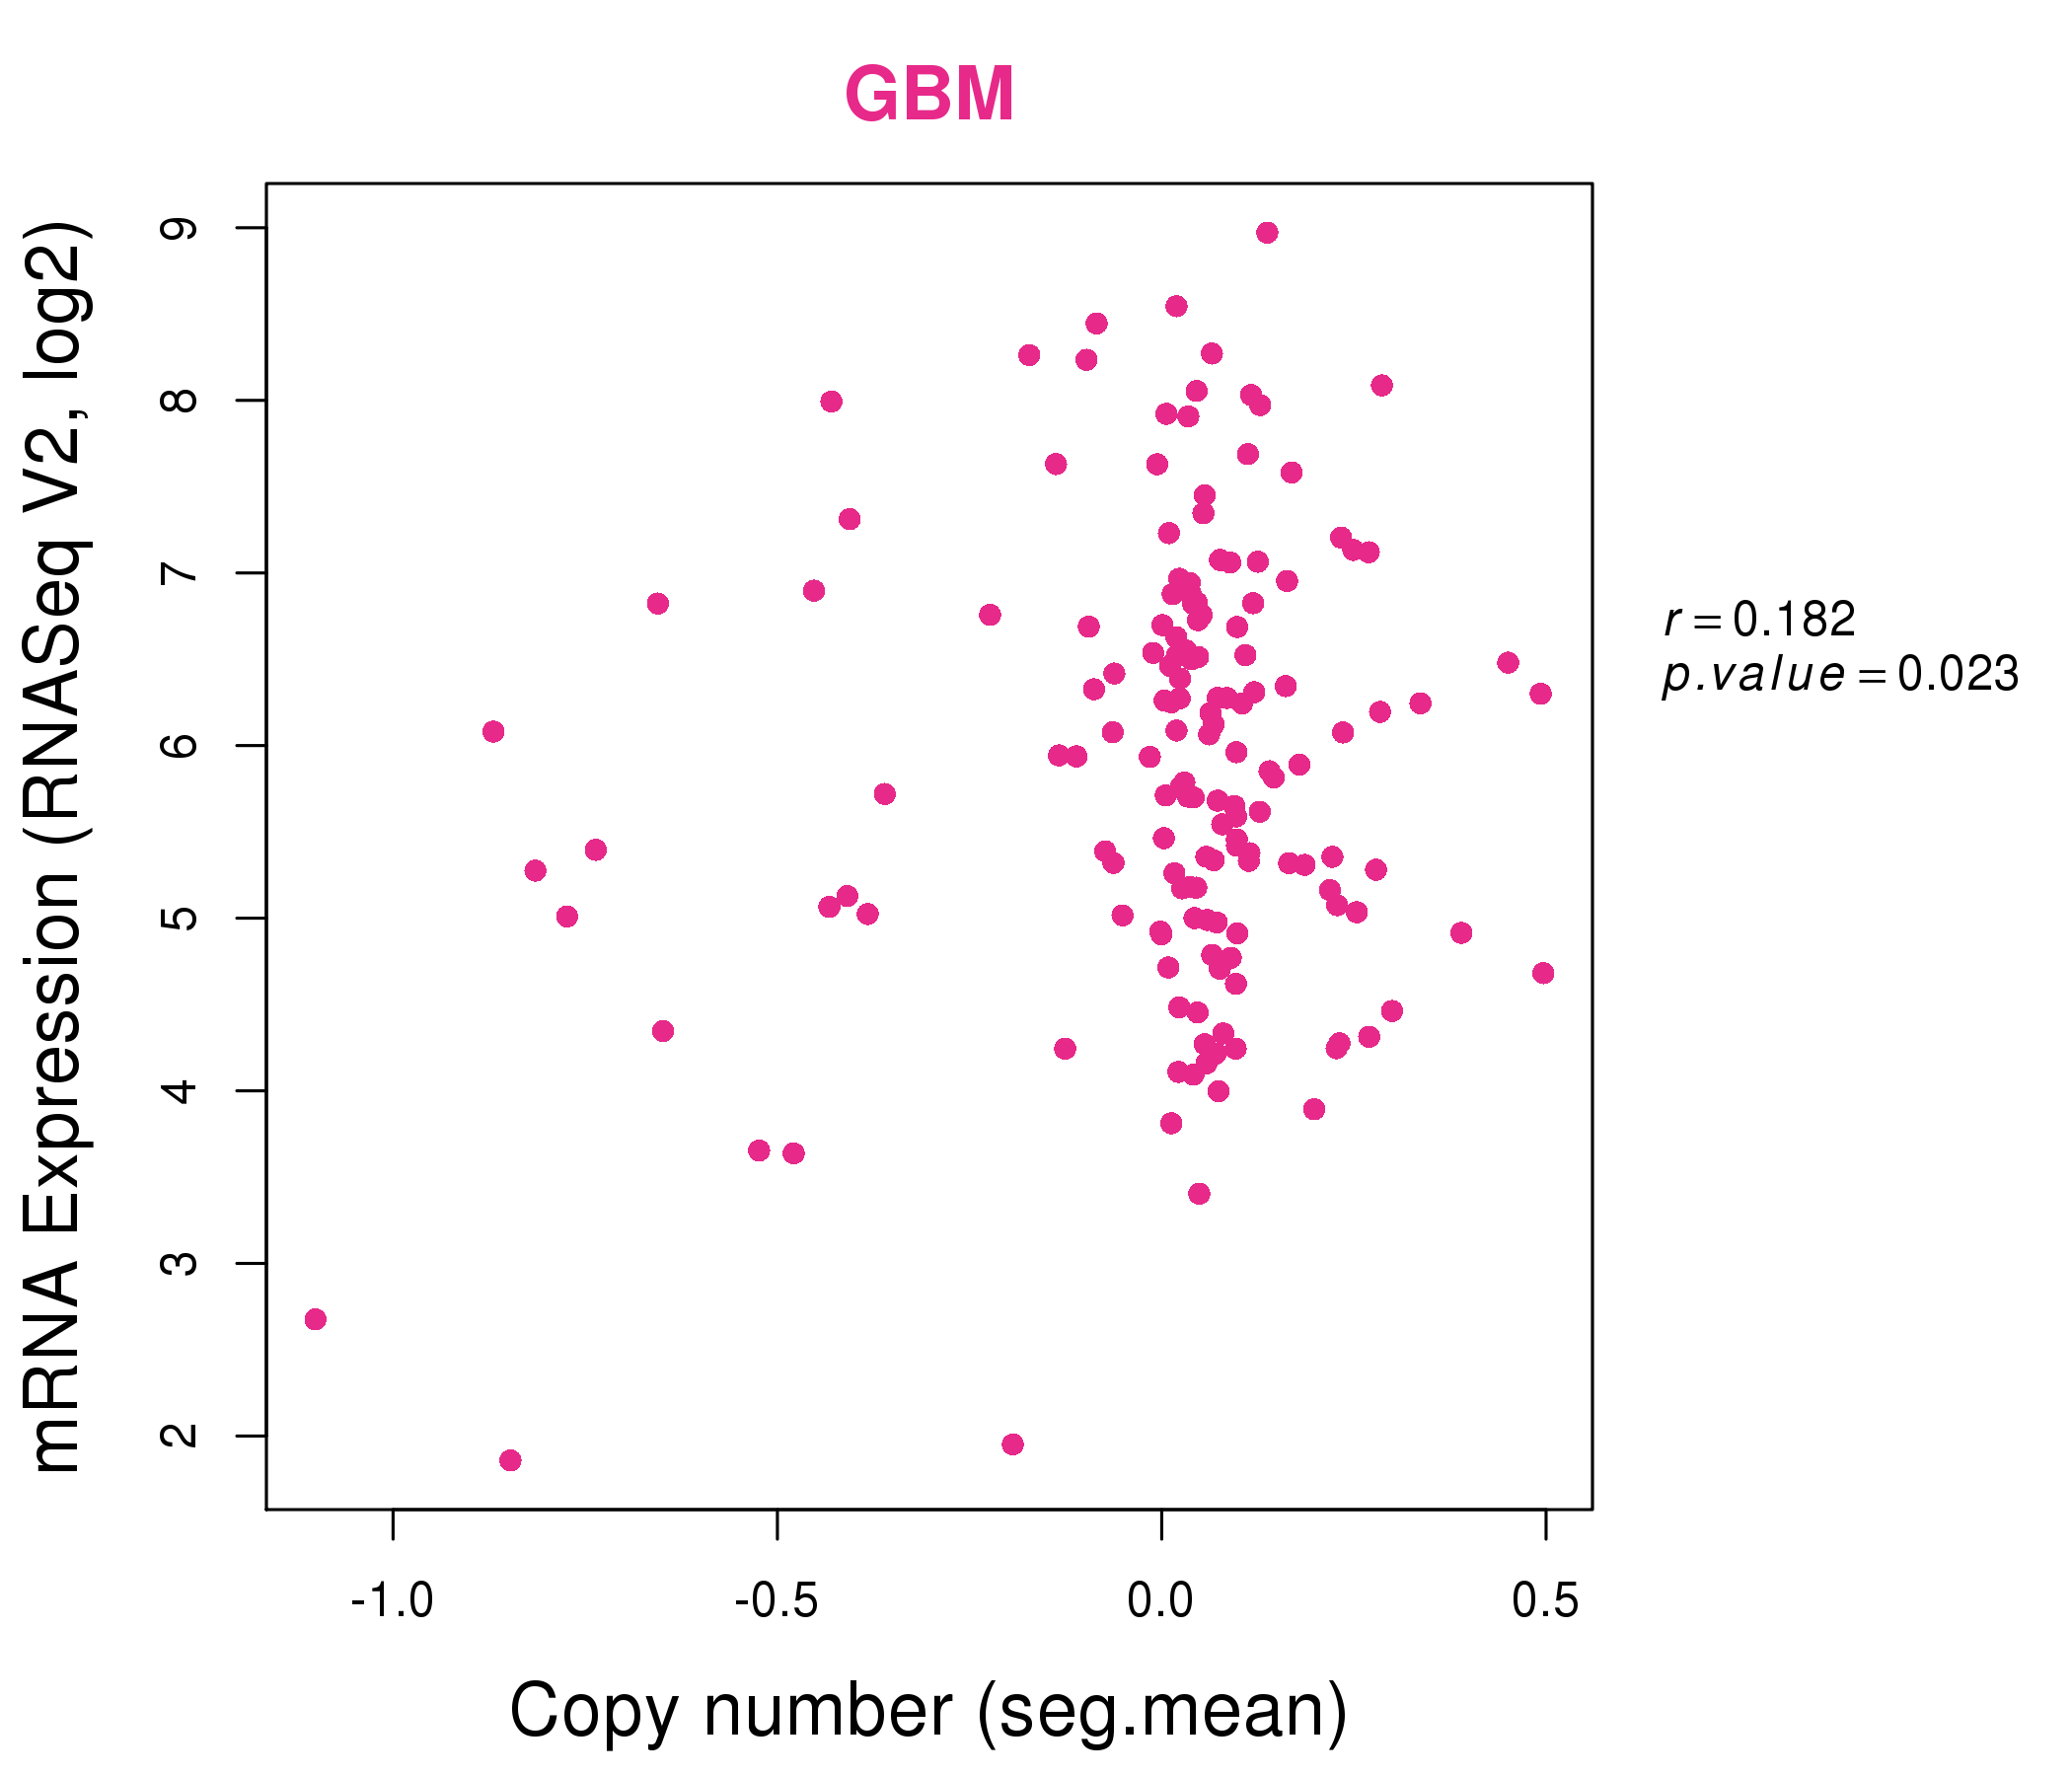
| cf) Tissue ID; Tissue type (1; BLCA[Bladder Urothelial Carcinoma], 2; BRCA[Breast invasive carcinoma], 3; CESC[Cervical squamous cell carcinoma and endocervical adenocarcinoma], 4; COAD[Colon adenocarcinoma], 5; GBM[Glioblastoma multiforme], 6; Glioma Low Grade, 7; HNSC[Head and Neck squamous cell carcinoma], 8; KICH[Kidney Chromophobe], 9; KIRC[Kidney renal clear cell carcinoma], 10; KIRP[Kidney renal papillary cell carcinoma], 11; LAML[Acute Myeloid Leukemia], 12; LUAD[Lung adenocarcinoma], 13; LUSC[Lung squamous cell carcinoma], 14; OV[Ovarian serous cystadenocarcinoma ], 15; PAAD[Pancreatic adenocarcinoma], 16; PRAD[Prostate adenocarcinoma], 17; SKCM[Skin Cutaneous Melanoma], 18:STAD[Stomach adenocarcinoma], 19:THCA[Thyroid carcinoma], 20:UCEC[Uterine Corpus Endometrial Carcinoma]) |
| Top |
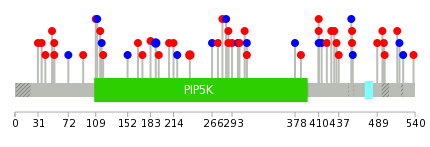
| * We represented just top 10 SNVs. When you move the cursor on each content, you can see more deailed mutation information on the Tooltip. Those are primary_site, primary_histology, mutation(aa), pubmedID. |
| Genomic Position | Mutation(aa) | Unique sampleID count |
| chr9:71509489 | p.N190N,PIP5K1B | 2 |
| chr9:71478840 | p.R410L,PIP5K1B | 2 |
| chr9:71549833 | p.L53I,PIP5K1B | 2 |
| chr9:71509353 | p.E236K,PIP5K1B | 2 |
| chr9:71491667 | p.D434N,PIP5K1B | 1 |
| chr9:71549846 | p.L117L,PIP5K1B | 1 |
| chr9:71555691 | p.P288S,PIP5K1B | 1 |
| chr9:71509364 | p.R437W,PIP5K1B | 1 |
| chr9:71532569 | p.N119S,PIP5K1B | 1 |
| chr9:71503904 | p.P288Q,PIP5K1B | 1 |
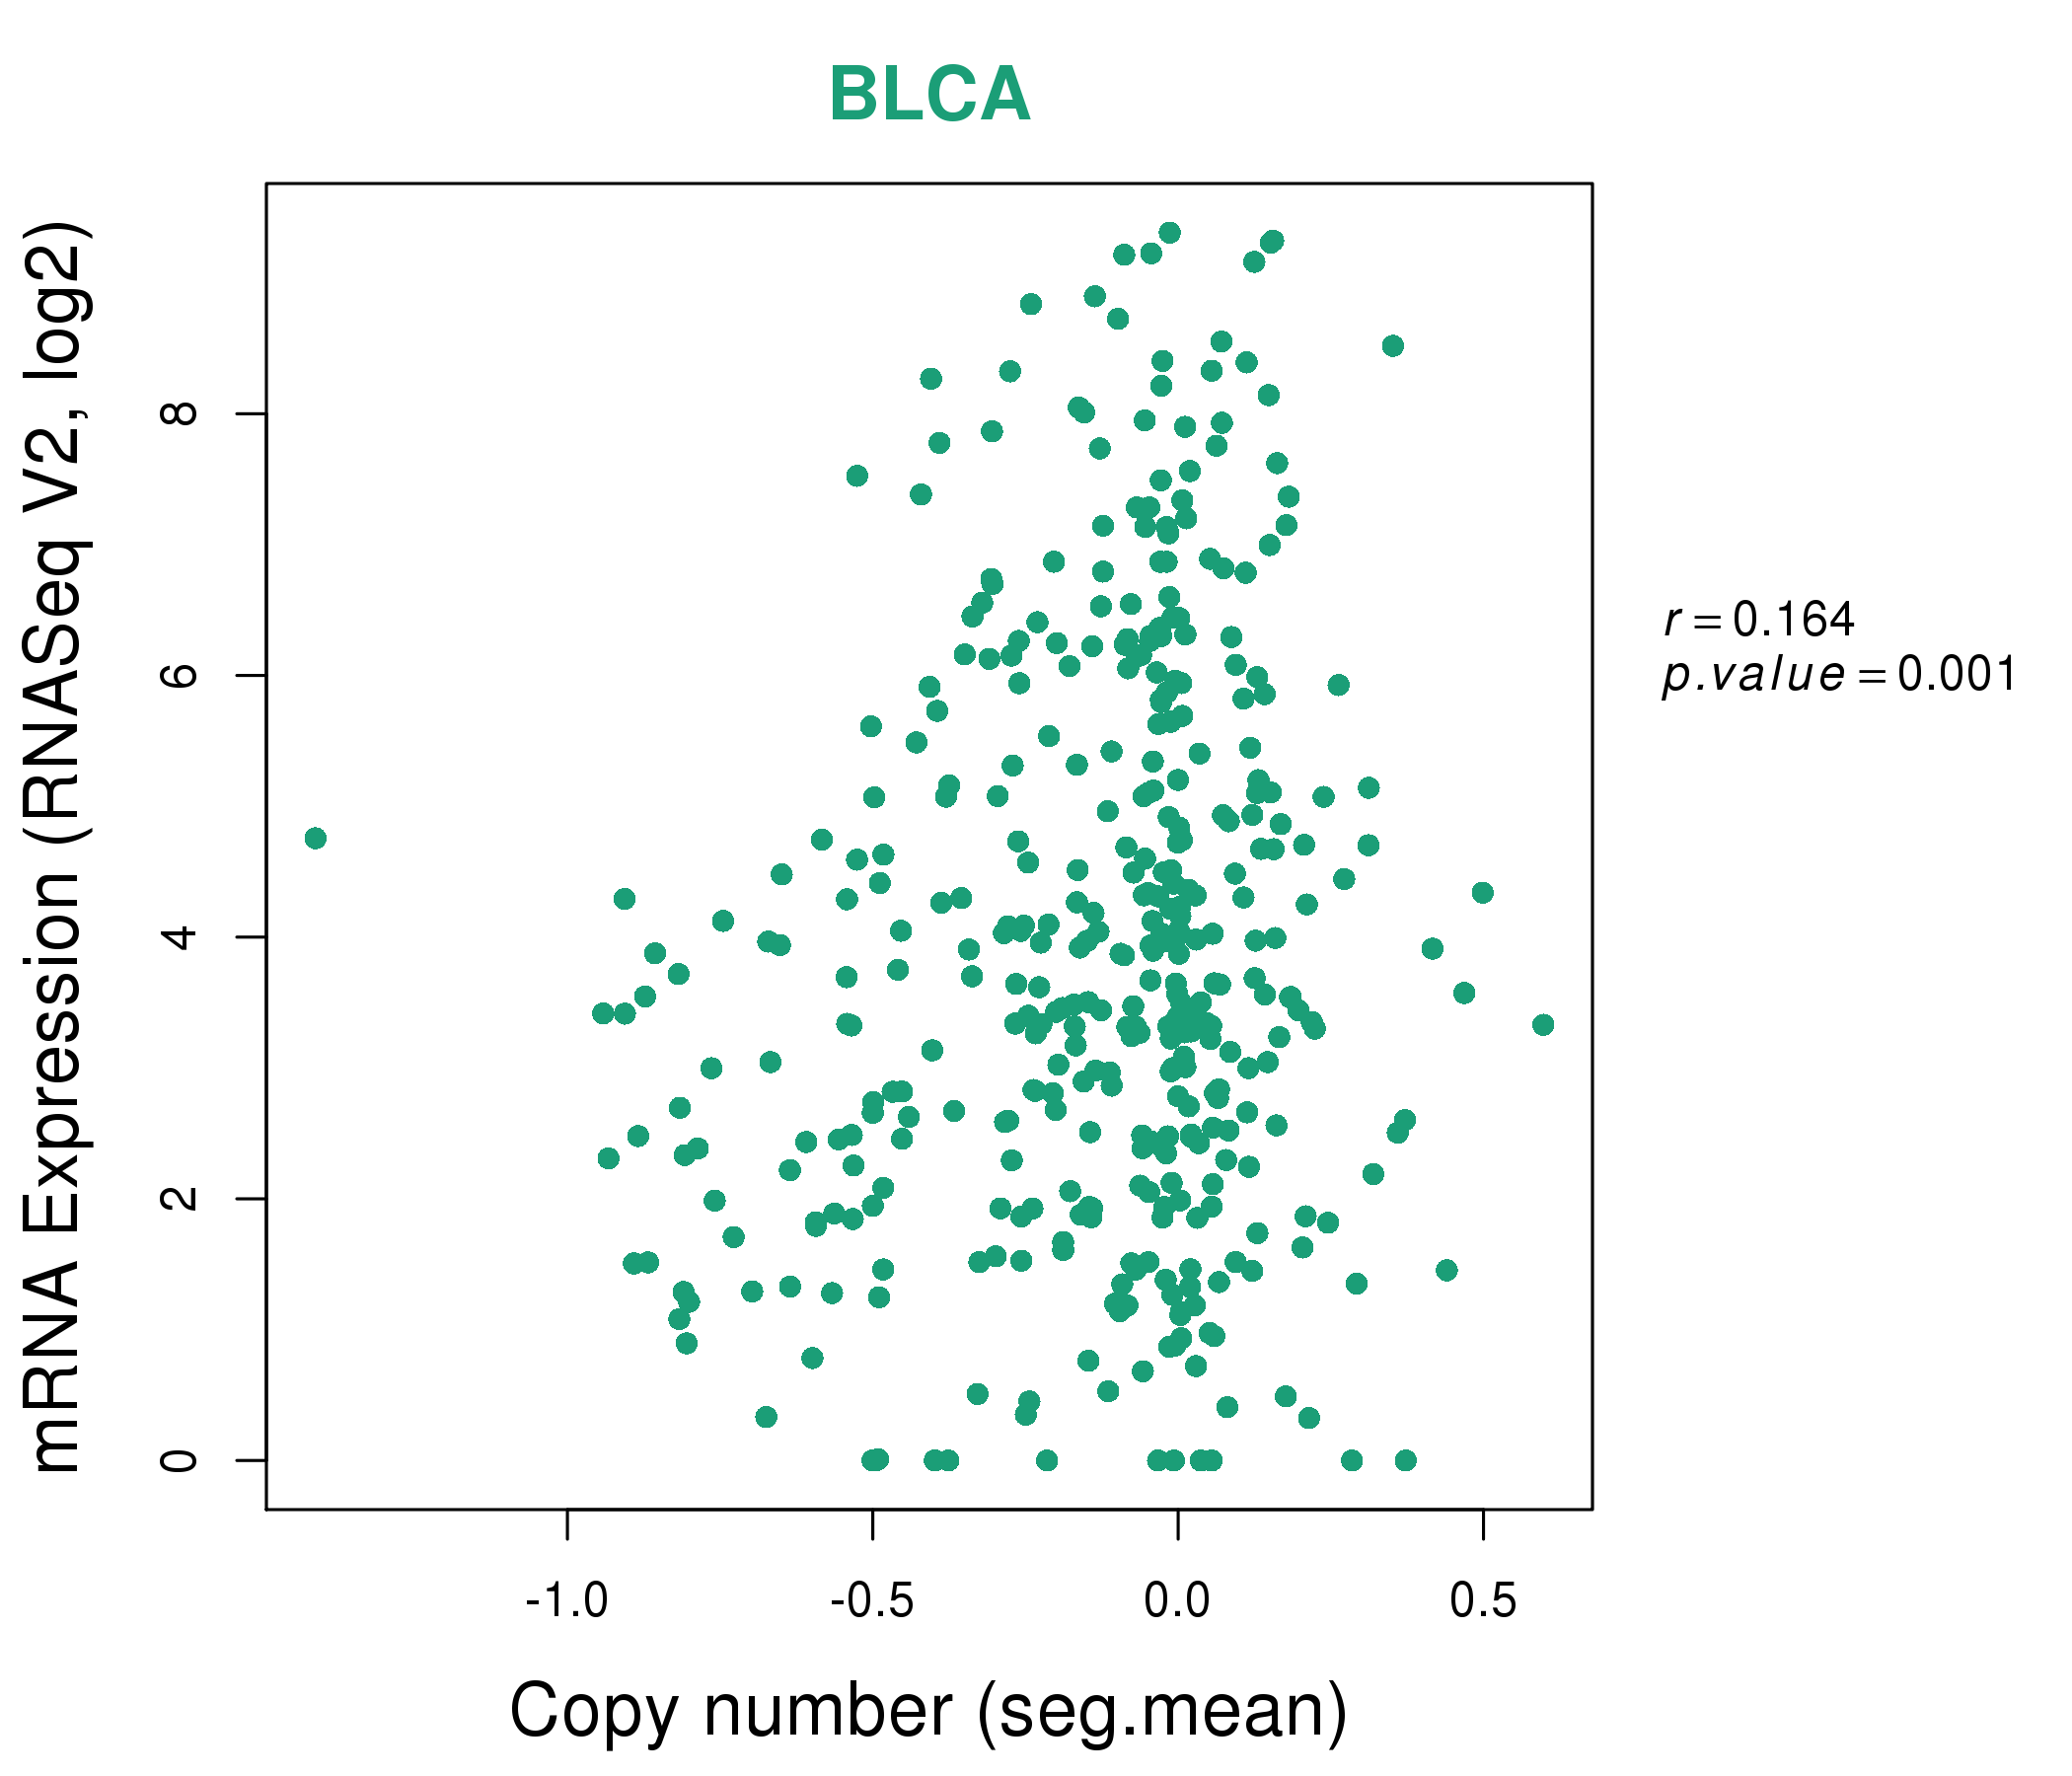
| * Copy number data were extracted from TCGA using R package TCGA-Assembler. The URLs of all public data files on TCGA DCC data server were gathered on Jan-05-2015. Function ProcessCNAData in TCGA-Assembler package was used to obtain gene-level copy number value which is calculated as the average copy number of the genomic region of a gene. |
 |
| cf) Tissue ID[Tissue type]: BLCA[Bladder Urothelial Carcinoma], BRCA[Breast invasive carcinoma], CESC[Cervical squamous cell carcinoma and endocervical adenocarcinoma], COAD[Colon adenocarcinoma], GBM[Glioblastoma multiforme], Glioma Low Grade, HNSC[Head and Neck squamous cell carcinoma], KICH[Kidney Chromophobe], KIRC[Kidney renal clear cell carcinoma], KIRP[Kidney renal papillary cell carcinoma], LAML[Acute Myeloid Leukemia], LUAD[Lung adenocarcinoma], LUSC[Lung squamous cell carcinoma], OV[Ovarian serous cystadenocarcinoma ], PAAD[Pancreatic adenocarcinoma], PRAD[Prostate adenocarcinoma], SKCM[Skin Cutaneous Melanoma], STAD[Stomach adenocarcinoma], THCA[Thyroid carcinoma], UCEC[Uterine Corpus Endometrial Carcinoma] |
| Top |
| Gene Expression for PIP5K1B |
| * CCLE gene expression data were extracted from CCLE_Expression_Entrez_2012-10-18.res: Gene-centric RMA-normalized mRNA expression data. |
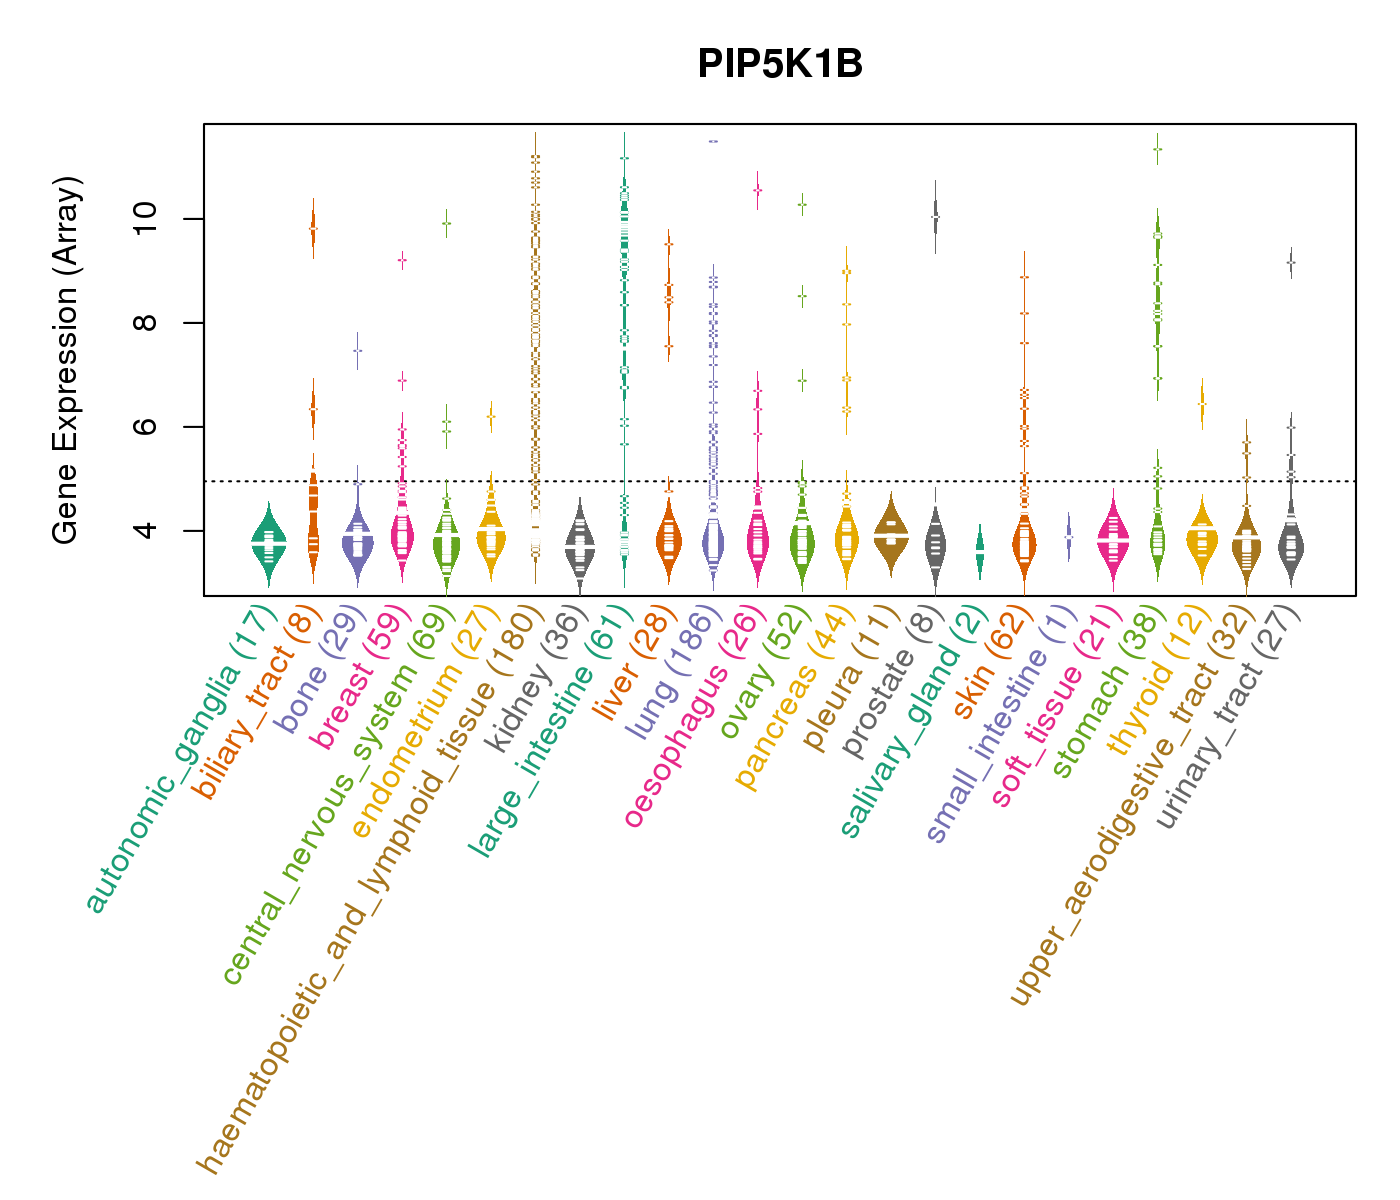 |
| * Normalized gene expression data of RNASeqV2 was extracted from TCGA using R package TCGA-Assembler. The URLs of all public data files on TCGA DCC data server were gathered at Jan-05-2015. Only eight cancer types have enough normal control samples for differential expression analysis. (t test, adjusted p<0.05 (using Benjamini-Hochberg FDR)) |
 |
| Top |
| * This plots show the correlation between CNV and gene expression. |
: Open all plots for all cancer types
 |
|
 |
|

| Top |
| Gene-Gene Network Information |
| * Co-Expression network figures were drawn using R package igraph. Only the top 20 genes with the highest correlations were shown. Red circle: input gene, orange circle: cell metabolism gene, sky circle: other gene |
: Open all plots for all cancer types
 |
|
| LINC00470___CHMP1B,CBWD3,FAM122A,FOXD4L5,FREM2,FXN,INPP5A, KIAA1875,LOC442421,OR4D9,PIP5K1B,PPFIA4,PRKACG,PTAR1, PWWP2B,SCARNA20,SHOC2,SIRPB1,SMC5,TJP2,ZMIZ1 | ARMCX5,ATL1,DST,CCSER1,FGFR2,GRAMD3,KIAA1671, KLF5,LRAT,MFSD6,MUC15,MYLK,NAP1L2,NTN4, NUP35,OSBPL9,PIP5K1B,REPS1,SOX9,TES,TMEM30B |
 |
|
| C1orf210,C4orf19,TMEM246,CASP7,CMPK1,CORO2A,ENPP4, FAM120A,MOB3B,MUC13,PIP5K1B,PLS1,RAB14,RASEF, RBM47,SCP2,SH3BGRL2,SLC17A5,SLC35A3,TJP2,TMEM171 | ABHD3,APPL2,ATP1B3,CCDC68,CLCN2,EPS8,ABHD17C, HHLA2,LGR4,LNX2,NR3C2,PIP4K2C,PIP5K1B,RIOK3, SLC26A3,STX3,TAOK3,TJP3,TMEM45B,TRIM36,WASL |

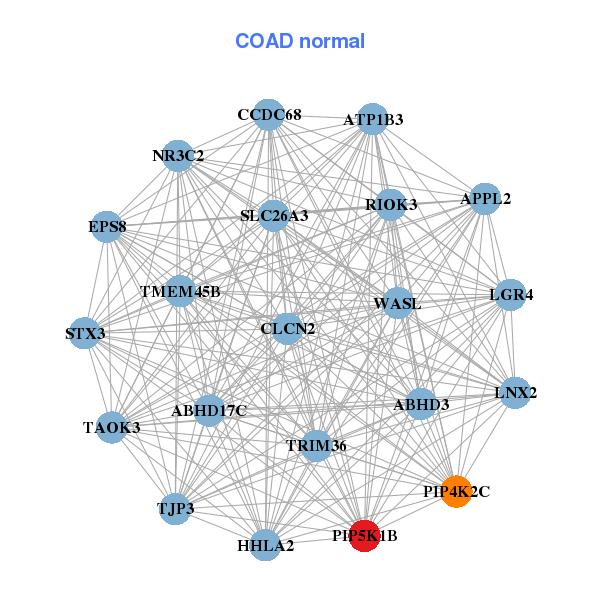
| * Co-Expression network figures were drawn using R package igraph. Only the top 20 genes with the highest correlations were shown. Red circle: input gene, orange circle: cell metabolism gene, sky circle: other gene |
: Open all plots for all cancer types
| Top |
: Open all interacting genes' information including KEGG pathway for all interacting genes from DAVID
| Top |
| Pharmacological Information for PIP5K1B |
| There's no related Drug. |
| Top |
| Cross referenced IDs for PIP5K1B |
| * We obtained these cross-references from Uniprot database. It covers 150 different DBs, 18 categories. http://www.uniprot.org/help/cross_references_section |
: Open all cross reference information
|
Copyright © 2016-Present - The Univsersity of Texas Health Science Center at Houston @ |