|
||||||||||||||||||||||||||||||||||||||||||||||||||||||||||||||||||||||||||||||||||||||||||||||||||||||||||||||||||||||||||||||||||||||||||||||||||||||||||||||||||||||||||||||||||||||||||||||||||||||||||||||||||||||||||||||||||||||||||||||||||||||||||||||||||||||||||||||||||||||||||||||||||||||||||||||||||||||||||
| |
| Phenotypic Information (metabolism pathway, cancer, disease, phenome) |
| |
| |
| Gene-Gene Network Information: Co-Expression Network, Interacting Genes & KEGG |
| |
|


| Gene Summary for PIP4K2B |
| Basic gene info. | Gene symbol | PIP4K2B |
| Gene name | phosphatidylinositol-5-phosphate 4-kinase, type II, beta | |
| Synonyms | PI5P4KB|PIP5K2B|PIP5KIIB|PIP5KIIbeta | |
| Cytomap | UCSC genome browser: 17q12 | |
| Genomic location | chr17 :36921943-36956158 | |
| Type of gene | protein-coding | |
| RefGenes | NM_003559.4, NM_138687.1, | |
| Ensembl id | ENSG00000141720 | |
| Description | 1-phosphatidylinositol 5-phosphate 4-kinase 2-beta1-phosphatidylinositol-4-phosphate kinase1-phosphatidylinositol-5-phosphate 4-kinase 2-betaPI(5)P 4-kinase type II betaPIP4KII-betaPTDINS(4)P-5-kinasediphosphoinositide kinase 2-betaphosphatidylinos | |
| Modification date | 20141207 | |
| dbXrefs | MIM : 603261 | |
| HGNC : HGNC | ||
| Ensembl : ENSG00000276293 | ||
| HPRD : 04463 | ||
| Vega : OTTHUMG00000188504 | ||
| Protein | UniProt: go to UniProt's Cross Reference DB Table | |
| Expression | CleanEX: HS_PIP4K2B | |
| BioGPS: 8396 | ||
| Gene Expression Atlas: ENSG00000141720 | ||
| The Human Protein Atlas: ENSG00000141720 | ||
| Pathway | NCI Pathway Interaction Database: PIP4K2B | |
| KEGG: PIP4K2B | ||
| REACTOME: PIP4K2B | ||
| ConsensusPathDB | ||
| Pathway Commons: PIP4K2B | ||
| Metabolism | MetaCyc: PIP4K2B | |
| HUMANCyc: PIP4K2B | ||
| Regulation | Ensembl's Regulation: ENSG00000141720 | |
| miRBase: chr17 :36,921,943-36,956,158 | ||
| TargetScan: NM_003559 | ||
| cisRED: ENSG00000141720 | ||
| Context | iHOP: PIP4K2B | |
| cancer metabolism search in PubMed: PIP4K2B | ||
| UCL Cancer Institute: PIP4K2B | ||
| Assigned class in ccmGDB | C | |
| Top |
| Phenotypic Information for PIP4K2B(metabolism pathway, cancer, disease, phenome) |
| Cancer | CGAP: PIP4K2B |
| Familial Cancer Database: PIP4K2B | |
| * This gene is included in those cancer gene databases. |
|
|
|
|
|
|
| ||||||||||||||||||||||||||||||||||||||||||||||||||||||||||||||||||||||||||||||||||||||||||||||||||||||||||||||||||||||||||||||||||||||||||||||||||||||||||||||||||||||||||||||||||||||||||||||||||||||||||||||||||||||||||||||||||||||||||||||||||||||||||||||||||||||||||||||||||||||||||||||||||||||||||||||||||||
Oncogene 1 | Significant driver gene in | |||||||||||||||||||||||||||||||||||||||||||||||||||||||||||||||||||||||||||||||||||||||||||||||||||||||||||||||||||||||||||||||||||||||||||||||||||||||||||||||||||||||||||||||||||||||||||||||||||||||||||||||||||||||||||||||||||||||||||||||||||||||||||||||||||||||||||||||||||||||||||||||||||||||||||||||||||||||||
| cf) number; DB name 1 Oncogene; http://nar.oxfordjournals.org/content/35/suppl_1/D721.long, 2 Tumor Suppressor gene; https://bioinfo.uth.edu/TSGene/, 3 Cancer Gene Census; http://www.nature.com/nrc/journal/v4/n3/abs/nrc1299.html, 4 CancerGenes; http://nar.oxfordjournals.org/content/35/suppl_1/D721.long, 5 Network of Cancer Gene; http://ncg.kcl.ac.uk/index.php, 1Therapeutic Vulnerabilities in Cancer; http://cbio.mskcc.org/cancergenomics/statius/ |
| KEGG_INOSITOL_PHOSPHATE_METABOLISM KEGG_FC_GAMMA_R_MEDIATED_PHAGOCYTOSIS REACTOME_PHOSPHOLIPID_METABOLISM REACTOME_PI_METABOLISM REACTOME_METABOLISM_OF_LIPIDS_AND_LIPOPROTEINS | |
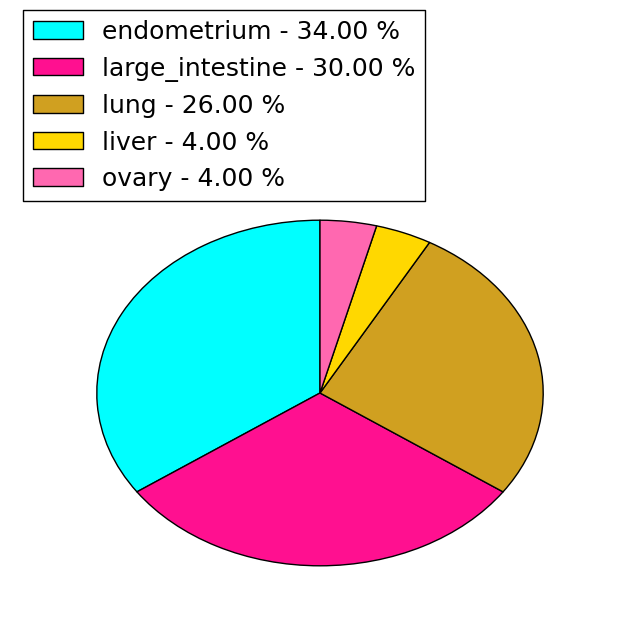
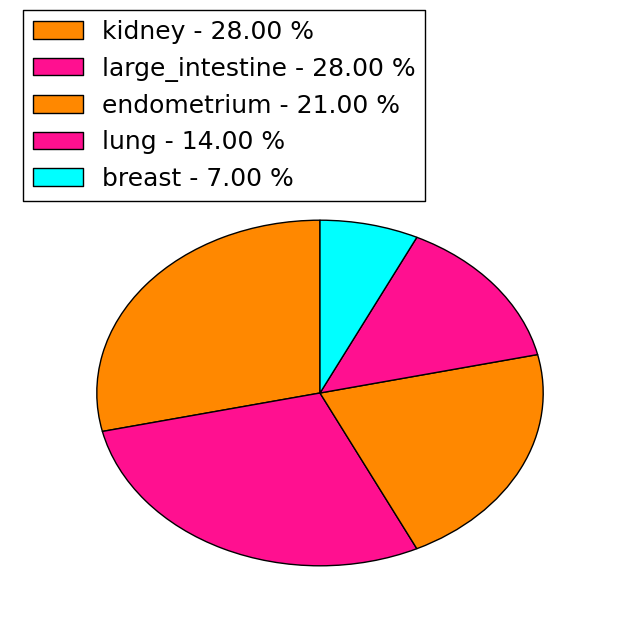
| Mutations for PIP4K2B |
| * Under tables are showing count per each tissue to give us broad intuition about tissue specific mutation patterns.You can go to the detailed page for each mutation database's web site. |
| There's no structural variation information in COSMIC data for this gene. |
| * From mRNA Sanger sequences, Chitars2.0 arranged chimeric transcripts. This table shows PIP4K2B related fusion information. |
| ID | Head Gene | Tail Gene | Accession | Gene_a | qStart_a | qEnd_a | Chromosome_a | tStart_a | tEnd_a | Gene_a | qStart_a | qEnd_a | Chromosome_a | tStart_a | tEnd_a |
| AA972703 | PIP4K2B | 2 | 91 | 17 | 36955896 | 36955987 | APBA3 | 92 | 402 | 19 | 3751238 | 3752608 | |
| AF130850 | PIP4K2B | 5 | 86 | 17 | 36927442 | 36927527 | DGCR5 | 74 | 1272 | 22 | 19014309 | 19015512 | |
| AA247774 | PIP4K2B | 1 | 132 | 17 | 36922170 | 36922301 | PIP4K2B | 126 | 391 | 17 | 36935745 | 36940572 | |
| BF849647 | PIP4K2B | 29 | 129 | 17 | 36943075 | 36943175 | PIP4K2B | 128 | 263 | 17 | 36933940 | 36934608 | |
| BF991438 | PIP4K2B | 1 | 155 | 17 | 36924516 | 36924670 | PIP4K2B | 148 | 255 | 17 | 36924325 | 36924432 | |
| BP428483 | CDC20 | 6 | 228 | 1 | 43827923 | 43828782 | PIP4K2B | 217 | 319 | 17 | 36922424 | 36922526 | |
| Top |
| Mutation type/ Tissue ID | brca | cns | cerv | endome | haematopo | kidn | Lintest | liver | lung | ns | ovary | pancre | prost | skin | stoma | thyro | urina | |||
| Total # sample | 6 | 1 | ||||||||||||||||||
| GAIN (# sample) | 6 | 1 | ||||||||||||||||||
| LOSS (# sample) |
| cf) Tissue ID; Tissue type (1; Breast, 2; Central_nervous_system, 3; Cervix, 4; Endometrium, 5; Haematopoietic_and_lymphoid_tissue, 6; Kidney, 7; Large_intestine, 8; Liver, 9; Lung, 10; NS, 11; Ovary, 12; Pancreas, 13; Prostate, 14; Skin, 15; Stomach, 16; Thyroid, 17; Urinary_tract) |
| Top |
|
 |
| Top |
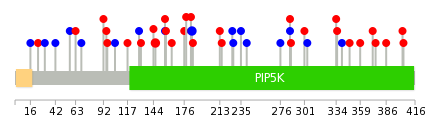
| Stat. for Non-Synonymous SNVs (# total SNVs=23) | (# total SNVs=14) |
 |  |
(# total SNVs=0) | (# total SNVs=0) |
| Top |
| * When you move the cursor on each content, you can see more deailed mutation information on the Tooltip. Those are primary_site,primary_histology,mutation(aa),pubmedID. |
| GRCh37 position | Mutation(aa) | Unique sampleID count |
| chr17:36936775-36936775 | p.R146H | 2 |
| chr17:36935738-36935738 | p.L184L | 2 |
| chr17:36935763-36935763 | p.G176D | 1 |
| chr17:36926782-36926782 | p.K359N | 1 |
| chr17:36940538-36940538 | p.R104R | 1 |
| chr17:36934024-36934024 | p.N241N | 1 |
| chr17:36935784-36935784 | p.? | 1 |
| chr17:36927291-36927291 | p.V348I | 1 |
| chr17:36940564-36940564 | p.K96Q | 1 |
| chr17:36934042-36934042 | p.L235L | 1 |
| Top |
|
 |
| Point Mutation/ Tissue ID | 1 | 2 | 3 | 4 | 5 | 6 | 7 | 8 | 9 | 10 | 11 | 12 | 13 | 14 | 15 | 16 | 17 | 18 | 19 | 20 |
| # sample | 2 | 1 | 9 | 2 | 4 | 4 | 3 | 1 | 3 | 4 | 1 | 9 | ||||||||
| # mutation | 2 | 1 | 8 | 2 | 4 | 4 | 3 | 1 | 3 | 4 | 1 | 11 | ||||||||
| nonsynonymous SNV | 1 | 4 | 2 | 3 | 3 | 1 | 3 | 2 | 1 | 8 | ||||||||||
| synonymous SNV | 1 | 1 | 4 | 4 | 1 | 2 | 3 |
| cf) Tissue ID; Tissue type (1; BLCA[Bladder Urothelial Carcinoma], 2; BRCA[Breast invasive carcinoma], 3; CESC[Cervical squamous cell carcinoma and endocervical adenocarcinoma], 4; COAD[Colon adenocarcinoma], 5; GBM[Glioblastoma multiforme], 6; Glioma Low Grade, 7; HNSC[Head and Neck squamous cell carcinoma], 8; KICH[Kidney Chromophobe], 9; KIRC[Kidney renal clear cell carcinoma], 10; KIRP[Kidney renal papillary cell carcinoma], 11; LAML[Acute Myeloid Leukemia], 12; LUAD[Lung adenocarcinoma], 13; LUSC[Lung squamous cell carcinoma], 14; OV[Ovarian serous cystadenocarcinoma ], 15; PAAD[Pancreatic adenocarcinoma], 16; PRAD[Prostate adenocarcinoma], 17; SKCM[Skin Cutaneous Melanoma], 18:STAD[Stomach adenocarcinoma], 19:THCA[Thyroid carcinoma], 20:UCEC[Uterine Corpus Endometrial Carcinoma]) |
| Top |
| * We represented just top 10 SNVs. When you move the cursor on each content, you can see more deailed mutation information on the Tooltip. Those are primary_site, primary_histology, mutation(aa), pubmedID. |
| Genomic Position | Mutation(aa) | Unique sampleID count |
| chr17:36926734 | p.D375E | 3 |
| chr17:36936775 | p.R146H | 2 |
| chr17:36935738 | p.I276I | 2 |
| chr17:36927505 | p.L184L | 2 |
| chr17:36936744 | p.Y320F | 1 |
| chr17:36927314 | p.I163V | 1 |
| chr17:36955562 | p.L16L | 1 |
| chr17:36934042 | p.D304D | 1 |
| chr17:36927329 | p.V157L | 1 |
| chr17:36955585 | p.R301W | 1 |
| * Copy number data were extracted from TCGA using R package TCGA-Assembler. The URLs of all public data files on TCGA DCC data server were gathered on Jan-05-2015. Function ProcessCNAData in TCGA-Assembler package was used to obtain gene-level copy number value which is calculated as the average copy number of the genomic region of a gene. |
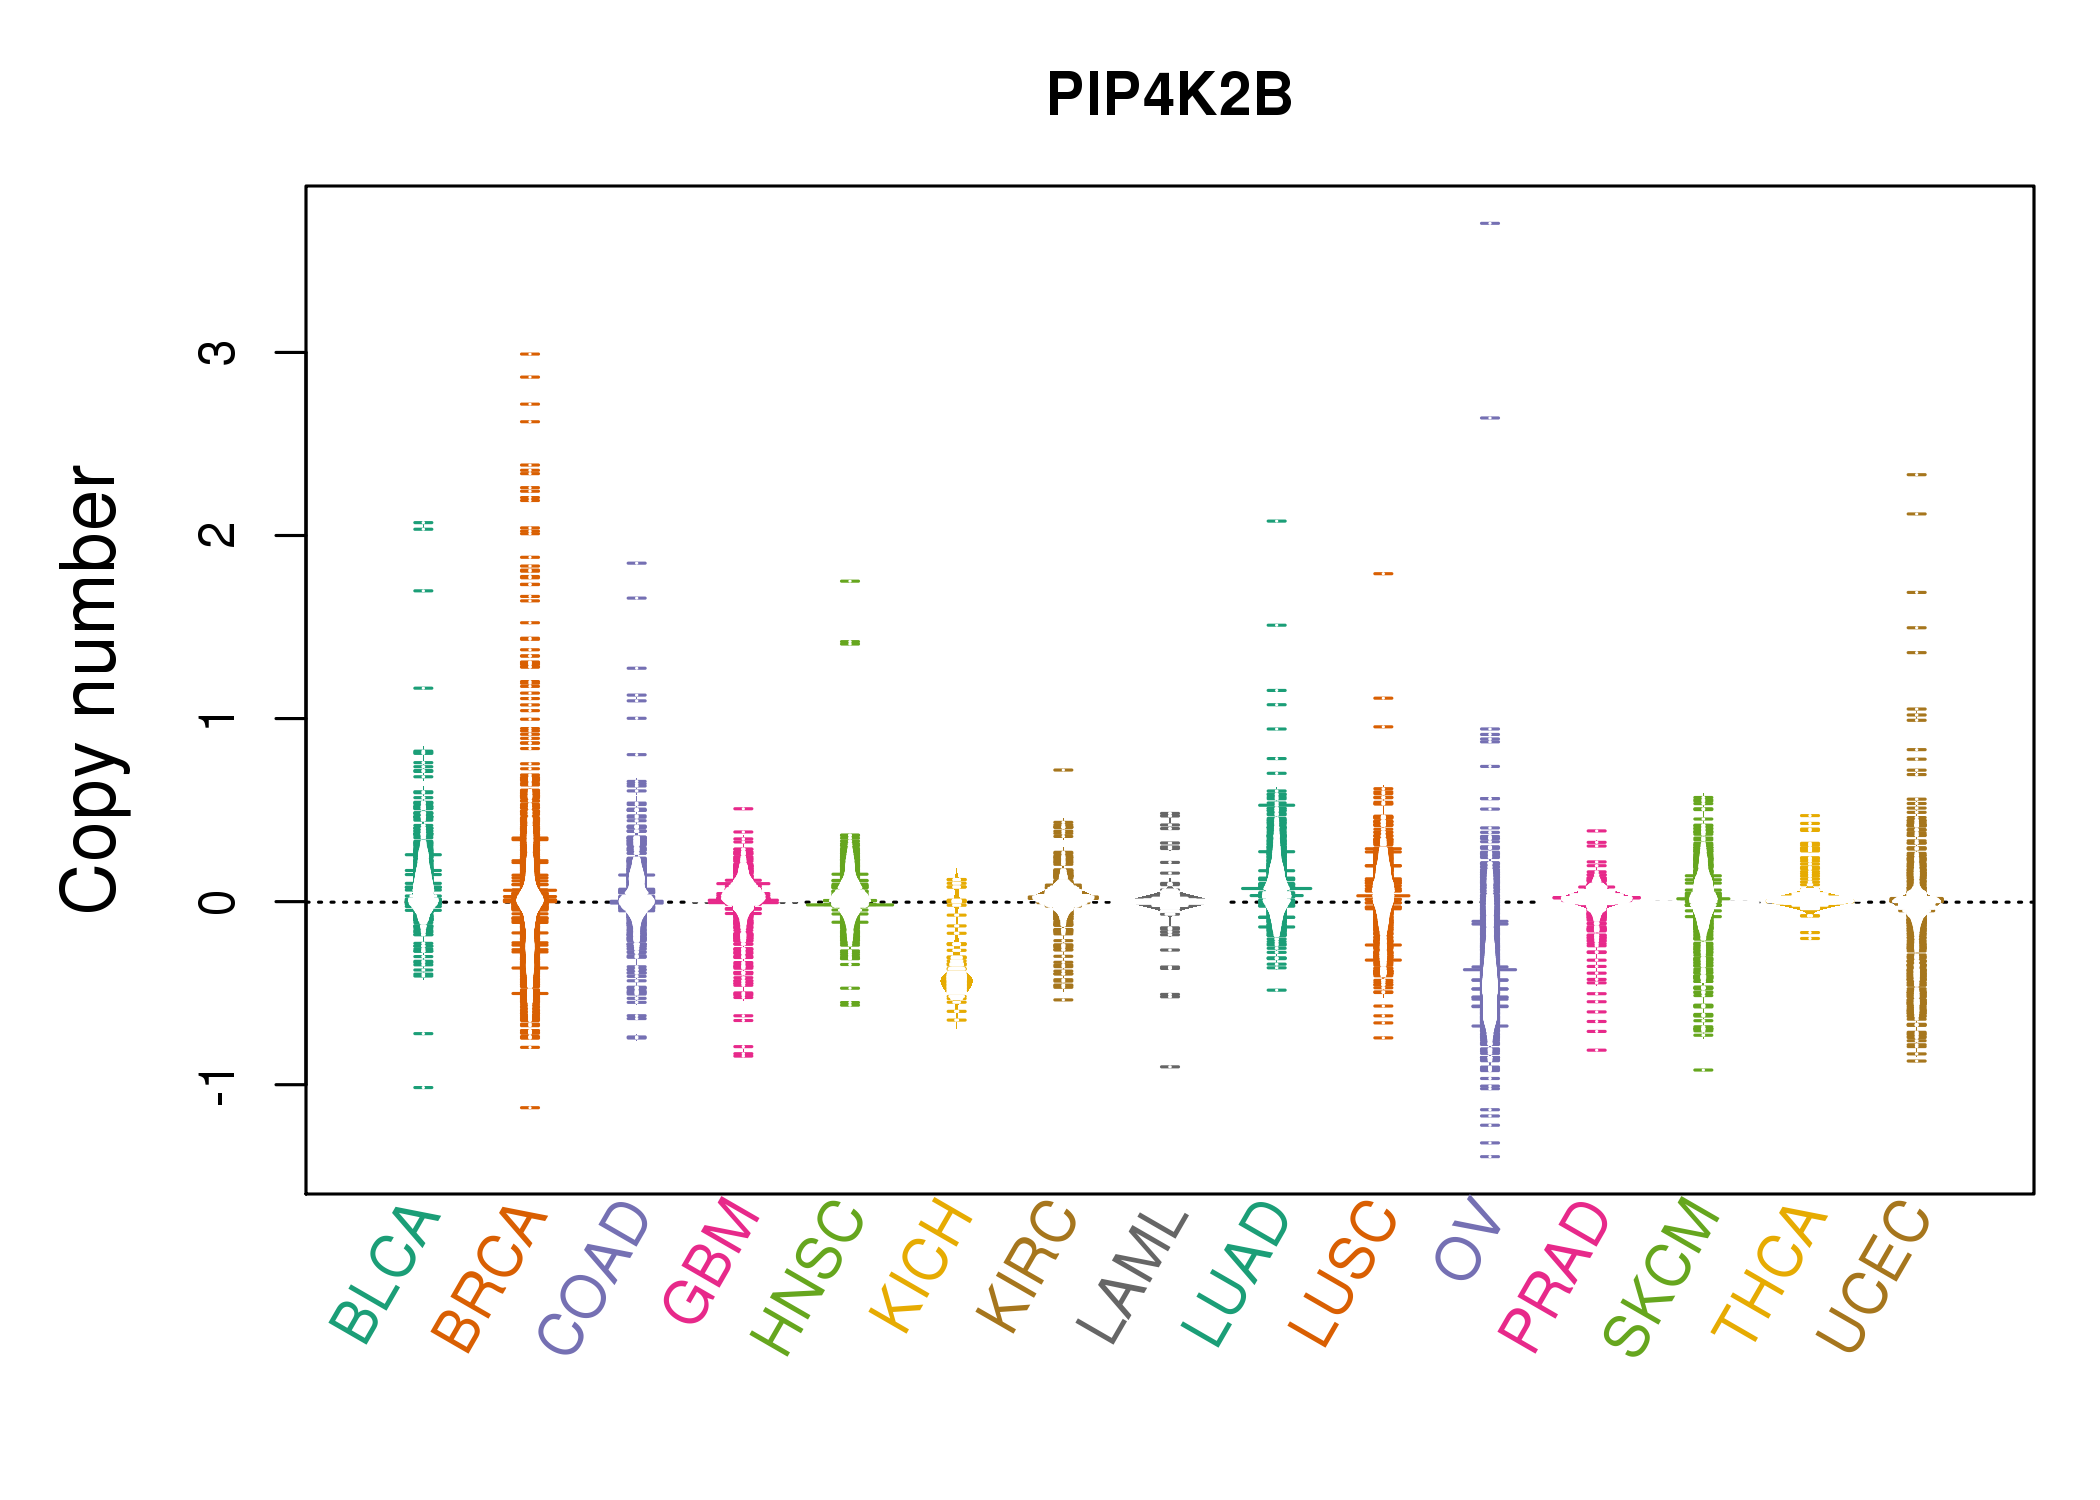 |
| cf) Tissue ID[Tissue type]: BLCA[Bladder Urothelial Carcinoma], BRCA[Breast invasive carcinoma], CESC[Cervical squamous cell carcinoma and endocervical adenocarcinoma], COAD[Colon adenocarcinoma], GBM[Glioblastoma multiforme], Glioma Low Grade, HNSC[Head and Neck squamous cell carcinoma], KICH[Kidney Chromophobe], KIRC[Kidney renal clear cell carcinoma], KIRP[Kidney renal papillary cell carcinoma], LAML[Acute Myeloid Leukemia], LUAD[Lung adenocarcinoma], LUSC[Lung squamous cell carcinoma], OV[Ovarian serous cystadenocarcinoma ], PAAD[Pancreatic adenocarcinoma], PRAD[Prostate adenocarcinoma], SKCM[Skin Cutaneous Melanoma], STAD[Stomach adenocarcinoma], THCA[Thyroid carcinoma], UCEC[Uterine Corpus Endometrial Carcinoma] |
| Top |
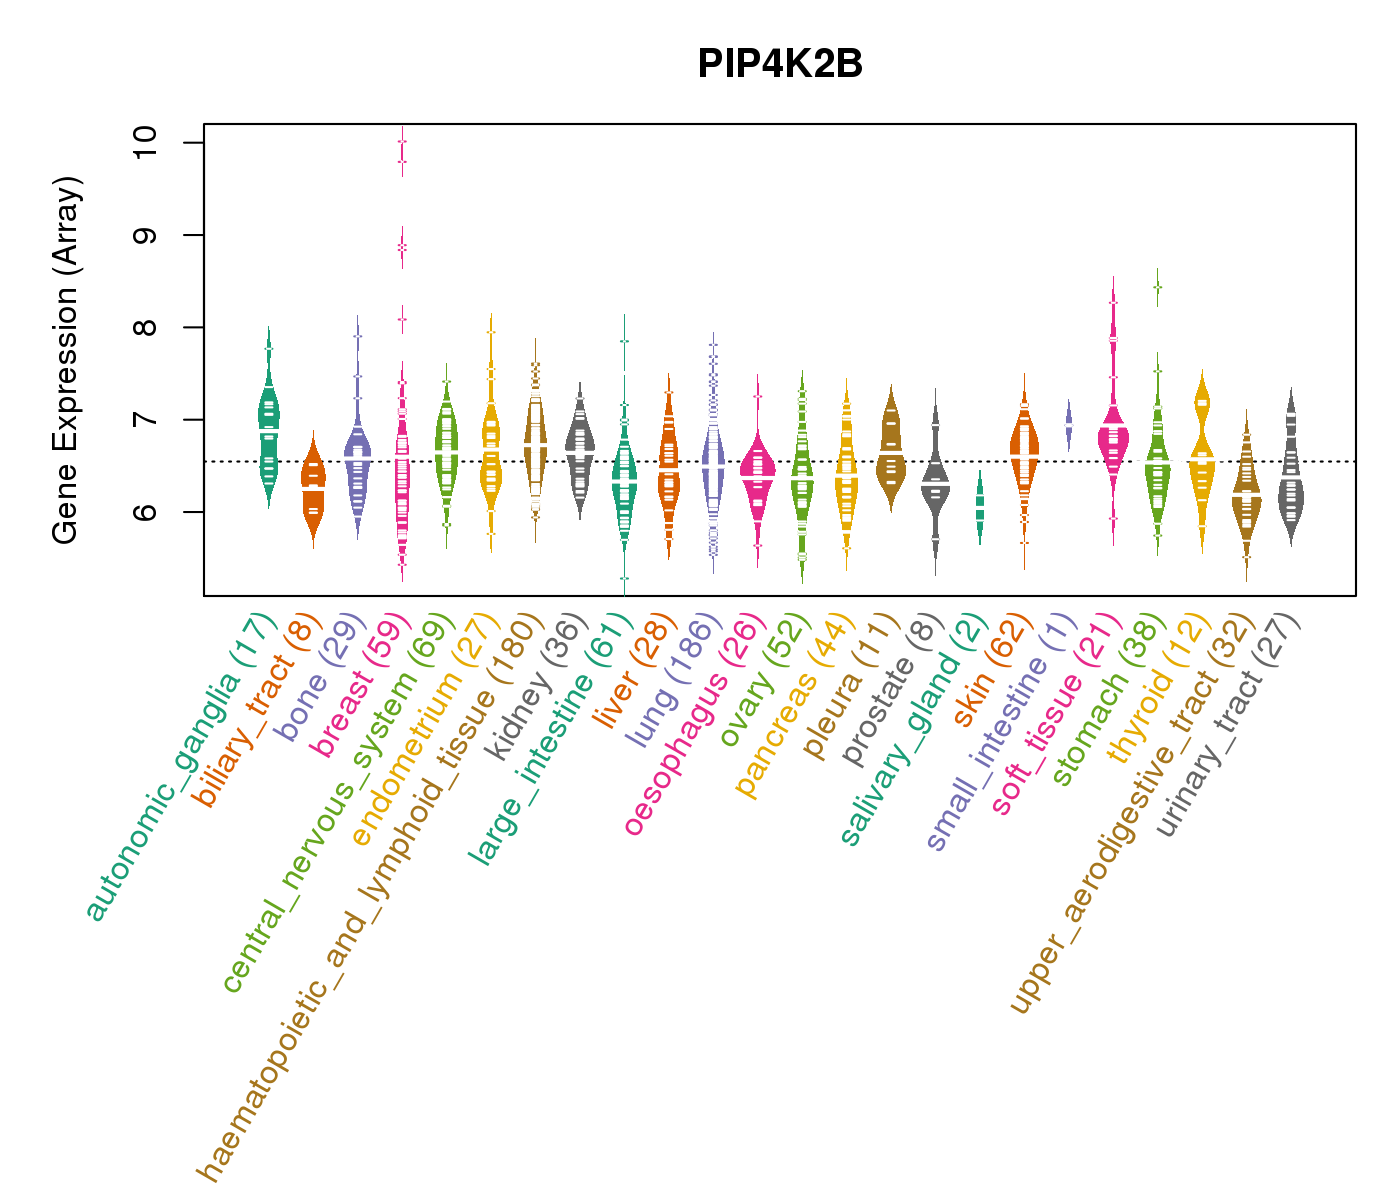
| Gene Expression for PIP4K2B |
| * CCLE gene expression data were extracted from CCLE_Expression_Entrez_2012-10-18.res: Gene-centric RMA-normalized mRNA expression data. |
 |
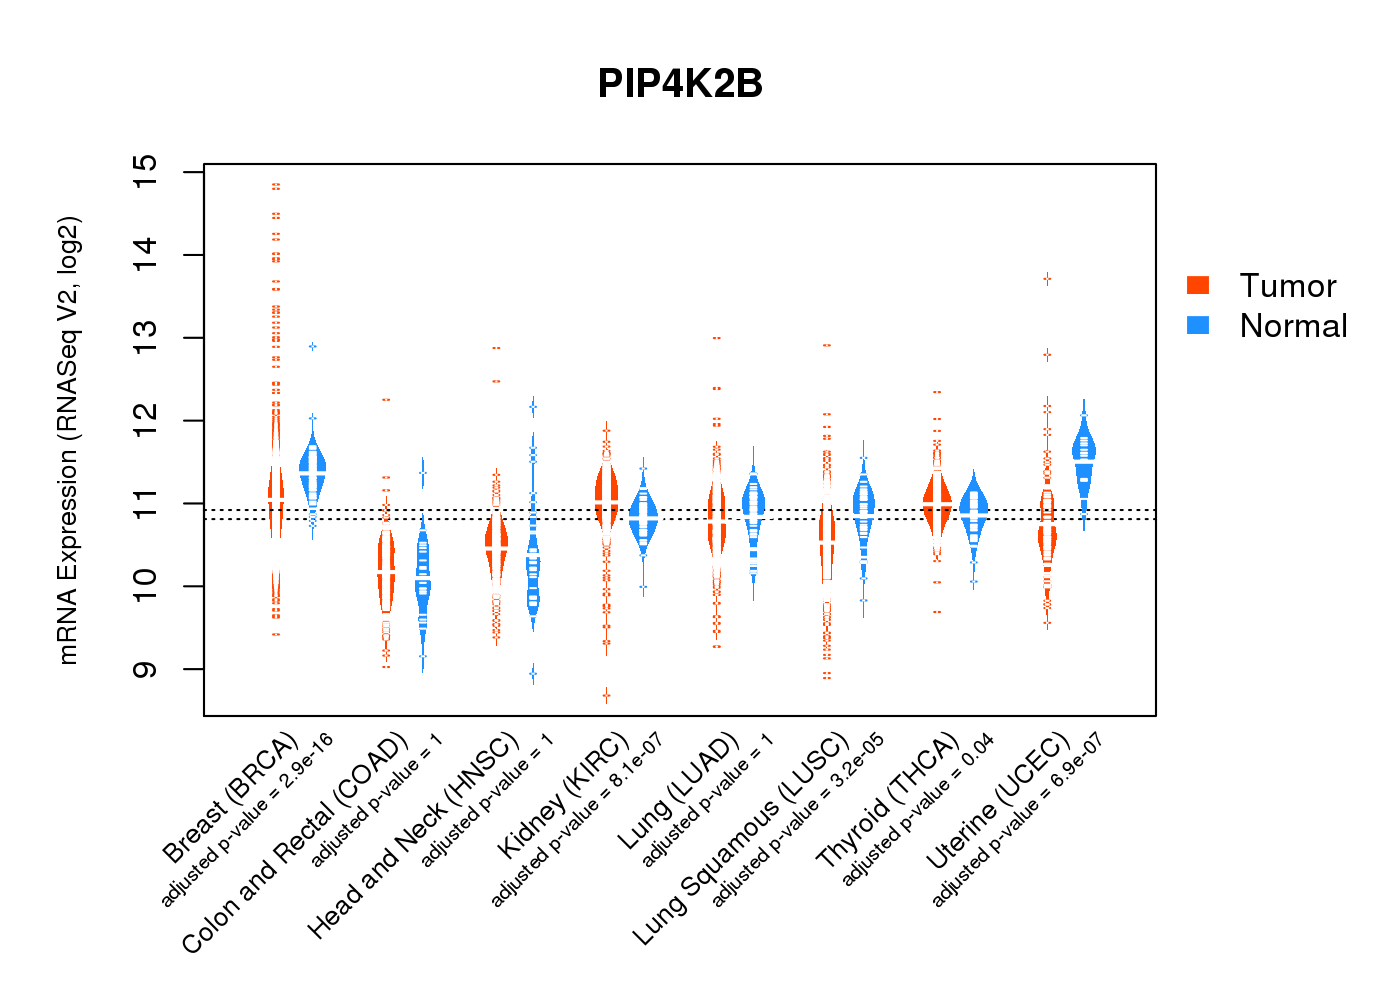
| * Normalized gene expression data of RNASeqV2 was extracted from TCGA using R package TCGA-Assembler. The URLs of all public data files on TCGA DCC data server were gathered at Jan-05-2015. Only eight cancer types have enough normal control samples for differential expression analysis. (t test, adjusted p<0.05 (using Benjamini-Hochberg FDR)) |
 |
| Top |
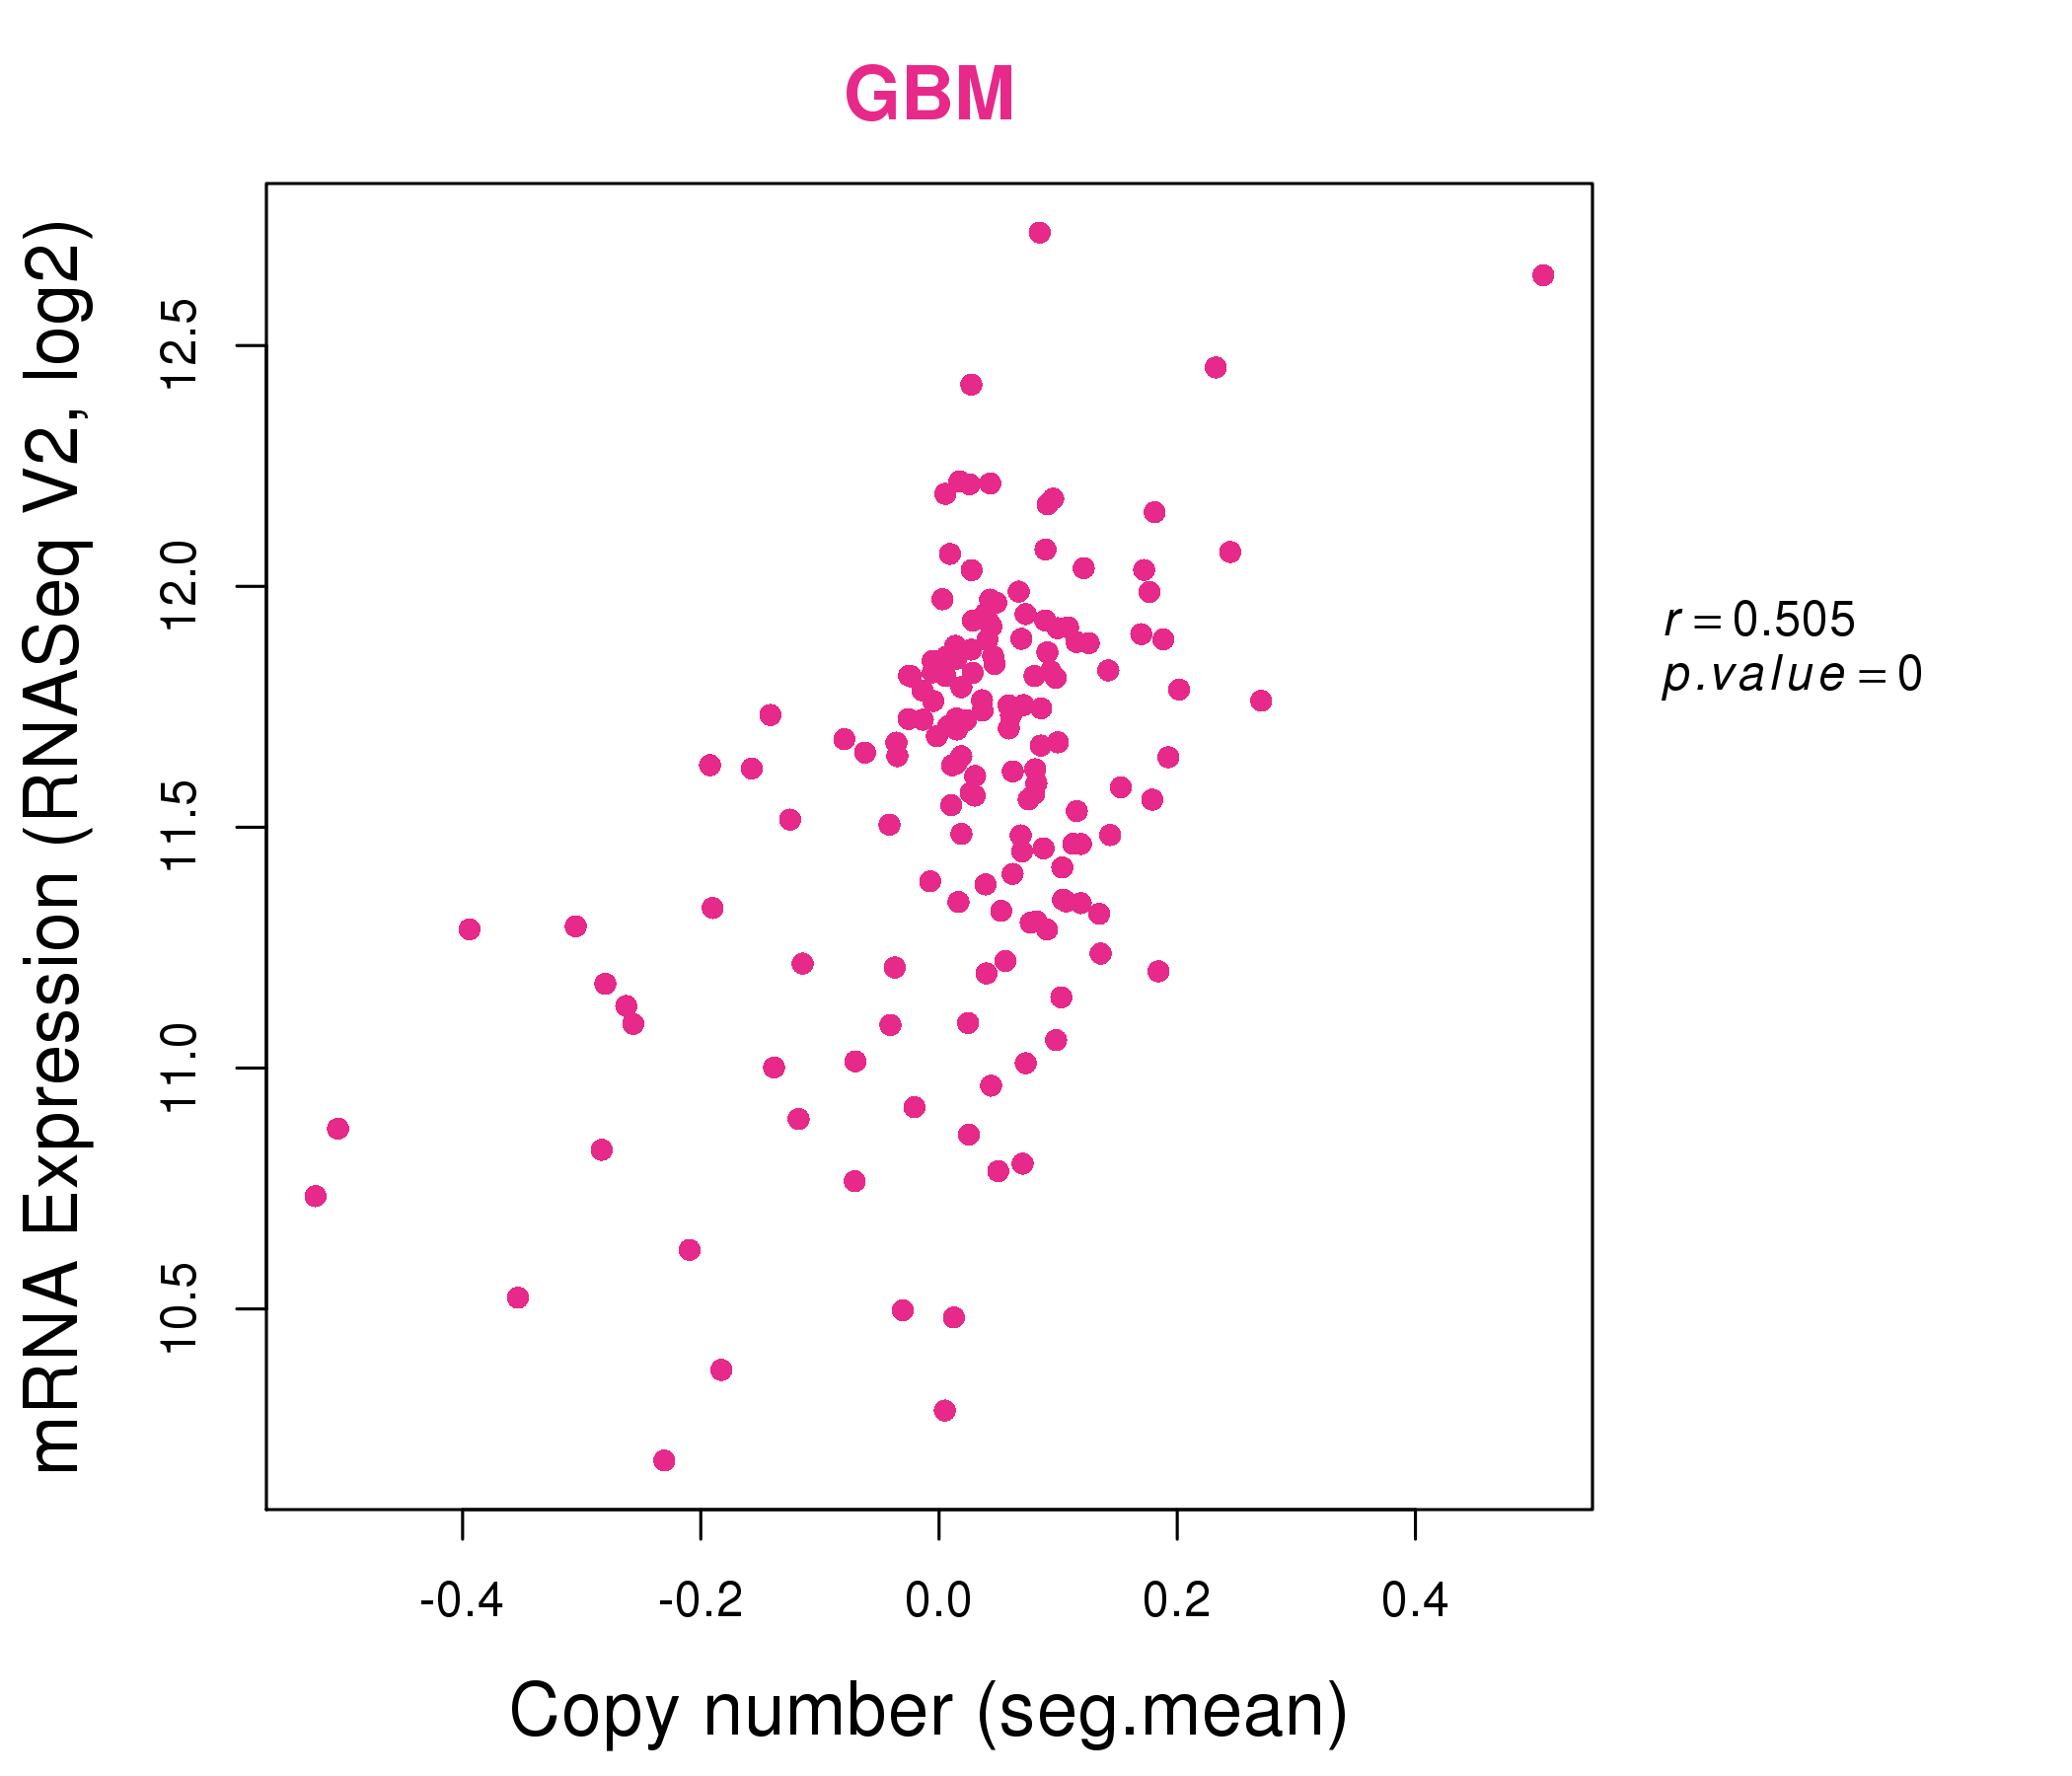
| * This plots show the correlation between CNV and gene expression. |
: Open all plots for all cancer types
 |
|
 |
|

| Top |
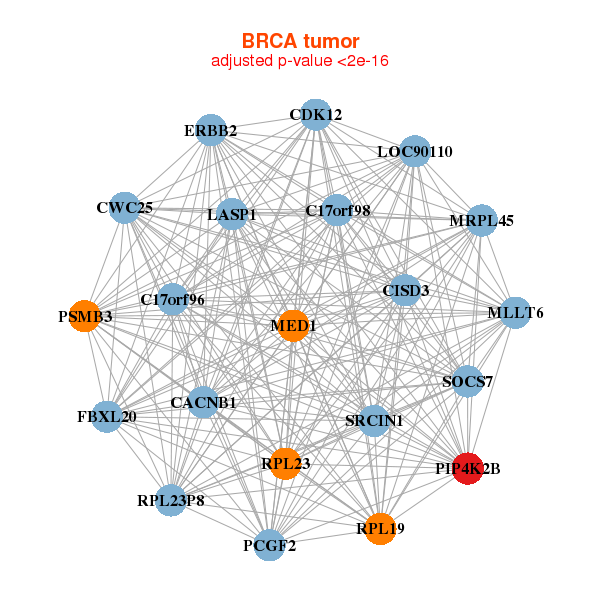
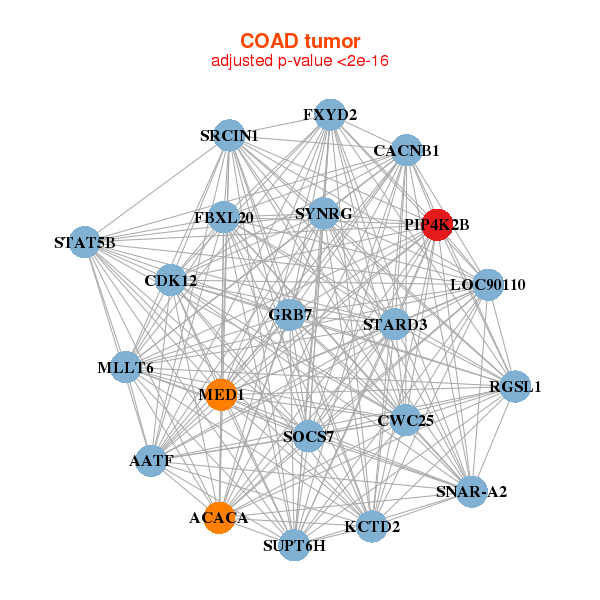
| Gene-Gene Network Information |
| * Co-Expression network figures were drawn using R package igraph. Only the top 20 genes with the highest correlations were shown. Red circle: input gene, orange circle: cell metabolism gene, sky circle: other gene |
: Open all plots for all cancer types
 |
|
| C17orf96,C17orf98,CACNB1,CDK12,CISD3,CWC25,ERBB2, FBXL20,LASP1,LOC90110,MED1,MLLT6,MRPL45,PCGF2, PIP4K2B,PSMB3,RPL19,RPL23,RPL23P8,SOCS7,SRCIN1 | ALDH5A1,AMOT,ARIH2,ASB8,FAM217B,FXR1,FYCO1, HERC1,HIF1AN,KIF1B,P2RY1,PAIP2B,PAX7,PIP4K2B, PPARGC1A,PRKAB2,PTCD3,SGCD,SIX4,TRAK1,ZNF106 |
 |
|
| AATF,ACACA,CACNB1,CDK12,CWC25,FBXL20,FXYD2, GRB7,KCTD2,LOC90110,MED1,MLLT6,PIP4K2B,RGSL1, SNAR-A2,SOCS7,SRCIN1,STARD3,STAT5B,SUPT6H,SYNRG | ARHGEF17,VSTM4,CCDC102A,CRTC3,DSTYK,FRMD4A,TP73-AS1, MAP3K3,NFATC4,NPR2,NR2F2,PHC1,PHF21A,PIP4K2B, RGAG4,SATB1,SIX5,STAT5B,TBKBP1,ZBTB4,ZNF512B |
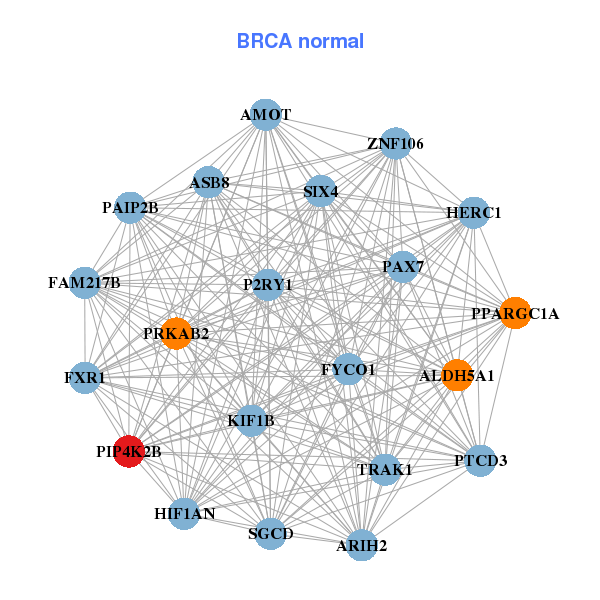

| * Co-Expression network figures were drawn using R package igraph. Only the top 20 genes with the highest correlations were shown. Red circle: input gene, orange circle: cell metabolism gene, sky circle: other gene |
: Open all plots for all cancer types
| Top |
: Open all interacting genes' information including KEGG pathway for all interacting genes from DAVID
| Top |
| Pharmacological Information for PIP4K2B |
| There's no related Drug. |
| Top |
| Cross referenced IDs for PIP4K2B |
| * We obtained these cross-references from Uniprot database. It covers 150 different DBs, 18 categories. http://www.uniprot.org/help/cross_references_section |
: Open all cross reference information
|
Copyright © 2016-Present - The Univsersity of Texas Health Science Center at Houston @ |