|
|||||||||||||||||||||||||||||||||||||||||||||||||||||||||||||||||||||||||||||||||||||||||||||||||||||||||||||||||||||||||||||||||||||||||||||||||||||||||||||||||||||||||||||||||||||||||||||||||||||||||||||||||||||||||||||||||||||||||||||||||||||||||||||||||||||||||||||||||||||||||||||||||||||||||||||||||||||||||||||||||||||||||||||
| |
| Phenotypic Information (metabolism pathway, cancer, disease, phenome) |
| |
| |
| Gene-Gene Network Information: Co-Expression Network, Interacting Genes & KEGG |
| |
|


| Gene Summary for PLA2G6 |
| Basic gene info. | Gene symbol | PLA2G6 |
| Gene name | phospholipase A2, group VI (cytosolic, calcium-independent) | |
| Synonyms | CaI-PLA2|GVI|INAD1|IPLA2-VIA|NBIA2|NBIA2A|NBIA2B|PARK14|PLA2|PNPLA9|iPLA2|iPLA2beta | |
| Cytomap | UCSC genome browser: 22q13.1 | |
| Genomic location | chr22 :38507501-38577761 | |
| Type of gene | protein-coding | |
| RefGenes | NM_001004426.1, NM_001199562.1,NM_003560.2, | |
| Ensembl id | ENSG00000184381 | |
| Description | 85 kDa calcium-independent phospholipase A285/88 kDa calcium-independent phospholipase A2GVI PLA2calcium-independent phospholipase A2cytosolic, calcium-independent phospholipase A2group VI phospholipase A2iPLA2-betaintracellular membrane-associated | |
| Modification date | 20141219 | |
| dbXrefs | MIM : 603604 | |
| HGNC : HGNC | ||
| Ensembl : ENSG00000184381 | ||
| HPRD : 04675 | ||
| Vega : OTTHUMG00000151246 | ||
| Protein | UniProt: go to UniProt's Cross Reference DB Table | |
| Expression | CleanEX: HS_PLA2G6 | |
| BioGPS: 8398 | ||
| Gene Expression Atlas: ENSG00000184381 | ||
| The Human Protein Atlas: ENSG00000184381 | ||
| Pathway | NCI Pathway Interaction Database: PLA2G6 | |
| KEGG: PLA2G6 | ||
| REACTOME: PLA2G6 | ||
| ConsensusPathDB | ||
| Pathway Commons: PLA2G6 | ||
| Metabolism | MetaCyc: PLA2G6 | |
| HUMANCyc: PLA2G6 | ||
| Regulation | Ensembl's Regulation: ENSG00000184381 | |
| miRBase: chr22 :38,507,501-38,577,761 | ||
| TargetScan: NM_001004426 | ||
| cisRED: ENSG00000184381 | ||
| Context | iHOP: PLA2G6 | |
| cancer metabolism search in PubMed: PLA2G6 | ||
| UCL Cancer Institute: PLA2G6 | ||
| Assigned class in ccmGDB | C | |
| Top |
| Phenotypic Information for PLA2G6(metabolism pathway, cancer, disease, phenome) |
| Cancer | CGAP: PLA2G6 |
| Familial Cancer Database: PLA2G6 | |
| * This gene is included in those cancer gene databases. |
|
|
|
|
|
| . | |||||||||||||||||||||||||||||||||||||||||||||||||||||||||||||||||||||||||||||||||||||||||||||||||||||||||||||||||||||||||||||||||||||||||||||||||||||||||||||||||||||||||||||||||||||||||||||||||||||||||||||||||||||||||||||||||||||||||||||||||||||||||||||||||||||||||||||||||||||||||||||||||||||||||||||||||||||||||||||||||||||||
Oncogene 1 | Significant driver gene in | ||||||||||||||||||||||||||||||||||||||||||||||||||||||||||||||||||||||||||||||||||||||||||||||||||||||||||||||||||||||||||||||||||||||||||||||||||||||||||||||||||||||||||||||||||||||||||||||||||||||||||||||||||||||||||||||||||||||||||||||||||||||||||||||||||||||||||||||||||||||||||||||||||||||||||||||||||||||||||||||||||||||||||||
| cf) number; DB name 1 Oncogene; http://nar.oxfordjournals.org/content/35/suppl_1/D721.long, 2 Tumor Suppressor gene; https://bioinfo.uth.edu/TSGene/, 3 Cancer Gene Census; http://www.nature.com/nrc/journal/v4/n3/abs/nrc1299.html, 4 CancerGenes; http://nar.oxfordjournals.org/content/35/suppl_1/D721.long, 5 Network of Cancer Gene; http://ncg.kcl.ac.uk/index.php, 1Therapeutic Vulnerabilities in Cancer; http://cbio.mskcc.org/cancergenomics/statius/ |
| KEGG_GLYCEROPHOSPHOLIPID_METABOLISM KEGG_ARACHIDONIC_ACID_METABOLISM KEGG_LINOLEIC_ACID_METABOLISM KEGG_ALPHA_LINOLENIC_ACID_METABOLISM KEGG_FC_GAMMA_R_MEDIATED_PHAGOCYTOSIS REACTOME_PHOSPHOLIPID_METABOLISM REACTOME_METABOLISM_OF_LIPIDS_AND_LIPOPROTEINS | |
| OMIM | |
| Orphanet | |
| Disease | KEGG Disease: PLA2G6 |
| MedGen: PLA2G6 (Human Medical Genetics with Condition) | |
| ClinVar: PLA2G6 | |
| Phenotype | MGI: PLA2G6 (International Mouse Phenotyping Consortium) |
| PhenomicDB: PLA2G6 | |
| Mutations for PLA2G6 |
| * Under tables are showing count per each tissue to give us broad intuition about tissue specific mutation patterns.You can go to the detailed page for each mutation database's web site. |
| - Statistics for Tissue and Mutation type | Top |
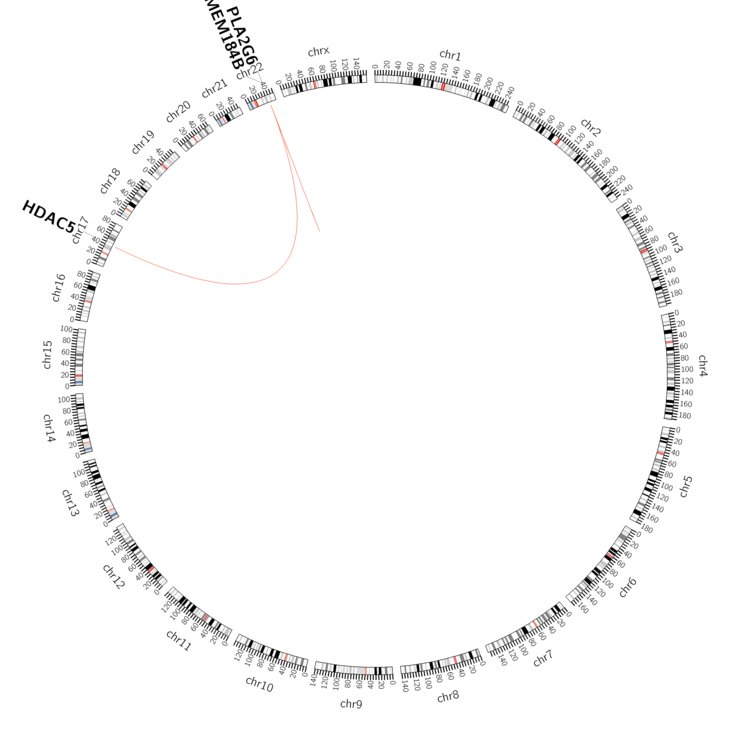 |
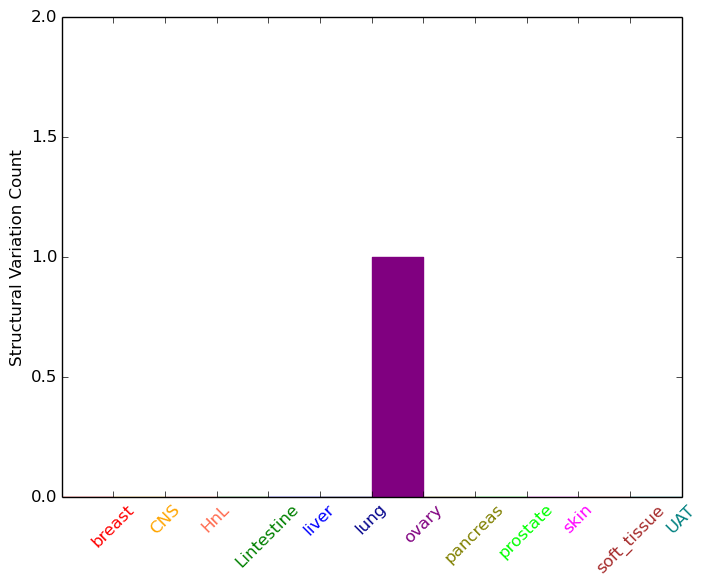
| - For Inter-chromosomal Variations |
| * Inter-chromosomal variantions includes 'interchromosomal amplicon to amplicon', 'interchromosomal amplicon to non-amplified dna', 'interchromosomal insertion', 'Interchromosomal unknown type'. |
 |
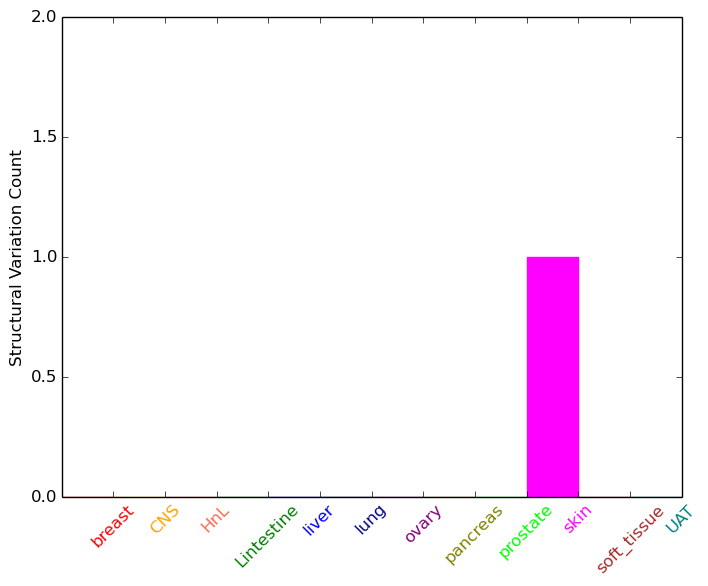
| - For Intra-chromosomal Variations |
| * Intra-chromosomal variantions includes 'intrachromosomal amplicon to amplicon', 'intrachromosomal amplicon to non-amplified dna', 'intrachromosomal deletion', 'intrachromosomal fold-back inversion', 'intrachromosomal inversion', 'intrachromosomal tandem duplication', 'Intrachromosomal unknown type', 'intrachromosomal with inverted orientation', 'intrachromosomal with non-inverted orientation'. |
 |
| Sample | Symbol_a | Chr_a | Start_a | End_a | Symbol_b | Chr_b | Start_b | End_b |
| skin | PLA2G6 | chr22 | 38514511 | 38514511 | TMEM184B | chr22 | 38643616 | 38643616 |
| cf) Tissue number; Tissue name (1;Breast, 2;Central_nervous_system, 3;Haematopoietic_and_lymphoid_tissue, 4;Large_intestine, 5;Liver, 6;Lung, 7;Ovary, 8;Pancreas, 9;Prostate, 10;Skin, 11;Soft_tissue, 12;Upper_aerodigestive_tract) |
| * From mRNA Sanger sequences, Chitars2.0 arranged chimeric transcripts. This table shows PLA2G6 related fusion information. |
| ID | Head Gene | Tail Gene | Accession | Gene_a | qStart_a | qEnd_a | Chromosome_a | tStart_a | tEnd_a | Gene_a | qStart_a | qEnd_a | Chromosome_a | tStart_a | tEnd_a |
| CV375307 | PLA2G6 | 2 | 99 | 22 | 38560565 | 38560662 | CLTCL1 | 97 | 240 | 22 | 19228368 | 19228511 | |
| BQ300191 | PLA2G6 | 10 | 229 | 22 | 38523889 | 38524110 | MAP4 | 217 | 360 | 3 | 47917174 | 47917317 | |
| BF871762 | SYT7 | 1 | 301 | 11 | 61300111 | 61300411 | PLA2G6 | 291 | 373 | 22 | 38522251 | 38522333 | |
| CV375347 | CLTCL1 | 83 | 226 | 22 | 19228368 | 19228511 | PLA2G6 | 223 | 248 | 22 | 38560516 | 38560541 | |
| Top |
| Mutation type/ Tissue ID | brca | cns | cerv | endome | haematopo | kidn | Lintest | liver | lung | ns | ovary | pancre | prost | skin | stoma | thyro | urina | |||
| Total # sample | 1 | 2 | ||||||||||||||||||
| GAIN (# sample) | 1 | 2 | ||||||||||||||||||
| LOSS (# sample) |
| cf) Tissue ID; Tissue type (1; Breast, 2; Central_nervous_system, 3; Cervix, 4; Endometrium, 5; Haematopoietic_and_lymphoid_tissue, 6; Kidney, 7; Large_intestine, 8; Liver, 9; Lung, 10; NS, 11; Ovary, 12; Pancreas, 13; Prostate, 14; Skin, 15; Stomach, 16; Thyroid, 17; Urinary_tract) |
| Top |
|
 |
| Top |
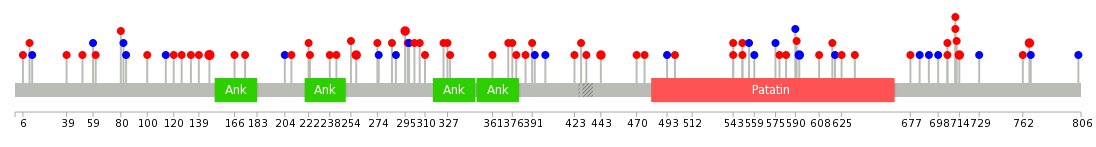
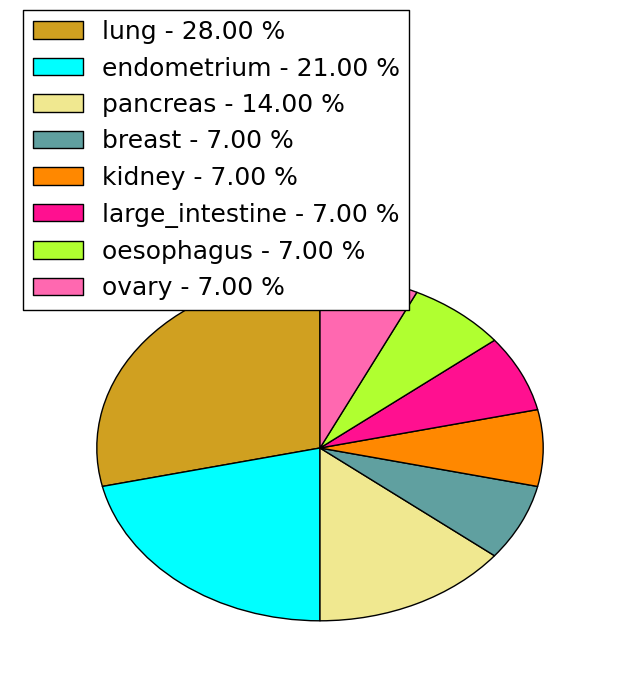
| Stat. for Non-Synonymous SNVs (# total SNVs=51) | (# total SNVs=14) |
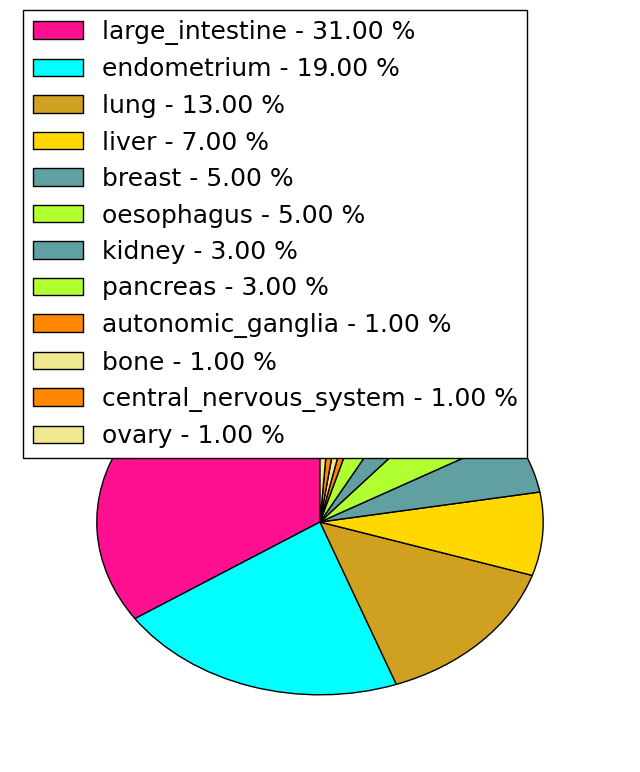 |  |
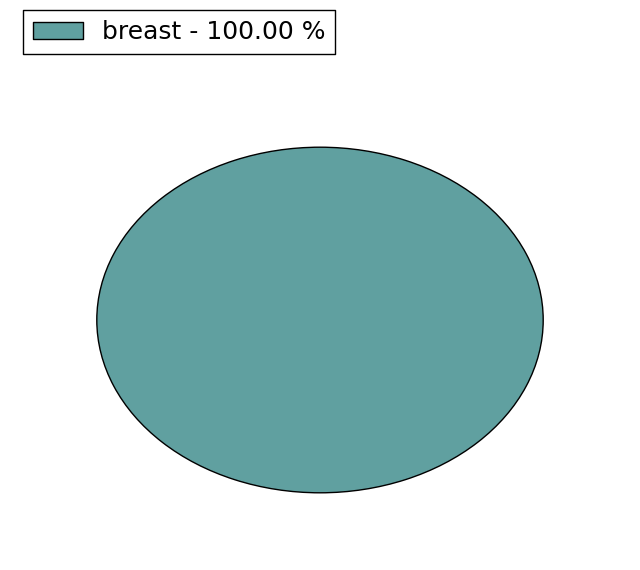
(# total SNVs=2) | (# total SNVs=0) |
 |
| Top |
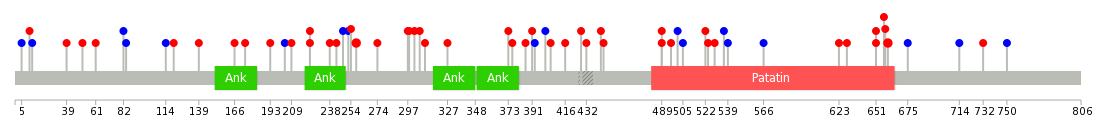
| * When you move the cursor on each content, you can see more deailed mutation information on the Tooltip. Those are primary_site,primary_histology,mutation(aa),pubmedID. |
| GRCh37 position | Mutation(aa) | Unique sampleID count |
| chr22:38539282-38539282 | p.A147T | 3 |
| chr22:38509556-38509556 | p.P714S | 2 |
| chr22:38524296-38524296 | p.P443L | 2 |
| chr22:38531004-38531004 | p.K295N | 2 |
| chr22:38512182-38512182 | p.P593P | 2 |
| chr22:38508290-38508290 | p.D767H | 2 |
| chr22:38536013-38536013 | p.S258L | 2 |
| chr22:38528987-38528987 | p.V310M | 1 |
| chr22:38565283-38565283 | p.P51S | 1 |
| chr22:38512192-38512210 | p.L584fs*76 | 1 |
| Top |
|
 |
| Point Mutation/ Tissue ID | 1 | 2 | 3 | 4 | 5 | 6 | 7 | 8 | 9 | 10 | 11 | 12 | 13 | 14 | 15 | 16 | 17 | 18 | 19 | 20 |
| # sample | 2 | 2 | 9 | 1 | 1 | 1 | 3 | 4 | 5 | 1 | 16 | 5 | 12 | |||||||
| # mutation | 2 | 2 | 9 | 1 | 1 | 2 | 3 | 4 | 5 | 1 | 17 | 5 | 13 | |||||||
| nonsynonymous SNV | 1 | 1 | 8 | 1 | 1 | 1 | 2 | 2 | 5 | 1 | 9 | 5 | 10 | |||||||
| synonymous SNV | 1 | 1 | 1 | 1 | 1 | 2 | 8 | 3 |
| cf) Tissue ID; Tissue type (1; BLCA[Bladder Urothelial Carcinoma], 2; BRCA[Breast invasive carcinoma], 3; CESC[Cervical squamous cell carcinoma and endocervical adenocarcinoma], 4; COAD[Colon adenocarcinoma], 5; GBM[Glioblastoma multiforme], 6; Glioma Low Grade, 7; HNSC[Head and Neck squamous cell carcinoma], 8; KICH[Kidney Chromophobe], 9; KIRC[Kidney renal clear cell carcinoma], 10; KIRP[Kidney renal papillary cell carcinoma], 11; LAML[Acute Myeloid Leukemia], 12; LUAD[Lung adenocarcinoma], 13; LUSC[Lung squamous cell carcinoma], 14; OV[Ovarian serous cystadenocarcinoma ], 15; PAAD[Pancreatic adenocarcinoma], 16; PRAD[Prostate adenocarcinoma], 17; SKCM[Skin Cutaneous Melanoma], 18:STAD[Stomach adenocarcinoma], 19:THCA[Thyroid carcinoma], 20:UCEC[Uterine Corpus Endometrial Carcinoma]) |
| Top |
| * We represented just top 10 SNVs. When you move the cursor on each content, you can see more deailed mutation information on the Tooltip. Those are primary_site, primary_histology, mutation(aa), pubmedID. |
| Genomic Position | Mutation(aa) | Unique sampleID count |
| chr22:38536013 | p.S258L,PLA2G6 | 2 |
| chr22:38509556 | p.P660S,PLA2G6 | 2 |
| chr22:38541624 | p.A445T,PLA2G6 | 1 |
| chr22:38524328 | p.E298D,PLA2G6 | 1 |
| chr22:38529009 | p.R139H,PLA2G6 | 1 |
| chr22:38509561 | p.P657L,PLA2G6 | 1 |
| chr22:38536119 | p.M416I,PLA2G6 | 1 |
| chr22:38516781 | p.A297S,PLA2G6 | 1 |
| chr22:38565252 | p.W120C,PLA2G6 | 1 |
| chr22:38524341 | p.C651Y,PLA2G6 | 1 |
| * Copy number data were extracted from TCGA using R package TCGA-Assembler. The URLs of all public data files on TCGA DCC data server were gathered on Jan-05-2015. Function ProcessCNAData in TCGA-Assembler package was used to obtain gene-level copy number value which is calculated as the average copy number of the genomic region of a gene. |
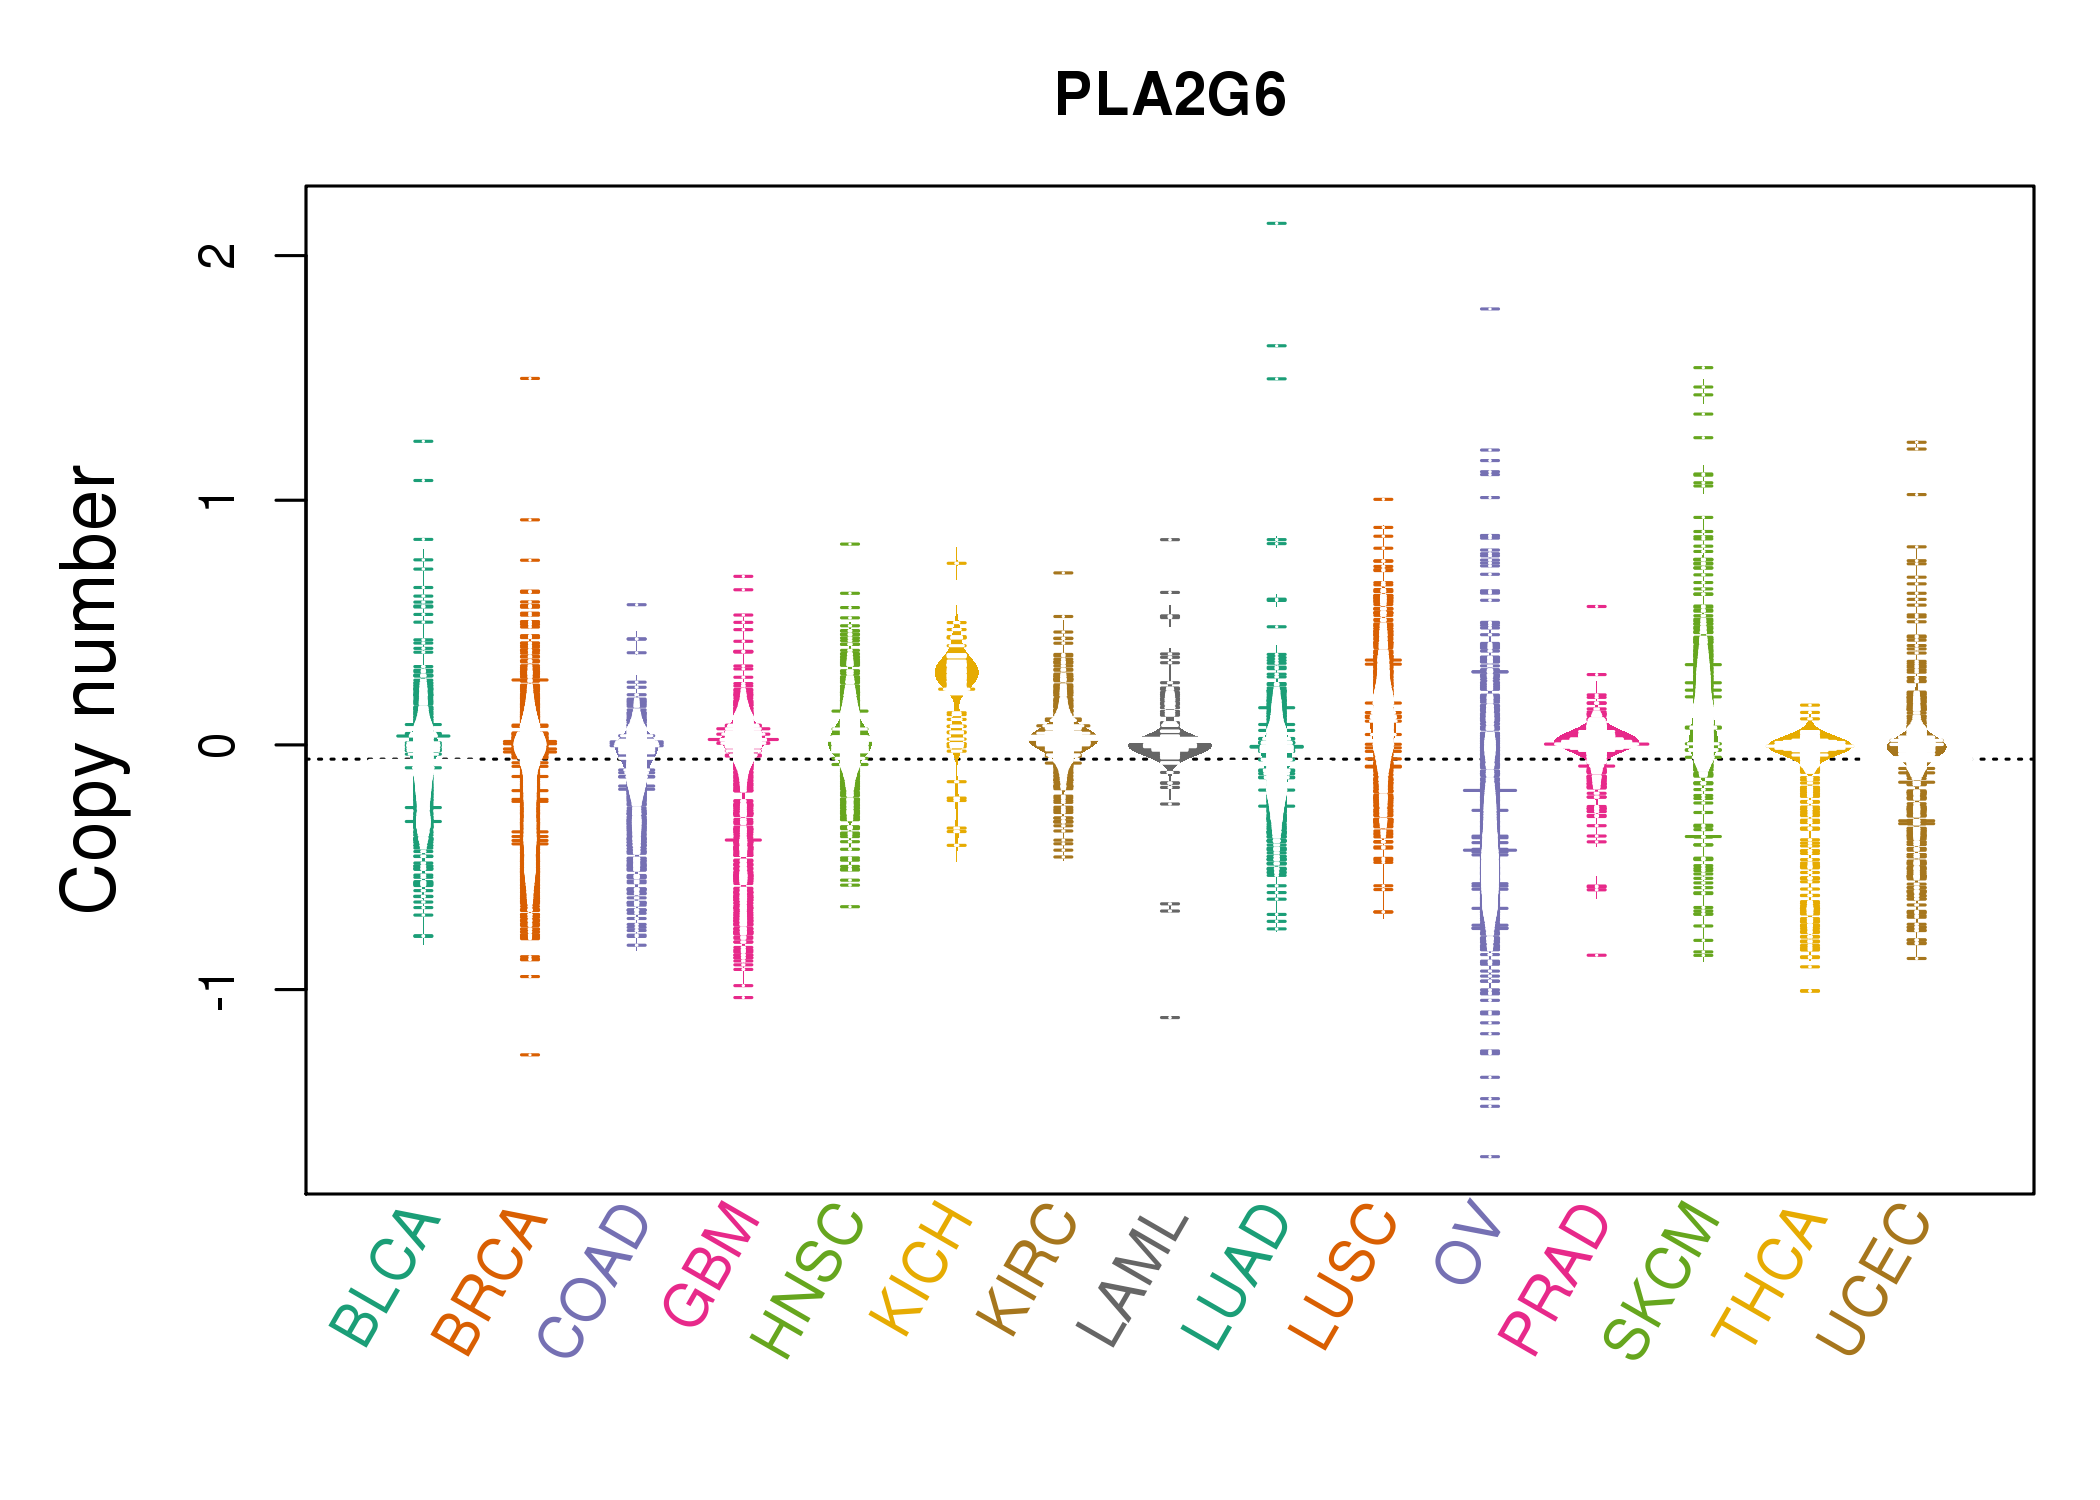 |
| cf) Tissue ID[Tissue type]: BLCA[Bladder Urothelial Carcinoma], BRCA[Breast invasive carcinoma], CESC[Cervical squamous cell carcinoma and endocervical adenocarcinoma], COAD[Colon adenocarcinoma], GBM[Glioblastoma multiforme], Glioma Low Grade, HNSC[Head and Neck squamous cell carcinoma], KICH[Kidney Chromophobe], KIRC[Kidney renal clear cell carcinoma], KIRP[Kidney renal papillary cell carcinoma], LAML[Acute Myeloid Leukemia], LUAD[Lung adenocarcinoma], LUSC[Lung squamous cell carcinoma], OV[Ovarian serous cystadenocarcinoma ], PAAD[Pancreatic adenocarcinoma], PRAD[Prostate adenocarcinoma], SKCM[Skin Cutaneous Melanoma], STAD[Stomach adenocarcinoma], THCA[Thyroid carcinoma], UCEC[Uterine Corpus Endometrial Carcinoma] |
| Top |
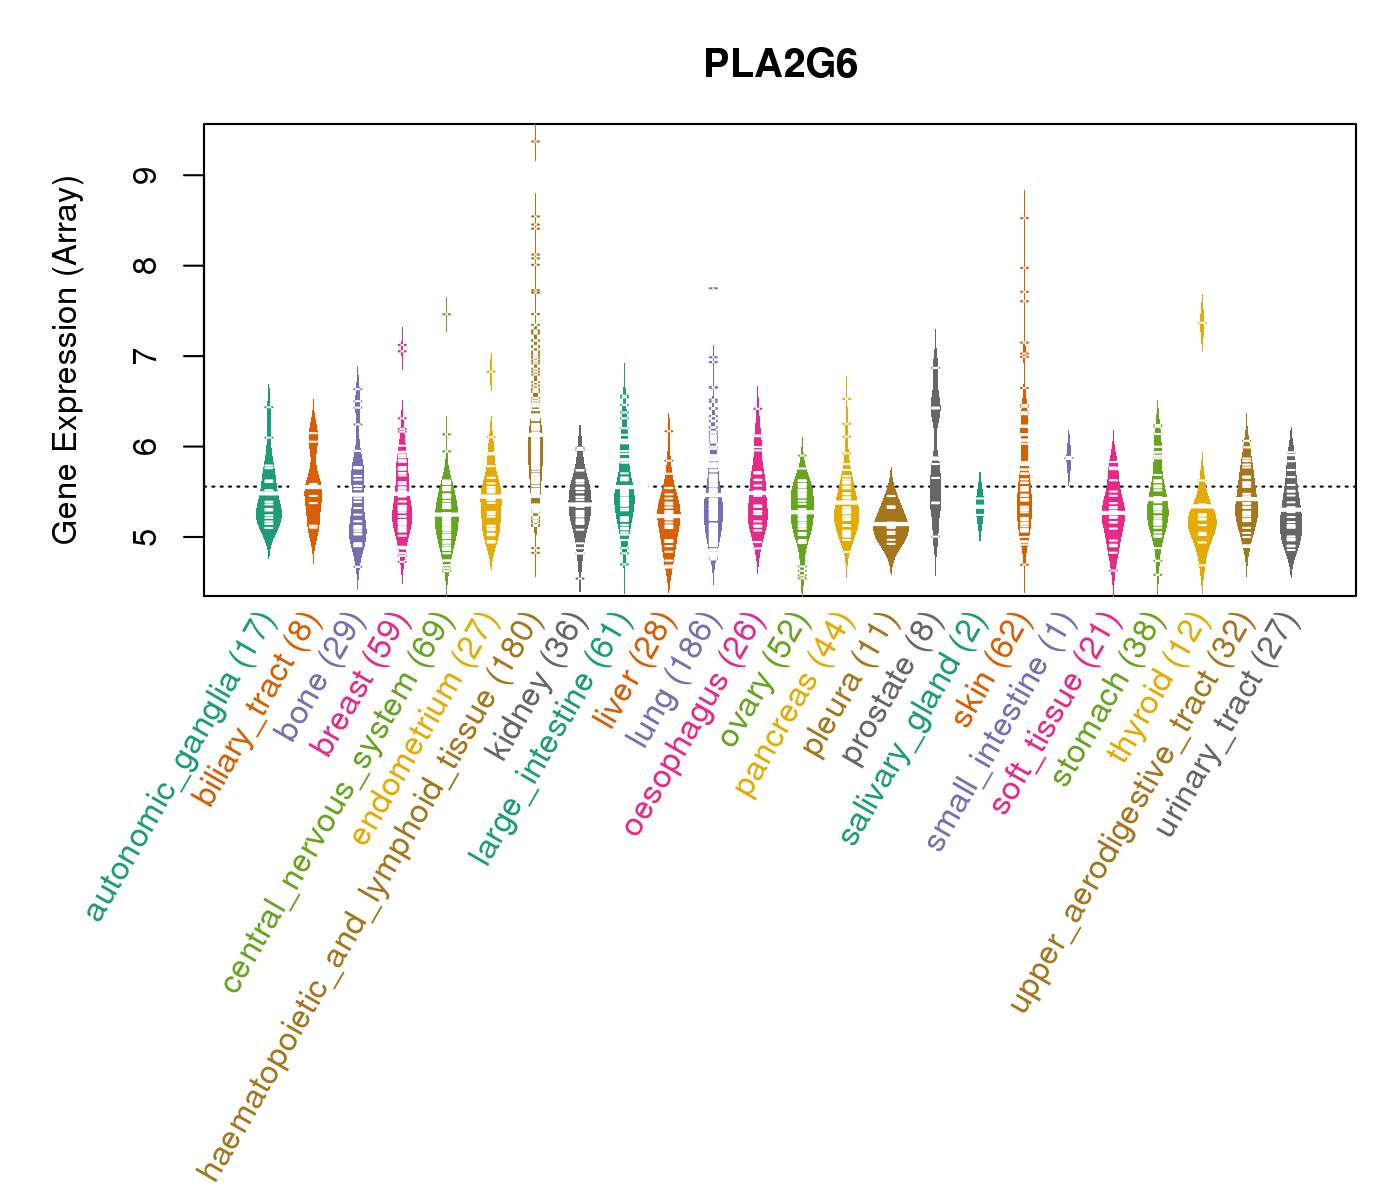
| Gene Expression for PLA2G6 |
| * CCLE gene expression data were extracted from CCLE_Expression_Entrez_2012-10-18.res: Gene-centric RMA-normalized mRNA expression data. |
 |
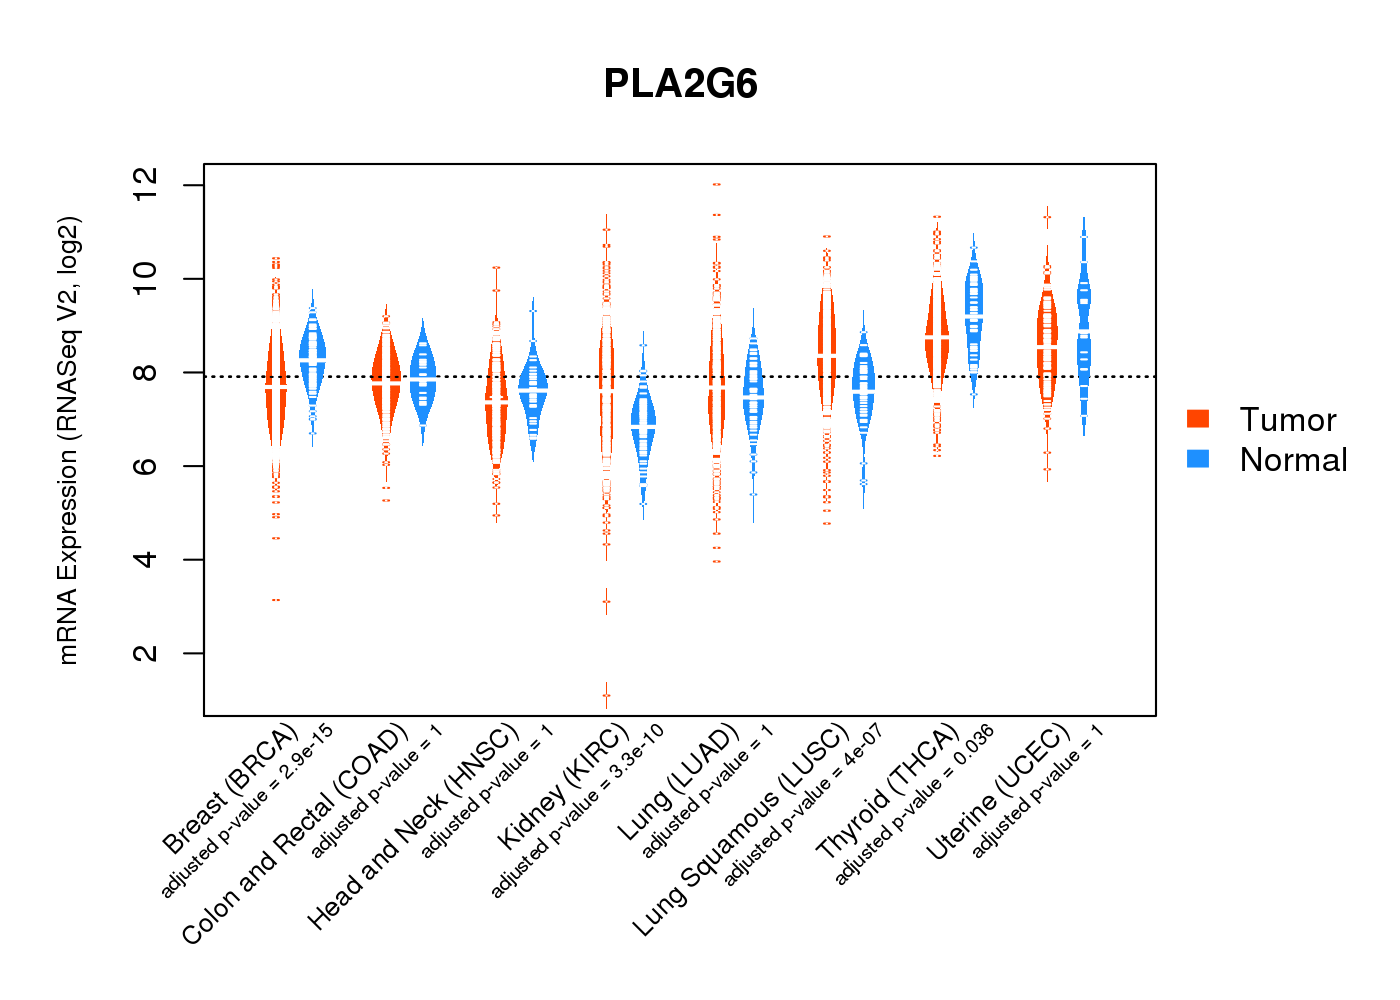
| * Normalized gene expression data of RNASeqV2 was extracted from TCGA using R package TCGA-Assembler. The URLs of all public data files on TCGA DCC data server were gathered at Jan-05-2015. Only eight cancer types have enough normal control samples for differential expression analysis. (t test, adjusted p<0.05 (using Benjamini-Hochberg FDR)) |
 |
| Top |
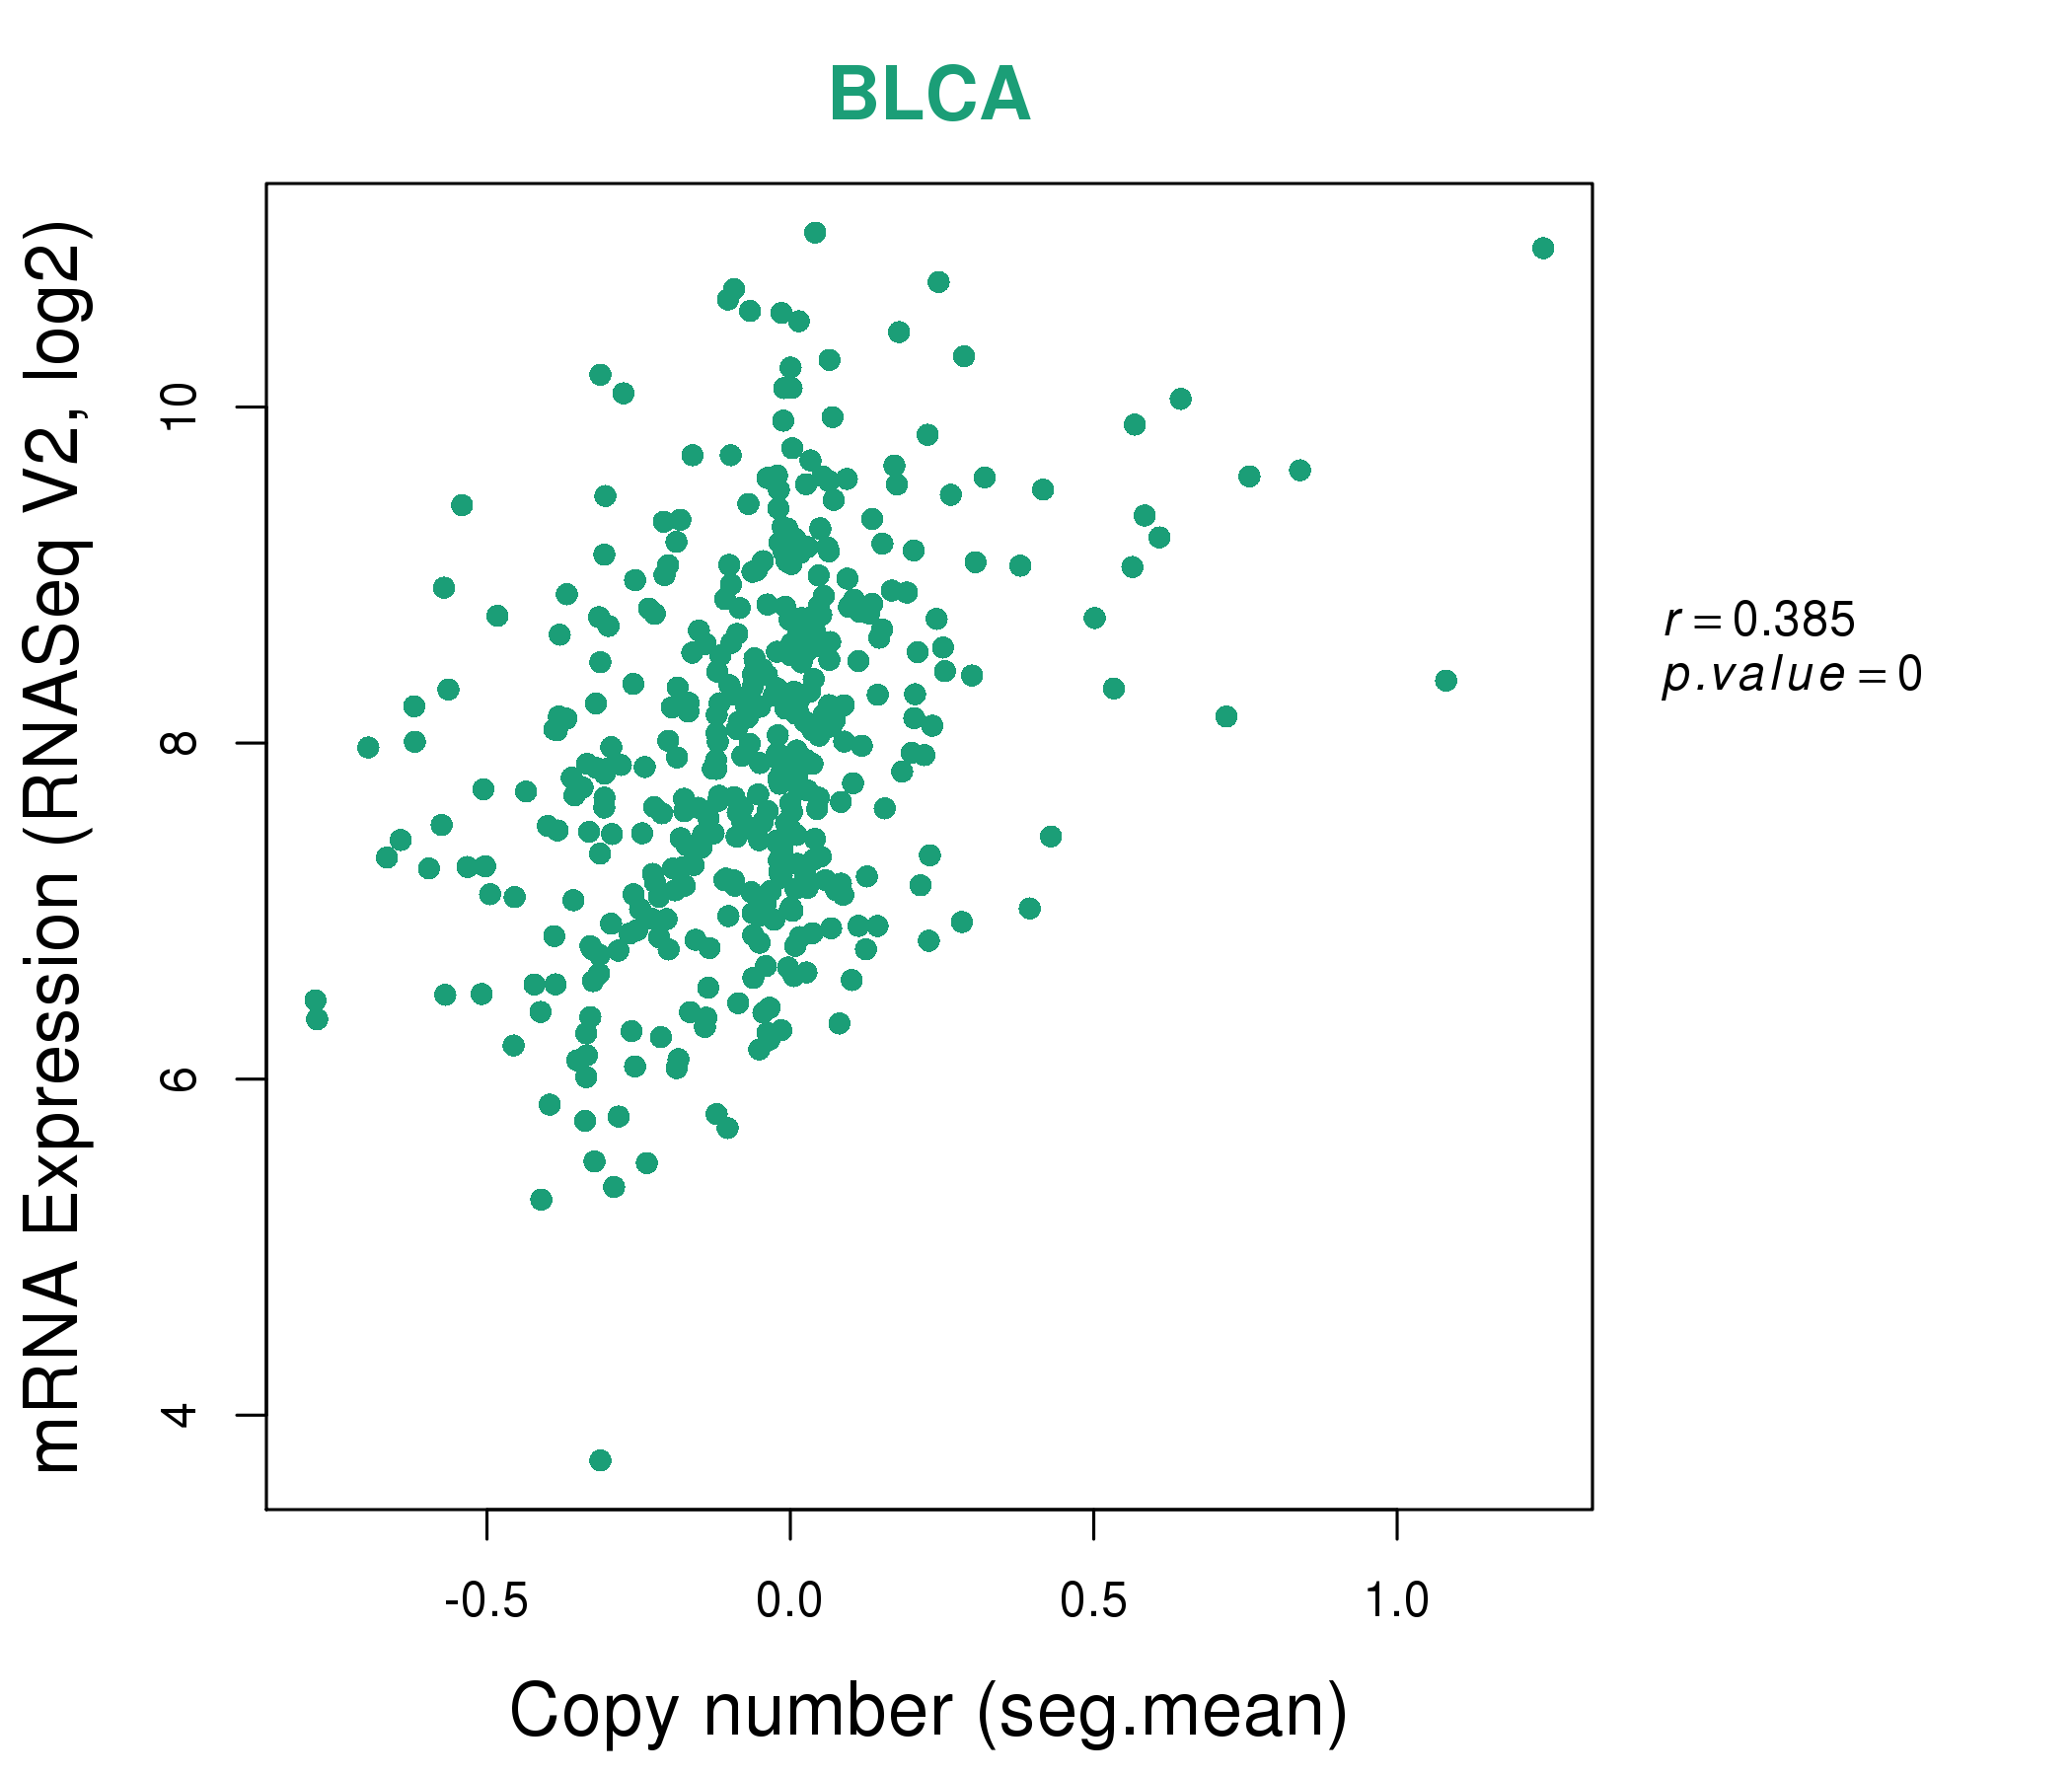
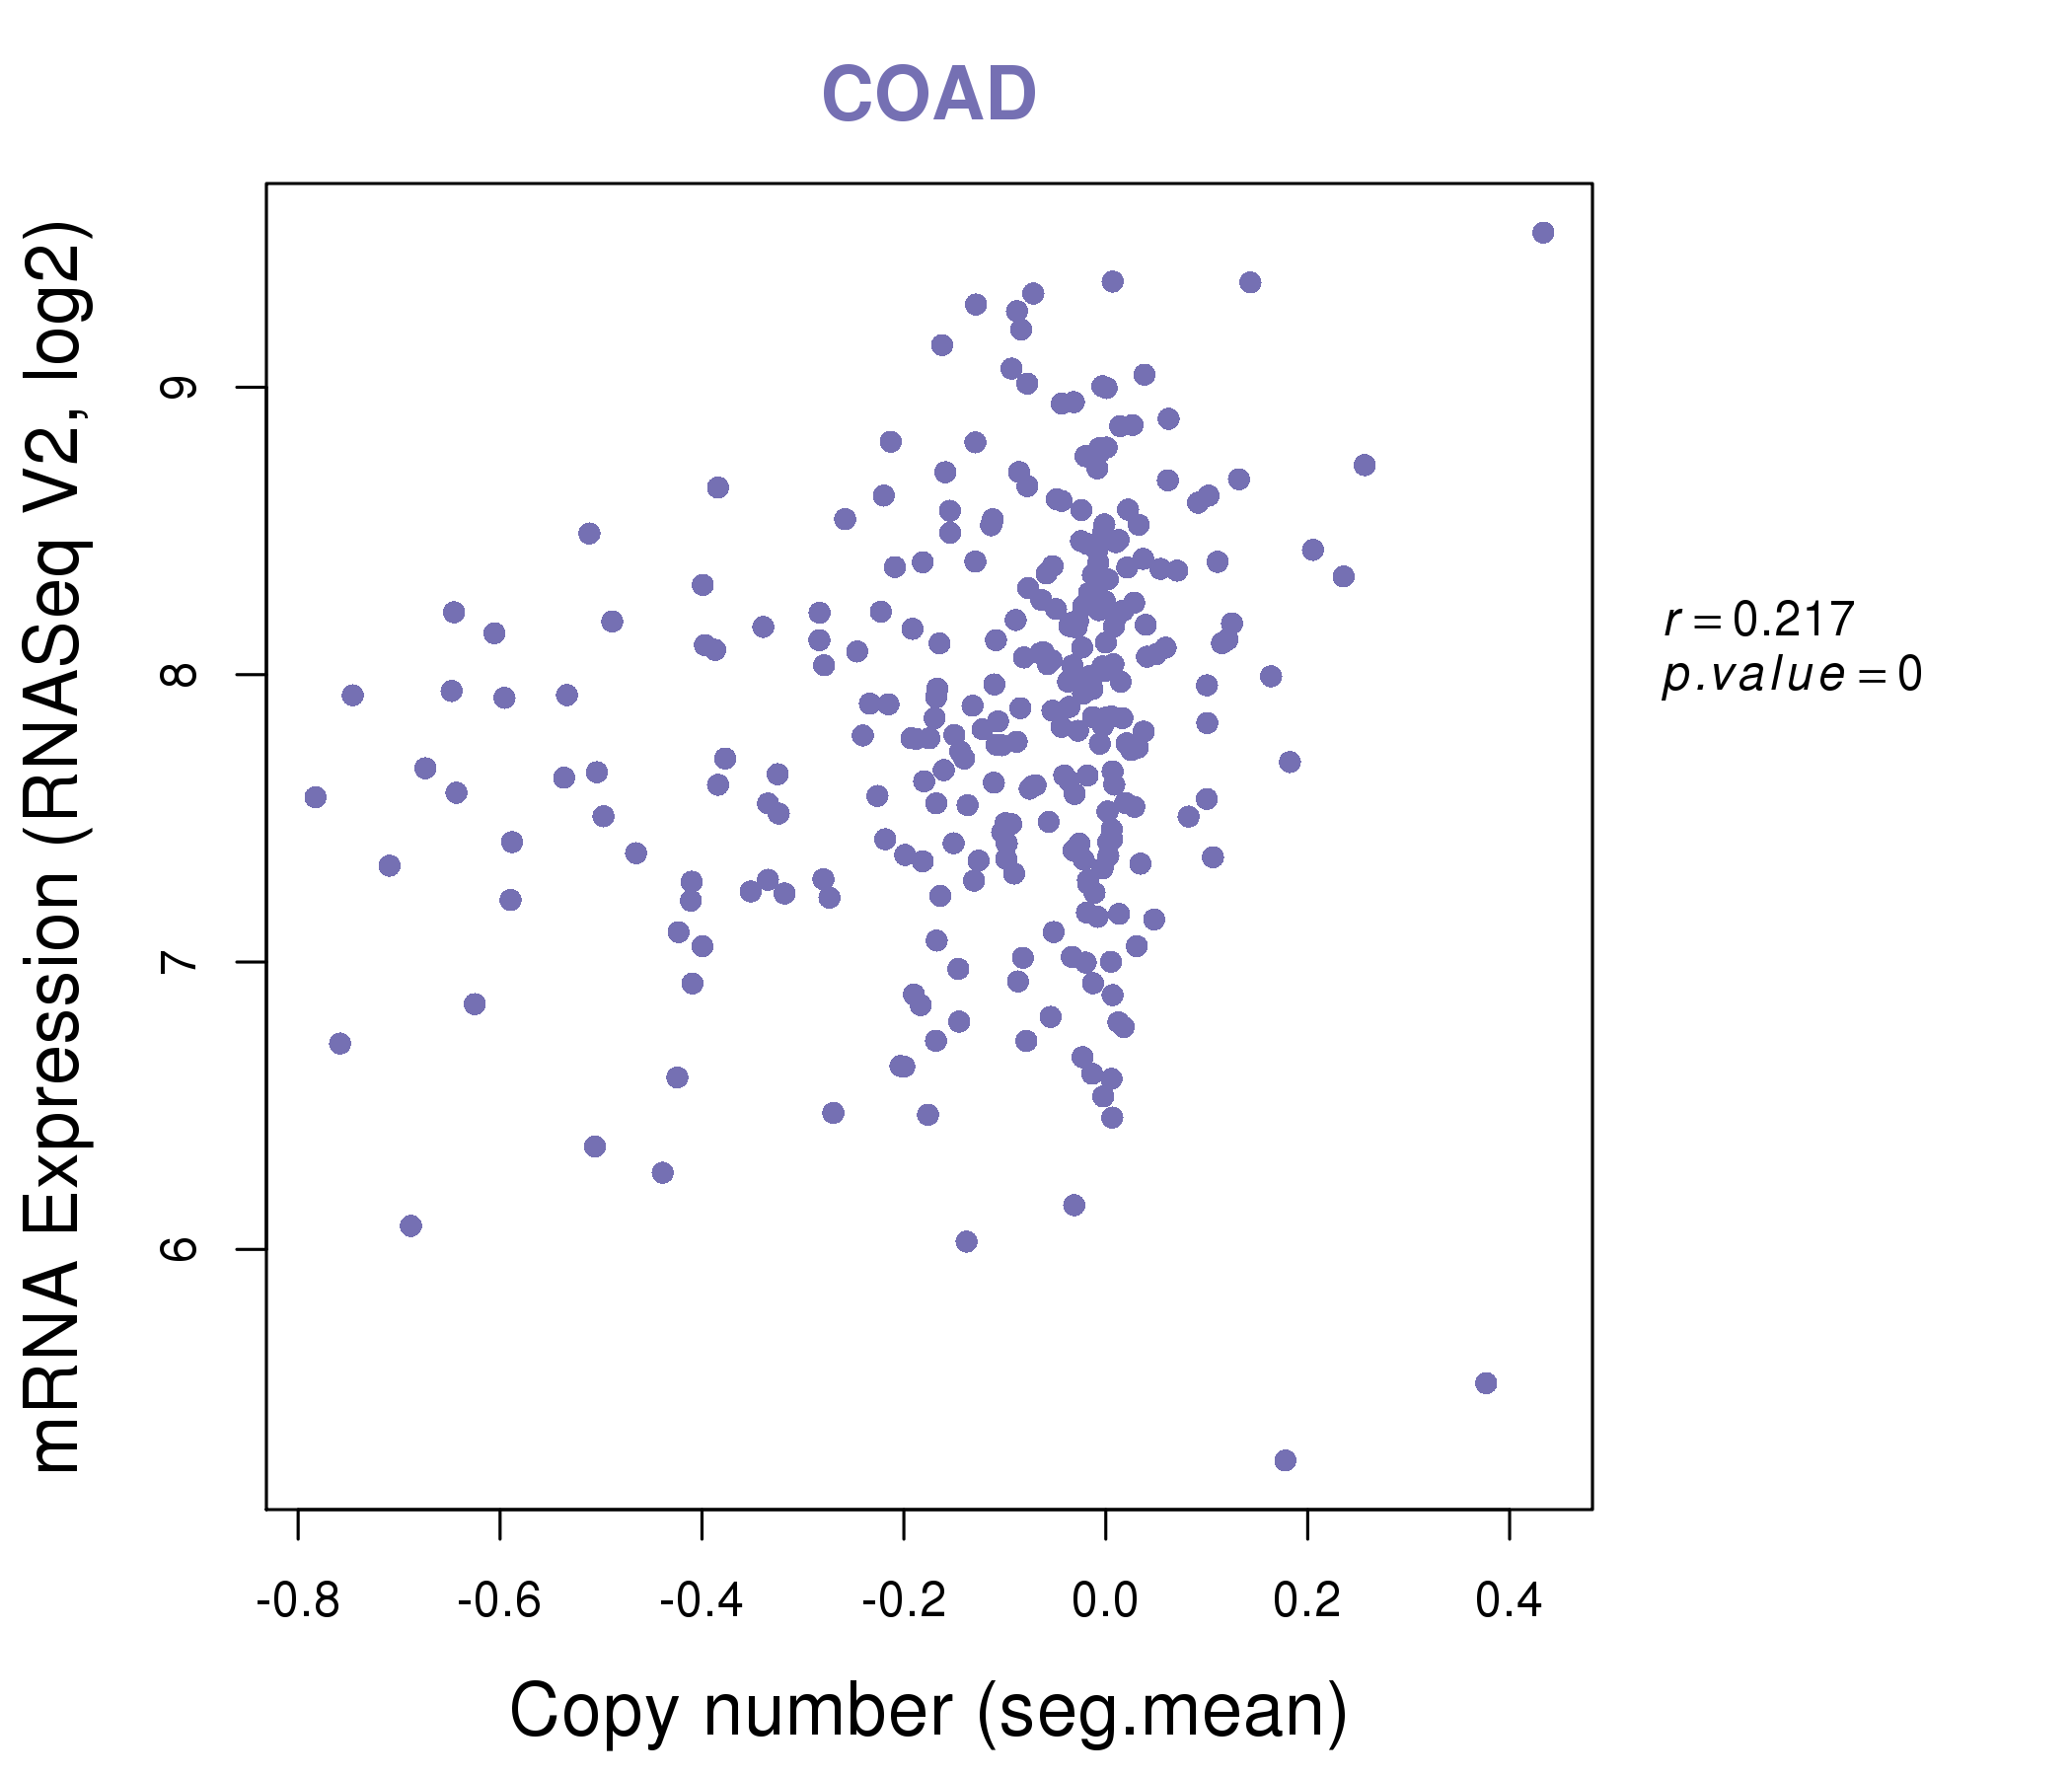
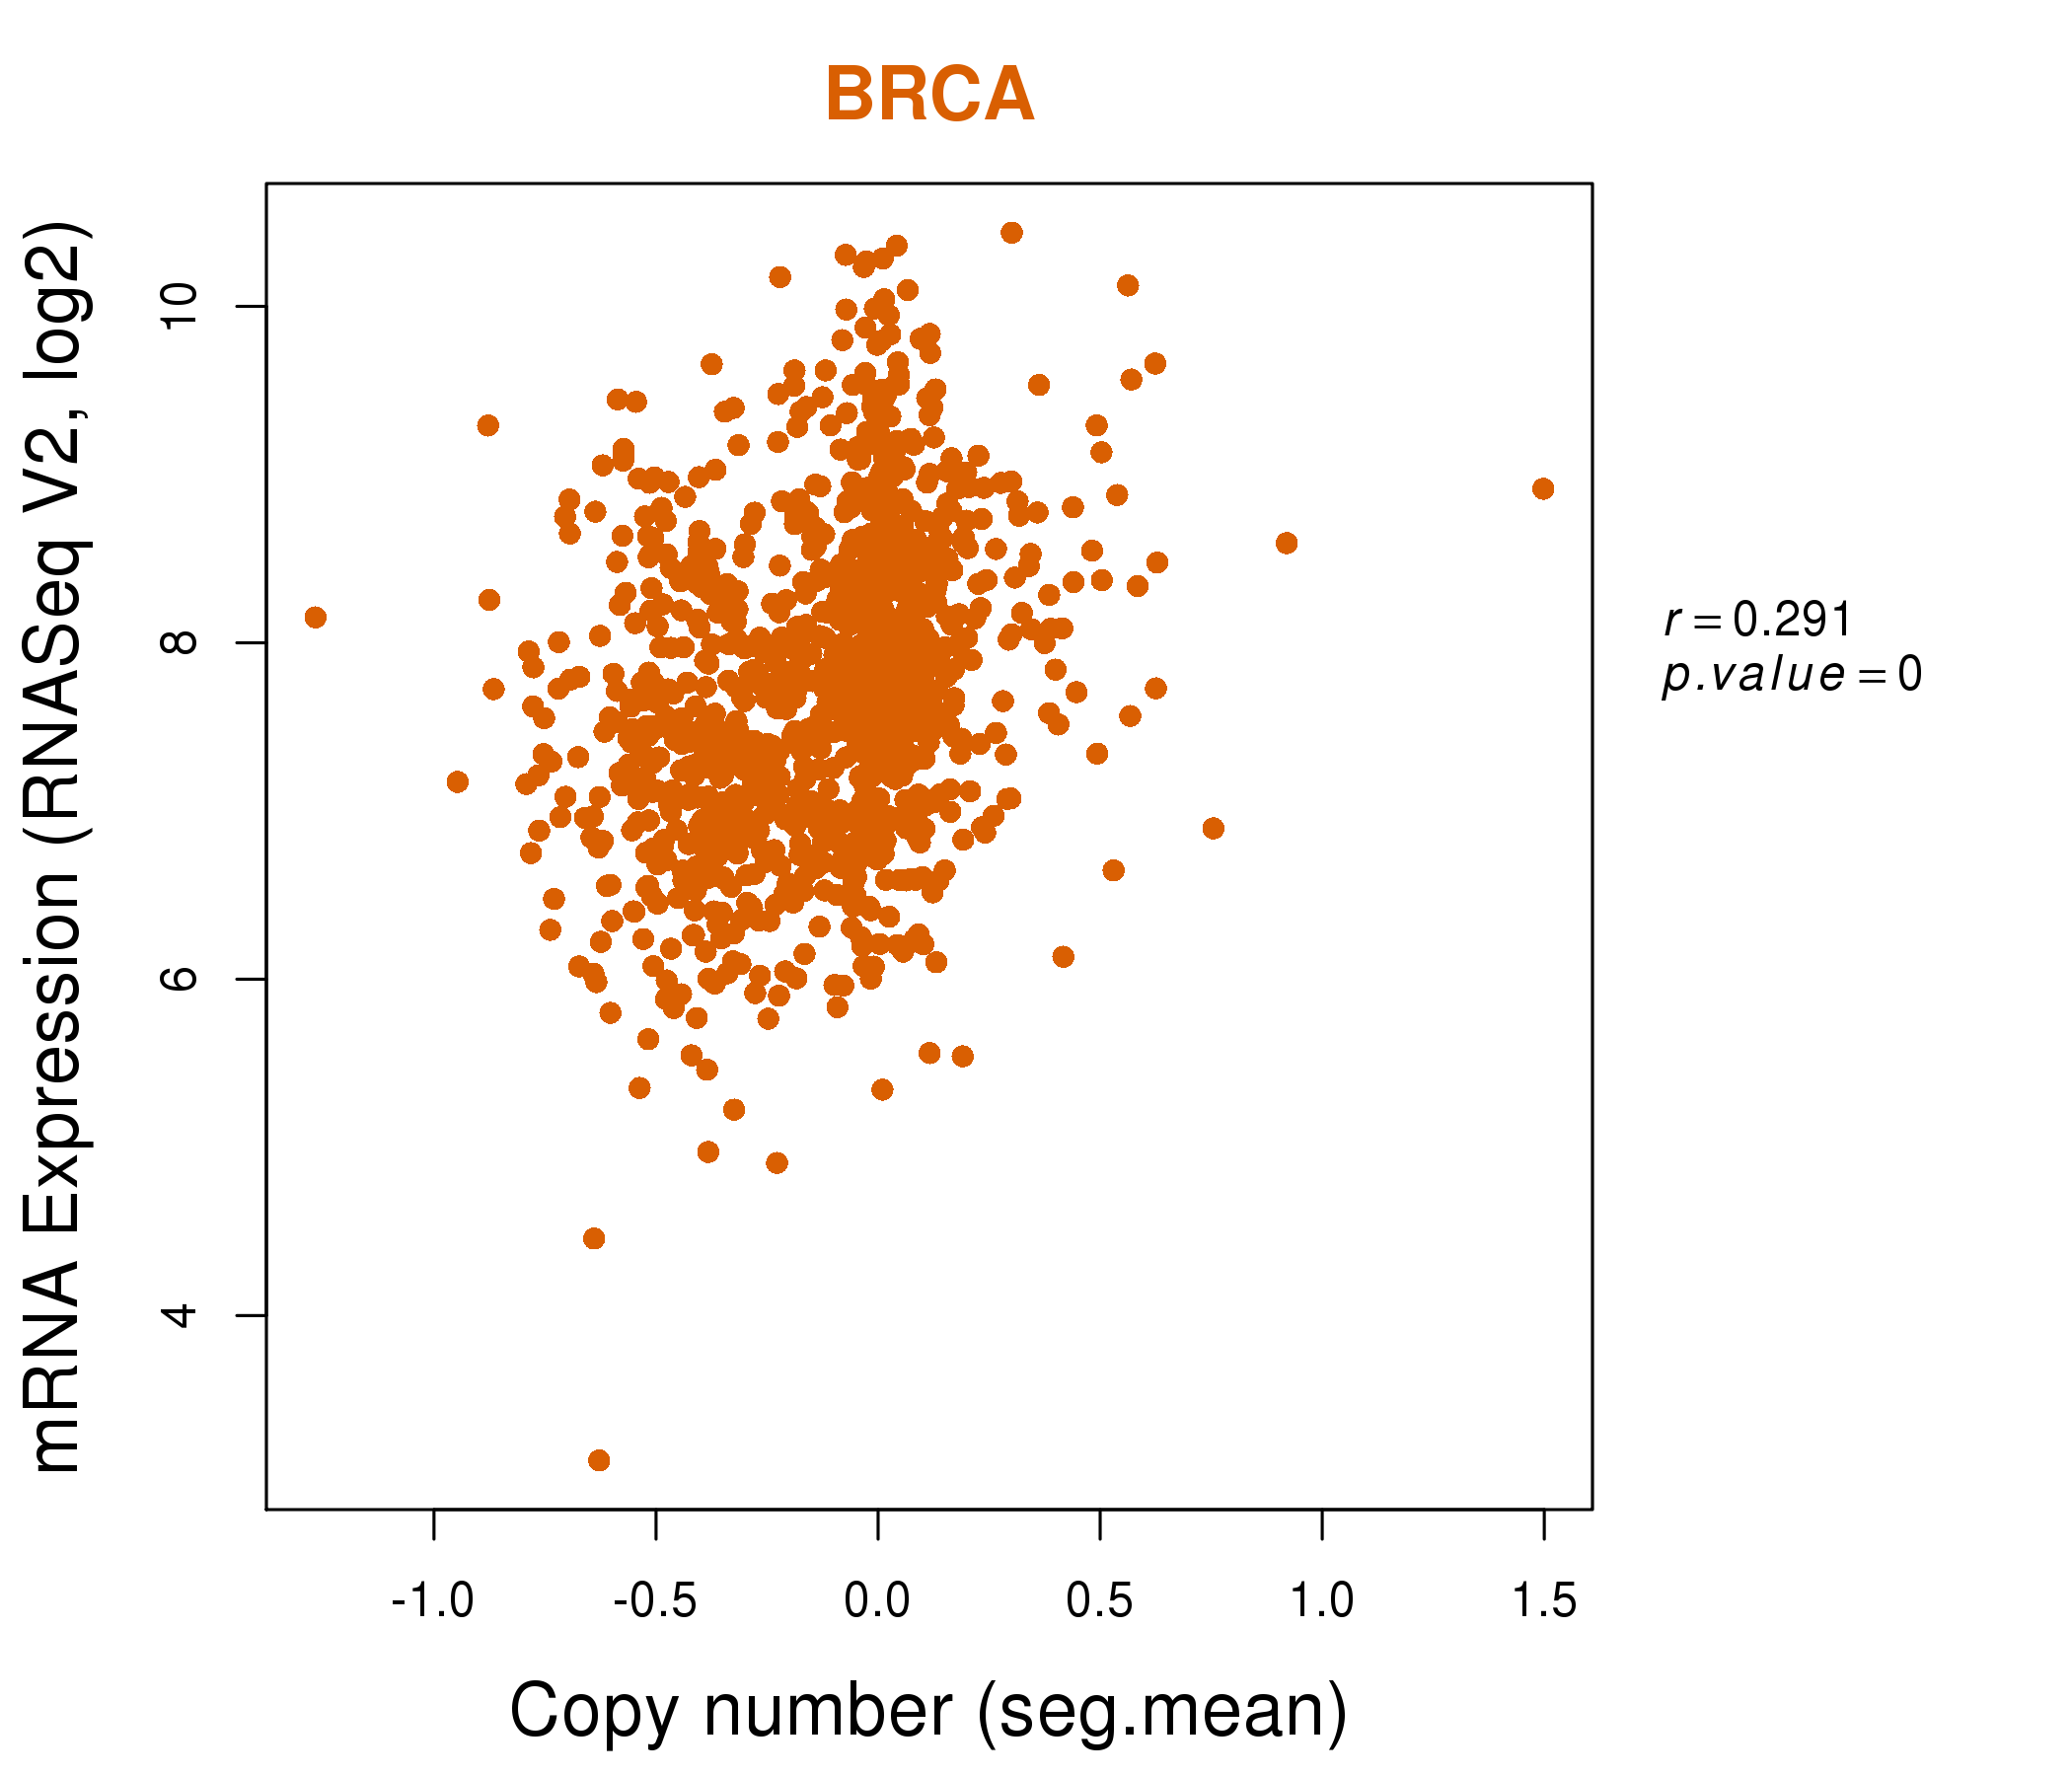
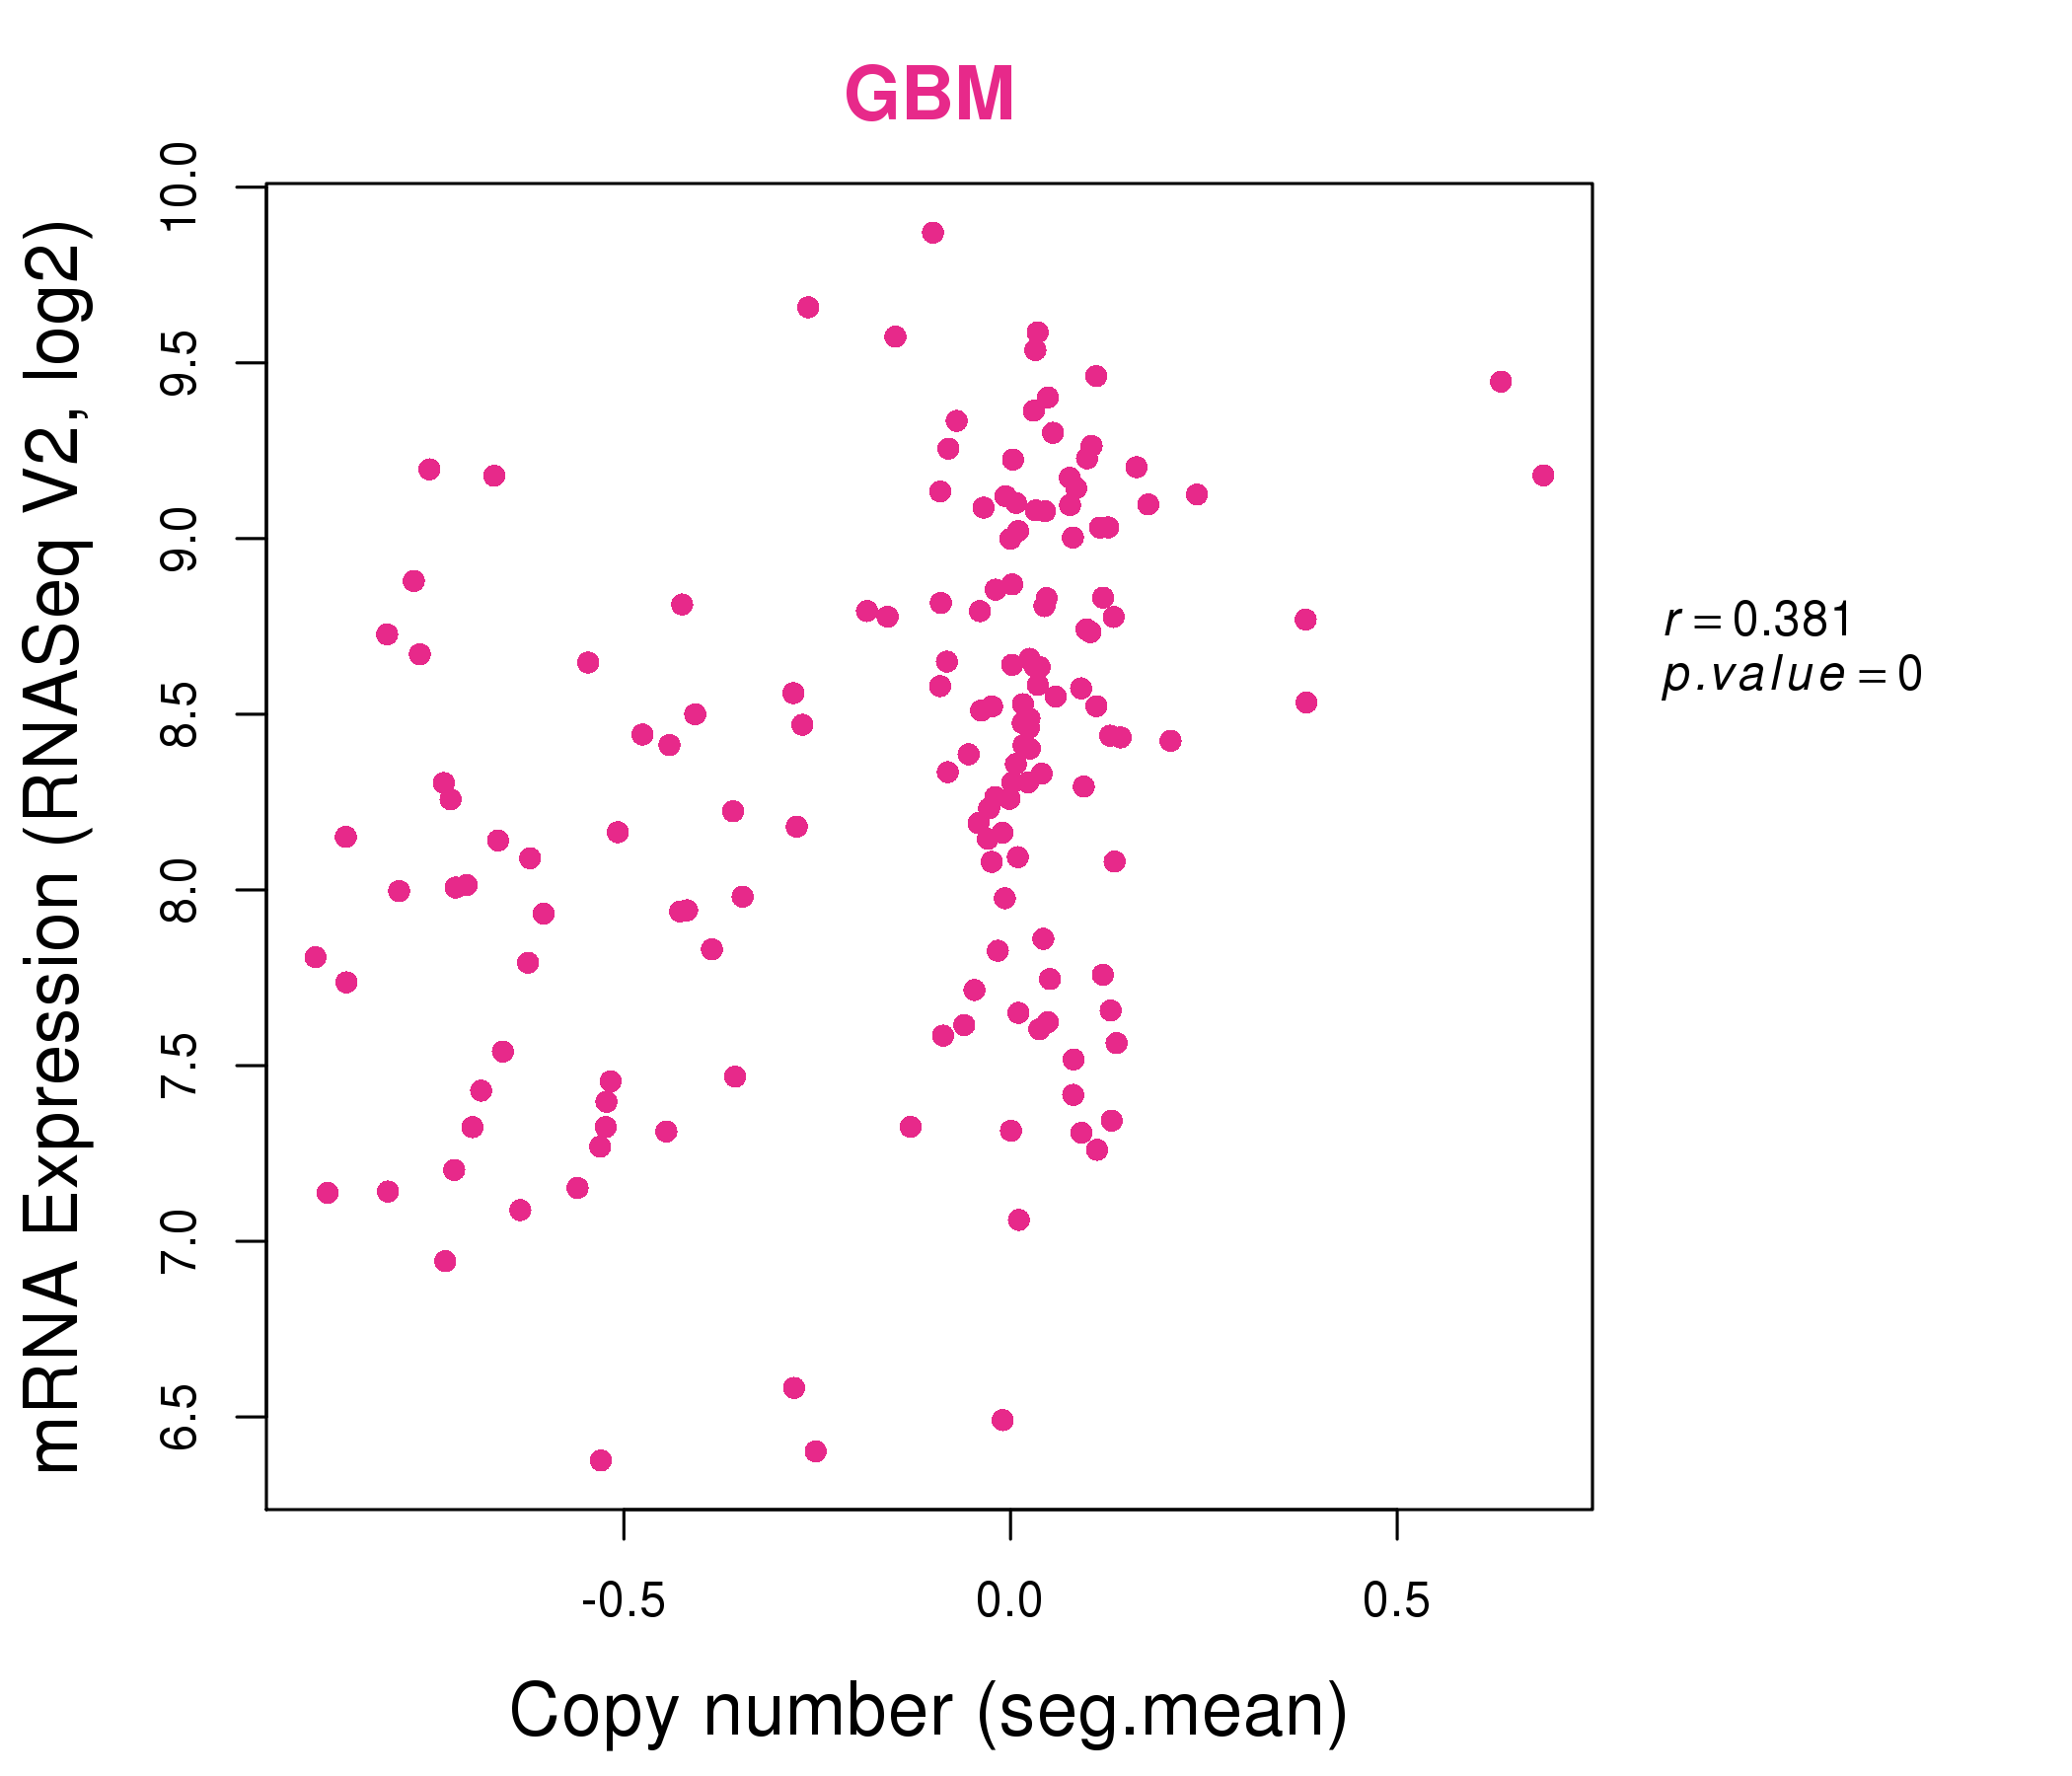
| * This plots show the correlation between CNV and gene expression. |
: Open all plots for all cancer types
 |
|
 |
|
| Top |
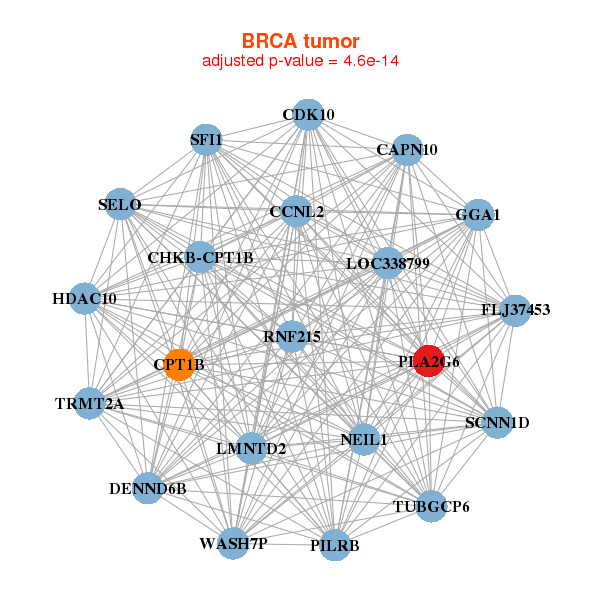
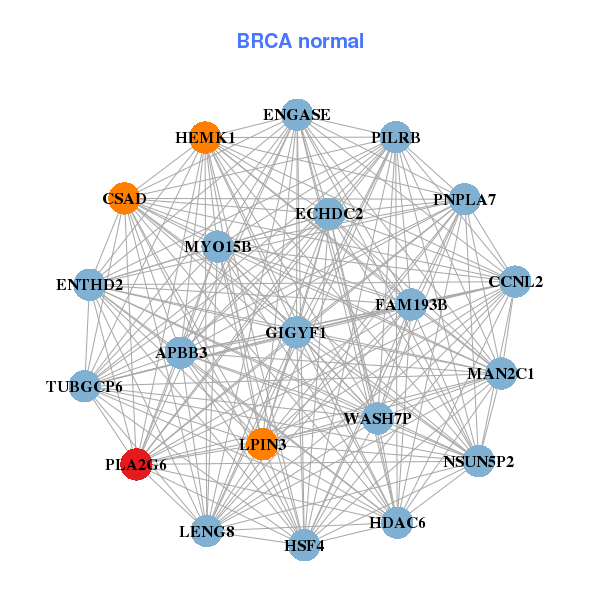
| Gene-Gene Network Information |
| * Co-Expression network figures were drawn using R package igraph. Only the top 20 genes with the highest correlations were shown. Red circle: input gene, orange circle: cell metabolism gene, sky circle: other gene |
: Open all plots for all cancer types
 |
| ||||
| LMNTD2,CAPN10,CCNL2,CDK10,CHKB-CPT1B,CPT1B,DENND6B, FLJ37453,GGA1,HDAC10,LOC338799,NEIL1,PILRB,PLA2G6, RNF215,SCNN1D,SELO,SFI1,TRMT2A,TUBGCP6,WASH7P | APBB3,ENTHD2,CCNL2,CSAD,ECHDC2,ENGASE,FAM193B, GIGYF1,HDAC6,HEMK1,HSF4,LENG8,LPIN3,MAN2C1, MYO15B,NSUN5P2,PILRB,PLA2G6,PNPLA7,TUBGCP6,WASH7P | ||||
 |
| ||||
| ZNF436-AS1,CCNL2,CDK10,CDK5RAP3,CHKB-CPT1B,CROCCP2,CYP2D7, GGA1,HDAC10,LOC100131434,LOC91316,NOL12,PAN2,PI4KAP1, PICK1,PLA2G6,SFI1,SH2B1,TMEM175,TOP3B,TUBGCP6 | ACAD10,VPS51___IFT46,LMNTD2,CCDC61,CNKSR1,COX19,DGKQ, DMAP1,FUK,HDAC10,HDAC6,MIB2,MYPOP,OPLAH, PLA2G6,PNPLA7,RNF44,SPPL2B,SPSB3,STK11,TPCN1 |
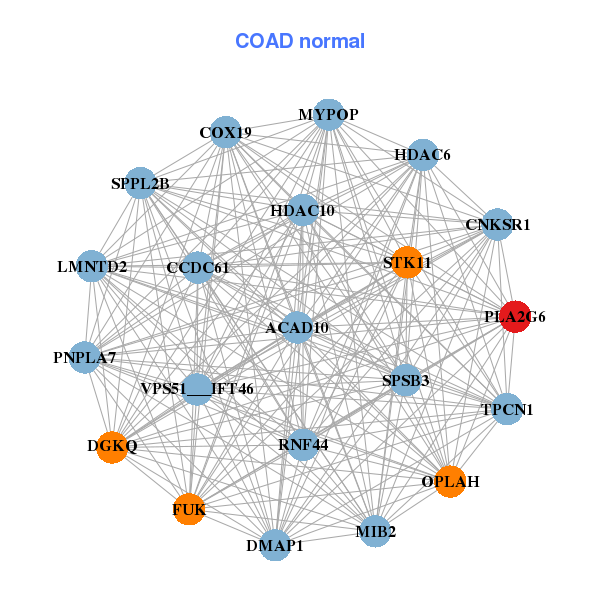
| * Co-Expression network figures were drawn using R package igraph. Only the top 20 genes with the highest correlations were shown. Red circle: input gene, orange circle: cell metabolism gene, sky circle: other gene |
: Open all plots for all cancer types
| Top |
: Open all interacting genes' information including KEGG pathway for all interacting genes from DAVID
| Top |
| Pharmacological Information for PLA2G6 |
| DB Category | DB Name | DB's ID and Url link |
| * Gene Centered Interaction Network. |
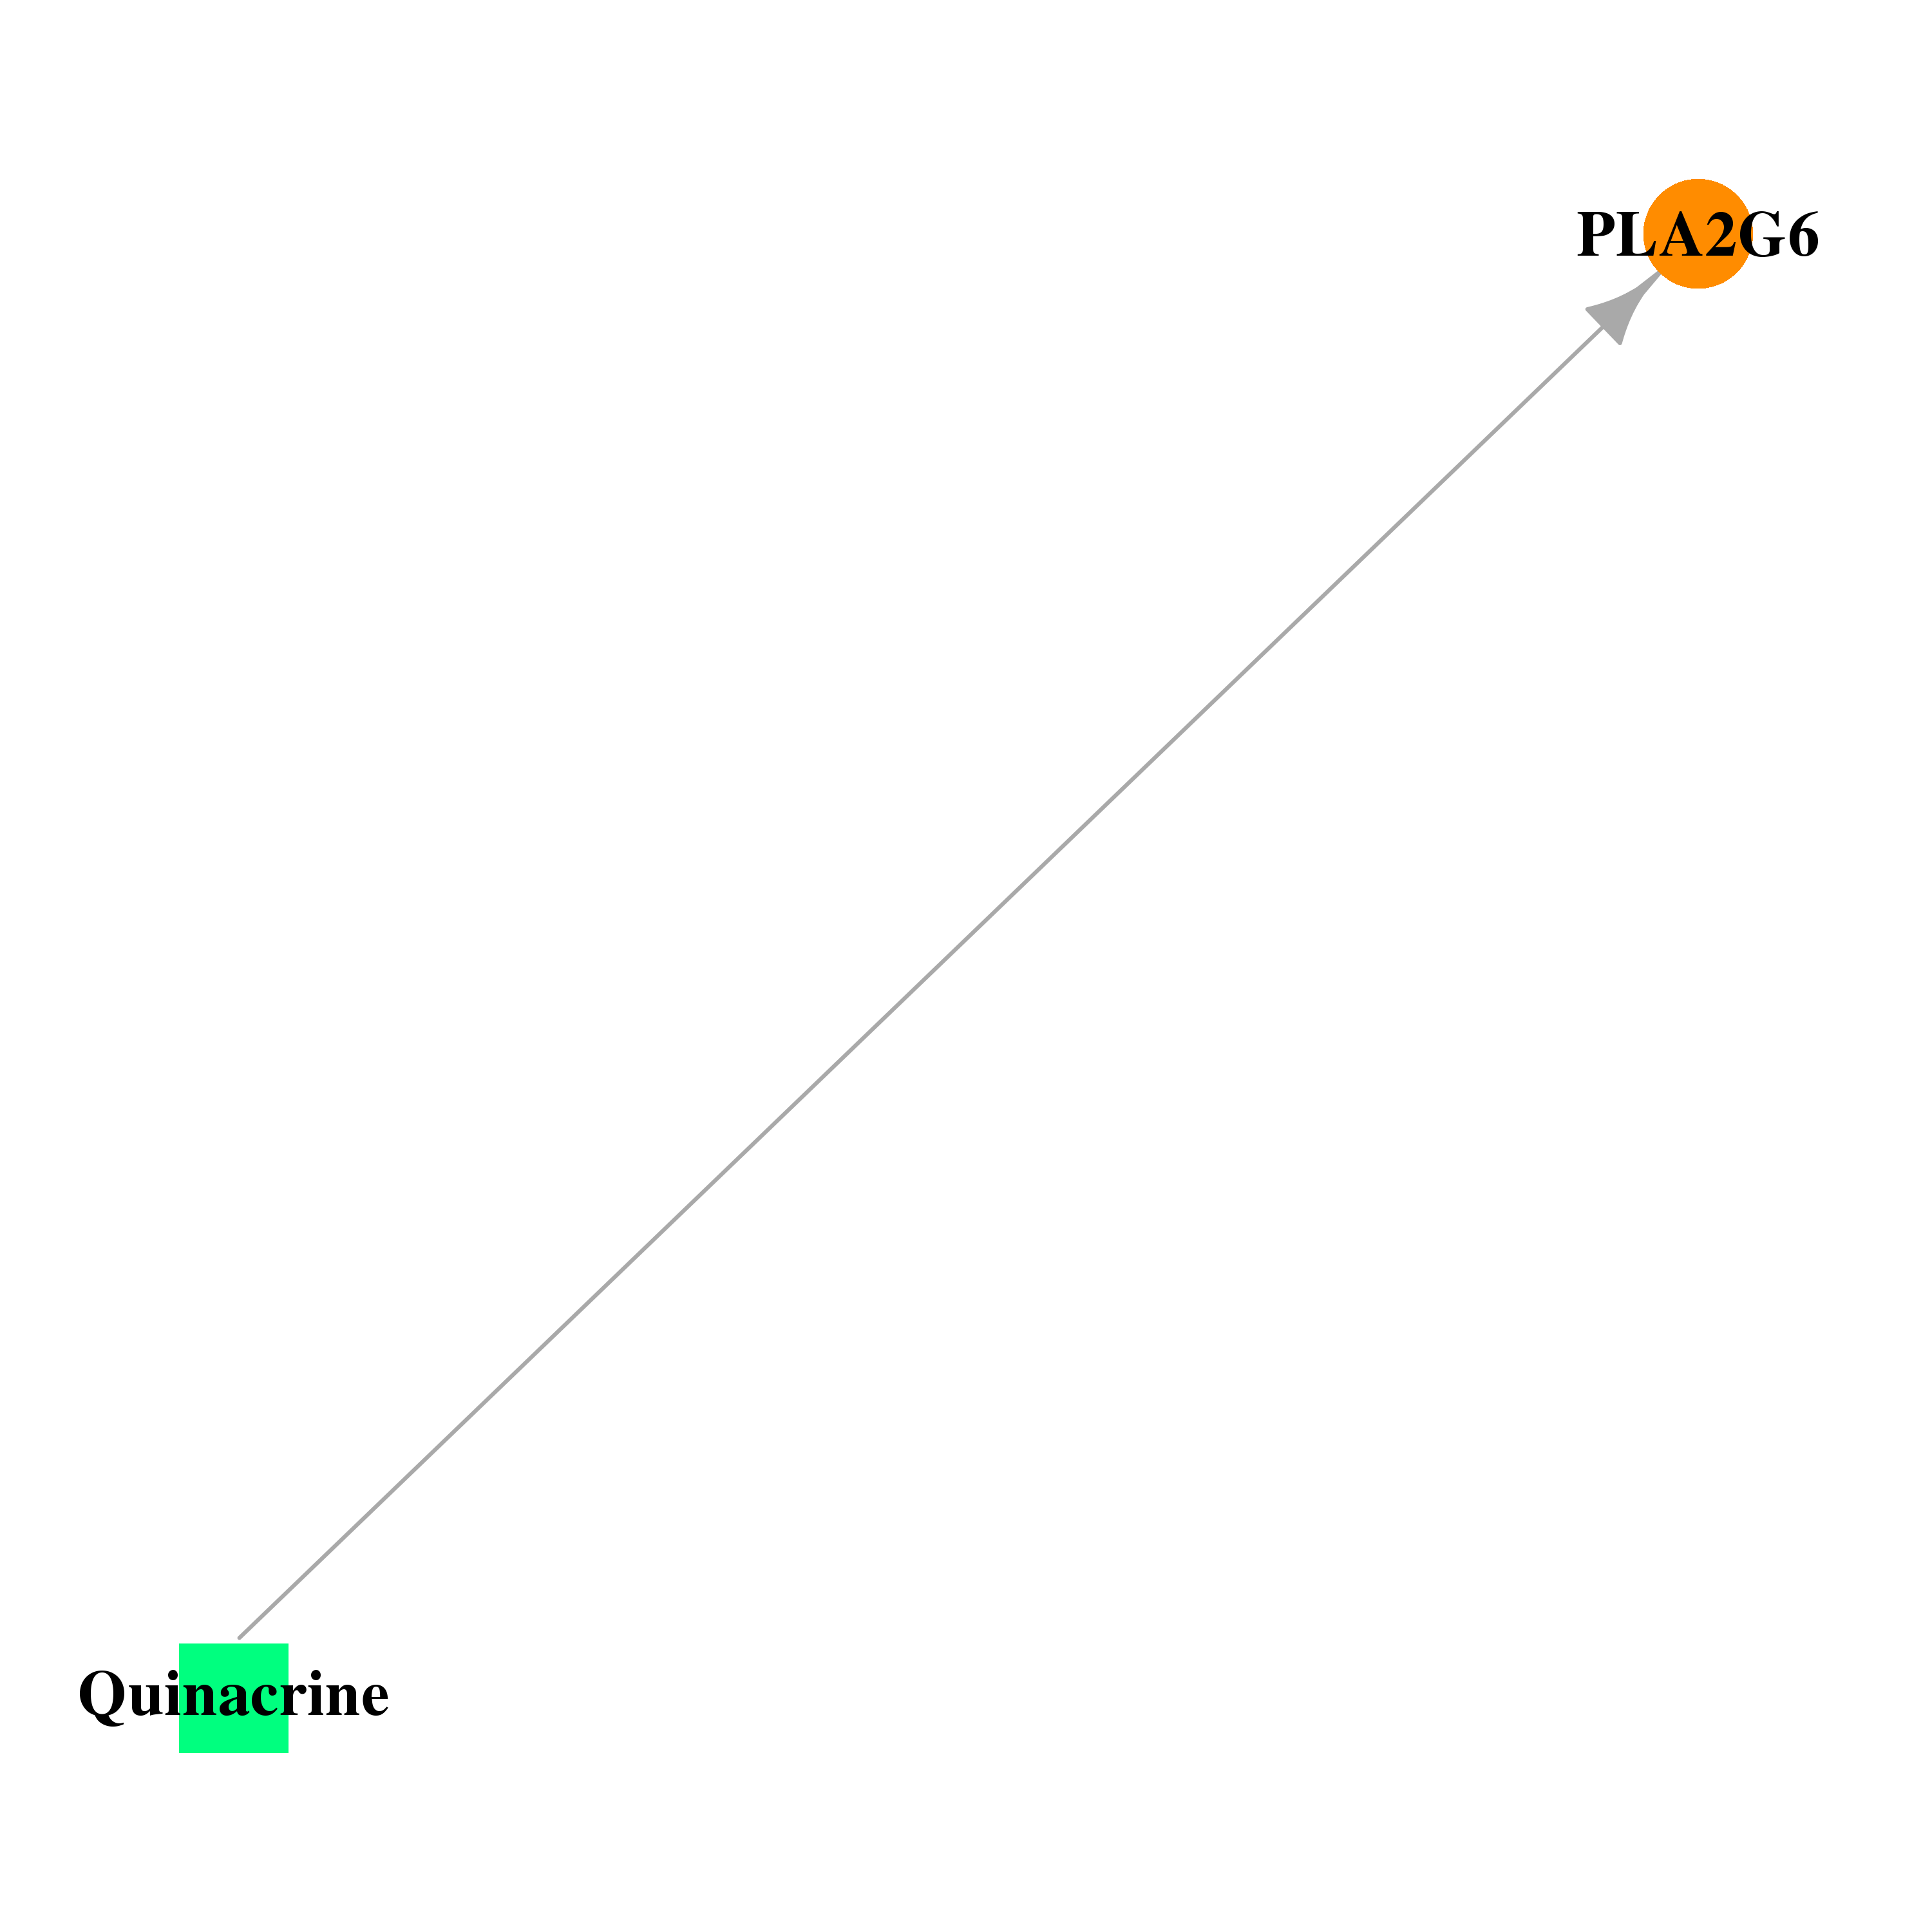 |
| * Drug Centered Interaction Network. |
| DrugBank ID | Target Name | Drug Groups | Generic Name | Drug Centered Network | Drug Structure |
| DB01103 | phospholipase A2, group VI (cytosolic, calcium-independent) | approved | Quinacrine | 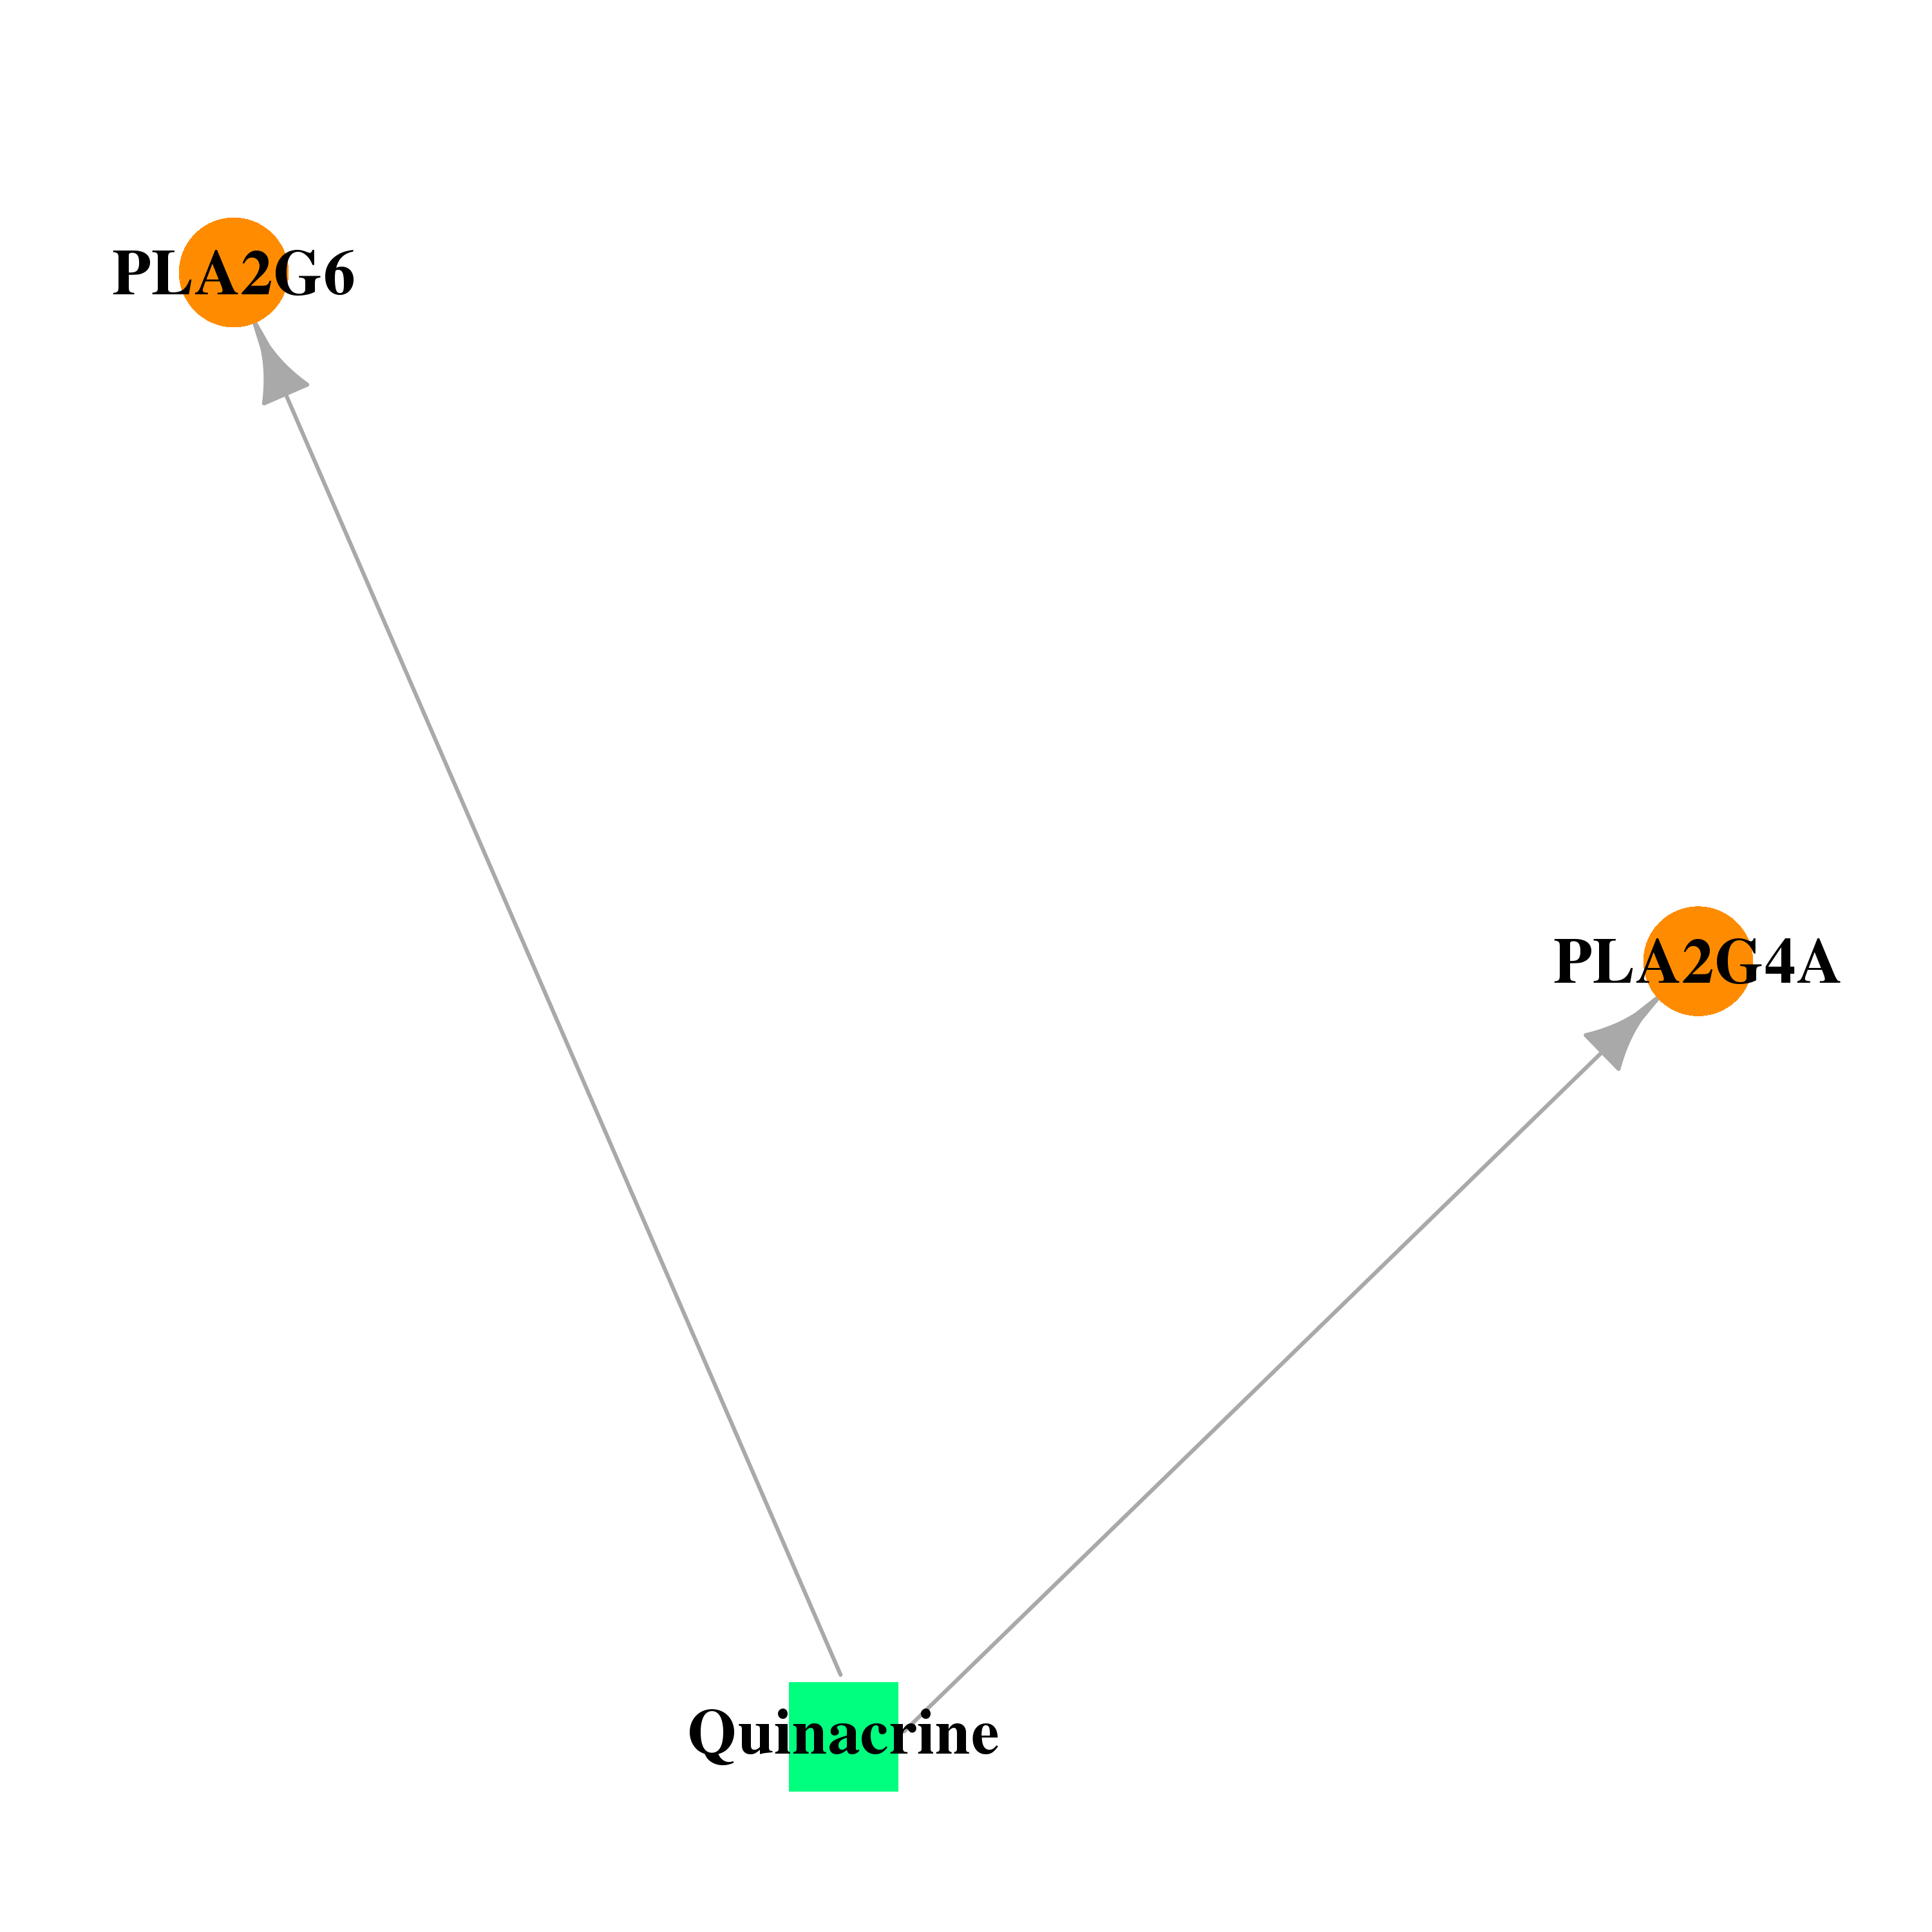 | 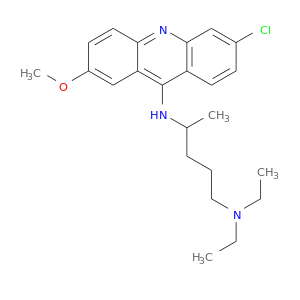 |
| Top |
| Cross referenced IDs for PLA2G6 |
| * We obtained these cross-references from Uniprot database. It covers 150 different DBs, 18 categories. http://www.uniprot.org/help/cross_references_section |
: Open all cross reference information
|
Copyright © 2016-Present - The Univsersity of Texas Health Science Center at Houston @ |