|
||||||||||||||||||||
| |
| Phenotypic Information (metabolism pathway, cancer, disease, phenome) |
| |
| |
| Gene-Gene Network Information: Co-Expression Network, Interacting Genes & KEGG |
| |
|


| Gene Summary for PLA2G10 |
| Basic gene info. | Gene symbol | PLA2G10 |
| Gene name | phospholipase A2, group X | |
| Synonyms | GXPLA2|GXSPLA2|SPLA2 | |
| Cytomap | UCSC genome browser: 16p13.1-p12 | |
| Genomic location | chr16 :14766404-14788526 | |
| Type of gene | protein-coding | |
| RefGenes | NM_003561.1, | |
| Ensembl id | ENSG00000069764 | |
| Description | GX sPLA2group 10 secretory phospholipase A2group X secretory phospholipase A2phosphatidylcholine 2-acylhydrolase 10sPLA2-X | |
| Modification date | 20141207 | |
| dbXrefs | MIM : 603603 | |
| HGNC : HGNC | ||
| Ensembl : ENSG00000069764 | ||
| HPRD : 04674 | ||
| Vega : OTTHUMG00000048069 | ||
| Protein | UniProt: O15496 go to UniProt's Cross Reference DB Table | |
| Expression | CleanEX: HS_PLA2G10 | |
| BioGPS: 8399 | ||
| Gene Expression Atlas: ENSG00000069764 | ||
| The Human Protein Atlas: ENSG00000069764 | ||
| Pathway | NCI Pathway Interaction Database: PLA2G10 | |
| KEGG: PLA2G10 | ||
| REACTOME: PLA2G10 | ||
| ConsensusPathDB | ||
| Pathway Commons: PLA2G10 | ||
| Metabolism | MetaCyc: PLA2G10 | |
| HUMANCyc: PLA2G10 | ||
| Regulation | Ensembl's Regulation: ENSG00000069764 | |
| miRBase: chr16 :14,766,404-14,788,526 | ||
| TargetScan: NM_003561 | ||
| cisRED: ENSG00000069764 | ||
| Context | iHOP: PLA2G10 | |
| cancer metabolism search in PubMed: PLA2G10 | ||
| UCL Cancer Institute: PLA2G10 | ||
| Assigned class in ccmGDB | A - This gene has a literature evidence and it belongs to cancer gene. | |
| References showing role of PLA2G10 in cancer cell metabolism | 1. Liesenfeld DB, Grapov D, Fahrmann JF, Salou M, Scherer D, et al. (2015) Metabolomics and transcriptomics identify pathway differences between visceral and subcutaneous adipose tissue in colorectal cancer patients: the ColoCare study. The American Journal of Clinical Nutrition: ajcn103804. go to article | |
| Top |
| Phenotypic Information for PLA2G10(metabolism pathway, cancer, disease, phenome) |
| Cancer | CGAP: PLA2G10 |
| Familial Cancer Database: PLA2G10 | |
| * This gene is included in those cancer gene databases. |
|
|
|
|
|
| . | ||||||||||||||
Oncogene 1 | Significant driver gene in | |||||||||||||||||||
| cf) number; DB name 1 Oncogene; http://nar.oxfordjournals.org/content/35/suppl_1/D721.long, 2 Tumor Suppressor gene; https://bioinfo.uth.edu/TSGene/, 3 Cancer Gene Census; http://www.nature.com/nrc/journal/v4/n3/abs/nrc1299.html, 4 CancerGenes; http://nar.oxfordjournals.org/content/35/suppl_1/D721.long, 5 Network of Cancer Gene; http://ncg.kcl.ac.uk/index.php, 1Therapeutic Vulnerabilities in Cancer; http://cbio.mskcc.org/cancergenomics/statius/ |
| KEGG_GLYCEROPHOSPHOLIPID_METABOLISM KEGG_ARACHIDONIC_ACID_METABOLISM KEGG_LINOLEIC_ACID_METABOLISM KEGG_ALPHA_LINOLENIC_ACID_METABOLISM REACTOME_PHOSPHOLIPID_METABOLISM REACTOME_METABOLISM_OF_LIPIDS_AND_LIPOPROTEINS | |
| OMIM | 603603; gene. |
| Orphanet | |
| Disease | KEGG Disease: PLA2G10 |
| MedGen: PLA2G10 (Human Medical Genetics with Condition) | |
| ClinVar: PLA2G10 | |
| Phenotype | MGI: PLA2G10 (International Mouse Phenotyping Consortium) |
| PhenomicDB: PLA2G10 | |
| Mutations for PLA2G10 |
| * Under tables are showing count per each tissue to give us broad intuition about tissue specific mutation patterns.You can go to the detailed page for each mutation database's web site. |
| There's no structural variation information in COSMIC data for this gene. |
| * From mRNA Sanger sequences, Chitars2.0 arranged chimeric transcripts. This table shows PLA2G10 related fusion information. |
| ID | Head Gene | Tail Gene | Accession | Gene_a | qStart_a | qEnd_a | Chromosome_a | tStart_a | tEnd_a | Gene_a | qStart_a | qEnd_a | Chromosome_a | tStart_a | tEnd_a |
| Top |
| There's no copy number variation information in COSMIC data for this gene. |
| Top |
|
 |
| Top |
| Stat. for Non-Synonymous SNVs (# total SNVs=0) | (# total SNVs=0) |
(# total SNVs=0) | (# total SNVs=0) |
| Top |
| * When you move the cursor on each content, you can see more deailed mutation information on the Tooltip. Those are primary_site,primary_histology,mutation(aa),pubmedID. |
| GRCh37 position | Mutation(aa) | Unique sampleID count |
| Top |
|
 |
| Point Mutation/ Tissue ID | 1 | 2 | 3 | 4 | 5 | 6 | 7 | 8 | 9 | 10 | 11 | 12 | 13 | 14 | 15 | 16 | 17 | 18 | 19 | 20 |
| # sample | 3 | 1 | ||||||||||||||||||
| # mutation | 3 | 1 | ||||||||||||||||||
| nonsynonymous SNV | 1 | 1 | ||||||||||||||||||
| synonymous SNV | 2 |
| cf) Tissue ID; Tissue type (1; BLCA[Bladder Urothelial Carcinoma], 2; BRCA[Breast invasive carcinoma], 3; CESC[Cervical squamous cell carcinoma and endocervical adenocarcinoma], 4; COAD[Colon adenocarcinoma], 5; GBM[Glioblastoma multiforme], 6; Glioma Low Grade, 7; HNSC[Head and Neck squamous cell carcinoma], 8; KICH[Kidney Chromophobe], 9; KIRC[Kidney renal clear cell carcinoma], 10; KIRP[Kidney renal papillary cell carcinoma], 11; LAML[Acute Myeloid Leukemia], 12; LUAD[Lung adenocarcinoma], 13; LUSC[Lung squamous cell carcinoma], 14; OV[Ovarian serous cystadenocarcinoma ], 15; PAAD[Pancreatic adenocarcinoma], 16; PRAD[Prostate adenocarcinoma], 17; SKCM[Skin Cutaneous Melanoma], 18:STAD[Stomach adenocarcinoma], 19:THCA[Thyroid carcinoma], 20:UCEC[Uterine Corpus Endometrial Carcinoma]) |
| Top |
| * We represented just top 10 SNVs. When you move the cursor on each content, you can see more deailed mutation information on the Tooltip. Those are primary_site, primary_histology, mutation(aa), pubmedID. |
| Genomic Position | Mutation(aa) | Unique sampleID count |
| chr16:14766485 | p.P159P | 1 |
| chr16:14766512 | p.L150L | 1 |
| chr16:14766538 | p.Q142K | 1 |
| chr16:14766560 | p.Q134H | 1 |
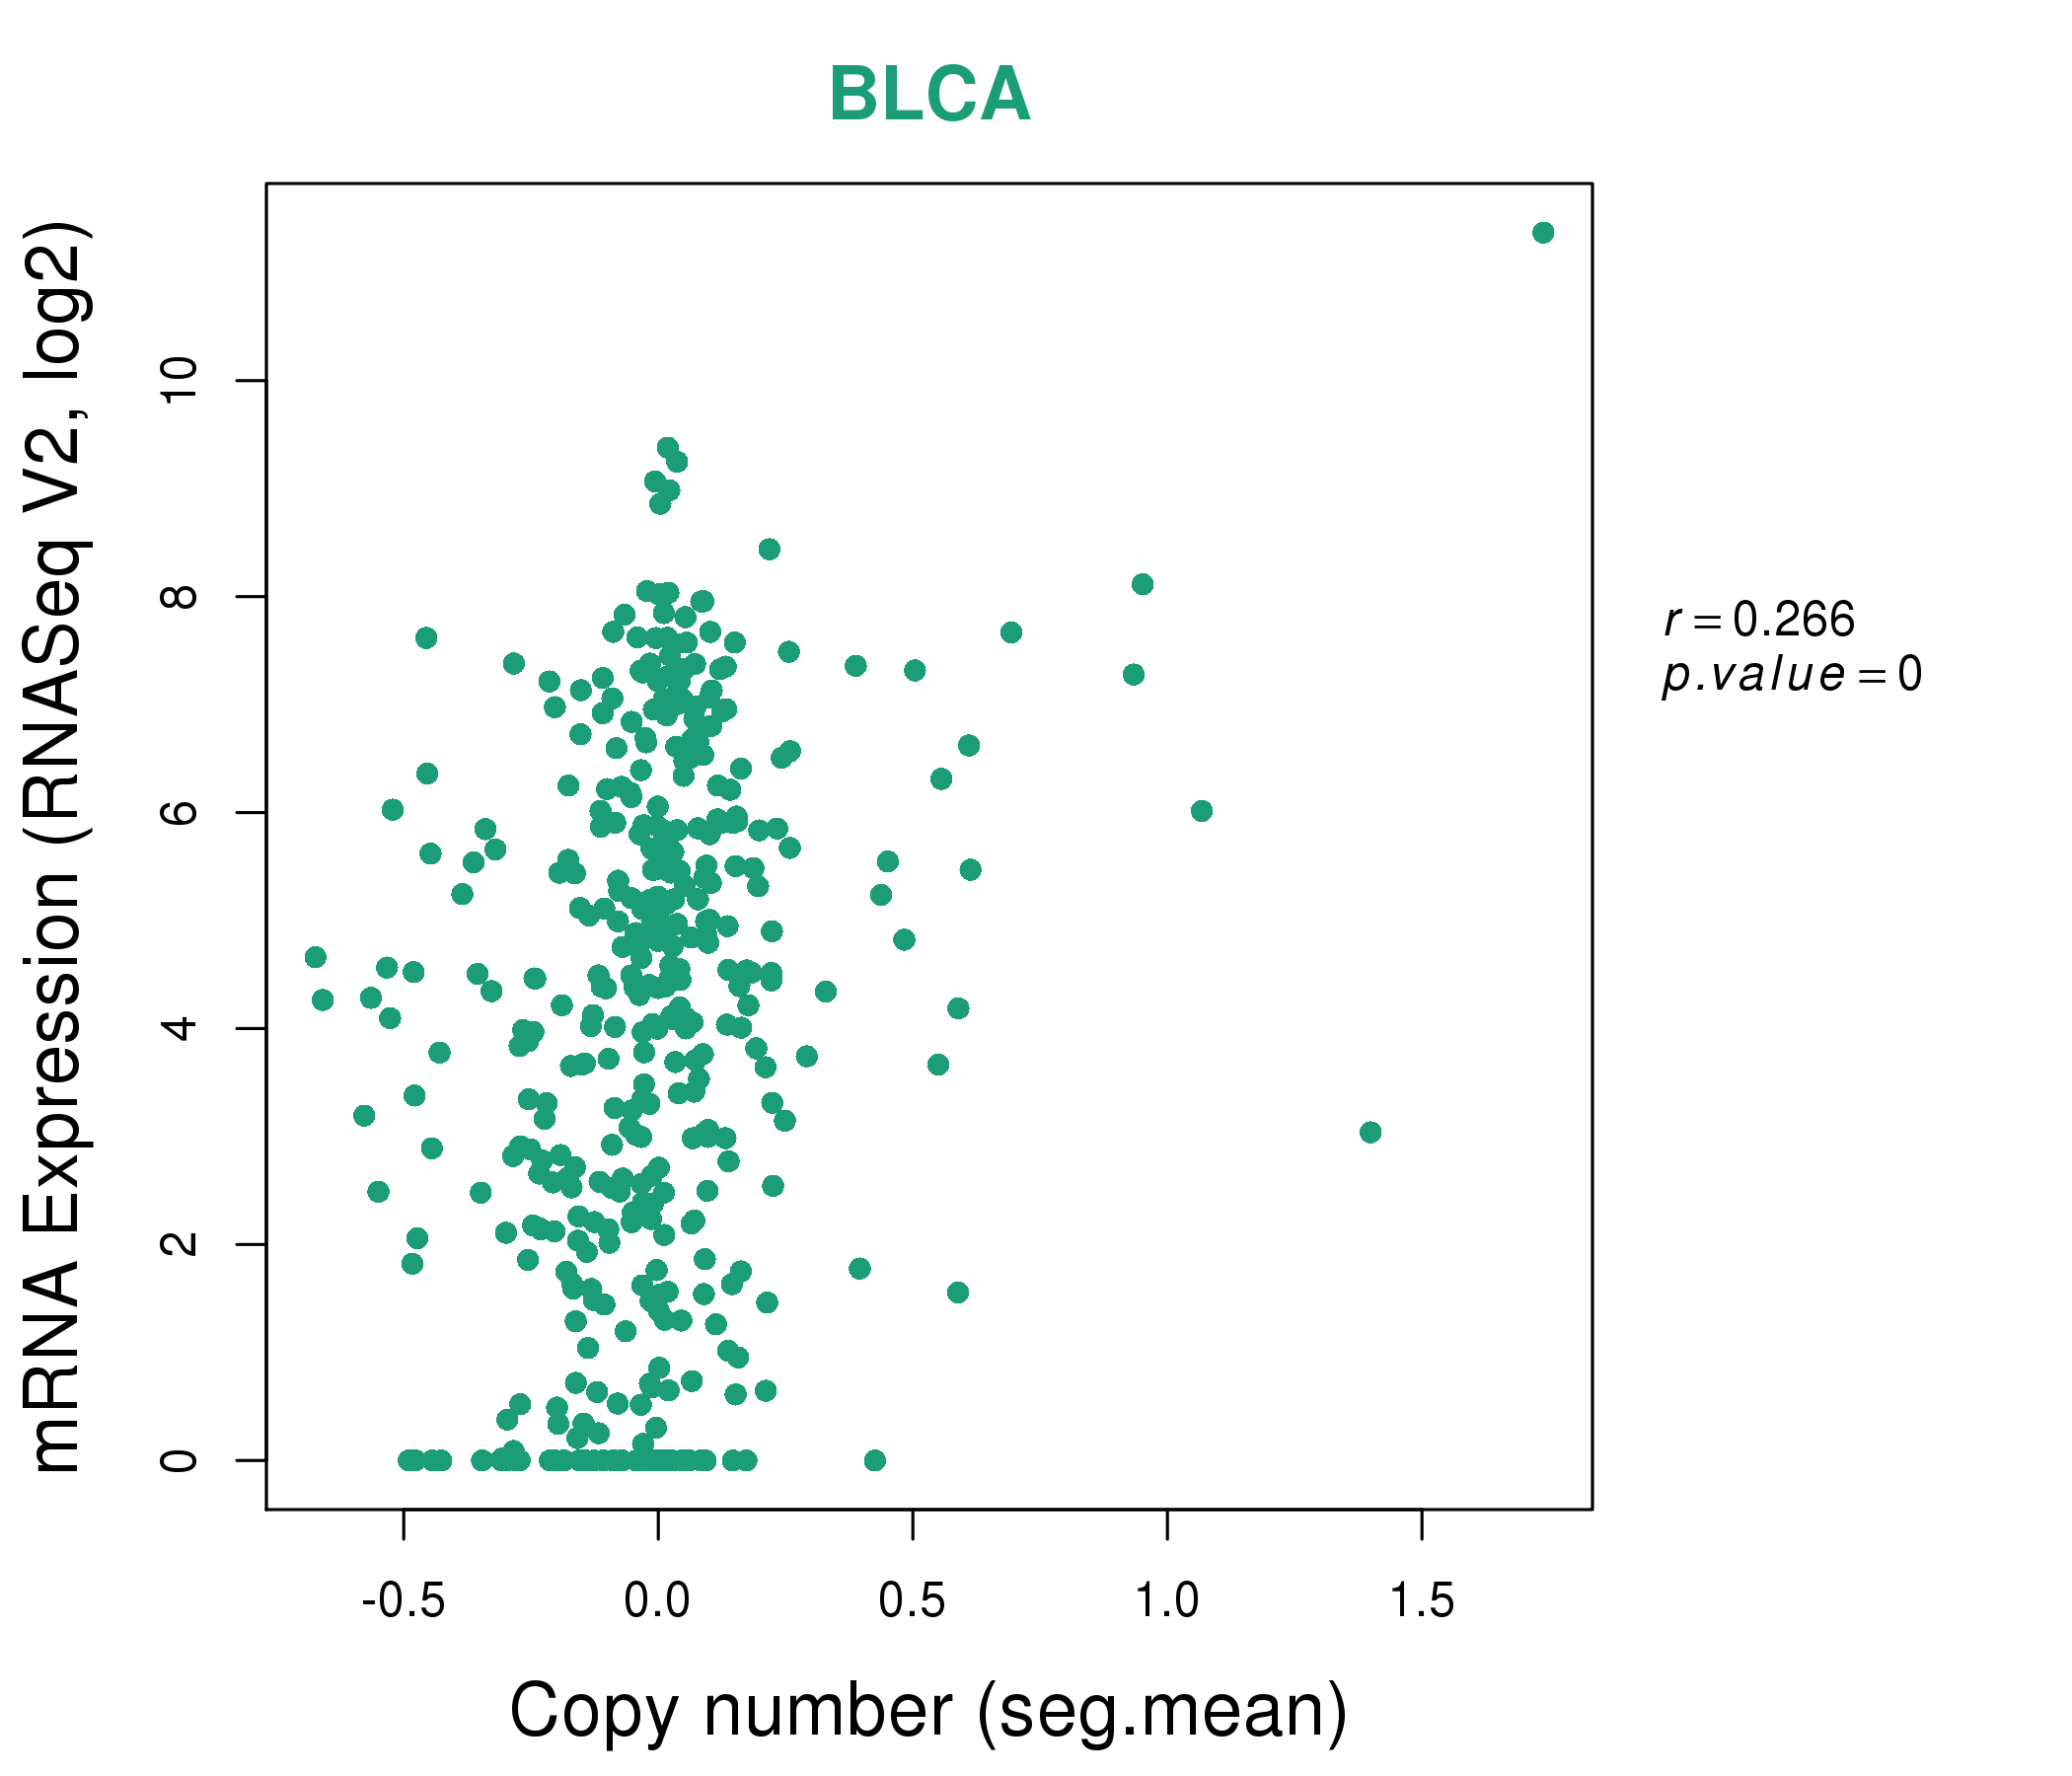
| * Copy number data were extracted from TCGA using R package TCGA-Assembler. The URLs of all public data files on TCGA DCC data server were gathered on Jan-05-2015. Function ProcessCNAData in TCGA-Assembler package was used to obtain gene-level copy number value which is calculated as the average copy number of the genomic region of a gene. |
 |
| cf) Tissue ID[Tissue type]: BLCA[Bladder Urothelial Carcinoma], BRCA[Breast invasive carcinoma], CESC[Cervical squamous cell carcinoma and endocervical adenocarcinoma], COAD[Colon adenocarcinoma], GBM[Glioblastoma multiforme], Glioma Low Grade, HNSC[Head and Neck squamous cell carcinoma], KICH[Kidney Chromophobe], KIRC[Kidney renal clear cell carcinoma], KIRP[Kidney renal papillary cell carcinoma], LAML[Acute Myeloid Leukemia], LUAD[Lung adenocarcinoma], LUSC[Lung squamous cell carcinoma], OV[Ovarian serous cystadenocarcinoma ], PAAD[Pancreatic adenocarcinoma], PRAD[Prostate adenocarcinoma], SKCM[Skin Cutaneous Melanoma], STAD[Stomach adenocarcinoma], THCA[Thyroid carcinoma], UCEC[Uterine Corpus Endometrial Carcinoma] |
| Top |
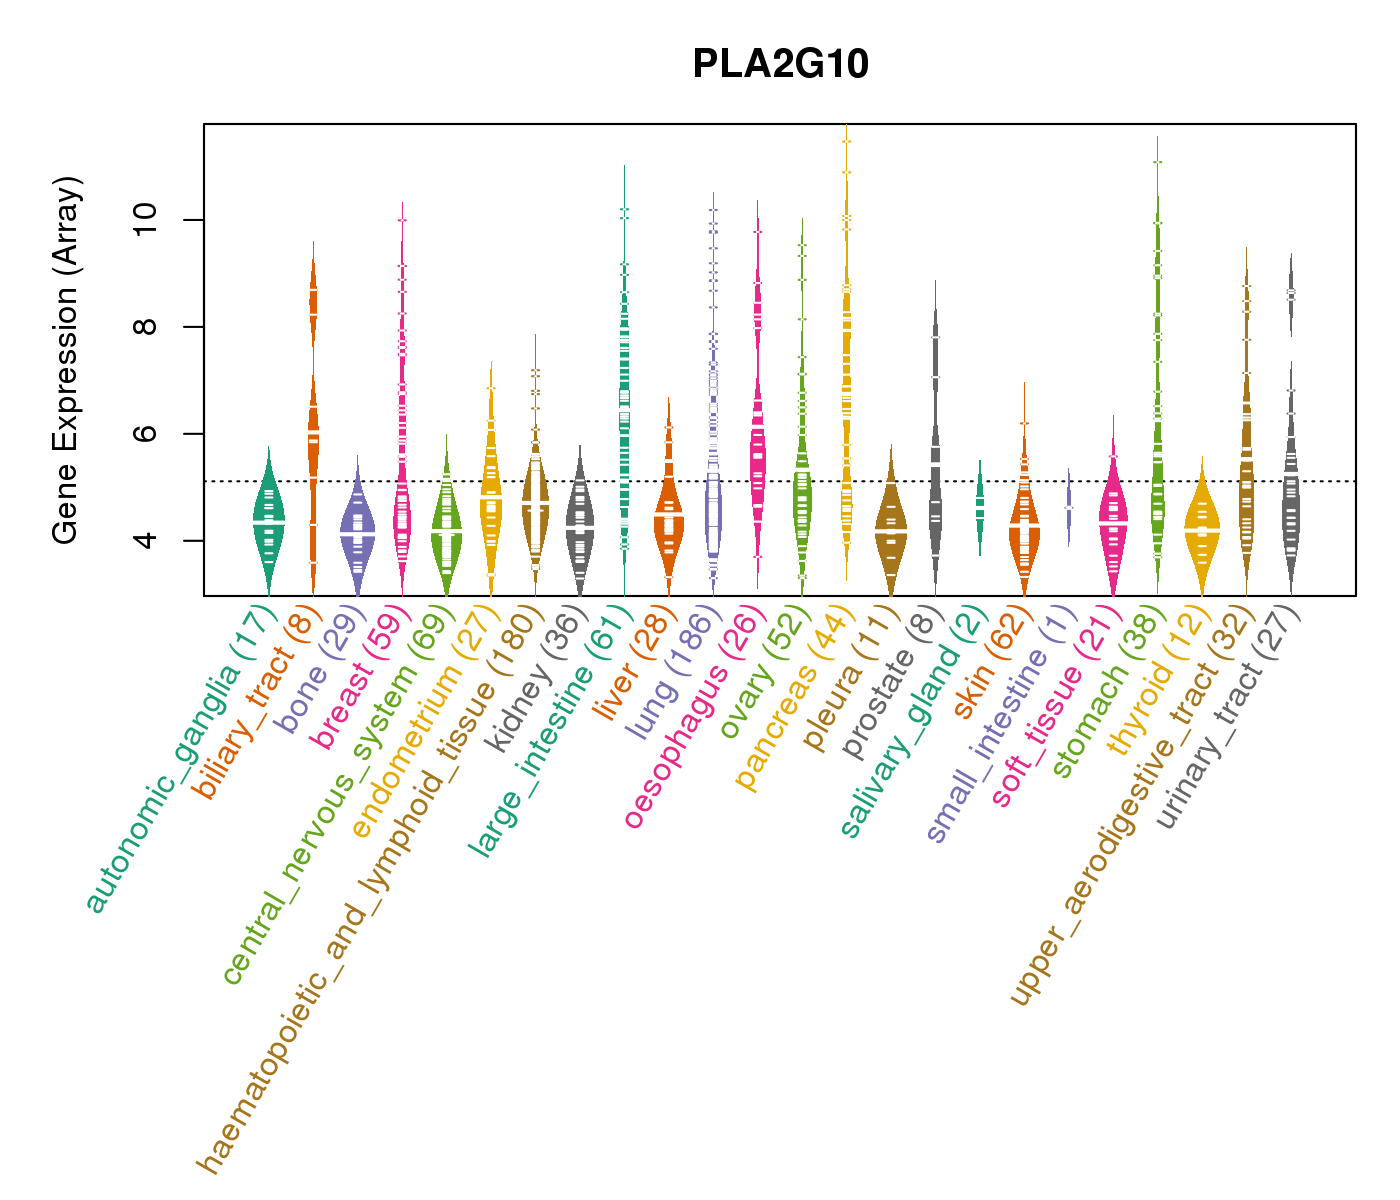
| Gene Expression for PLA2G10 |
| * CCLE gene expression data were extracted from CCLE_Expression_Entrez_2012-10-18.res: Gene-centric RMA-normalized mRNA expression data. |
 |
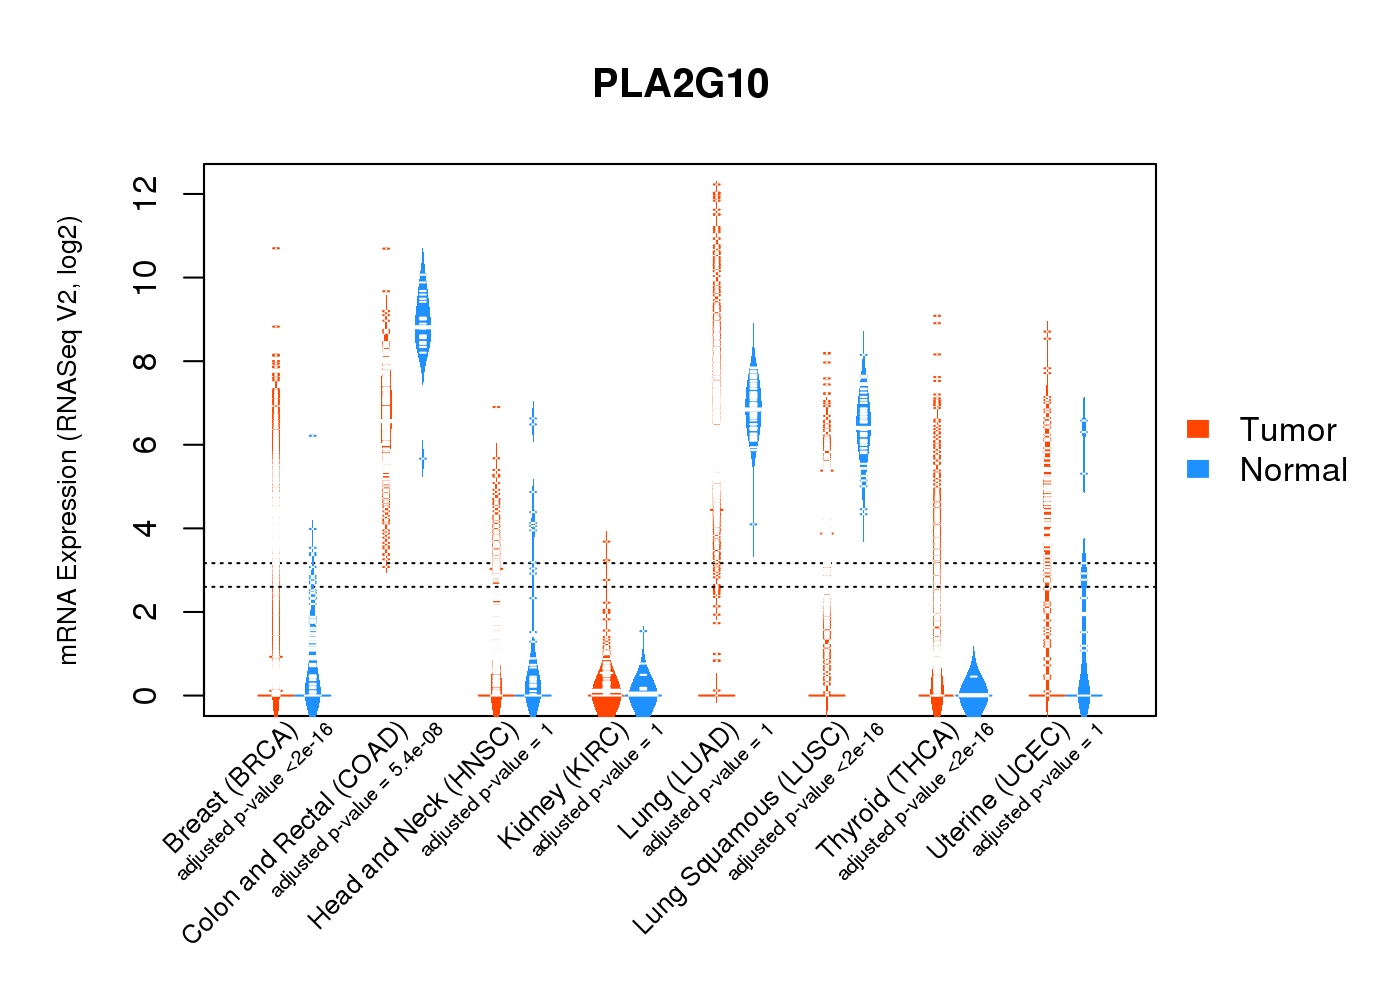
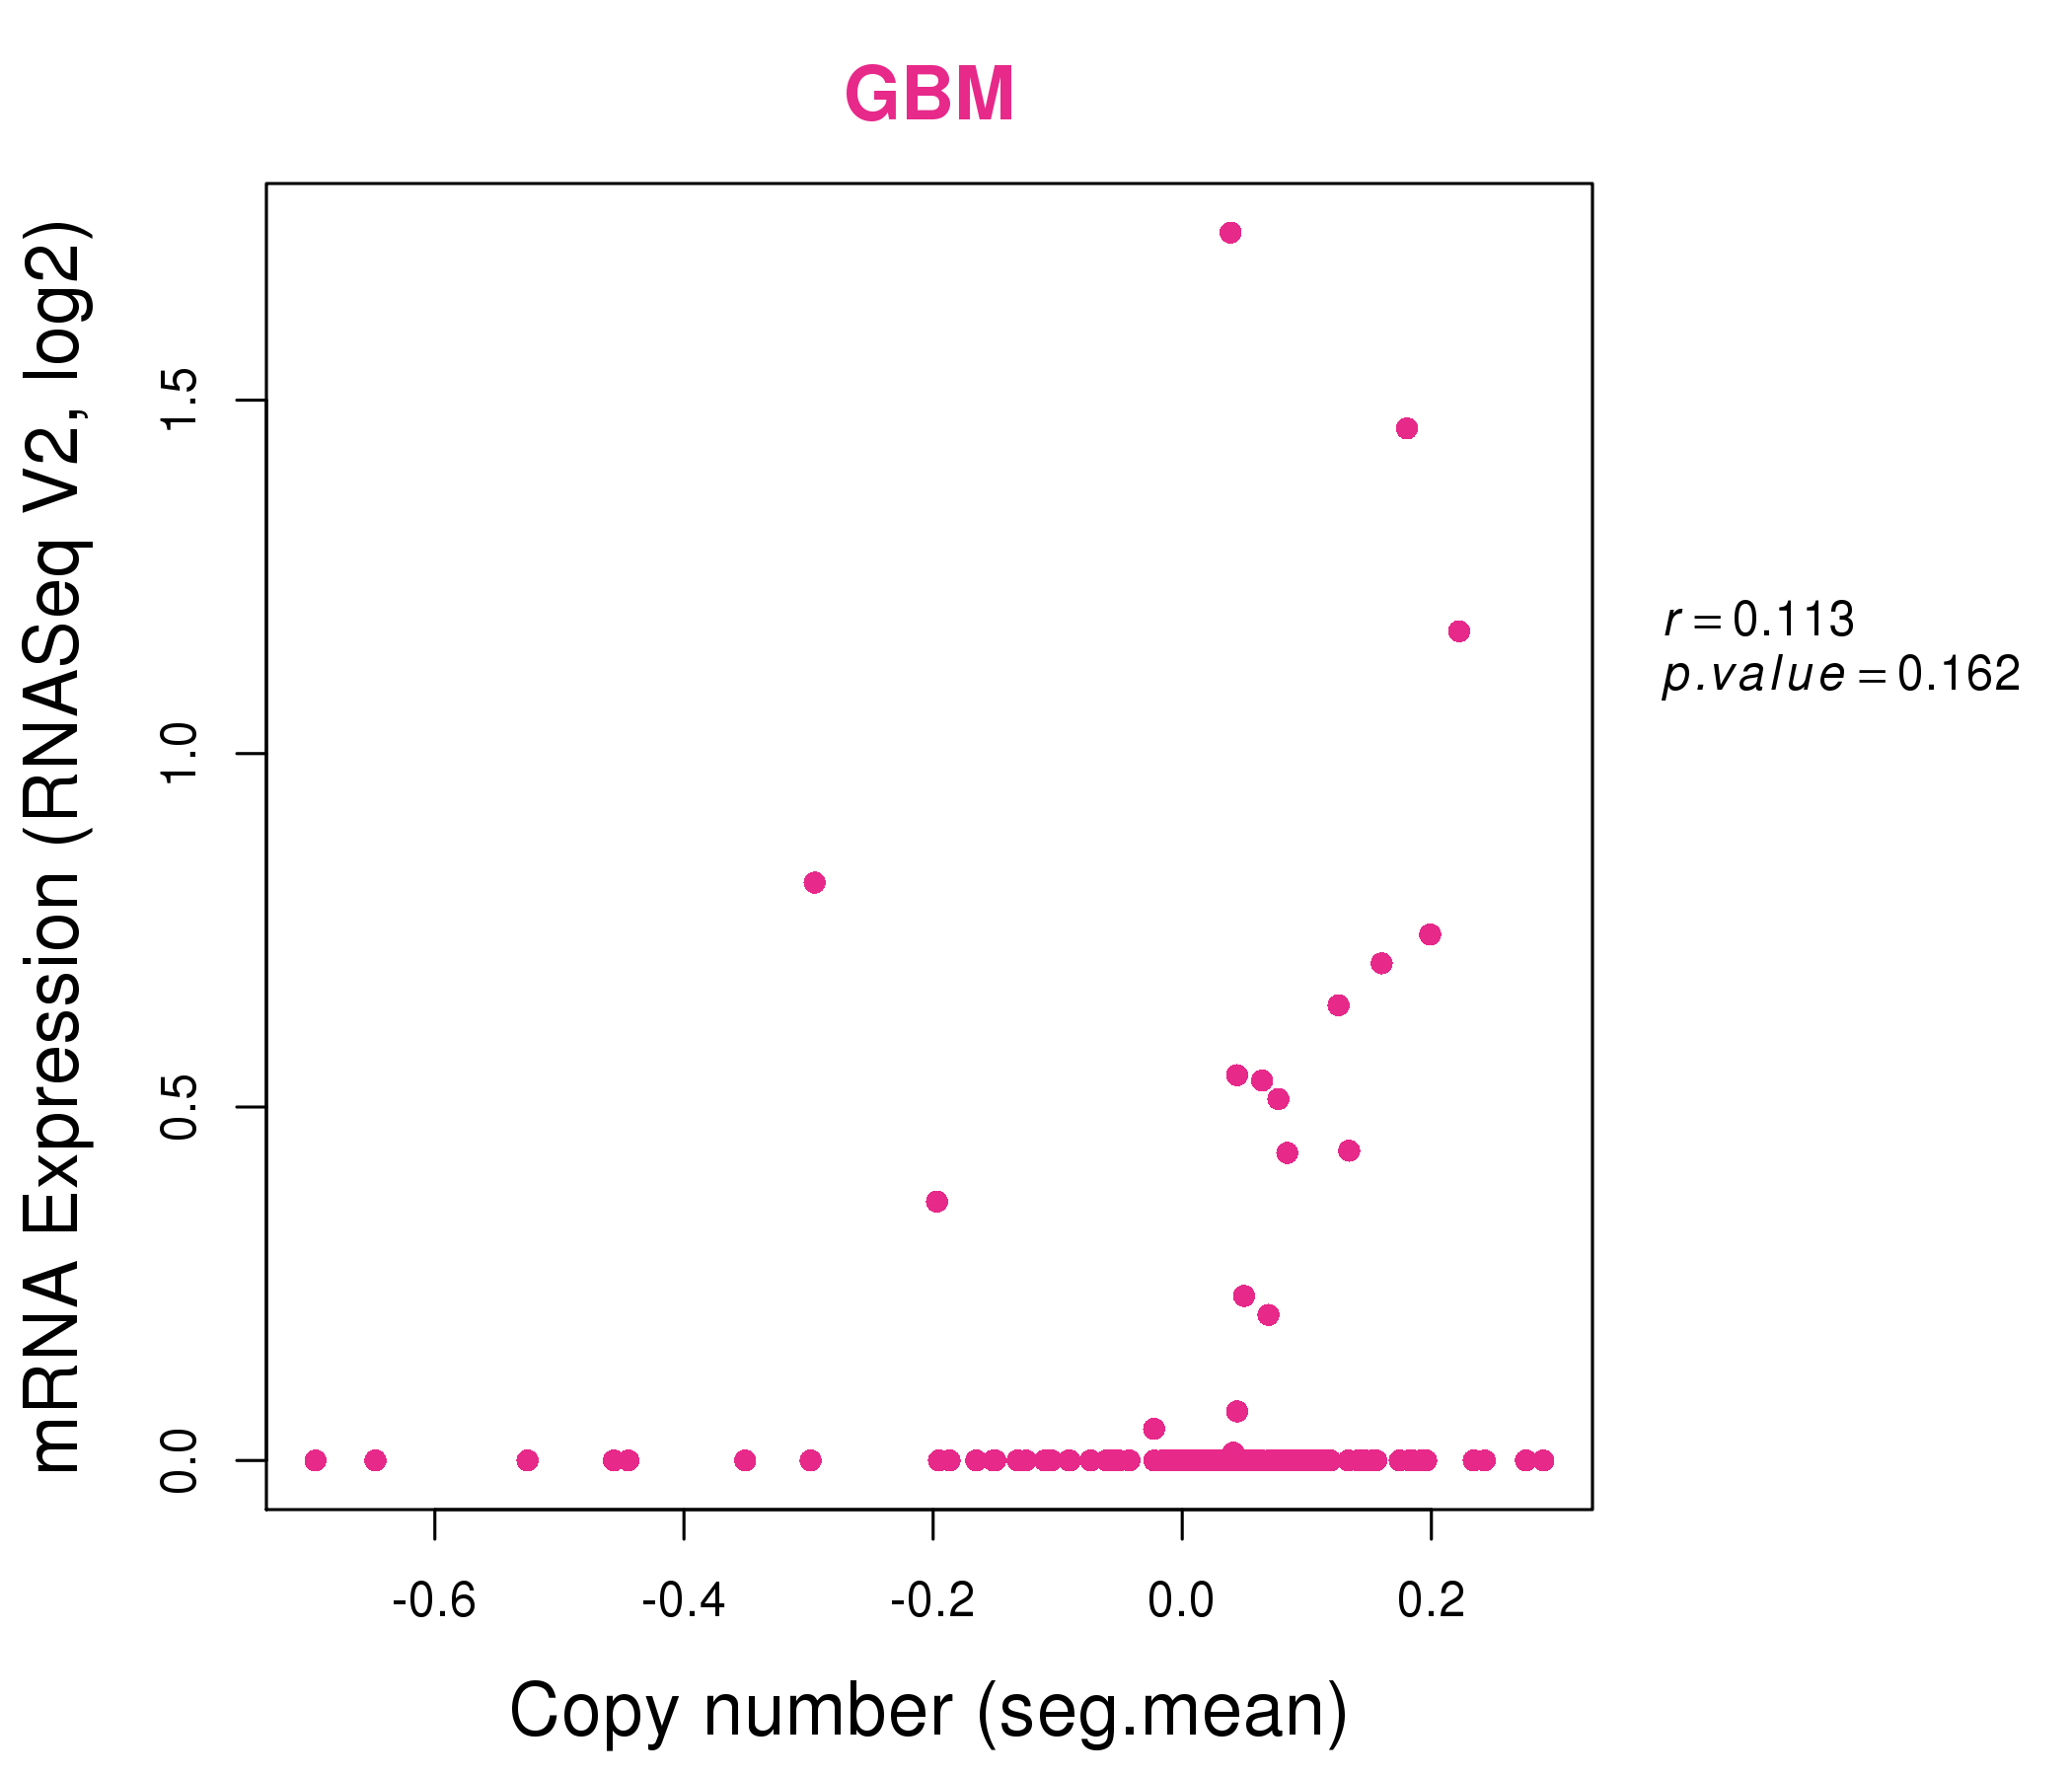
| * Normalized gene expression data of RNASeqV2 was extracted from TCGA using R package TCGA-Assembler. The URLs of all public data files on TCGA DCC data server were gathered at Jan-05-2015. Only eight cancer types have enough normal control samples for differential expression analysis. (t test, adjusted p<0.05 (using Benjamini-Hochberg FDR)) |
 |
| Top |
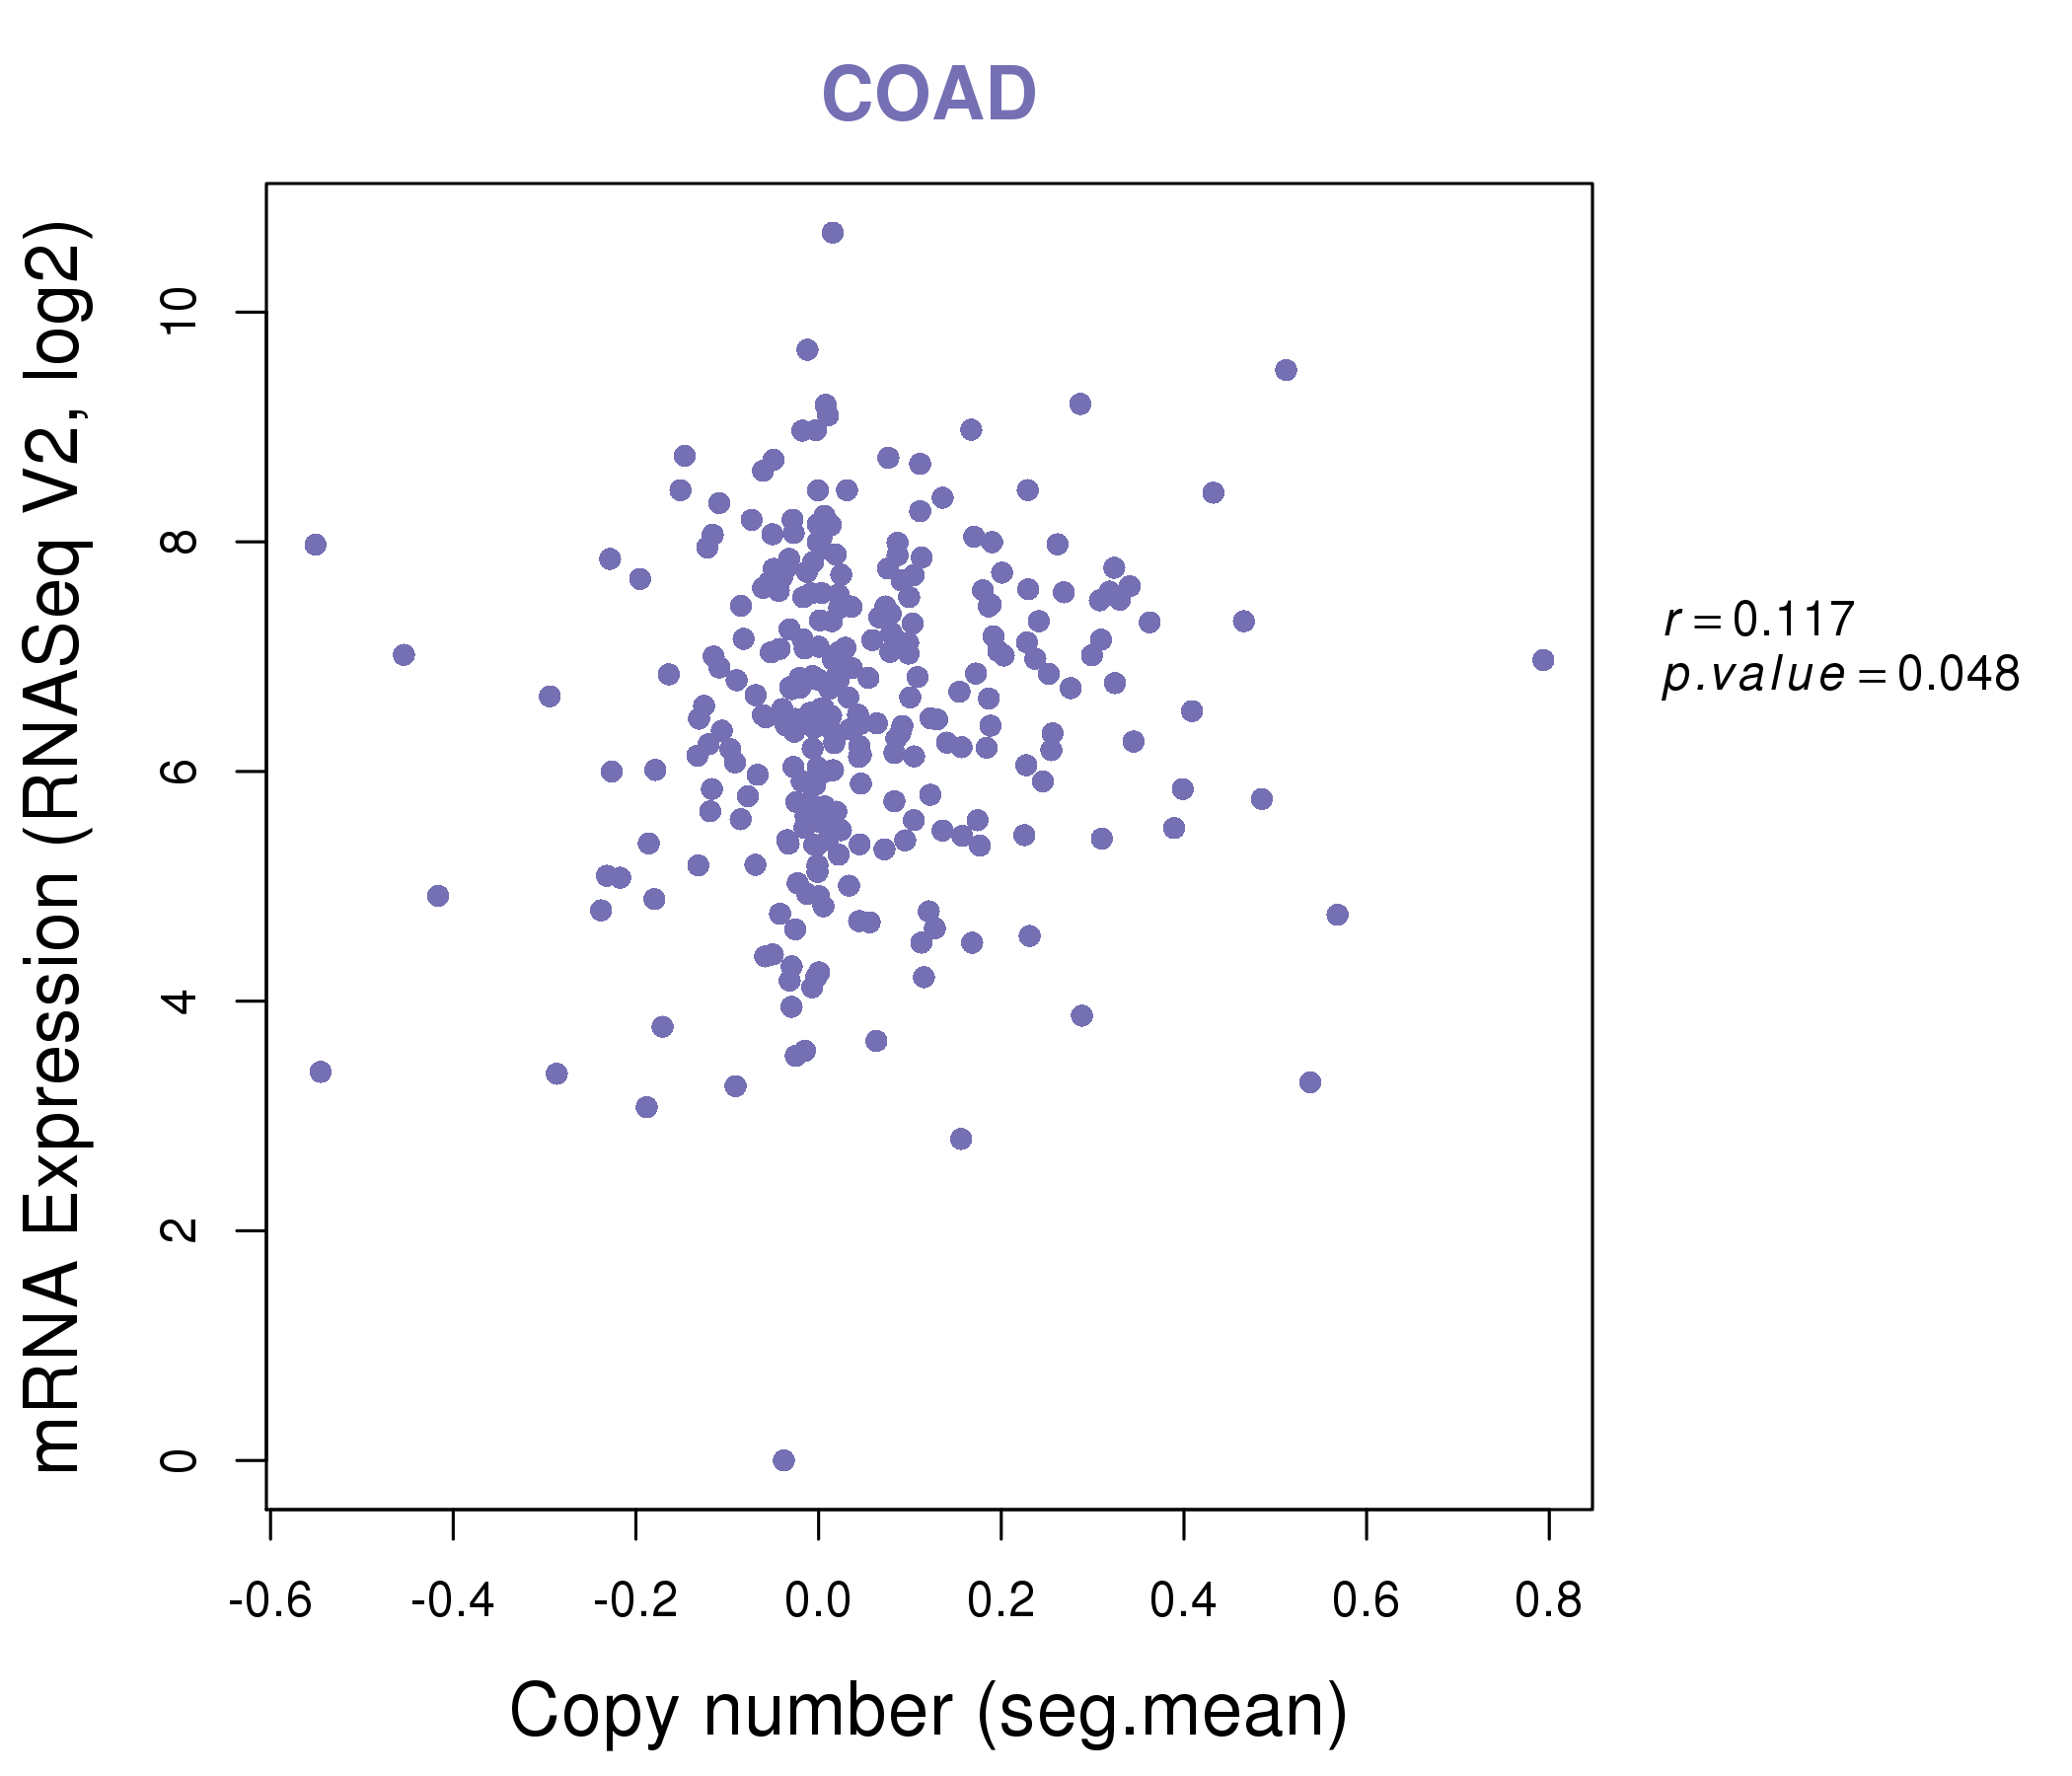
| * This plots show the correlation between CNV and gene expression. |
: Open all plots for all cancer types
 |
|
 |
|

| Top |
| Gene-Gene Network Information |
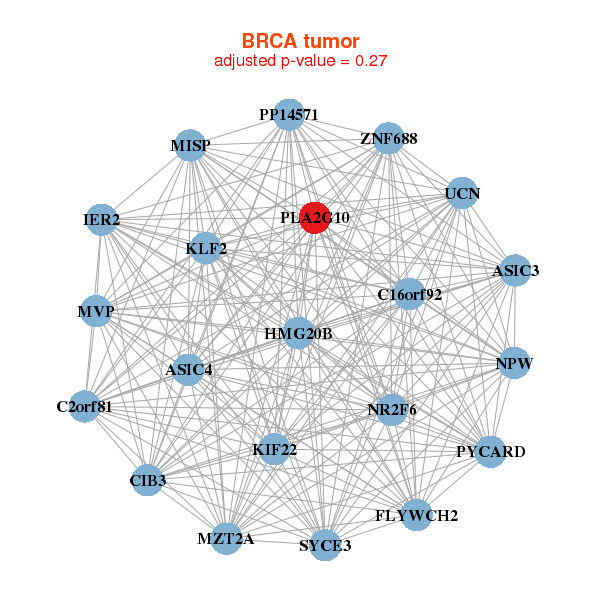
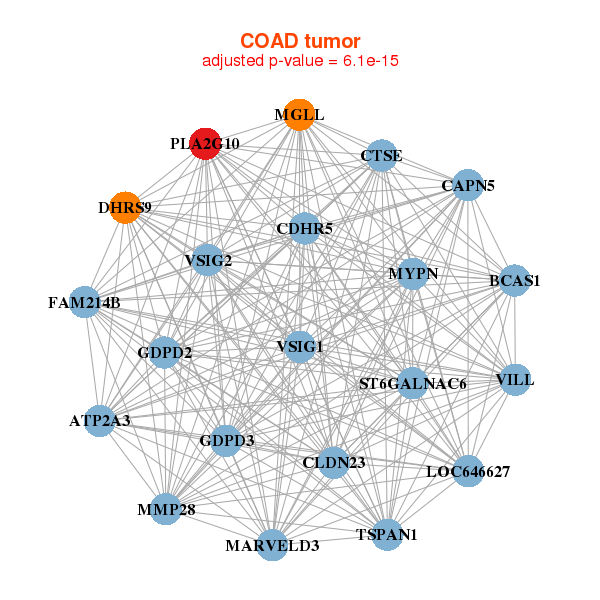
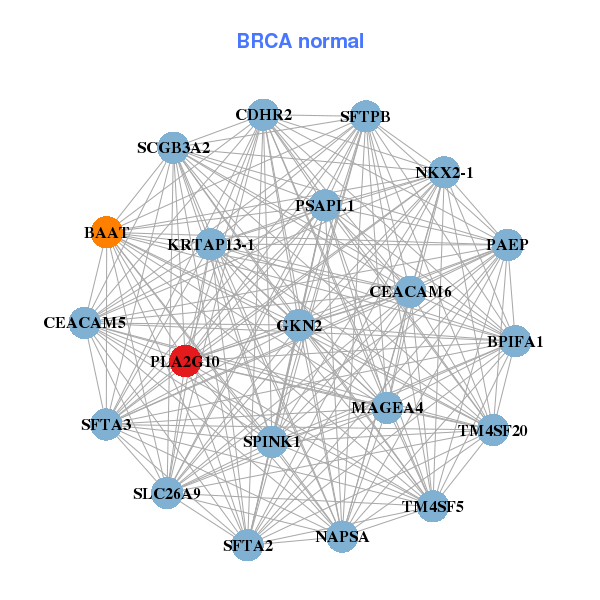
| * Co-Expression network figures were drawn using R package igraph. Only the top 20 genes with the highest correlations were shown. Red circle: input gene, orange circle: cell metabolism gene, sky circle: other gene |
: Open all plots for all cancer types
 |
|
| ASIC3,ASIC4,C16orf92,MISP,SYCE3,C2orf81,CIB3, MZT2A,FLYWCH2,HMG20B,IER2,KIF22,KLF2,MVP, NPW,NR2F6,PLA2G10,PP14571,PYCARD,UCN,ZNF688 | BAAT,CDHR2,CEACAM5,CEACAM6,GKN2,KRTAP13-1,MAGEA4, NAPSA,NKX2-1,PAEP,PLA2G10,BPIFA1,PSAPL1,SCGB3A2, SFTA2,SFTA3,SFTPB,SLC26A9,SPINK1,TM4SF20,TM4SF5 |
 |
|
| ATP2A3,BCAS1,CAPN5,CDHR5,CLDN23,CTSE,DHRS9, GDPD2,GDPD3,FAM214B,LOC646627,MARVELD3,MGLL,MMP28, MYPN,PLA2G10,ST6GALNAC6,TSPAN1,VILL,VSIG1,VSIG2 | ACVRL1,ARF1,C12orf75,CANT1,CTSS,DHX32,DIRC2, FAM3D,FKBP1A,GALE,GIPC1,FFAR4,HIST1H3H,ITM2C, KCNK1,MAGIX,PARM1,PLA2G10,TBC1D10A,TOR2A,TSPAN15 |
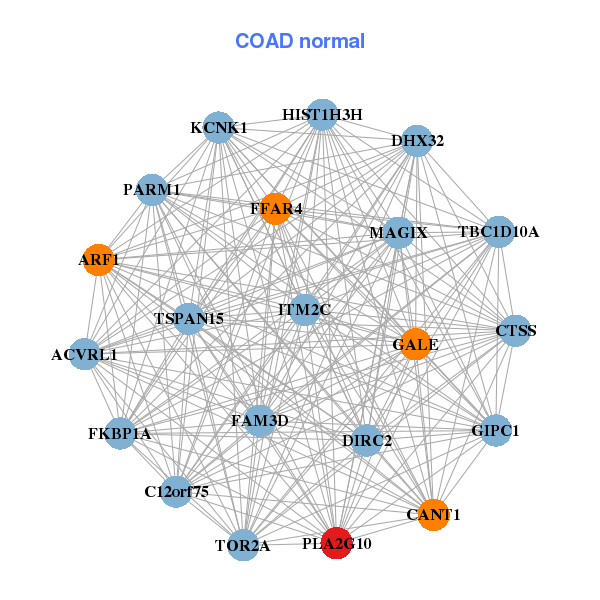
| * Co-Expression network figures were drawn using R package igraph. Only the top 20 genes with the highest correlations were shown. Red circle: input gene, orange circle: cell metabolism gene, sky circle: other gene |
: Open all plots for all cancer types
| Top |
: Open all interacting genes' information including KEGG pathway for all interacting genes from DAVID
| Top |
| Pharmacological Information for PLA2G10 |
| There's no related Drug. |
| Top |
| Cross referenced IDs for PLA2G10 |
| * We obtained these cross-references from Uniprot database. It covers 150 different DBs, 18 categories. http://www.uniprot.org/help/cross_references_section |
: Open all cross reference information
|
Copyright © 2016-Present - The Univsersity of Texas Health Science Center at Houston @ |