|
||||||||||||||||||||||||||||||||||||||||||||||||||||||||||||||||||||||||||||||||||||||||||||||||||||||||||||||||||||||||||||||||||||||||||||||||||||||||||||||||||||||||||||||||||||||||||||||||||||||||||||||||||||||||||||||||||||||||||||||||||||||||||||||||||||||||||||||||||||||||||||||||||||||||||||||||||||||||||
| |
| Phenotypic Information (metabolism pathway, cancer, disease, phenome) |
| |
| |
| Gene-Gene Network Information: Co-Expression Network, Interacting Genes & KEGG |
| |
|


| Gene Summary for B3GNT5 |
| Basic gene info. | Gene symbol | B3GNT5 |
| Gene name | UDP-GlcNAc:betaGal beta-1,3-N-acetylglucosaminyltransferase 5 | |
| Synonyms | B3GN-T5|beta3Gn-T5 | |
| Cytomap | UCSC genome browser: 3q28 | |
| Genomic location | chr3 :182971031-182991179 | |
| Type of gene | protein-coding | |
| RefGenes | NM_032047.4, | |
| Ensembl id | ENSG00000176597 | |
| Description | BGnT-5UDP-GlcNAc:beta-Gal beta-1,3-N-acetylglucosaminyltransferase 5beta 1,3 N-acetyglucosaminyltransferase Lc3 synthasebeta-1,3-Gn-T5beta-1,3-N-acetylglucosaminyltransferase 5beta-1,3-N-acetylglucosaminyltransferase bGnT-5lactosylceramide 1,3-N-ace | |
| Modification date | 20141207 | |
| dbXrefs | MIM : 615333 | |
| HGNC : HGNC | ||
| Ensembl : ENSG00000176597 | ||
| HPRD : 12511 | ||
| Vega : OTTHUMG00000158436 | ||
| Protein | UniProt: go to UniProt's Cross Reference DB Table | |
| Expression | CleanEX: HS_B3GNT5 | |
| BioGPS: 84002 | ||
| Gene Expression Atlas: ENSG00000176597 | ||
| The Human Protein Atlas: ENSG00000176597 | ||
| Pathway | NCI Pathway Interaction Database: B3GNT5 | |
| KEGG: B3GNT5 | ||
| REACTOME: B3GNT5 | ||
| ConsensusPathDB | ||
| Pathway Commons: B3GNT5 | ||
| Metabolism | MetaCyc: B3GNT5 | |
| HUMANCyc: B3GNT5 | ||
| Regulation | Ensembl's Regulation: ENSG00000176597 | |
| miRBase: chr3 :182,971,031-182,991,179 | ||
| TargetScan: NM_032047 | ||
| cisRED: ENSG00000176597 | ||
| Context | iHOP: B3GNT5 | |
| cancer metabolism search in PubMed: B3GNT5 | ||
| UCL Cancer Institute: B3GNT5 | ||
| Assigned class in ccmGDB | C | |
| Top |
| Phenotypic Information for B3GNT5(metabolism pathway, cancer, disease, phenome) |
| Cancer | CGAP: B3GNT5 |
| Familial Cancer Database: B3GNT5 | |
| * This gene is included in those cancer gene databases. |
|
|
|
|
|
| . | ||||||||||||||||||||||||||||||||||||||||||||||||||||||||||||||||||||||||||||||||||||||||||||||||||||||||||||||||||||||||||||||||||||||||||||||||||||||||||||||||||||||||||||||||||||||||||||||||||||||||||||||||||||||||||||||||||||||||||||||||||||||||||||||||||||||||||||||||||||||||||||||||||||||||||||||||||||
Oncogene 1 | Significant driver gene in | |||||||||||||||||||||||||||||||||||||||||||||||||||||||||||||||||||||||||||||||||||||||||||||||||||||||||||||||||||||||||||||||||||||||||||||||||||||||||||||||||||||||||||||||||||||||||||||||||||||||||||||||||||||||||||||||||||||||||||||||||||||||||||||||||||||||||||||||||||||||||||||||||||||||||||||||||||||||||
| cf) number; DB name 1 Oncogene; http://nar.oxfordjournals.org/content/35/suppl_1/D721.long, 2 Tumor Suppressor gene; https://bioinfo.uth.edu/TSGene/, 3 Cancer Gene Census; http://www.nature.com/nrc/journal/v4/n3/abs/nrc1299.html, 4 CancerGenes; http://nar.oxfordjournals.org/content/35/suppl_1/D721.long, 5 Network of Cancer Gene; http://ncg.kcl.ac.uk/index.php, 1Therapeutic Vulnerabilities in Cancer; http://cbio.mskcc.org/cancergenomics/statius/ |
| REACTOME_METABOLISM_OF_PROTEINS | |
| OMIM | |
| Orphanet | |
| Disease | KEGG Disease: B3GNT5 |
| MedGen: B3GNT5 (Human Medical Genetics with Condition) | |
| ClinVar: B3GNT5 | |
| Phenotype | MGI: B3GNT5 (International Mouse Phenotyping Consortium) |
| PhenomicDB: B3GNT5 | |
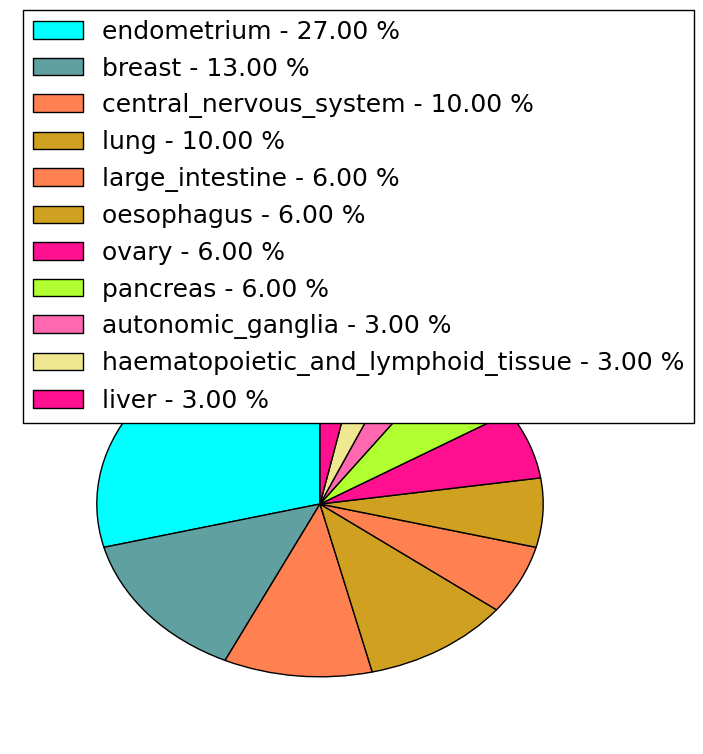
| Mutations for B3GNT5 |
| * Under tables are showing count per each tissue to give us broad intuition about tissue specific mutation patterns.You can go to the detailed page for each mutation database's web site. |
| - Statistics for Tissue and Mutation type | Top |
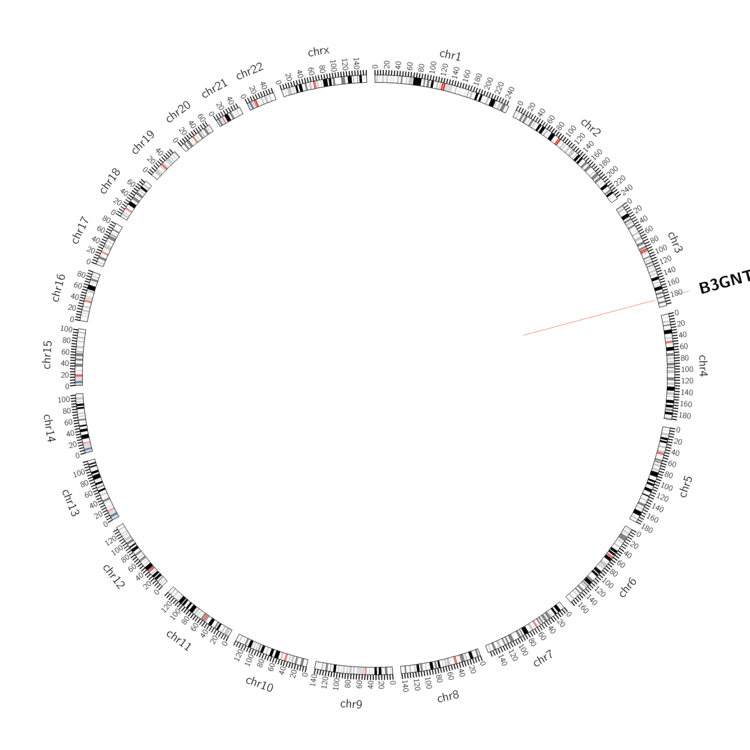 |
| - For Inter-chromosomal Variations |
| There's no inter-chromosomal structural variation. |
| - For Intra-chromosomal Variations |
| * Intra-chromosomal variantions includes 'intrachromosomal amplicon to amplicon', 'intrachromosomal amplicon to non-amplified dna', 'intrachromosomal deletion', 'intrachromosomal fold-back inversion', 'intrachromosomal inversion', 'intrachromosomal tandem duplication', 'Intrachromosomal unknown type', 'intrachromosomal with inverted orientation', 'intrachromosomal with non-inverted orientation'. |
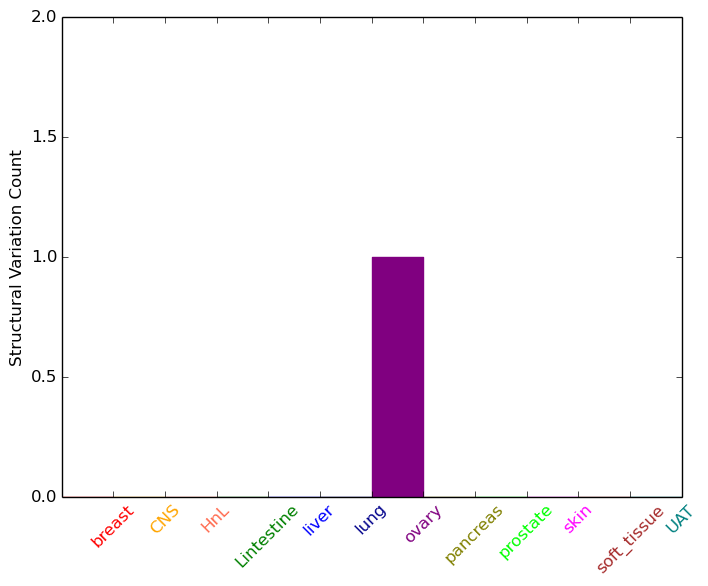 |
| Sample | Symbol_a | Chr_a | Start_a | End_a | Symbol_b | Chr_b | Start_b | End_b |
| ovary | B3GNT5 | chr3 | 182986923 | 182987123 | B3GNT5 | chr3 | 182976786 | 182976986 |
| cf) Tissue number; Tissue name (1;Breast, 2;Central_nervous_system, 3;Haematopoietic_and_lymphoid_tissue, 4;Large_intestine, 5;Liver, 6;Lung, 7;Ovary, 8;Pancreas, 9;Prostate, 10;Skin, 11;Soft_tissue, 12;Upper_aerodigestive_tract) |
| * From mRNA Sanger sequences, Chitars2.0 arranged chimeric transcripts. This table shows B3GNT5 related fusion information. |
| ID | Head Gene | Tail Gene | Accession | Gene_a | qStart_a | qEnd_a | Chromosome_a | tStart_a | tEnd_a | Gene_a | qStart_a | qEnd_a | Chromosome_a | tStart_a | tEnd_a |
| Top |
| Mutation type/ Tissue ID | brca | cns | cerv | endome | haematopo | kidn | Lintest | liver | lung | ns | ovary | pancre | prost | skin | stoma | thyro | urina | |||
| Total # sample | 2 | |||||||||||||||||||
| GAIN (# sample) | 2 | |||||||||||||||||||
| LOSS (# sample) |
| cf) Tissue ID; Tissue type (1; Breast, 2; Central_nervous_system, 3; Cervix, 4; Endometrium, 5; Haematopoietic_and_lymphoid_tissue, 6; Kidney, 7; Large_intestine, 8; Liver, 9; Lung, 10; NS, 11; Ovary, 12; Pancreas, 13; Prostate, 14; Skin, 15; Stomach, 16; Thyroid, 17; Urinary_tract) |
| Top |
|
 |
| Top |
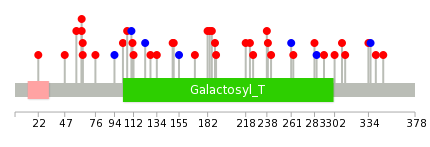
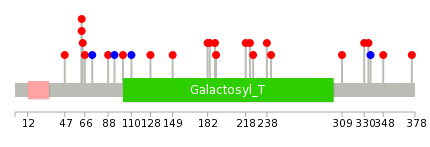
| Stat. for Non-Synonymous SNVs (# total SNVs=29) | (# total SNVs=5) |
 |  |
(# total SNVs=2) | (# total SNVs=0) |
 |
| Top |
| * When you move the cursor on each content, you can see more deailed mutation information on the Tooltip. Those are primary_site,primary_histology,mutation(aa),pubmedID. |
| GRCh37 position | Mutation(aa) | Unique sampleID count |
| chr3:182988300-182988300 | p.Y238* | 2 |
| chr3:182987919-182987919 | p.W111C | 2 |
| chr3:182987774-182987774 | p.S63F | 2 |
| chr3:182987776-182987776 | p.L64F | 2 |
| chr3:182988095-182988095 | p.L170P | 1 |
| chr3:182987902-182987902 | p.G106R | 1 |
| chr3:182988511-182988511 | p.T309A | 1 |
| chr3:182988119-182988119 | p.W178* | 1 |
| chr3:182987617-182987617 | p.K12fs*4 | 1 |
| chr3:182988301-182988301 | p.V239M | 1 |
| Top |
|
 |
| Point Mutation/ Tissue ID | 1 | 2 | 3 | 4 | 5 | 6 | 7 | 8 | 9 | 10 | 11 | 12 | 13 | 14 | 15 | 16 | 17 | 18 | 19 | 20 |
| # sample | 2 | 2 | 1 | 1 | 3 | 2 | 1 | 2 | 5 | |||||||||||
| # mutation | 6 | 2 | 1 | 1 | 3 | 2 | 1 | 2 | 6 | |||||||||||
| nonsynonymous SNV | 6 | 2 | 1 | 3 | 1 | 1 | 6 | |||||||||||||
| synonymous SNV | 1 | 2 | 1 |
| cf) Tissue ID; Tissue type (1; BLCA[Bladder Urothelial Carcinoma], 2; BRCA[Breast invasive carcinoma], 3; CESC[Cervical squamous cell carcinoma and endocervical adenocarcinoma], 4; COAD[Colon adenocarcinoma], 5; GBM[Glioblastoma multiforme], 6; Glioma Low Grade, 7; HNSC[Head and Neck squamous cell carcinoma], 8; KICH[Kidney Chromophobe], 9; KIRC[Kidney renal clear cell carcinoma], 10; KIRP[Kidney renal papillary cell carcinoma], 11; LAML[Acute Myeloid Leukemia], 12; LUAD[Lung adenocarcinoma], 13; LUSC[Lung squamous cell carcinoma], 14; OV[Ovarian serous cystadenocarcinoma ], 15; PAAD[Pancreatic adenocarcinoma], 16; PRAD[Prostate adenocarcinoma], 17; SKCM[Skin Cutaneous Melanoma], 18:STAD[Stomach adenocarcinoma], 19:THCA[Thyroid carcinoma], 20:UCEC[Uterine Corpus Endometrial Carcinoma]) |
| Top |
| * We represented just top 10 SNVs. When you move the cursor on each content, you can see more deailed mutation information on the Tooltip. Those are primary_site, primary_histology, mutation(aa), pubmedID. |
| Genomic Position | Mutation(aa) | Unique sampleID count |
| chr3:182987774 | p.S63F | 2 |
| chr3:182988511 | p.M190I | 1 |
| chr3:182988032 | p.F218V | 1 |
| chr3:182988576 | p.S47C | 1 |
| chr3:182987726 | p.R222C | 1 |
| chr3:182988131 | p.R225C | 1 |
| chr3:182988588 | p.L64F | 1 |
| chr3:182988136 | p.Y238N | 1 |
| chr3:182988594 | p.H66R | 1 |
| chr3:182987776 | p.E242K | 1 |
| * Copy number data were extracted from TCGA using R package TCGA-Assembler. The URLs of all public data files on TCGA DCC data server were gathered on Jan-05-2015. Function ProcessCNAData in TCGA-Assembler package was used to obtain gene-level copy number value which is calculated as the average copy number of the genomic region of a gene. |
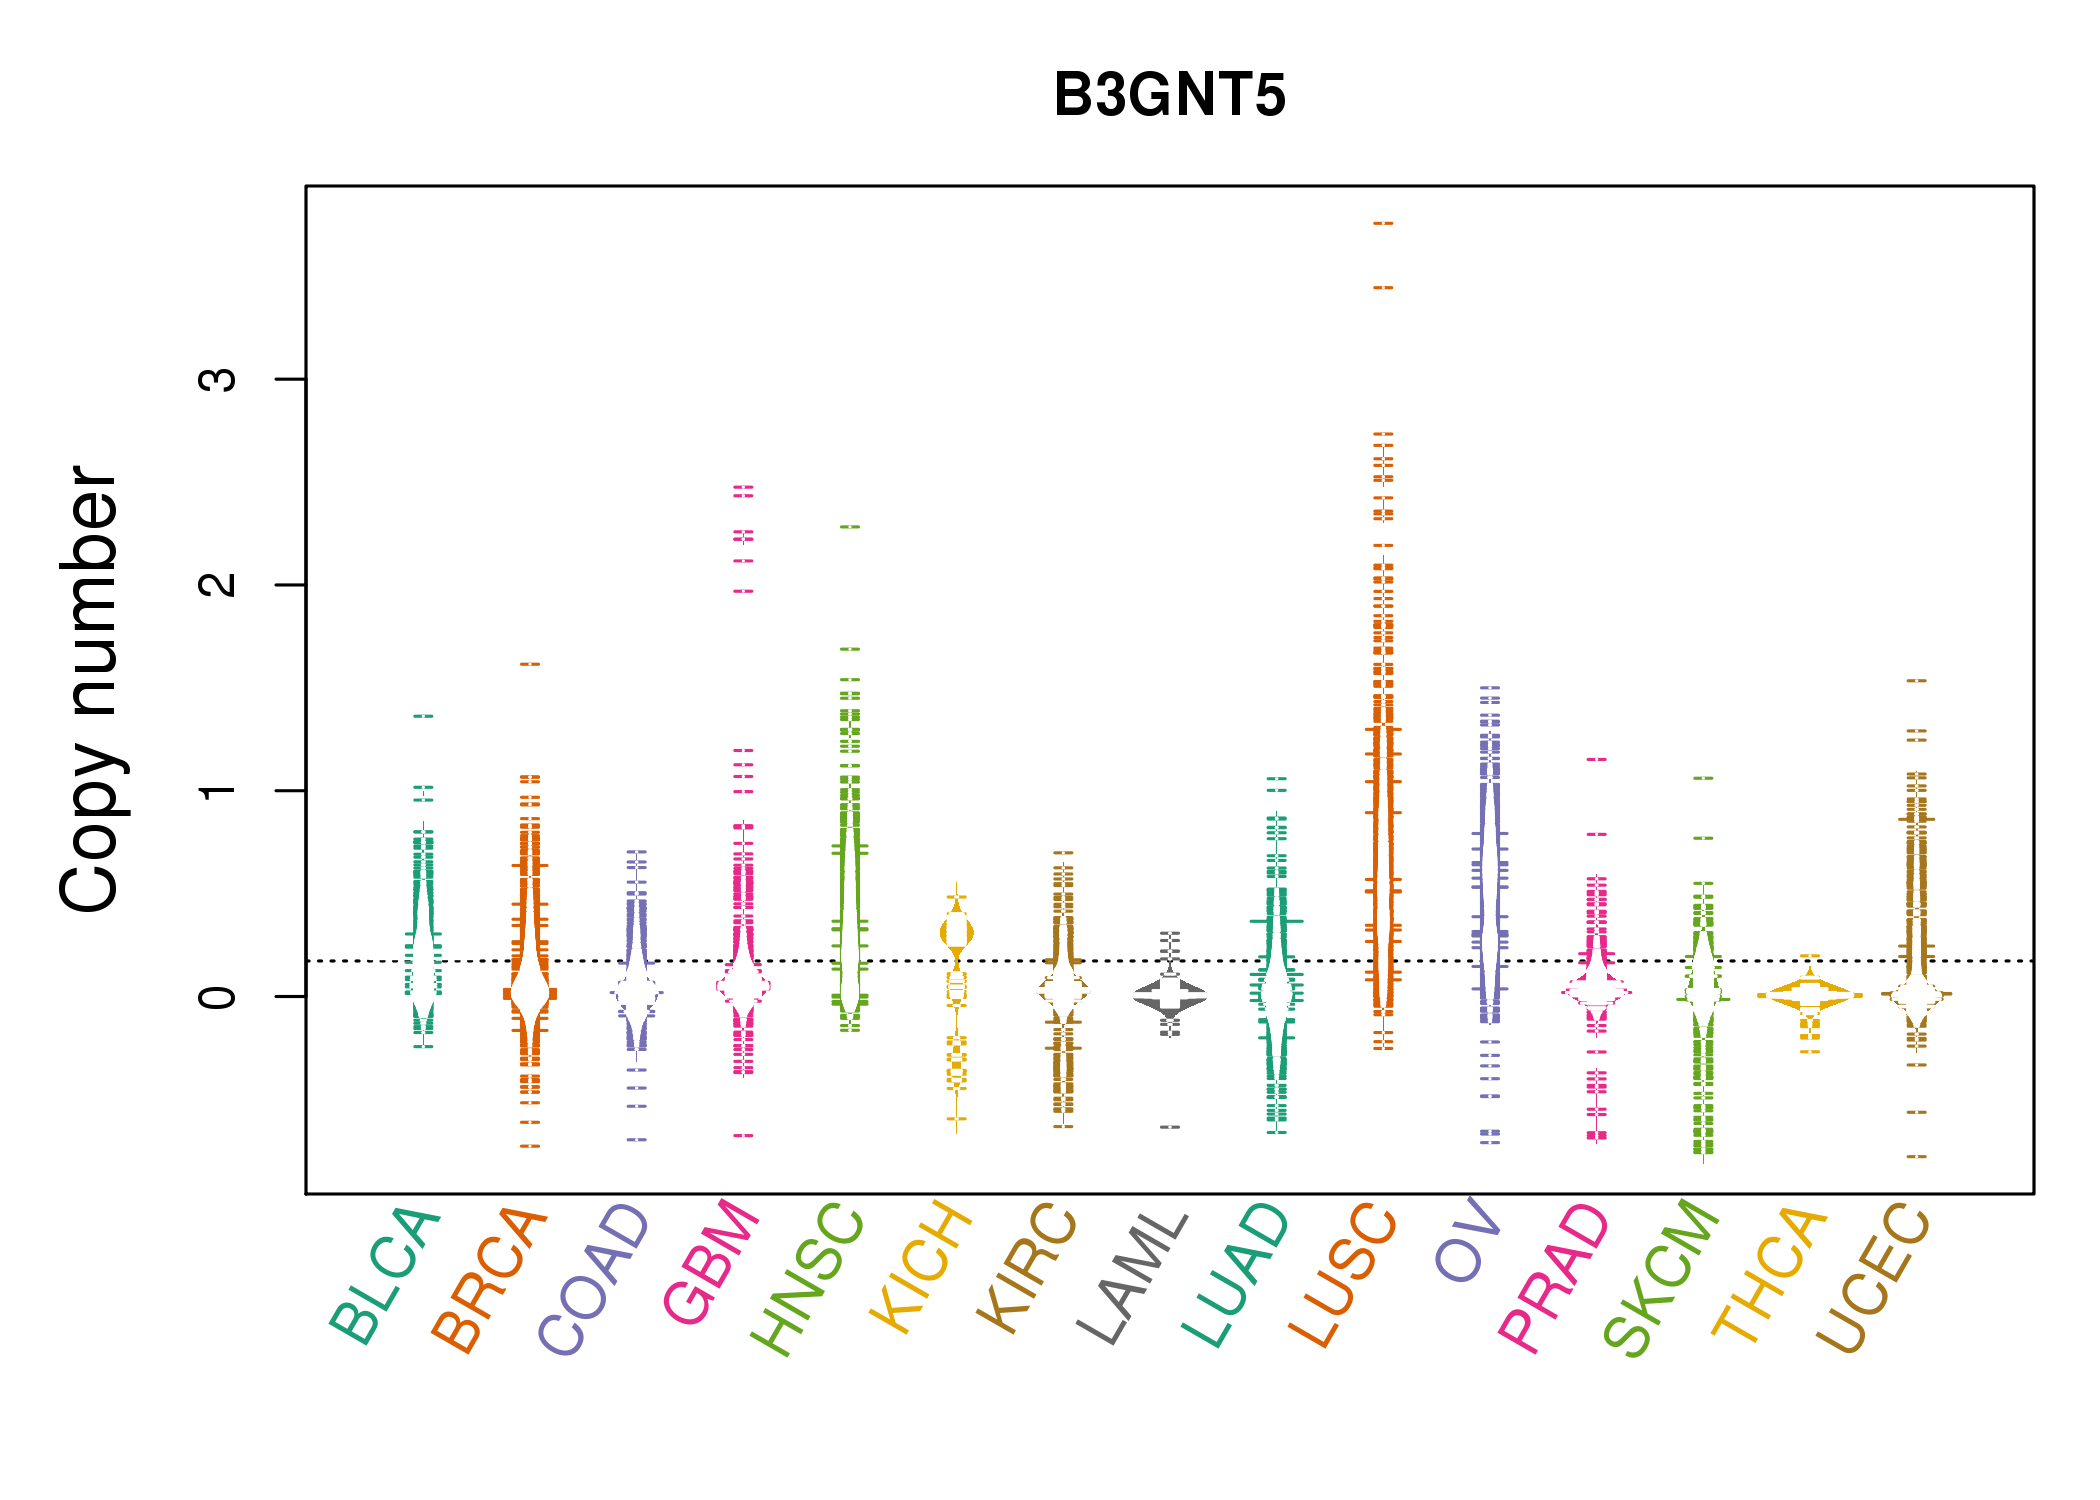 |
| cf) Tissue ID[Tissue type]: BLCA[Bladder Urothelial Carcinoma], BRCA[Breast invasive carcinoma], CESC[Cervical squamous cell carcinoma and endocervical adenocarcinoma], COAD[Colon adenocarcinoma], GBM[Glioblastoma multiforme], Glioma Low Grade, HNSC[Head and Neck squamous cell carcinoma], KICH[Kidney Chromophobe], KIRC[Kidney renal clear cell carcinoma], KIRP[Kidney renal papillary cell carcinoma], LAML[Acute Myeloid Leukemia], LUAD[Lung adenocarcinoma], LUSC[Lung squamous cell carcinoma], OV[Ovarian serous cystadenocarcinoma ], PAAD[Pancreatic adenocarcinoma], PRAD[Prostate adenocarcinoma], SKCM[Skin Cutaneous Melanoma], STAD[Stomach adenocarcinoma], THCA[Thyroid carcinoma], UCEC[Uterine Corpus Endometrial Carcinoma] |
| Top |
| Gene Expression for B3GNT5 |
| * CCLE gene expression data were extracted from CCLE_Expression_Entrez_2012-10-18.res: Gene-centric RMA-normalized mRNA expression data. |
 |
| * Normalized gene expression data of RNASeqV2 was extracted from TCGA using R package TCGA-Assembler. The URLs of all public data files on TCGA DCC data server were gathered at Jan-05-2015. Only eight cancer types have enough normal control samples for differential expression analysis. (t test, adjusted p<0.05 (using Benjamini-Hochberg FDR)) |
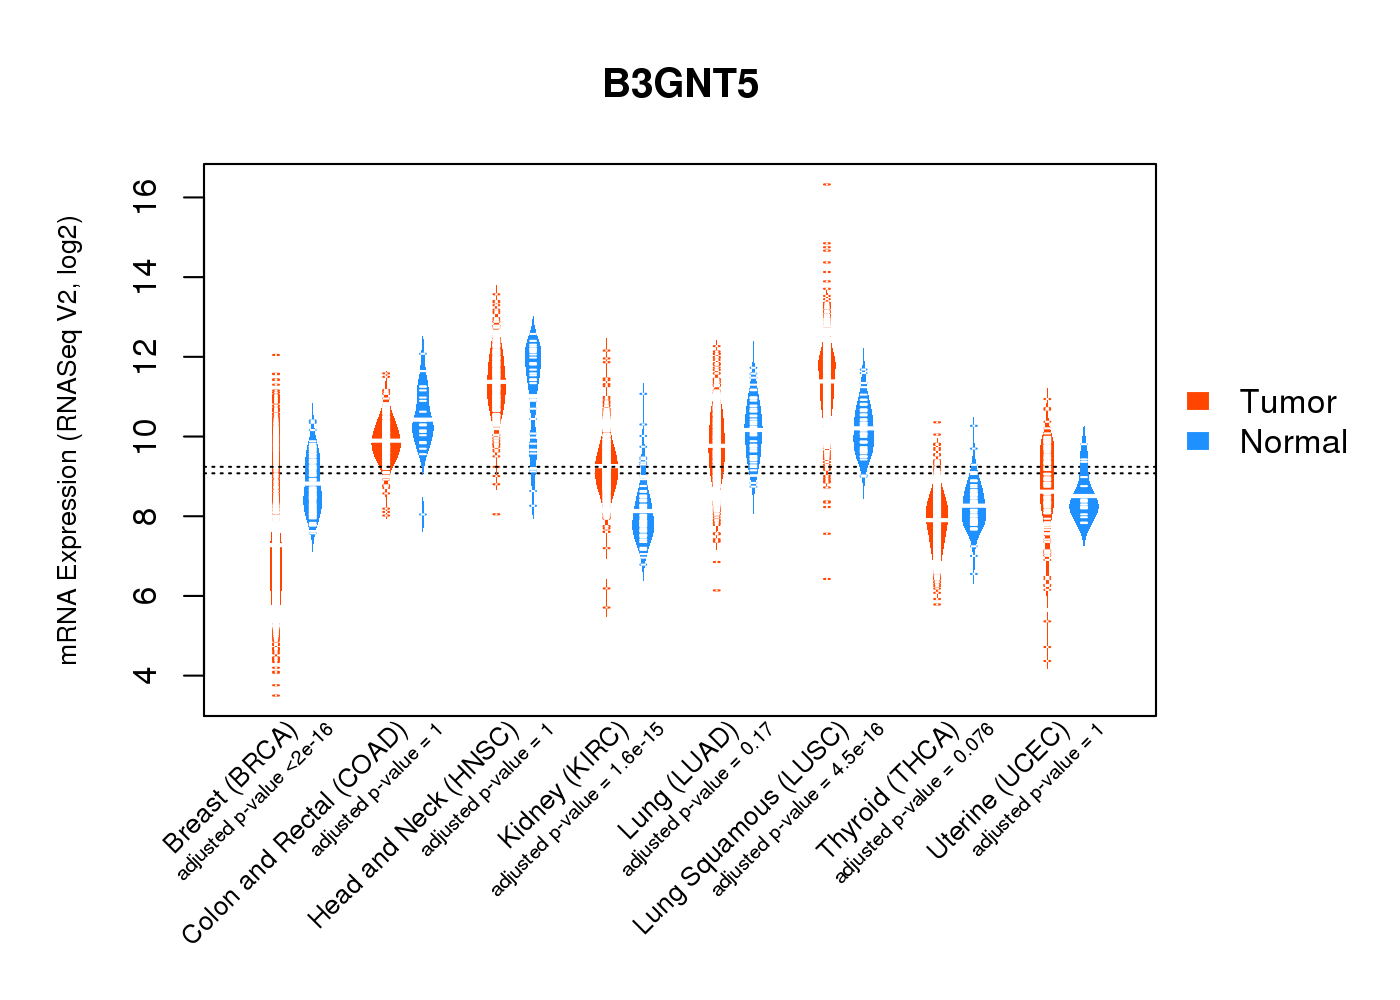 |
| Top |
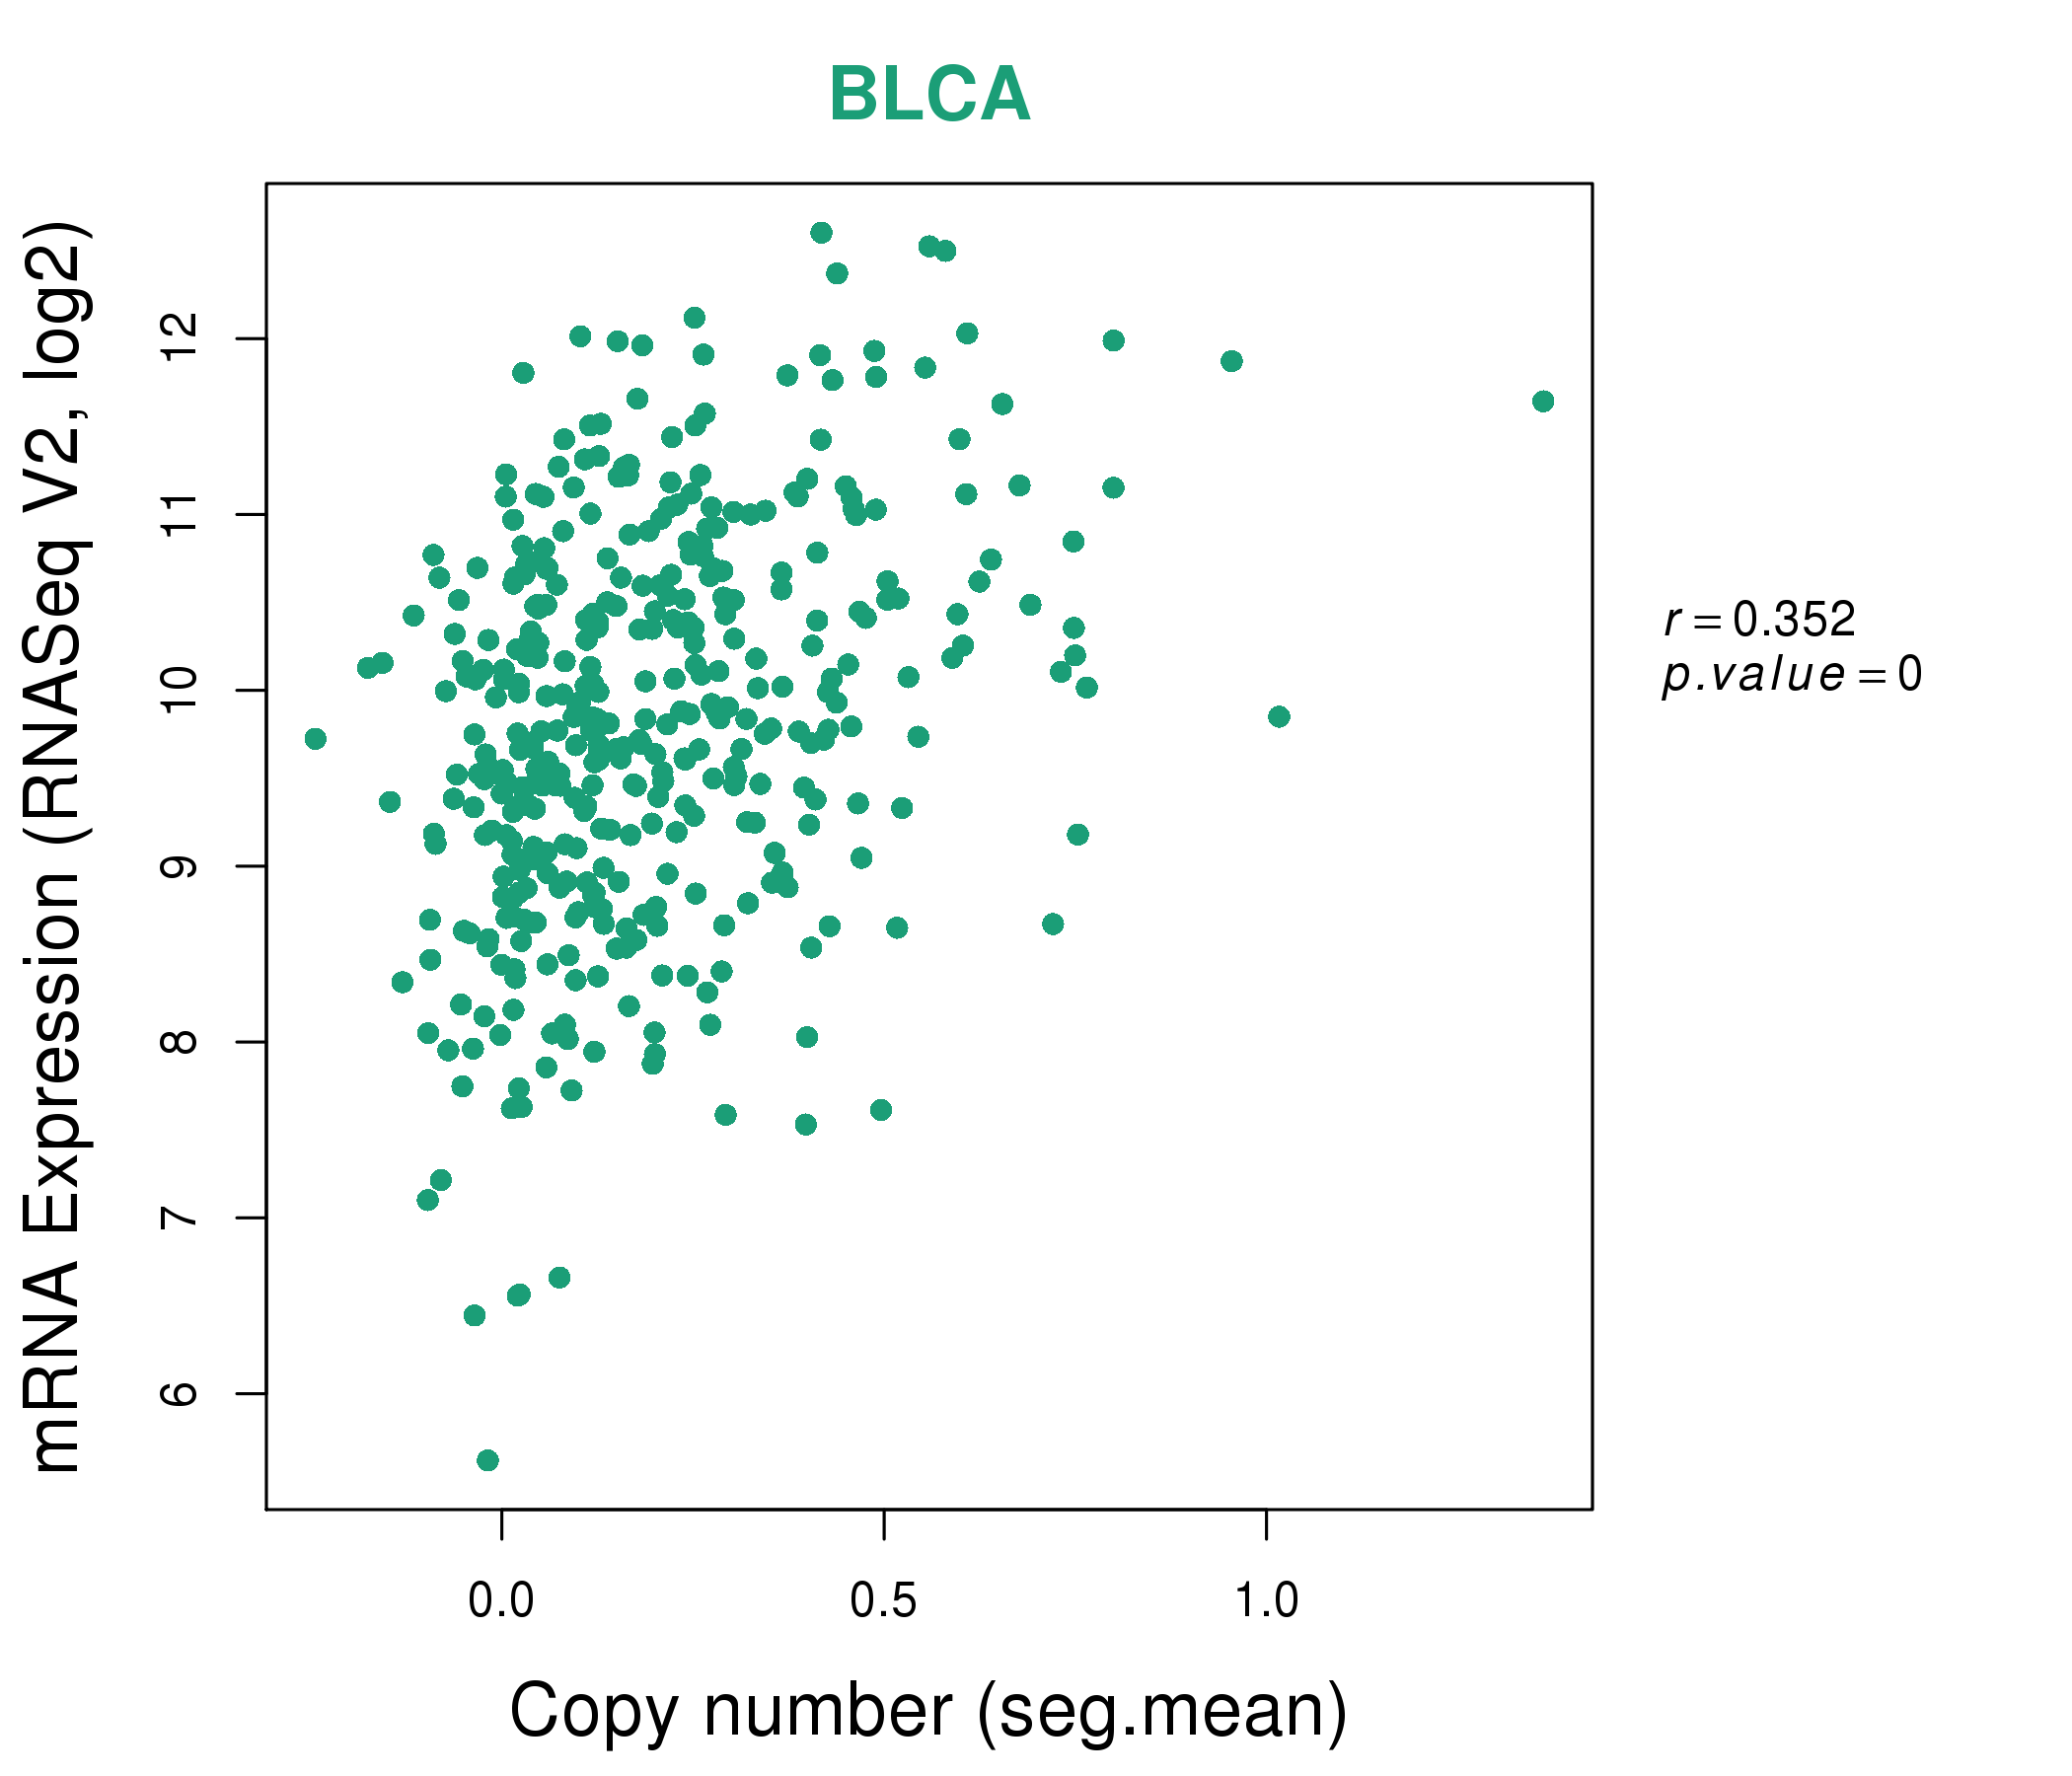
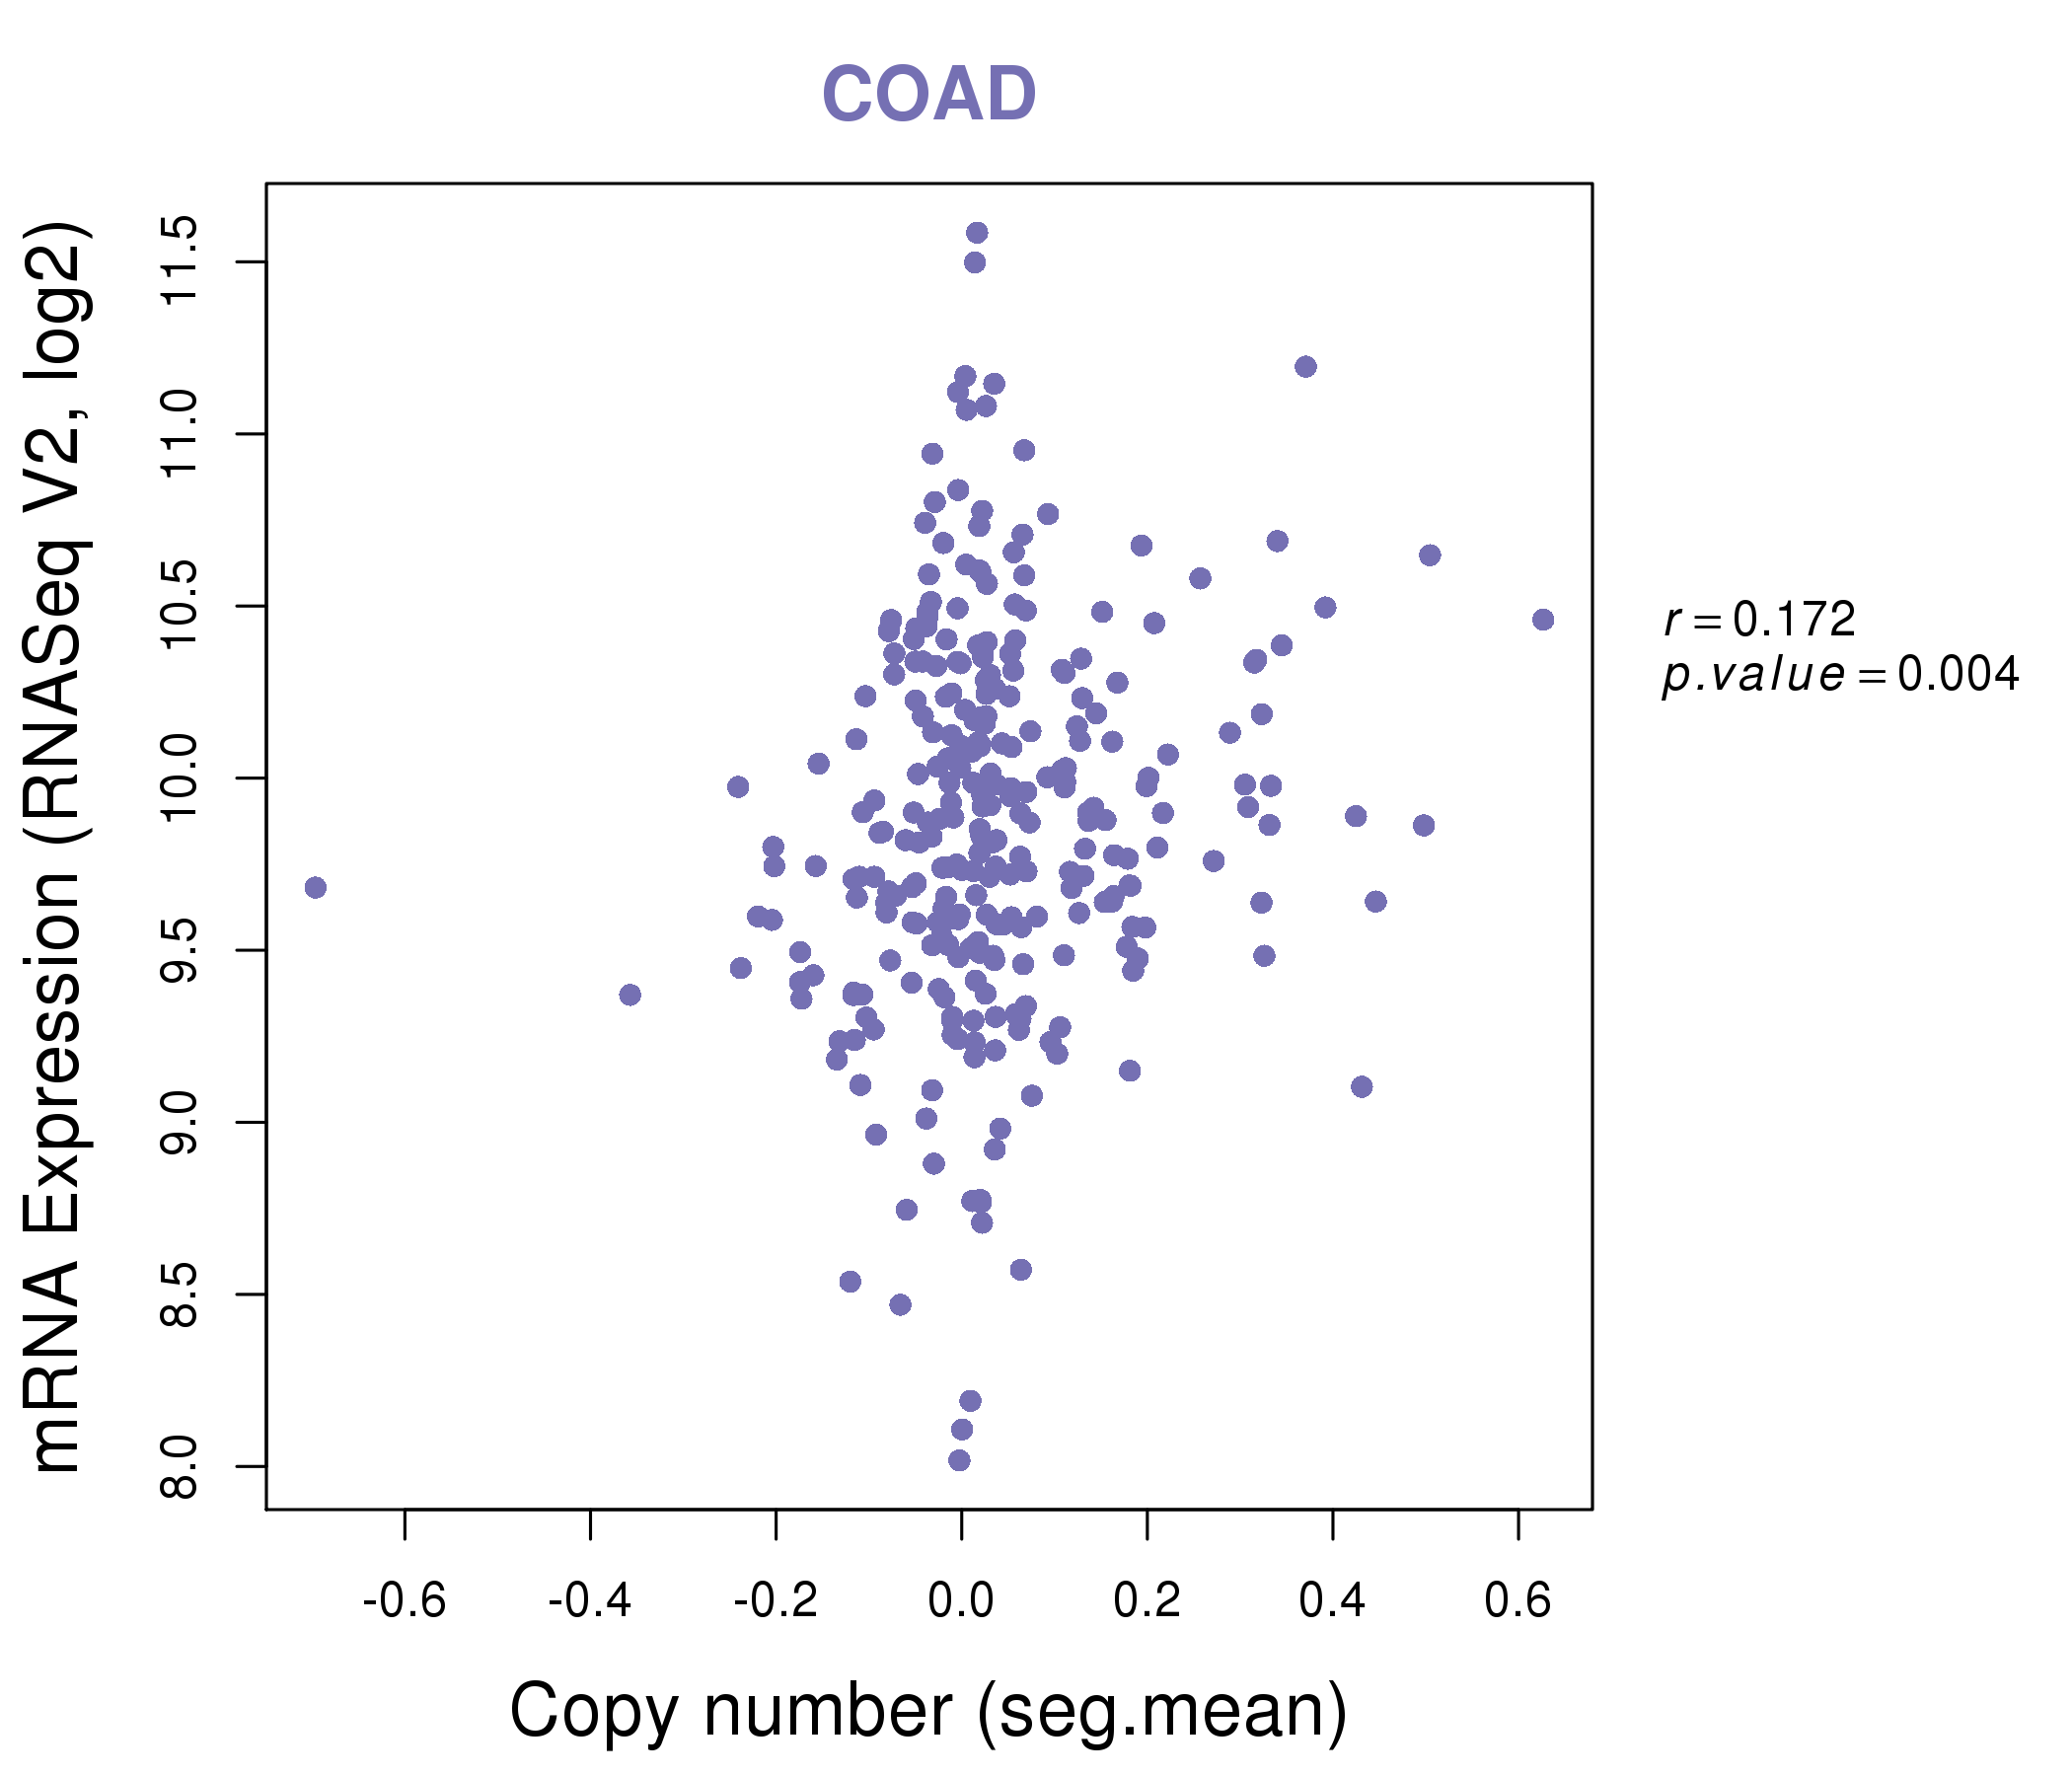
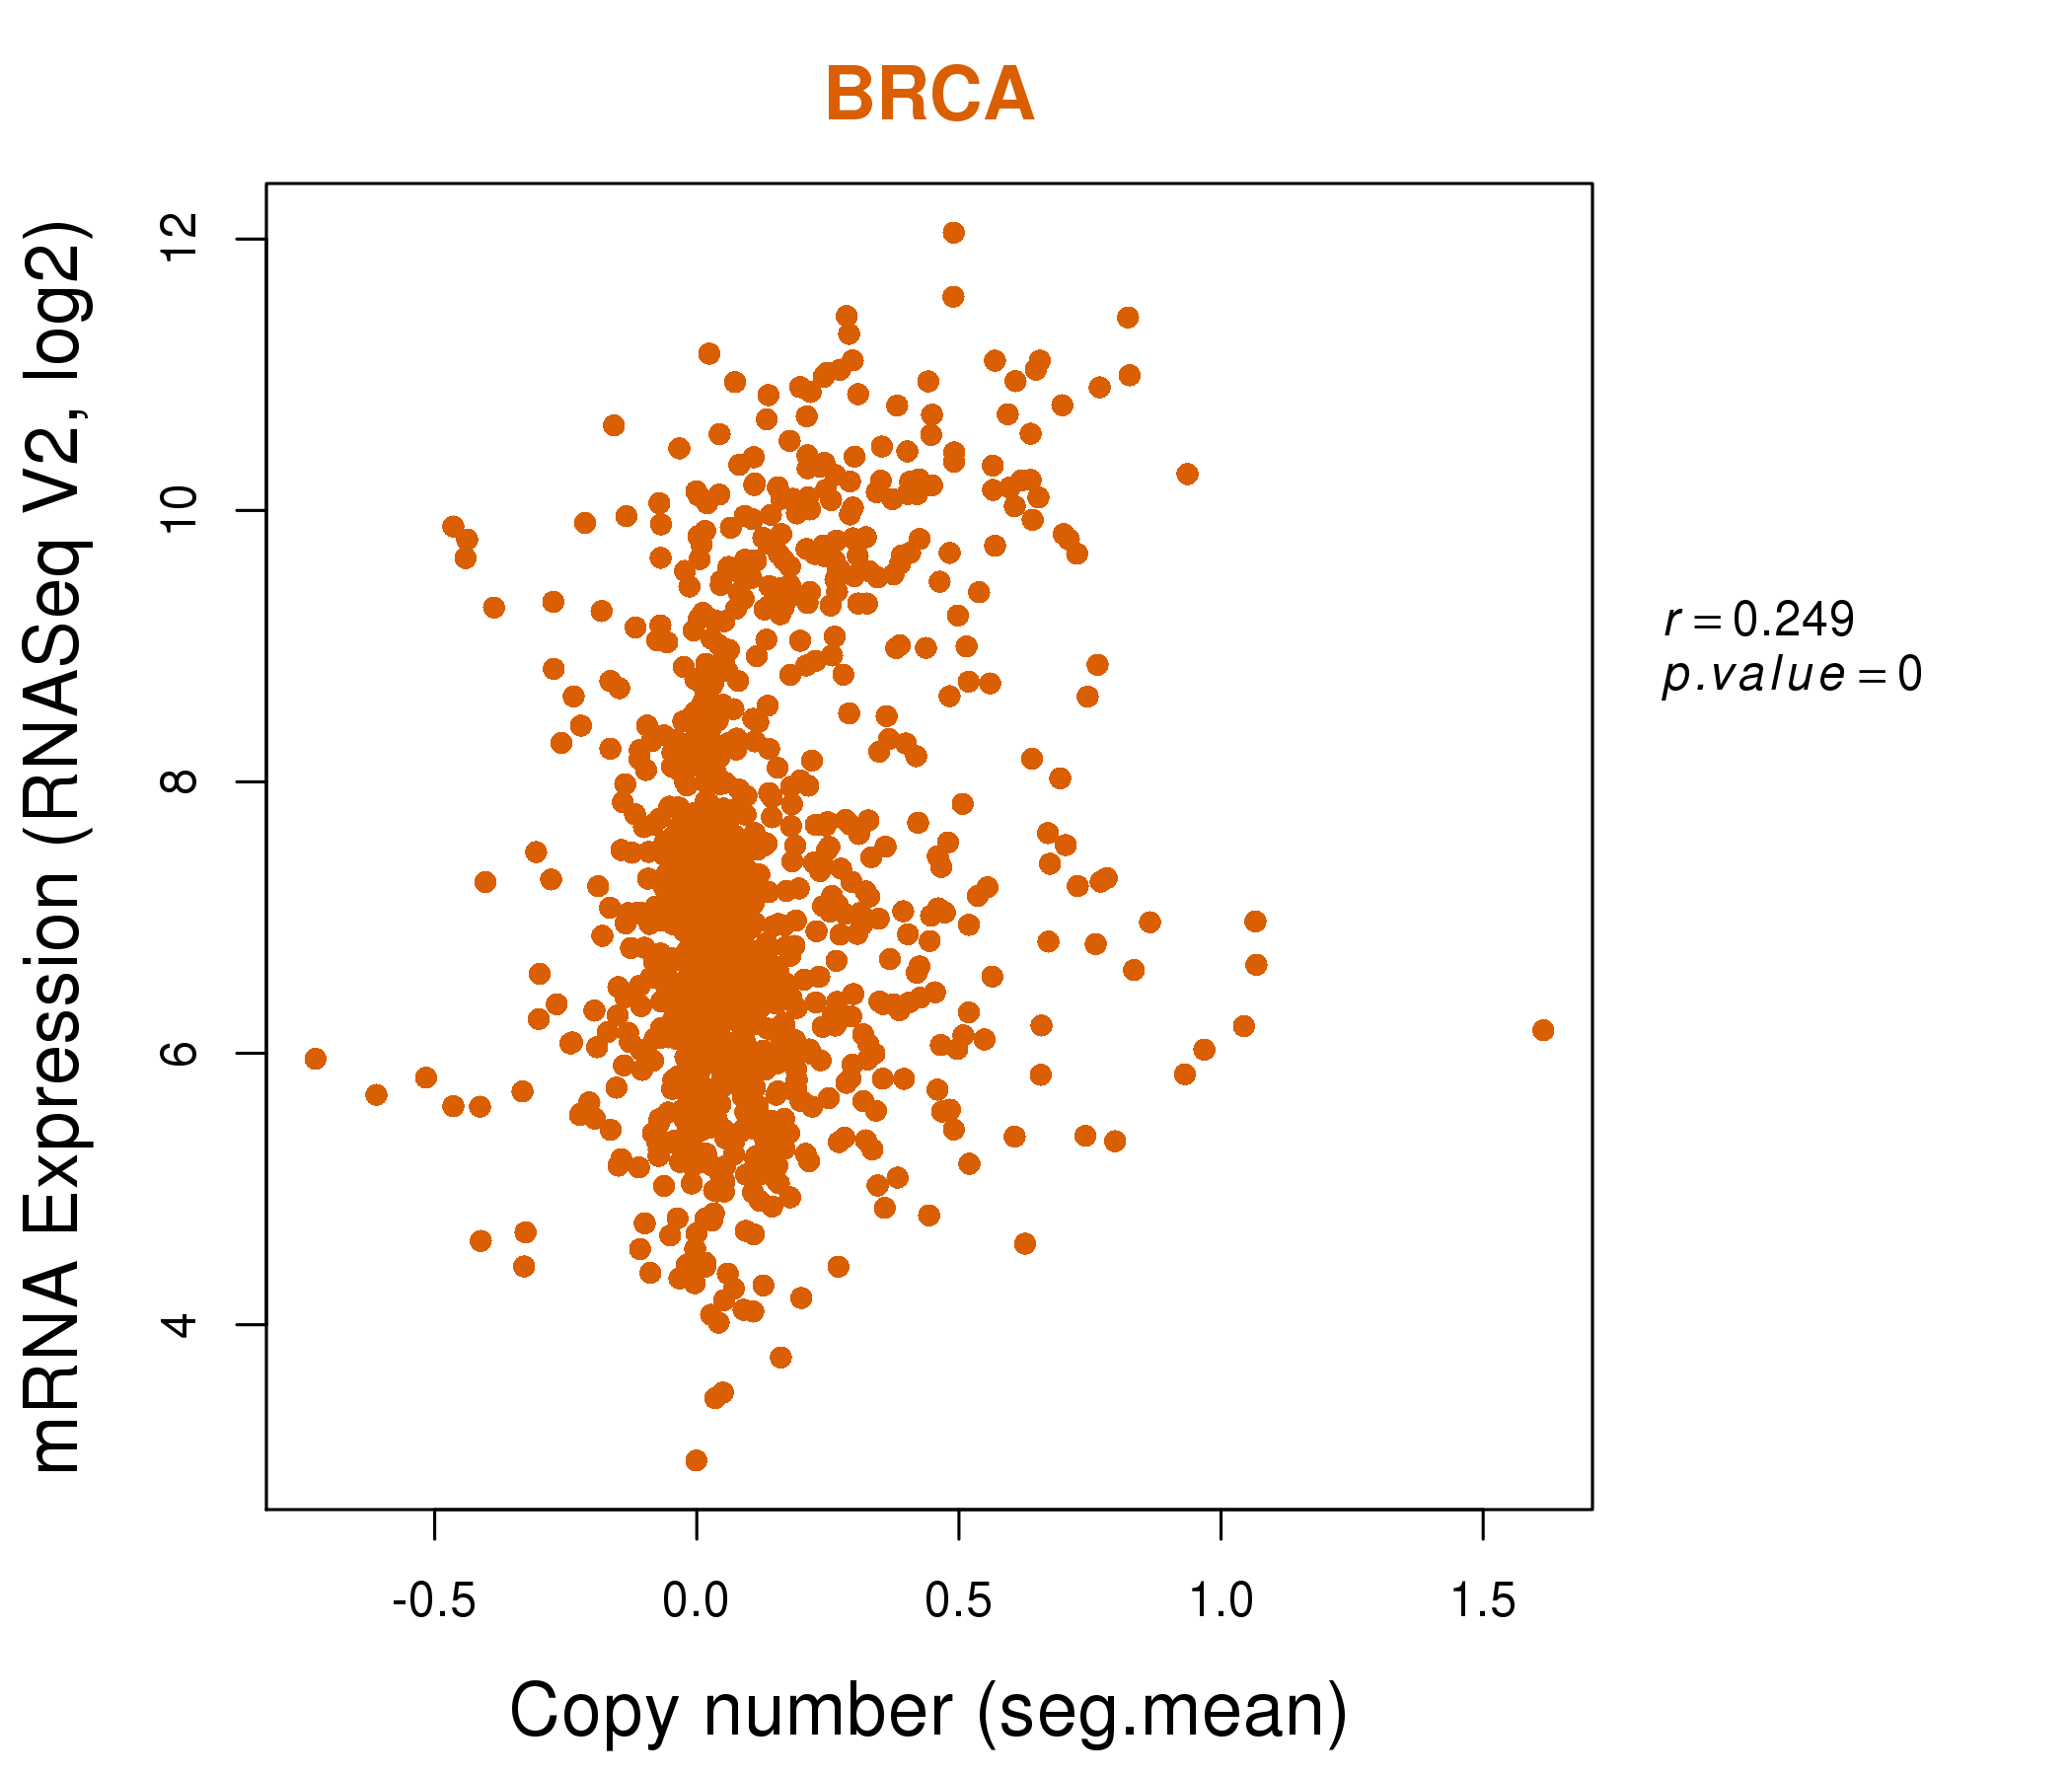
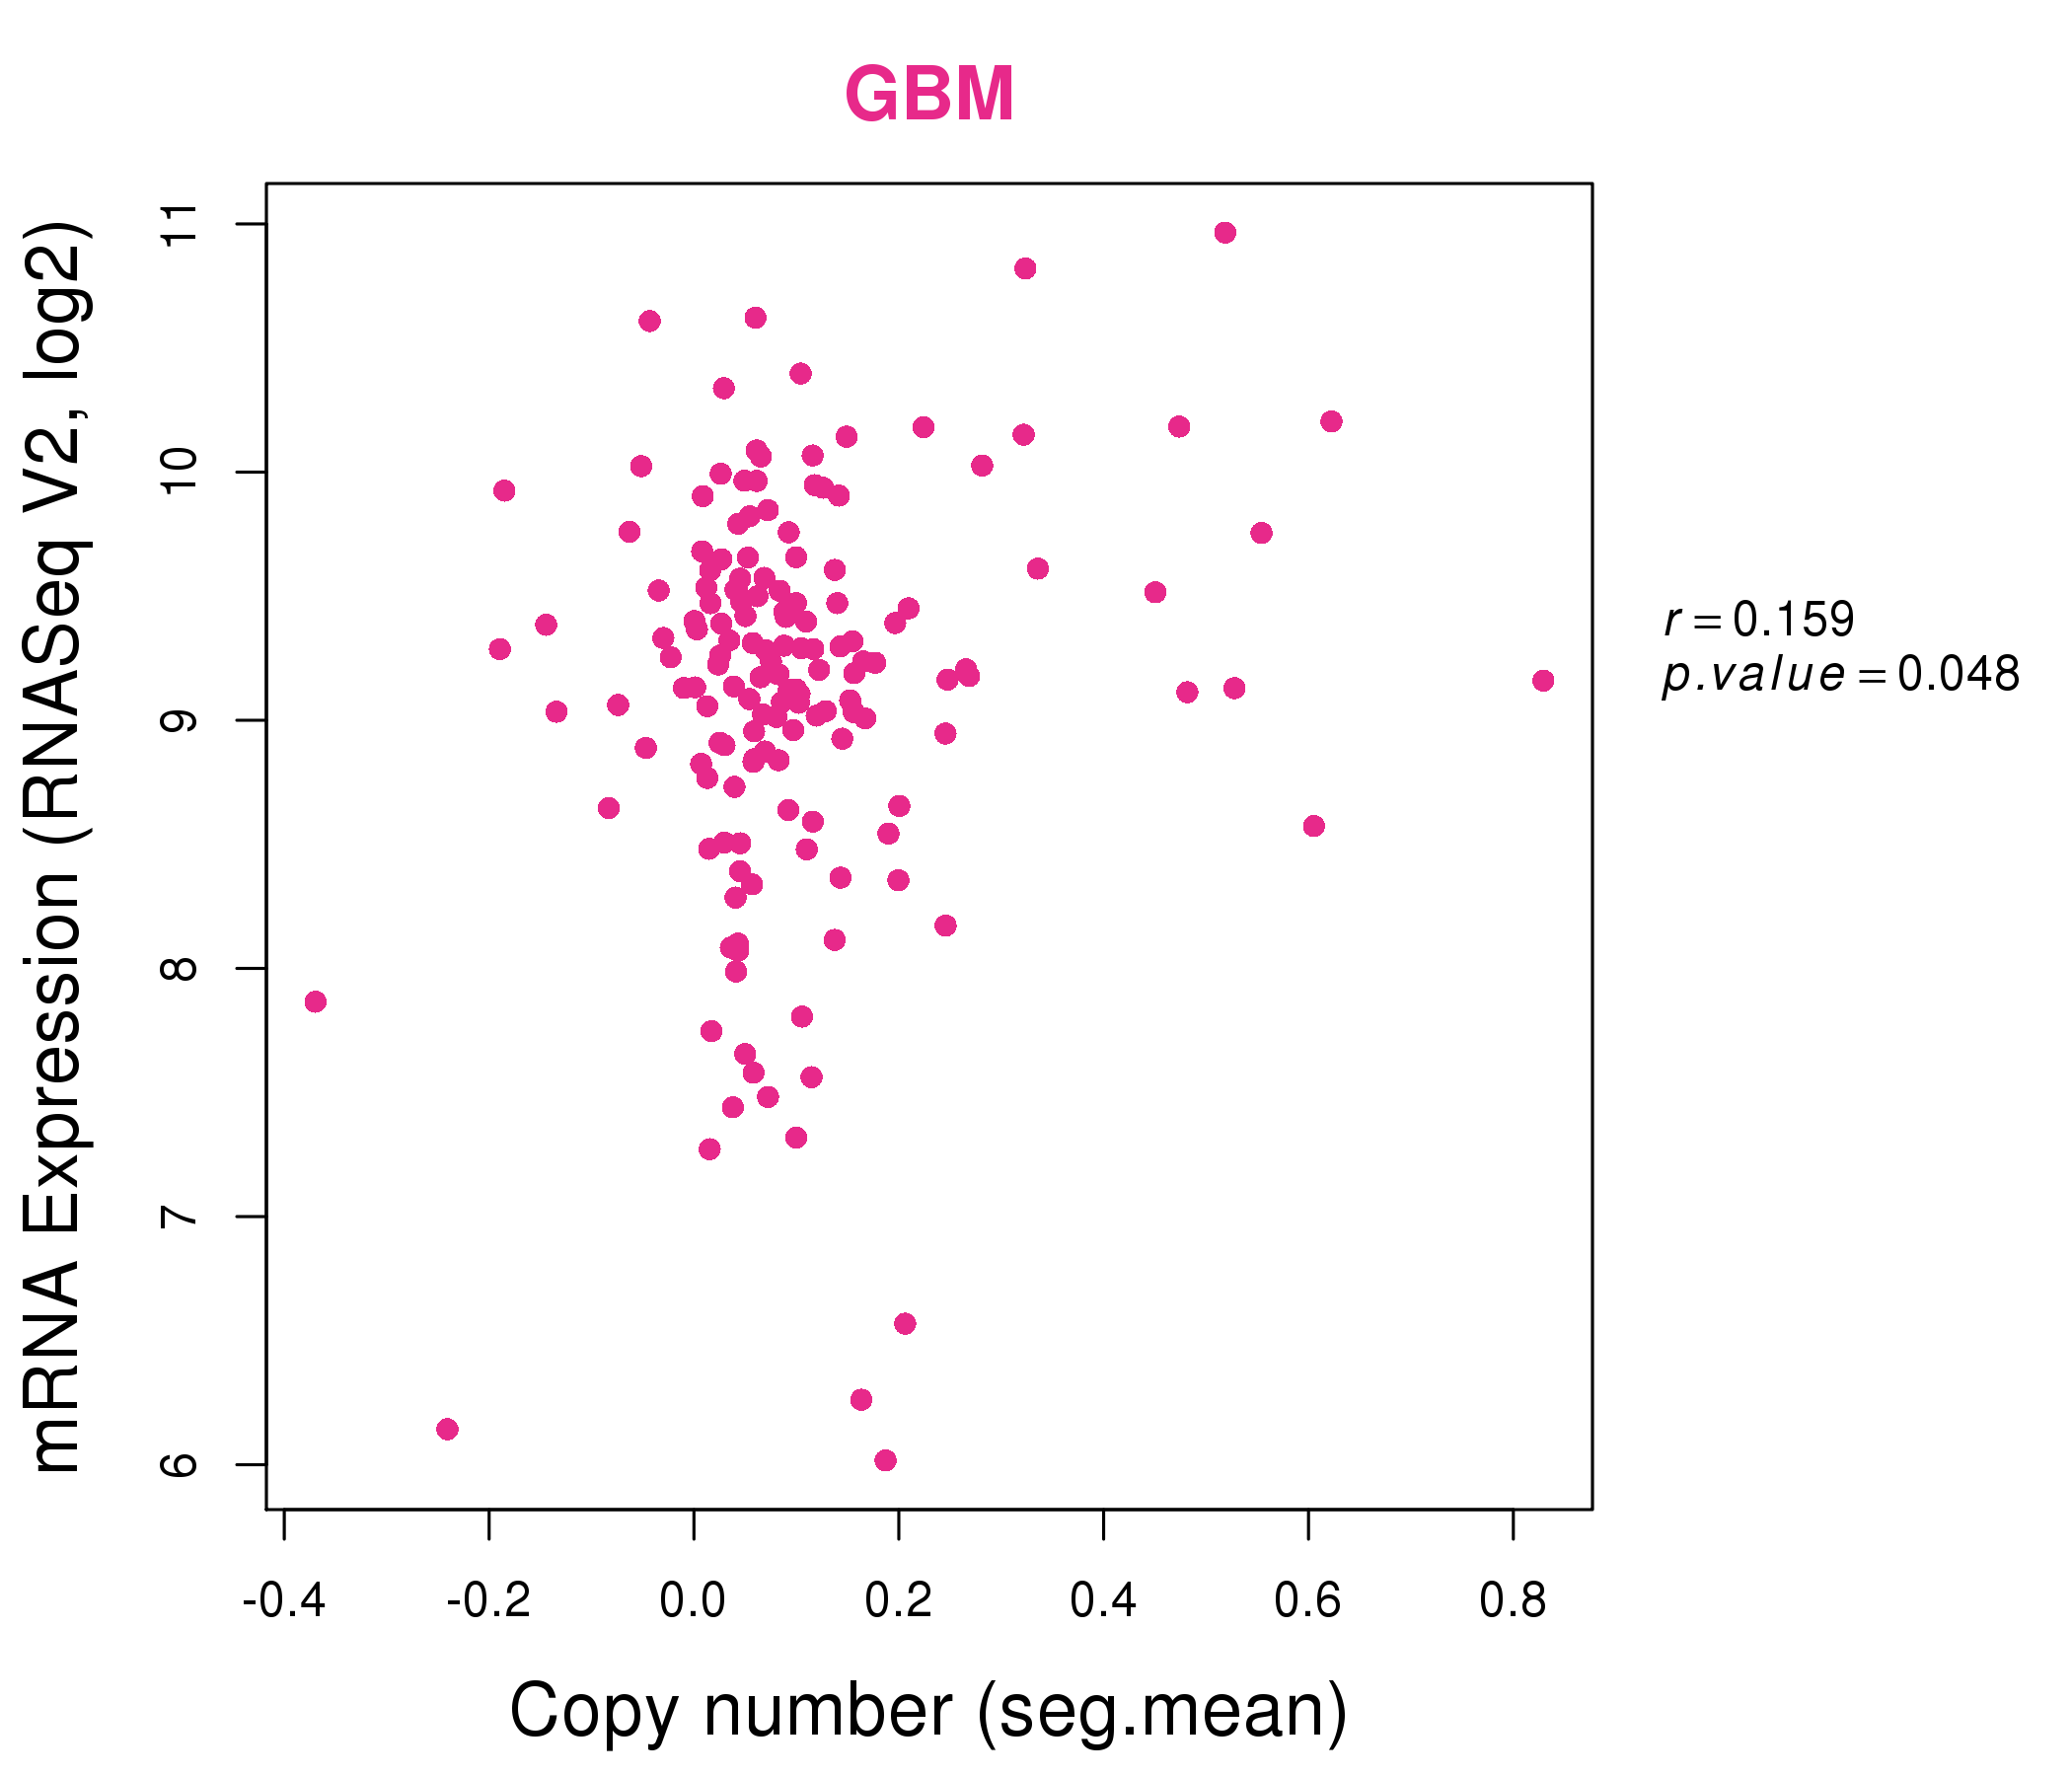
| * This plots show the correlation between CNV and gene expression. |
: Open all plots for all cancer types
 |
|
 |
|
| Top |
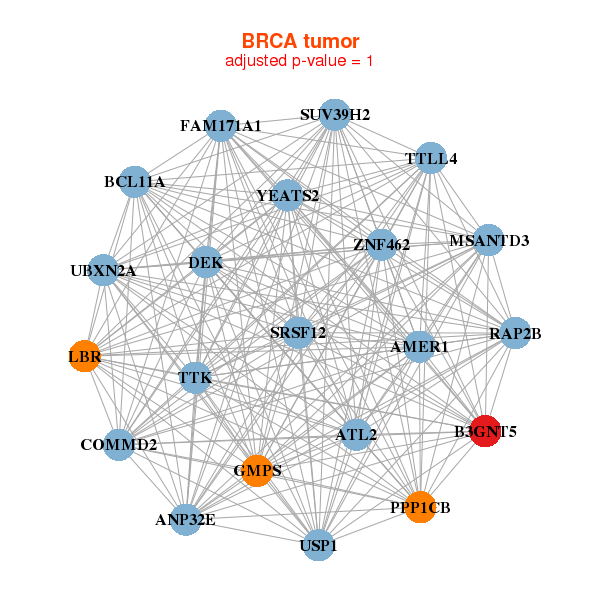
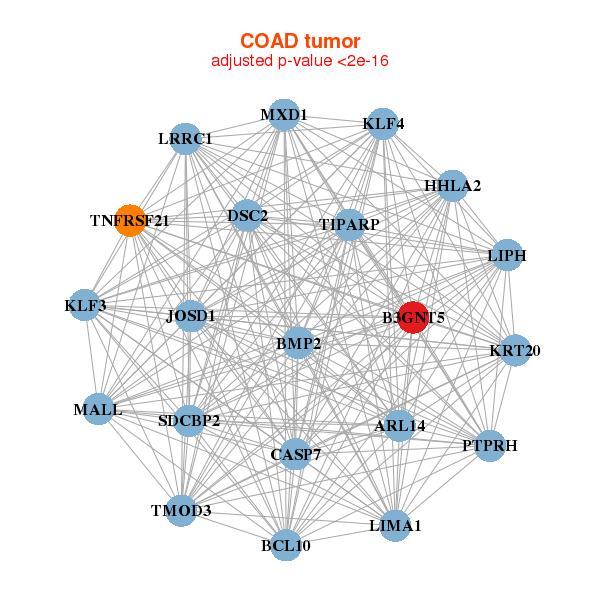
| Gene-Gene Network Information |
| * Co-Expression network figures were drawn using R package igraph. Only the top 20 genes with the highest correlations were shown. Red circle: input gene, orange circle: cell metabolism gene, sky circle: other gene |
: Open all plots for all cancer types
 |
|
| ANP32E,ATL2,B3GNT5,BCL11A,MSANTD3,COMMD2,DEK, AMER1,FAM171A1,GMPS,LBR,PPP1CB,RAP2B,SRSF12, SUV39H2,TTK,TTLL4,UBXN2A,USP1,YEATS2,ZNF462 | ABHD13,ATF3,B3GNT5,CCNL1,CHMP1B,DDX3X,DYRK3, EGR1,FEM1C,IMPA1,KLHL15,LRRC70,MAP3K8,MAPK1IP1L, MCL1,NCOA7,NR4A2,PPP1R15B,PTGS2,RFXAP,TRIB1 |
 |
|
| ARL14,B3GNT5,BCL10,BMP2,CASP7,DSC2,HHLA2, JOSD1,KLF3,KLF4,KRT20,LIMA1,LIPH,LRRC1, MALL,MXD1,PTPRH,SDCBP2,TIPARP,TMOD3,TNFRSF21 | AVPI1,B3GNT5,BCL10,BMP2,C4orf19,DSC2,ABHD17B, FOSL2,GPATCH1,JOSD1,KLF3,KLF6,MIDN,MIER3, NET1,PPP1R15B,RBM47,RCAN1,RHPN2,RNF6,SLC35D1 |
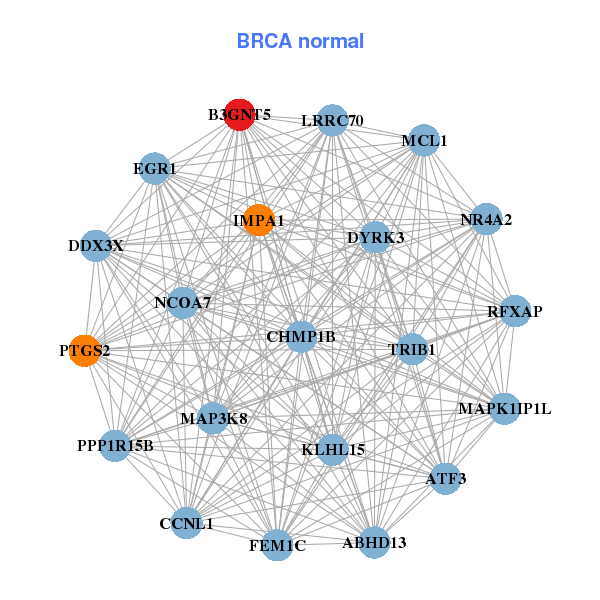
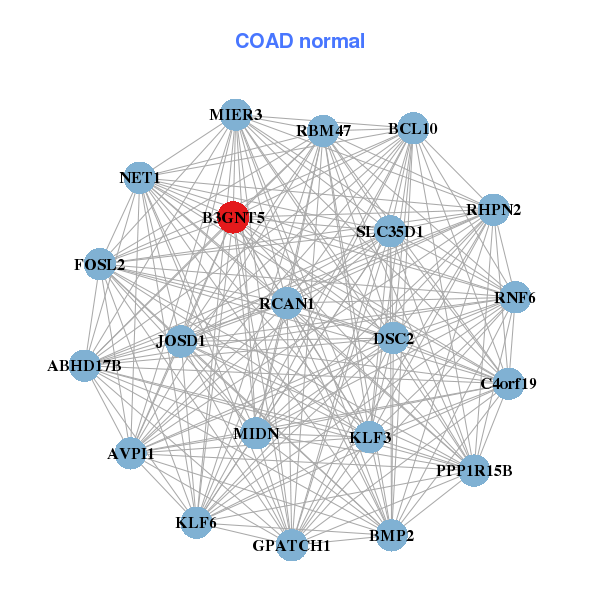
| * Co-Expression network figures were drawn using R package igraph. Only the top 20 genes with the highest correlations were shown. Red circle: input gene, orange circle: cell metabolism gene, sky circle: other gene |
: Open all plots for all cancer types
| Top |
: Open all interacting genes' information including KEGG pathway for all interacting genes from DAVID
| Top |
| Pharmacological Information for B3GNT5 |
| There's no related Drug. |
| Top |
| Cross referenced IDs for B3GNT5 |
| * We obtained these cross-references from Uniprot database. It covers 150 different DBs, 18 categories. http://www.uniprot.org/help/cross_references_section |
: Open all cross reference information
|
Copyright © 2016-Present - The Univsersity of Texas Health Science Center at Houston @ |