|
||||||||||||||||||||||||||||||||||||||||||||||||||||||||||||||||||||||||||||||||||||||||||||||||||||||||||||||||||||||||||||||||||||||||||||||||||||||||||||||||||||||||||||||||||||||||||||||||||||||||||||||||||||||||||||||||||||||||||||||||||||||||||||||||||||||||||||||||||||||||||||||||||||||||||||||||||||||||||
| |
| Phenotypic Information (metabolism pathway, cancer, disease, phenome) |
| |
| |
| Gene-Gene Network Information: Co-Expression Network, Interacting Genes & KEGG |
| |
|


| Gene Summary for FAR1 |
| Basic gene info. | Gene symbol | FAR1 |
| Gene name | fatty acyl CoA reductase 1 | |
| Synonyms | MLSTD2|SDR10E1 | |
| Cytomap | UCSC genome browser: 11p15.2 | |
| Genomic location | chr11 :13690205-13753893 | |
| Type of gene | protein-coding | |
| RefGenes | NM_032228.5, | |
| Ensembl id | ENSG00000197601 | |
| Description | fatty acyl-CoA reductase 1male sterility domain containing 2male sterility domain-containing protein 2putative fatty acyl reductaseshort chain dehydrogenase/reductase family 10E, member 1 | |
| Modification date | 20141207 | |
| dbXrefs | MIM : 616107 | |
| HGNC : HGNC | ||
| Ensembl : ENSG00000197601 | ||
| HPRD : 14724 | ||
| Vega : OTTHUMG00000165743 | ||
| Protein | UniProt: go to UniProt's Cross Reference DB Table | |
| Expression | CleanEX: HS_FAR1 | |
| BioGPS: 84188 | ||
| Gene Expression Atlas: ENSG00000197601 | ||
| The Human Protein Atlas: ENSG00000197601 | ||
| Pathway | NCI Pathway Interaction Database: FAR1 | |
| KEGG: FAR1 | ||
| REACTOME: FAR1 | ||
| ConsensusPathDB | ||
| Pathway Commons: FAR1 | ||
| Metabolism | MetaCyc: FAR1 | |
| HUMANCyc: FAR1 | ||
| Regulation | Ensembl's Regulation: ENSG00000197601 | |
| miRBase: chr11 :13,690,205-13,753,893 | ||
| TargetScan: NM_032228 | ||
| cisRED: ENSG00000197601 | ||
| Context | iHOP: FAR1 | |
| cancer metabolism search in PubMed: FAR1 | ||
| UCL Cancer Institute: FAR1 | ||
| Assigned class in ccmGDB | C | |
| Top |
| Phenotypic Information for FAR1(metabolism pathway, cancer, disease, phenome) |
| Cancer | CGAP: FAR1 |
| Familial Cancer Database: FAR1 | |
| * This gene is included in those cancer gene databases. |
|
|
|
|
|
| . | ||||||||||||||||||||||||||||||||||||||||||||||||||||||||||||||||||||||||||||||||||||||||||||||||||||||||||||||||||||||||||||||||||||||||||||||||||||||||||||||||||||||||||||||||||||||||||||||||||||||||||||||||||||||||||||||||||||||||||||||||||||||||||||||||||||||||||||||||||||||||||||||||||||||||||||||||||||
Oncogene 1 | Significant driver gene in | |||||||||||||||||||||||||||||||||||||||||||||||||||||||||||||||||||||||||||||||||||||||||||||||||||||||||||||||||||||||||||||||||||||||||||||||||||||||||||||||||||||||||||||||||||||||||||||||||||||||||||||||||||||||||||||||||||||||||||||||||||||||||||||||||||||||||||||||||||||||||||||||||||||||||||||||||||||||||
| cf) number; DB name 1 Oncogene; http://nar.oxfordjournals.org/content/35/suppl_1/D721.long, 2 Tumor Suppressor gene; https://bioinfo.uth.edu/TSGene/, 3 Cancer Gene Census; http://www.nature.com/nrc/journal/v4/n3/abs/nrc1299.html, 4 CancerGenes; http://nar.oxfordjournals.org/content/35/suppl_1/D721.long, 5 Network of Cancer Gene; http://ncg.kcl.ac.uk/index.php, 1Therapeutic Vulnerabilities in Cancer; http://cbio.mskcc.org/cancergenomics/statius/ |
| REACTOME_PEROXISOMAL_LIPID_METABOLISM REACTOME_METABOLISM_OF_LIPIDS_AND_LIPOPROTEINS | |
| OMIM | |
| Orphanet | |
| Disease | KEGG Disease: FAR1 |
| MedGen: FAR1 (Human Medical Genetics with Condition) | |
| ClinVar: FAR1 | |
| Phenotype | MGI: FAR1 (International Mouse Phenotyping Consortium) |
| PhenomicDB: FAR1 | |
| Mutations for FAR1 |
| * Under tables are showing count per each tissue to give us broad intuition about tissue specific mutation patterns.You can go to the detailed page for each mutation database's web site. |
| - Statistics for Tissue and Mutation type | Top |
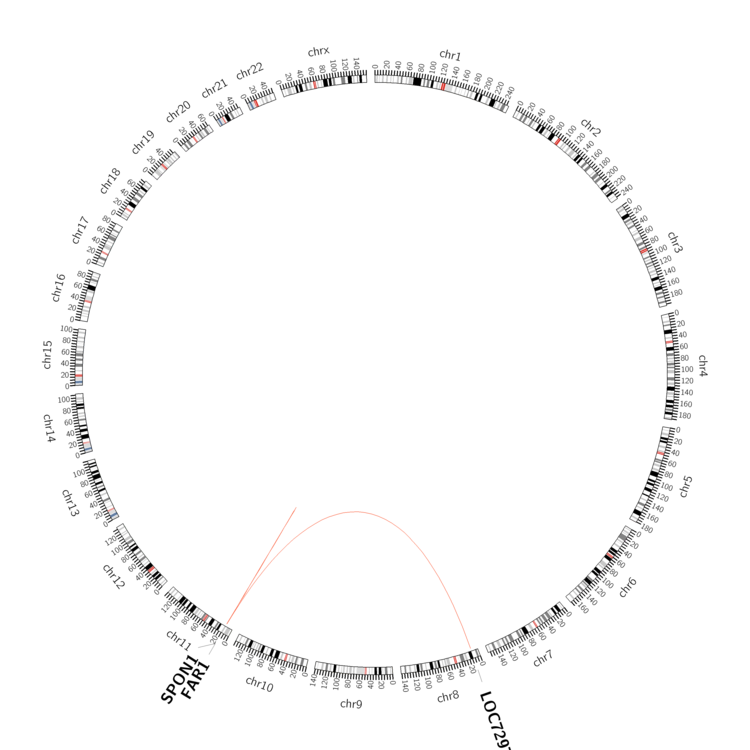 |
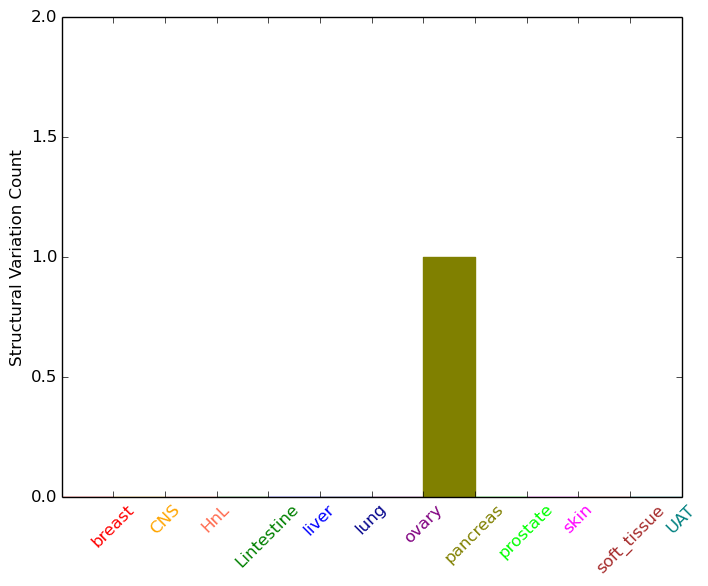
| - For Inter-chromosomal Variations |
| * Inter-chromosomal variantions includes 'interchromosomal amplicon to amplicon', 'interchromosomal amplicon to non-amplified dna', 'interchromosomal insertion', 'Interchromosomal unknown type'. |
 |
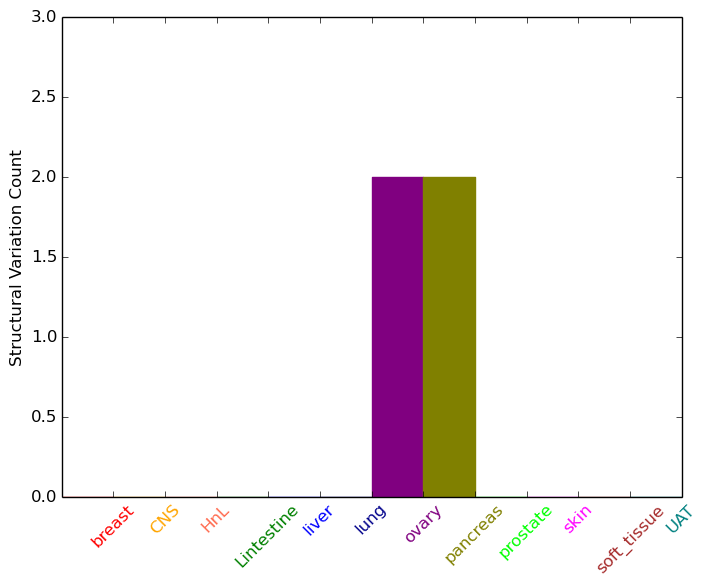
| - For Intra-chromosomal Variations |
| * Intra-chromosomal variantions includes 'intrachromosomal amplicon to amplicon', 'intrachromosomal amplicon to non-amplified dna', 'intrachromosomal deletion', 'intrachromosomal fold-back inversion', 'intrachromosomal inversion', 'intrachromosomal tandem duplication', 'Intrachromosomal unknown type', 'intrachromosomal with inverted orientation', 'intrachromosomal with non-inverted orientation'. |
 |
| Sample | Symbol_a | Chr_a | Start_a | End_a | Symbol_b | Chr_b | Start_b | End_b |
| ovary | FAR1 | chr11 | 13697092 | 13697112 | FAR1 | chr11 | 13697303 | 13697323 |
| ovary | FAR1 | chr11 | 13746361 | 13746381 | FAR1 | chr11 | 13751598 | 13751618 |
| pancreas | FAR1 | chr11 | 13699927 | 13699947 | SPON1 | chr11 | 14119415 | 14119435 |
| pancreas | FAR1 | chr11 | 13699927 | 13699947 | SPON1 | chr11 | 14119417 | 14119437 |
| cf) Tissue number; Tissue name (1;Breast, 2;Central_nervous_system, 3;Haematopoietic_and_lymphoid_tissue, 4;Large_intestine, 5;Liver, 6;Lung, 7;Ovary, 8;Pancreas, 9;Prostate, 10;Skin, 11;Soft_tissue, 12;Upper_aerodigestive_tract) |
| * From mRNA Sanger sequences, Chitars2.0 arranged chimeric transcripts. This table shows FAR1 related fusion information. |
| ID | Head Gene | Tail Gene | Accession | Gene_a | qStart_a | qEnd_a | Chromosome_a | tStart_a | tEnd_a | Gene_a | qStart_a | qEnd_a | Chromosome_a | tStart_a | tEnd_a |
| BE707585 | PHKB | 1 | 136 | 16 | 47733251 | 47733387 | FAR1 | 128 | 292 | 11 | 13749157 | 13750249 | |
| AA862191 | FAR1 | 9 | 75 | 11 | 13694560 | 13694626 | FAR1 | 64 | 212 | 11 | 13694423 | 13694571 | |
| DA215427 | CTNNB1 | 3 | 173 | 3 | 41240992 | 41241162 | FAR1 | 171 | 538 | 11 | 13743275 | 13750266 | |
| BF906017 | FAR1 | 1 | 97 | 11 | 13695482 | 13695580 | FAR1 | 92 | 408 | 11 | 13692089 | 13692402 | |
| BI019366 | FAR1 | 1 | 99 | 11 | 13695482 | 13695580 | FAR1 | 94 | 360 | 11 | 13692089 | 13692352 | |
| BI019383 | FAR1 | 1 | 99 | 11 | 13695482 | 13695580 | FAR1 | 94 | 442 | 11 | 13692089 | 13692434 | |
| Top |
| Mutation type/ Tissue ID | brca | cns | cerv | endome | haematopo | kidn | Lintest | liver | lung | ns | ovary | pancre | prost | skin | stoma | thyro | urina | |||
| Total # sample | 2 | |||||||||||||||||||
| GAIN (# sample) | 2 | |||||||||||||||||||
| LOSS (# sample) |
| cf) Tissue ID; Tissue type (1; Breast, 2; Central_nervous_system, 3; Cervix, 4; Endometrium, 5; Haematopoietic_and_lymphoid_tissue, 6; Kidney, 7; Large_intestine, 8; Liver, 9; Lung, 10; NS, 11; Ovary, 12; Pancreas, 13; Prostate, 14; Skin, 15; Stomach, 16; Thyroid, 17; Urinary_tract) |
| Top |
|
 |
| Top |
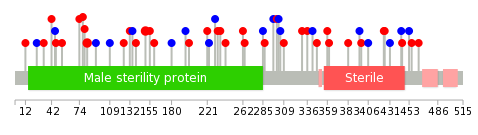
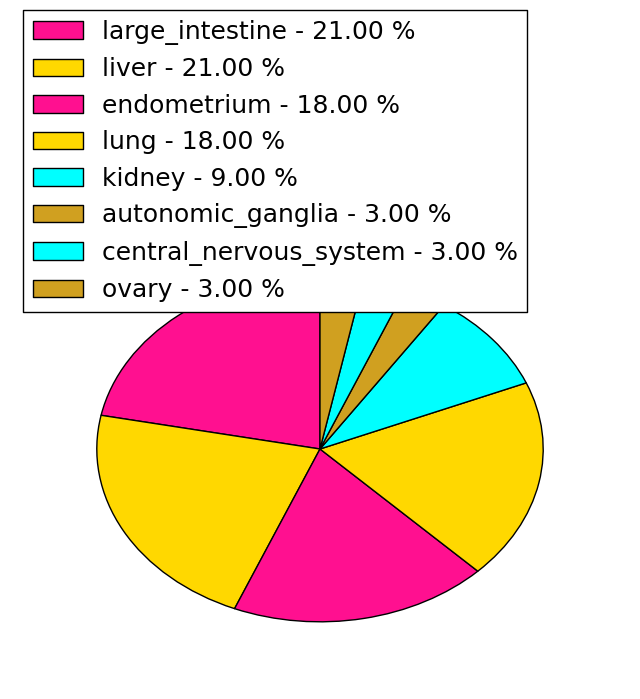
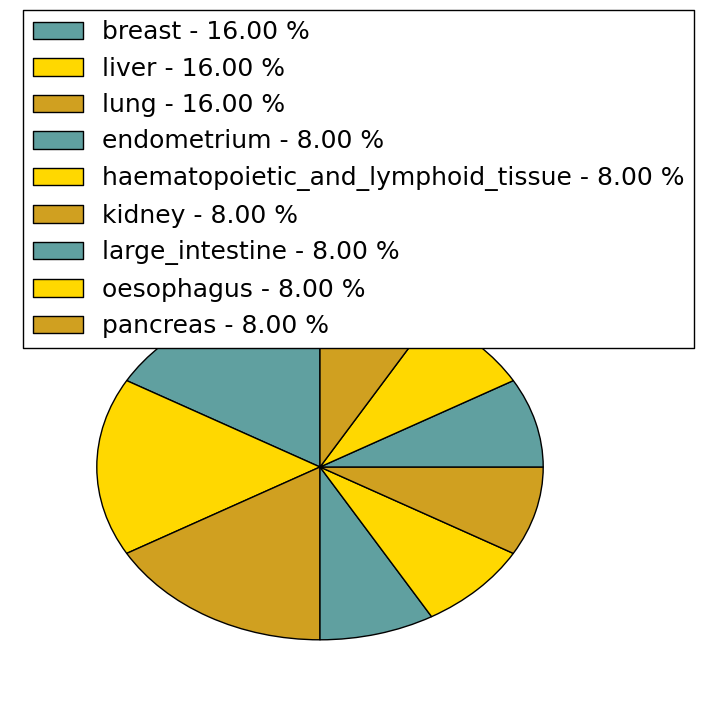
| Stat. for Non-Synonymous SNVs (# total SNVs=32) | (# total SNVs=12) |
 |  |
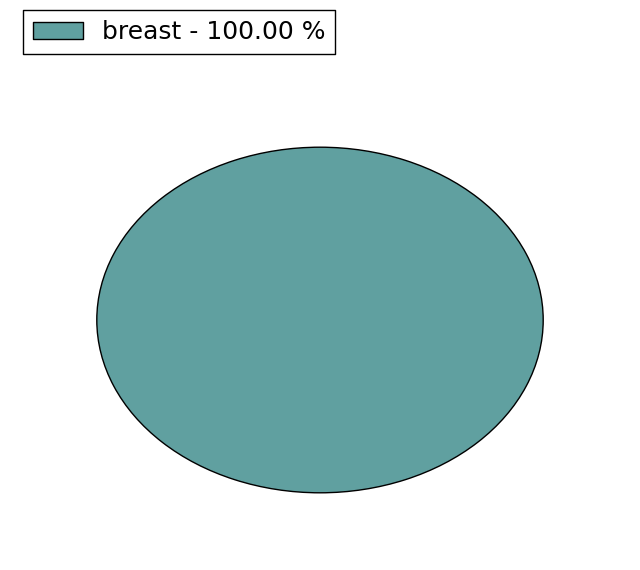
(# total SNVs=0) | (# total SNVs=2) |
 |
| Top |
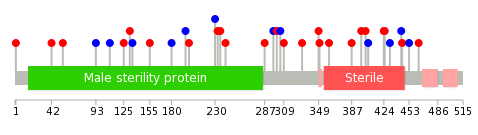
| * When you move the cursor on each content, you can see more deailed mutation information on the Tooltip. Those are primary_site,primary_histology,mutation(aa),pubmedID. |
| GRCh37 position | Mutation(aa) | Unique sampleID count |
| chr11:13733493-13733493 | p.R263* | 3 |
| chr11:13721922-13721922 | p.N83S | 2 |
| chr11:13729478-13729478 | p.R133* | 2 |
| chr11:13729529-13729529 | p.H150Y | 2 |
| chr11:13729544-13729544 | p.Y155H | 1 |
| chr11:13743342-13743342 | p.S398Y | 1 |
| chr11:13733312-13733312 | p.G242A | 1 |
| chr11:13750321-13750321 | p.*516W | 1 |
| chr11:13716387-13716387 | p.V25V | 1 |
| chr11:13721912-13721912 | p.I80L | 1 |
| Top |
|
 |
| Point Mutation/ Tissue ID | 1 | 2 | 3 | 4 | 5 | 6 | 7 | 8 | 9 | 10 | 11 | 12 | 13 | 14 | 15 | 16 | 17 | 18 | 19 | 20 |
| # sample | 1 | 1 | 3 | 3 | 2 | 4 | 2 | 1 | 3 | 6 | 6 | |||||||||
| # mutation | 3 | 1 | 3 | 3 | 2 | 4 | 2 | 1 | 4 | 6 | 6 | |||||||||
| nonsynonymous SNV | 2 | 2 | 3 | 1 | 3 | 1 | 1 | 2 | 3 | 5 | ||||||||||
| synonymous SNV | 1 | 1 | 1 | 1 | 1 | 1 | 2 | 3 | 1 |
| cf) Tissue ID; Tissue type (1; BLCA[Bladder Urothelial Carcinoma], 2; BRCA[Breast invasive carcinoma], 3; CESC[Cervical squamous cell carcinoma and endocervical adenocarcinoma], 4; COAD[Colon adenocarcinoma], 5; GBM[Glioblastoma multiforme], 6; Glioma Low Grade, 7; HNSC[Head and Neck squamous cell carcinoma], 8; KICH[Kidney Chromophobe], 9; KIRC[Kidney renal clear cell carcinoma], 10; KIRP[Kidney renal papillary cell carcinoma], 11; LAML[Acute Myeloid Leukemia], 12; LUAD[Lung adenocarcinoma], 13; LUSC[Lung squamous cell carcinoma], 14; OV[Ovarian serous cystadenocarcinoma ], 15; PAAD[Pancreatic adenocarcinoma], 16; PRAD[Prostate adenocarcinoma], 17; SKCM[Skin Cutaneous Melanoma], 18:STAD[Stomach adenocarcinoma], 19:THCA[Thyroid carcinoma], 20:UCEC[Uterine Corpus Endometrial Carcinoma]) |
| Top |
| * We represented just top 10 SNVs. When you move the cursor on each content, you can see more deailed mutation information on the Tooltip. Those are primary_site, primary_histology, mutation(aa), pubmedID. |
| Genomic Position | Mutation(aa) | Unique sampleID count |
| chr11:13736146 | p.M301I | 1 |
| chr11:13749178 | p.L453L | 1 |
| chr11:13716436 | p.R55L | 1 |
| chr11:13732384 | p.C305C | 1 |
| chr11:13736149 | p.R464W | 1 |
| chr11:13749204 | p.L93L | 1 |
| chr11:13716476 | p.S309C | 1 |
| chr11:13732391 | p.F109F | 1 |
| chr11:13736181 | p.P330S | 1 |
| chr11:13750163 | p.V125A | 1 |
| * Copy number data were extracted from TCGA using R package TCGA-Assembler. The URLs of all public data files on TCGA DCC data server were gathered on Jan-05-2015. Function ProcessCNAData in TCGA-Assembler package was used to obtain gene-level copy number value which is calculated as the average copy number of the genomic region of a gene. |
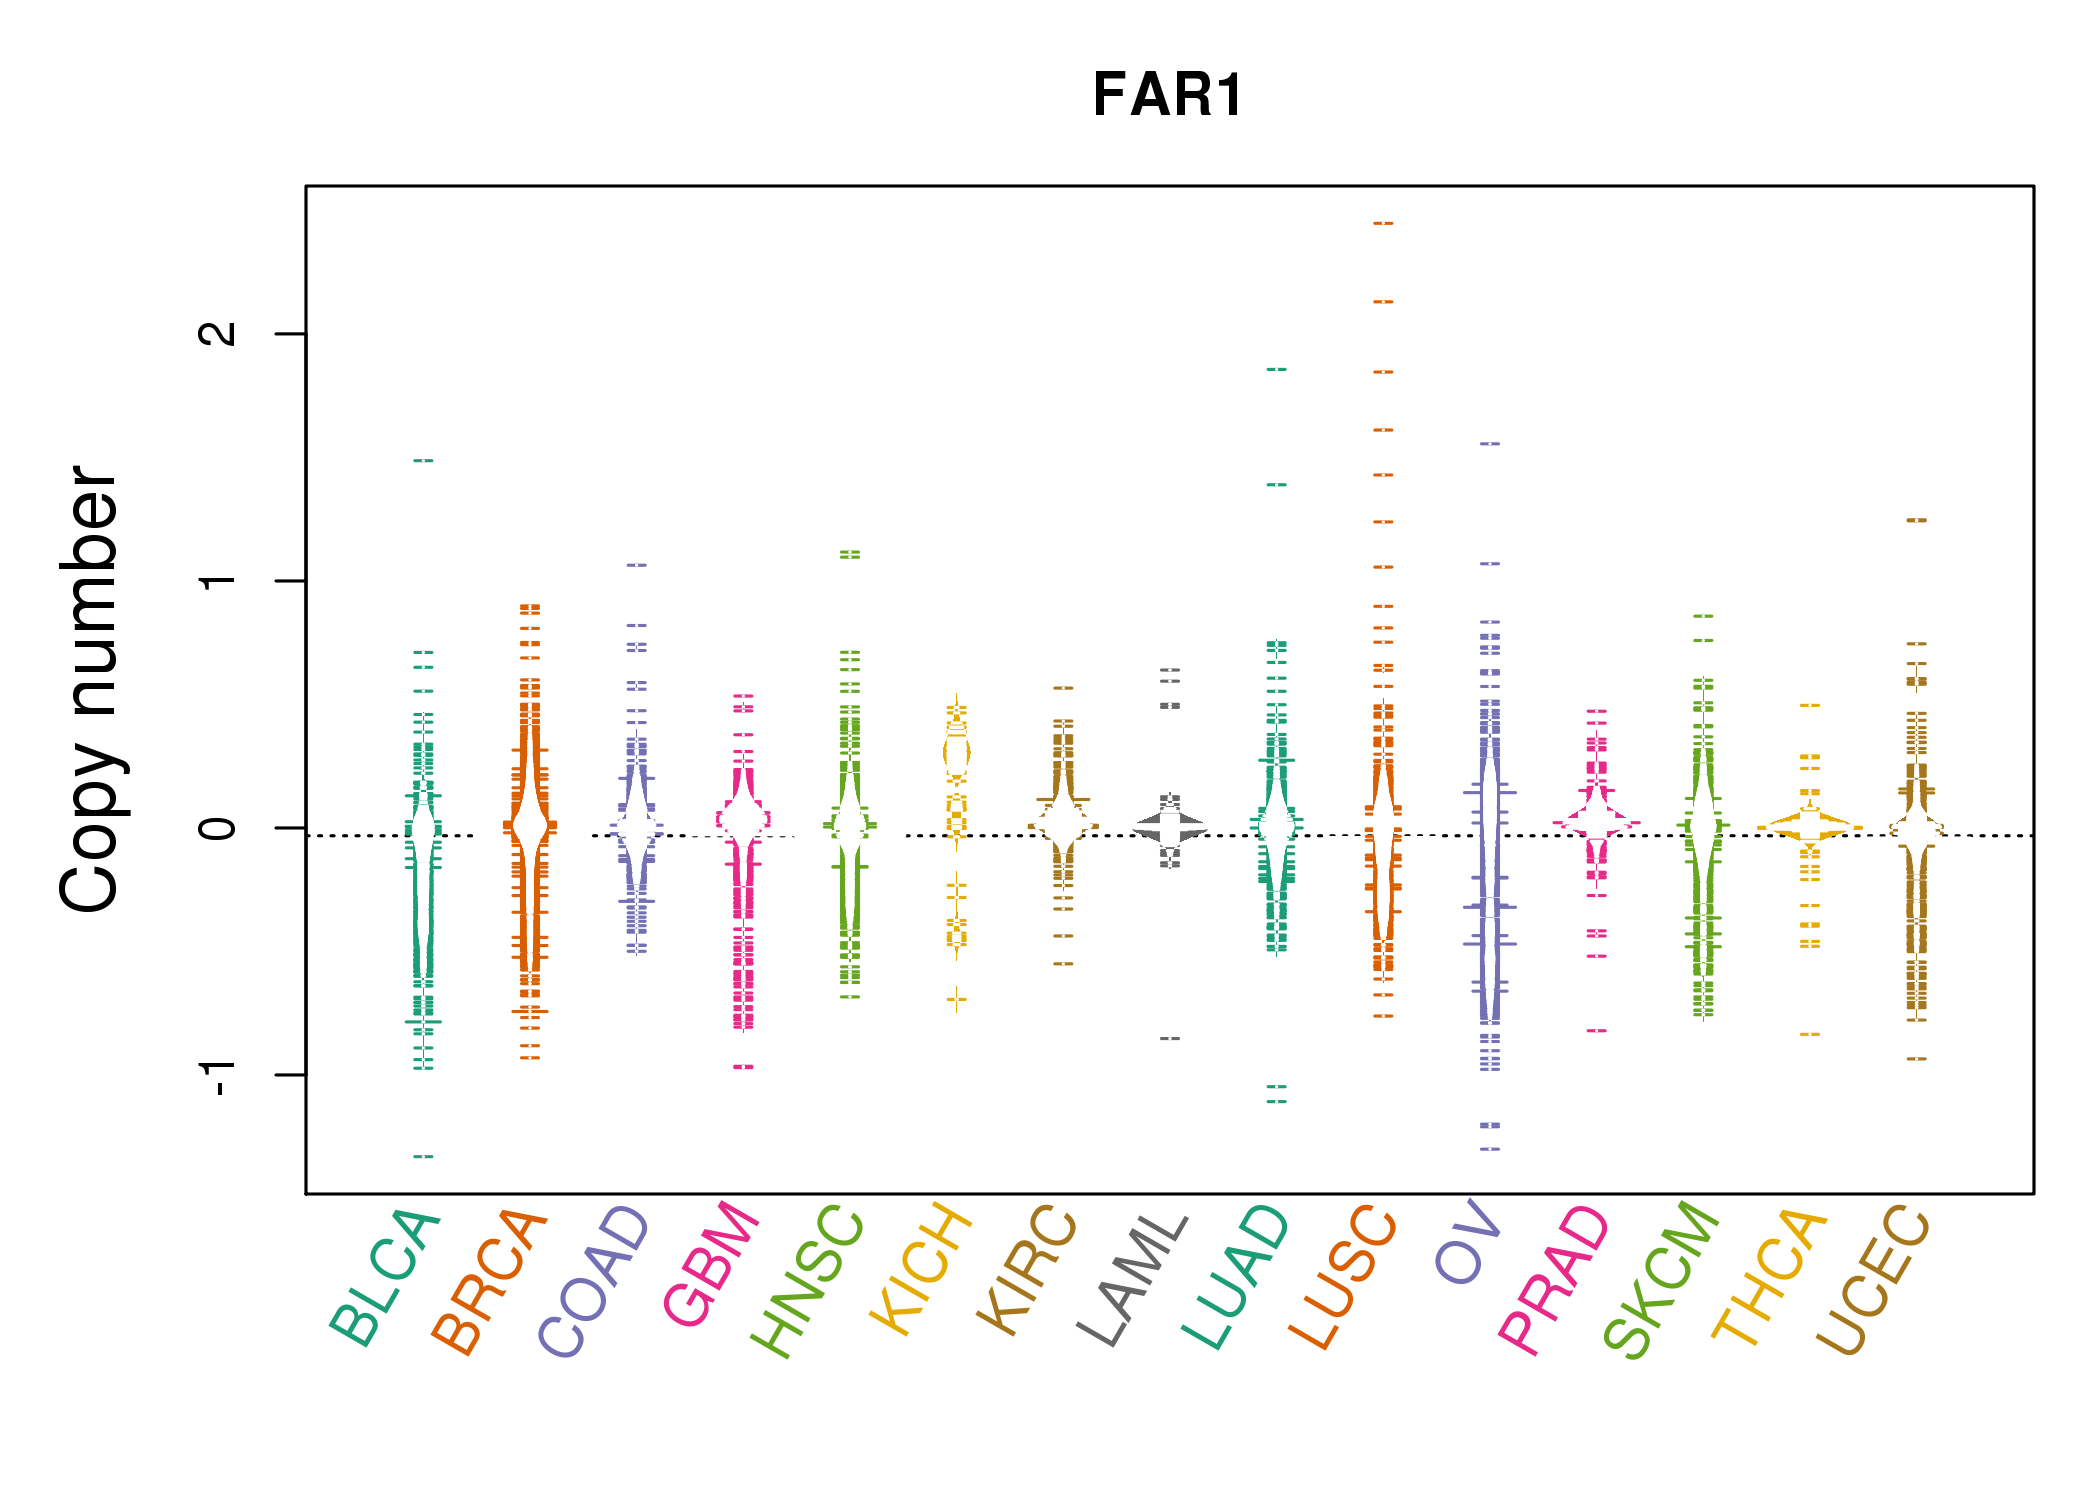 |
| cf) Tissue ID[Tissue type]: BLCA[Bladder Urothelial Carcinoma], BRCA[Breast invasive carcinoma], CESC[Cervical squamous cell carcinoma and endocervical adenocarcinoma], COAD[Colon adenocarcinoma], GBM[Glioblastoma multiforme], Glioma Low Grade, HNSC[Head and Neck squamous cell carcinoma], KICH[Kidney Chromophobe], KIRC[Kidney renal clear cell carcinoma], KIRP[Kidney renal papillary cell carcinoma], LAML[Acute Myeloid Leukemia], LUAD[Lung adenocarcinoma], LUSC[Lung squamous cell carcinoma], OV[Ovarian serous cystadenocarcinoma ], PAAD[Pancreatic adenocarcinoma], PRAD[Prostate adenocarcinoma], SKCM[Skin Cutaneous Melanoma], STAD[Stomach adenocarcinoma], THCA[Thyroid carcinoma], UCEC[Uterine Corpus Endometrial Carcinoma] |
| Top |
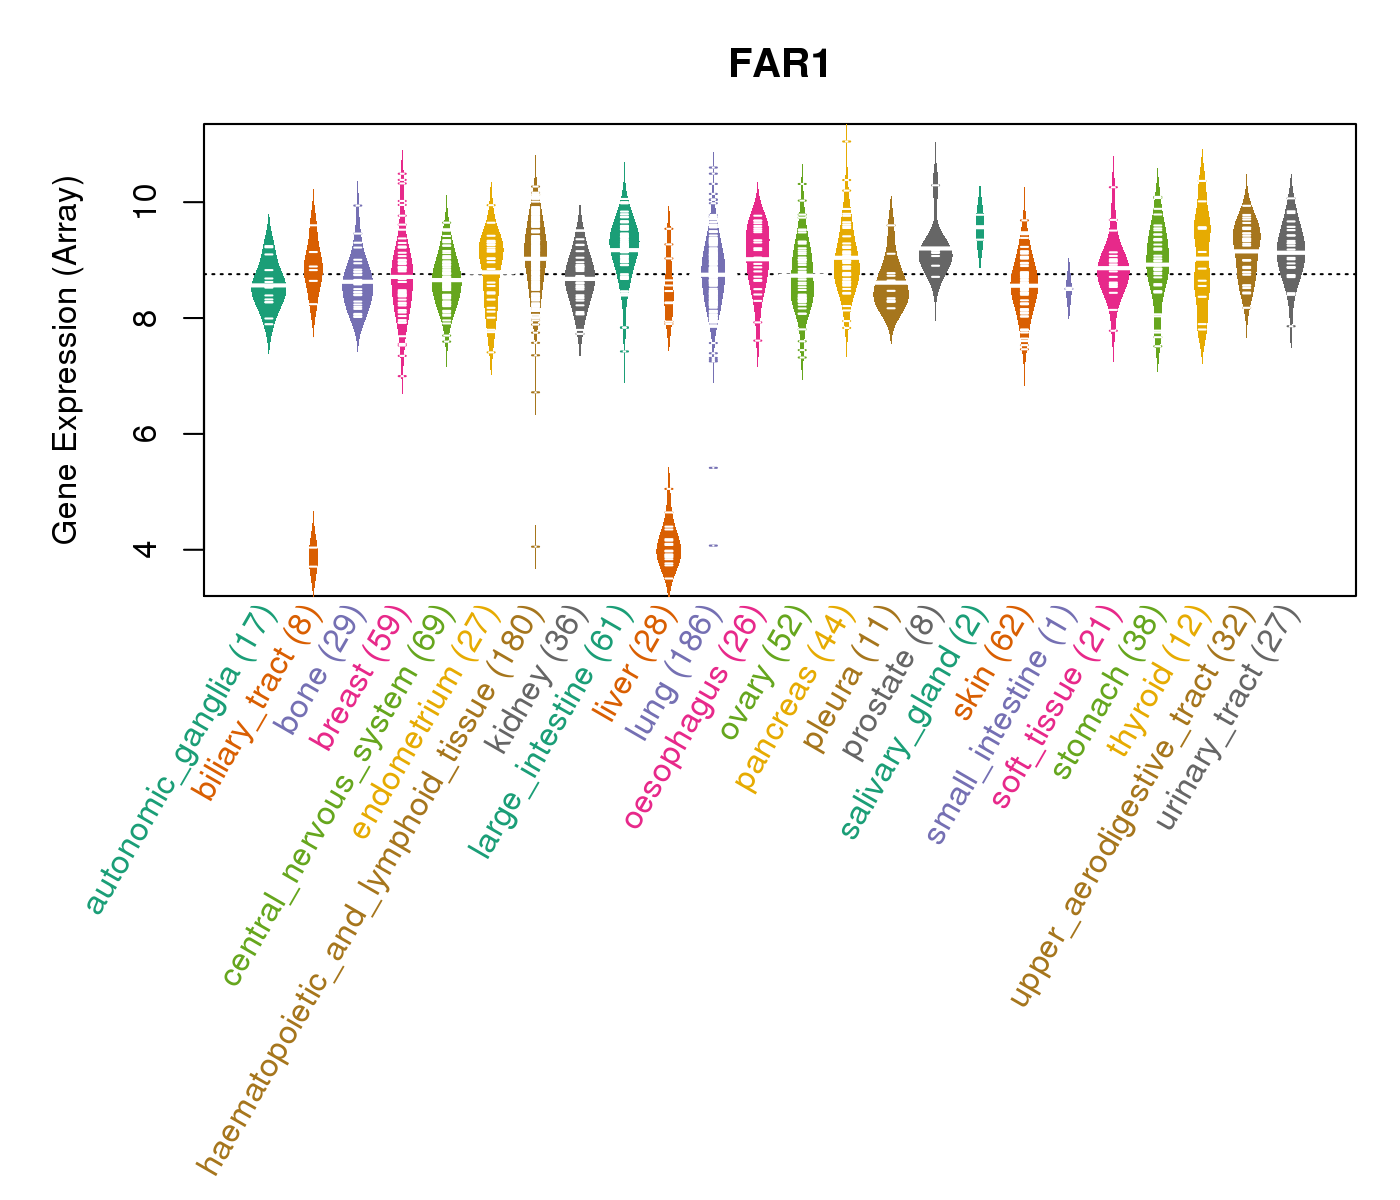
| Gene Expression for FAR1 |
| * CCLE gene expression data were extracted from CCLE_Expression_Entrez_2012-10-18.res: Gene-centric RMA-normalized mRNA expression data. |
 |
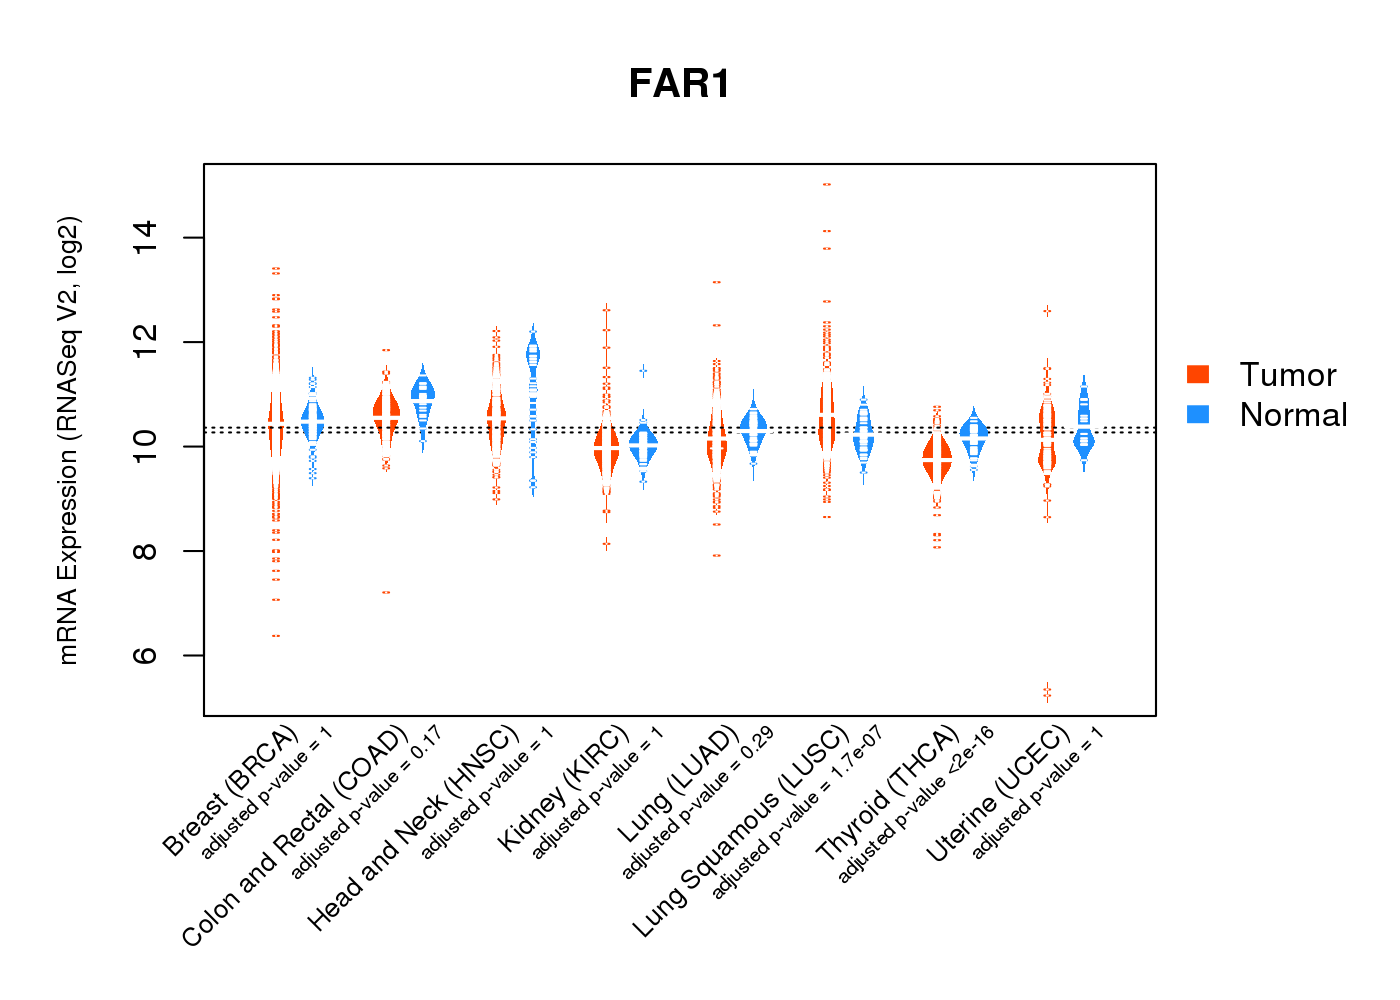
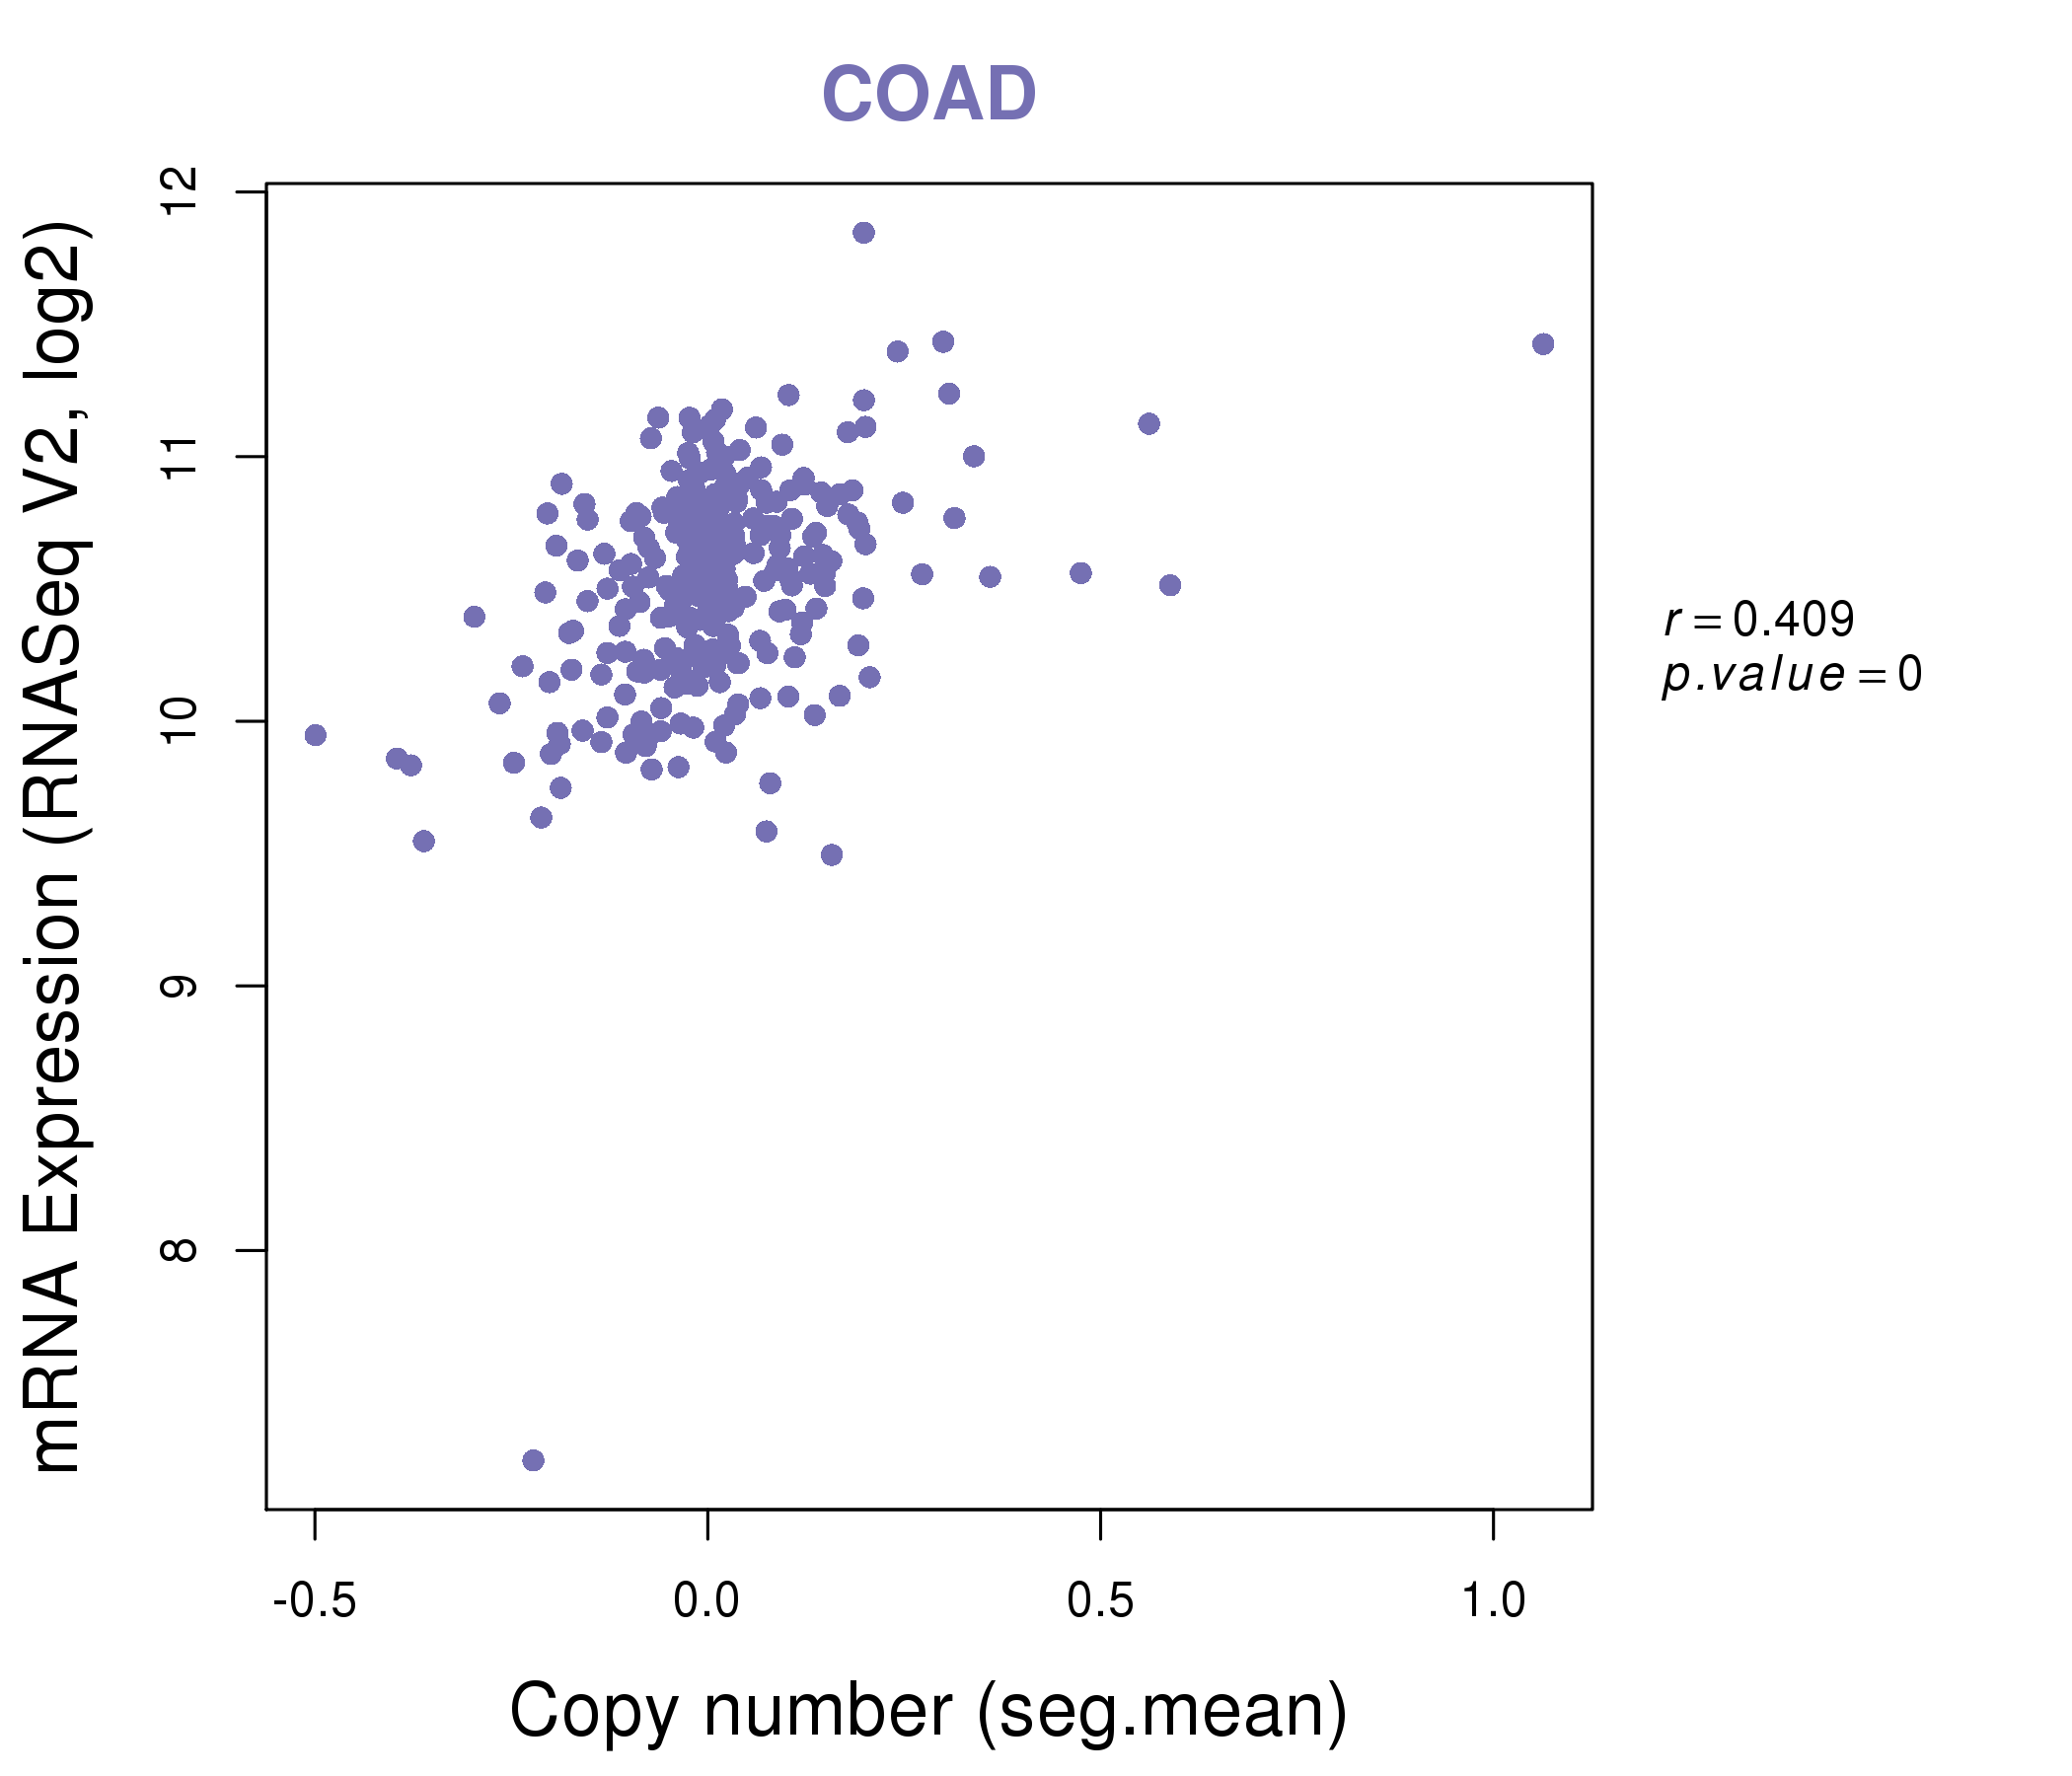
| * Normalized gene expression data of RNASeqV2 was extracted from TCGA using R package TCGA-Assembler. The URLs of all public data files on TCGA DCC data server were gathered at Jan-05-2015. Only eight cancer types have enough normal control samples for differential expression analysis. (t test, adjusted p<0.05 (using Benjamini-Hochberg FDR)) |
 |
| Top |
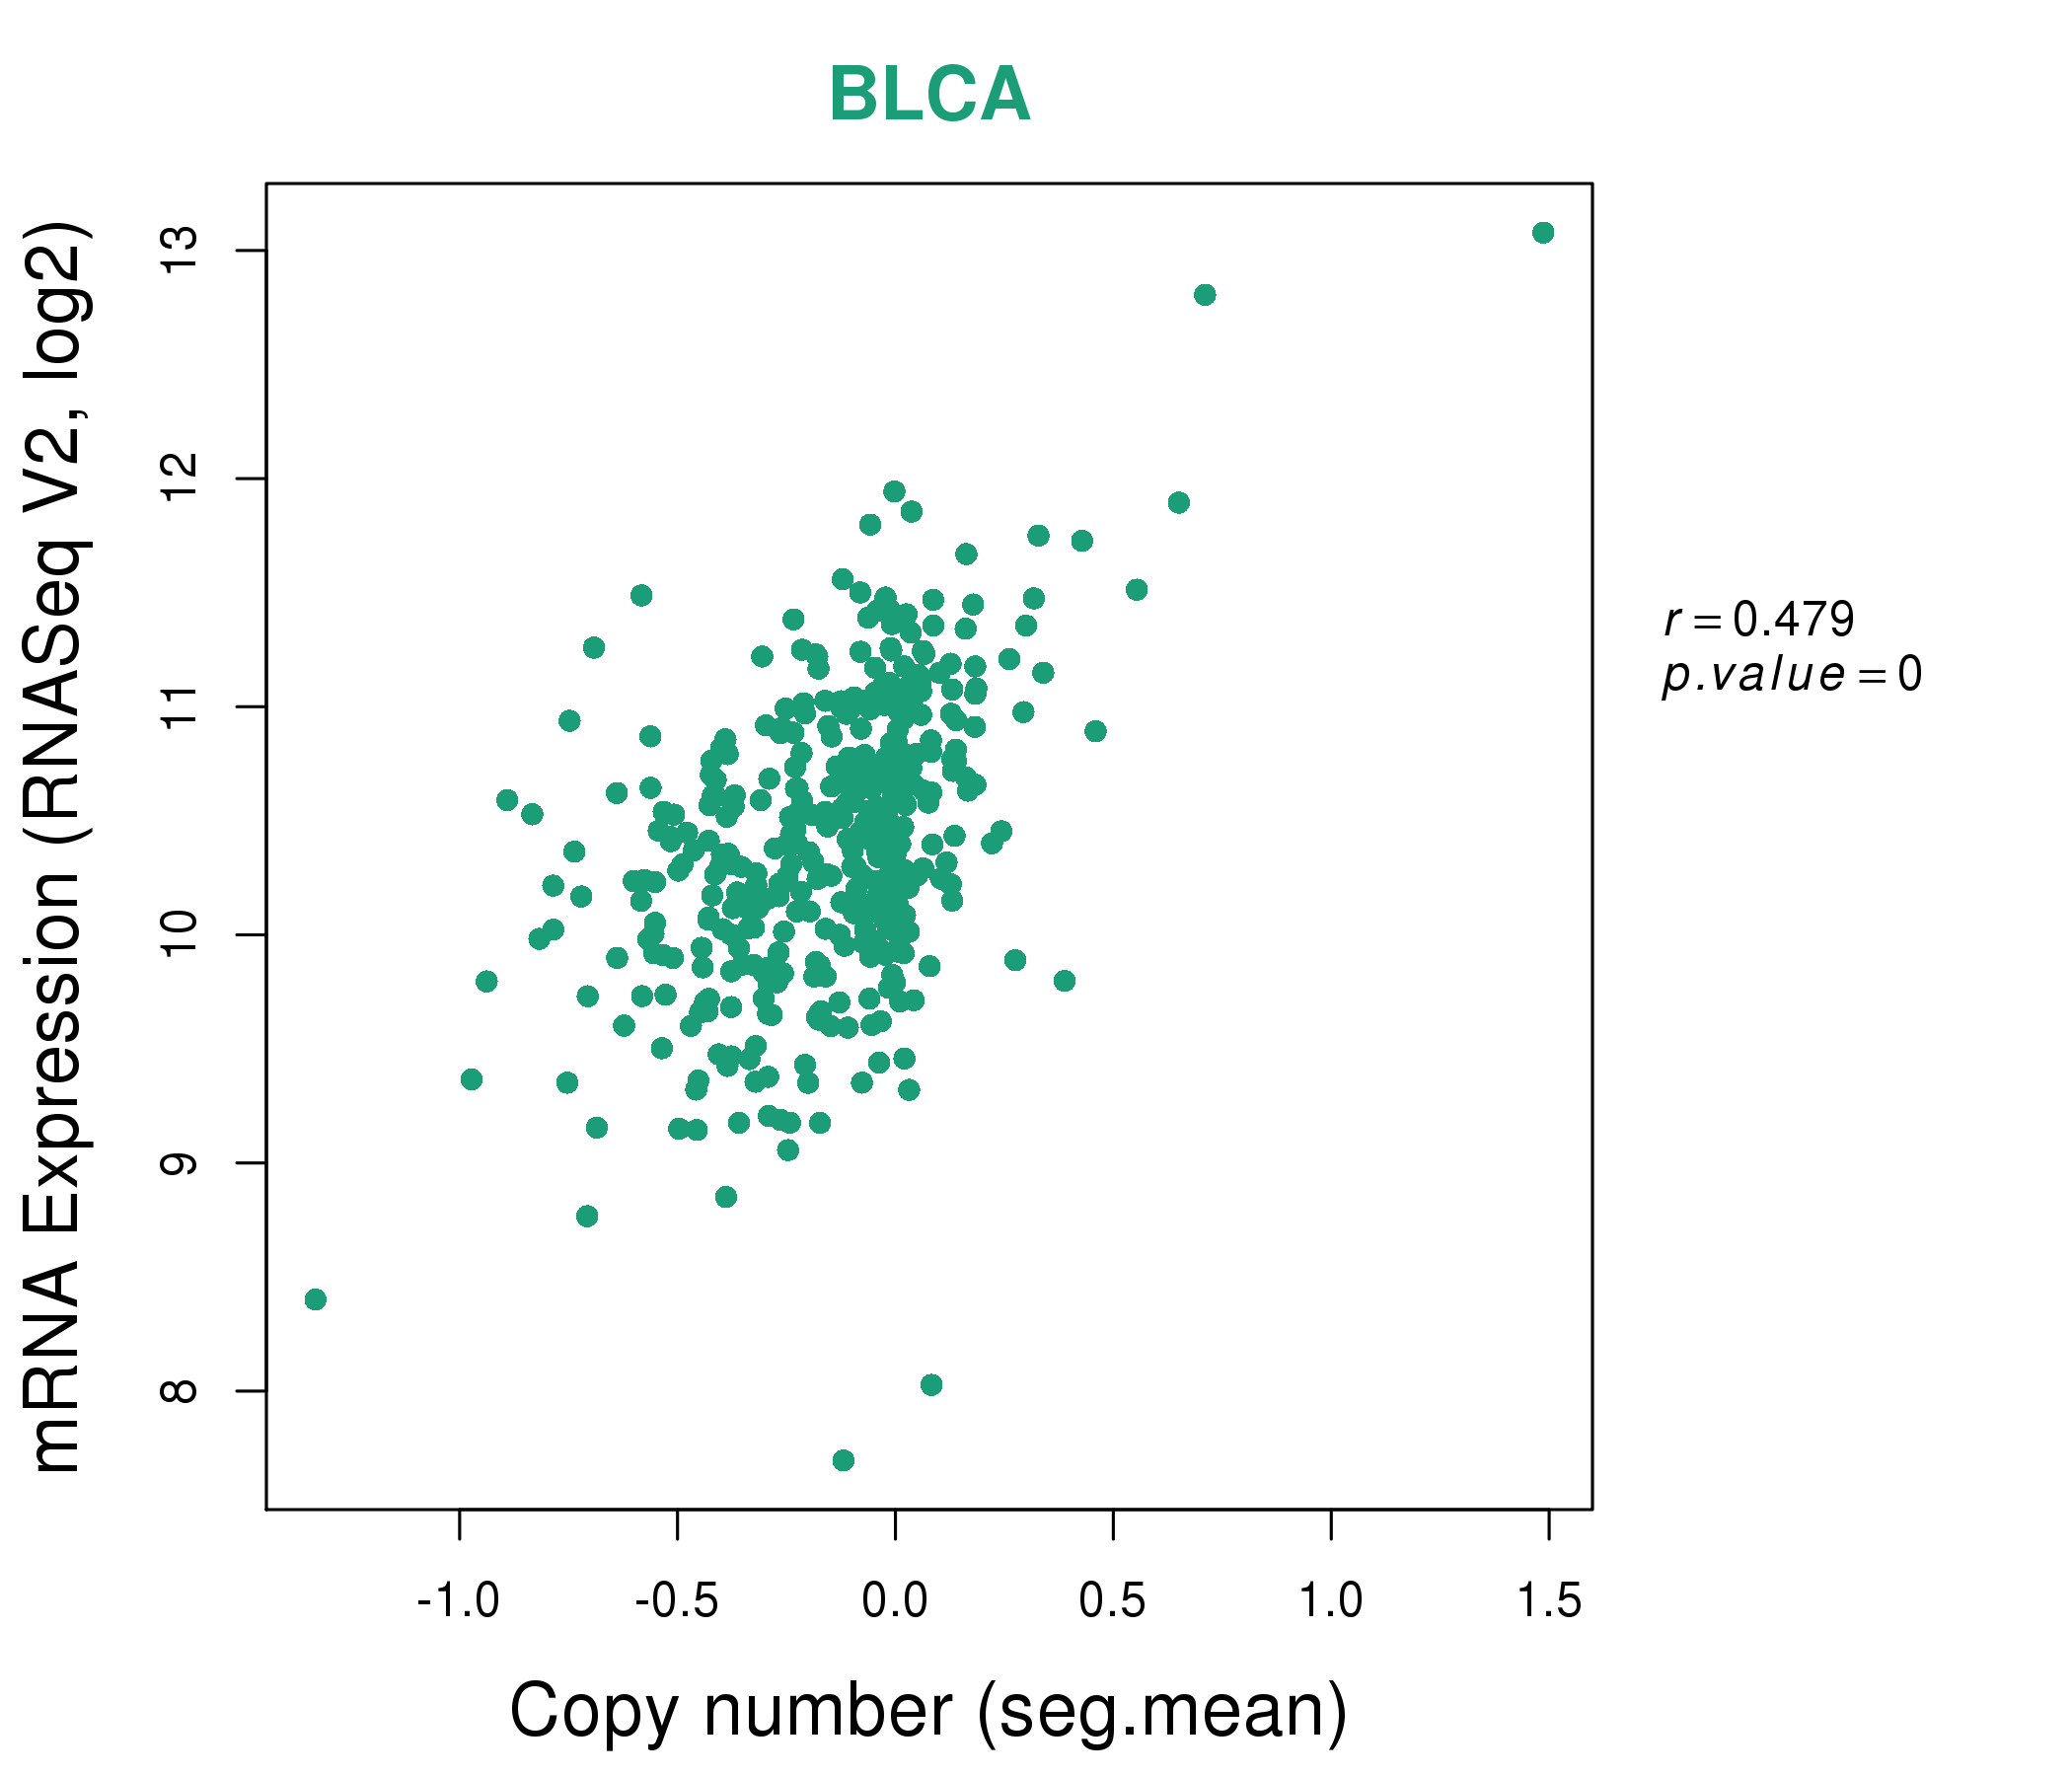
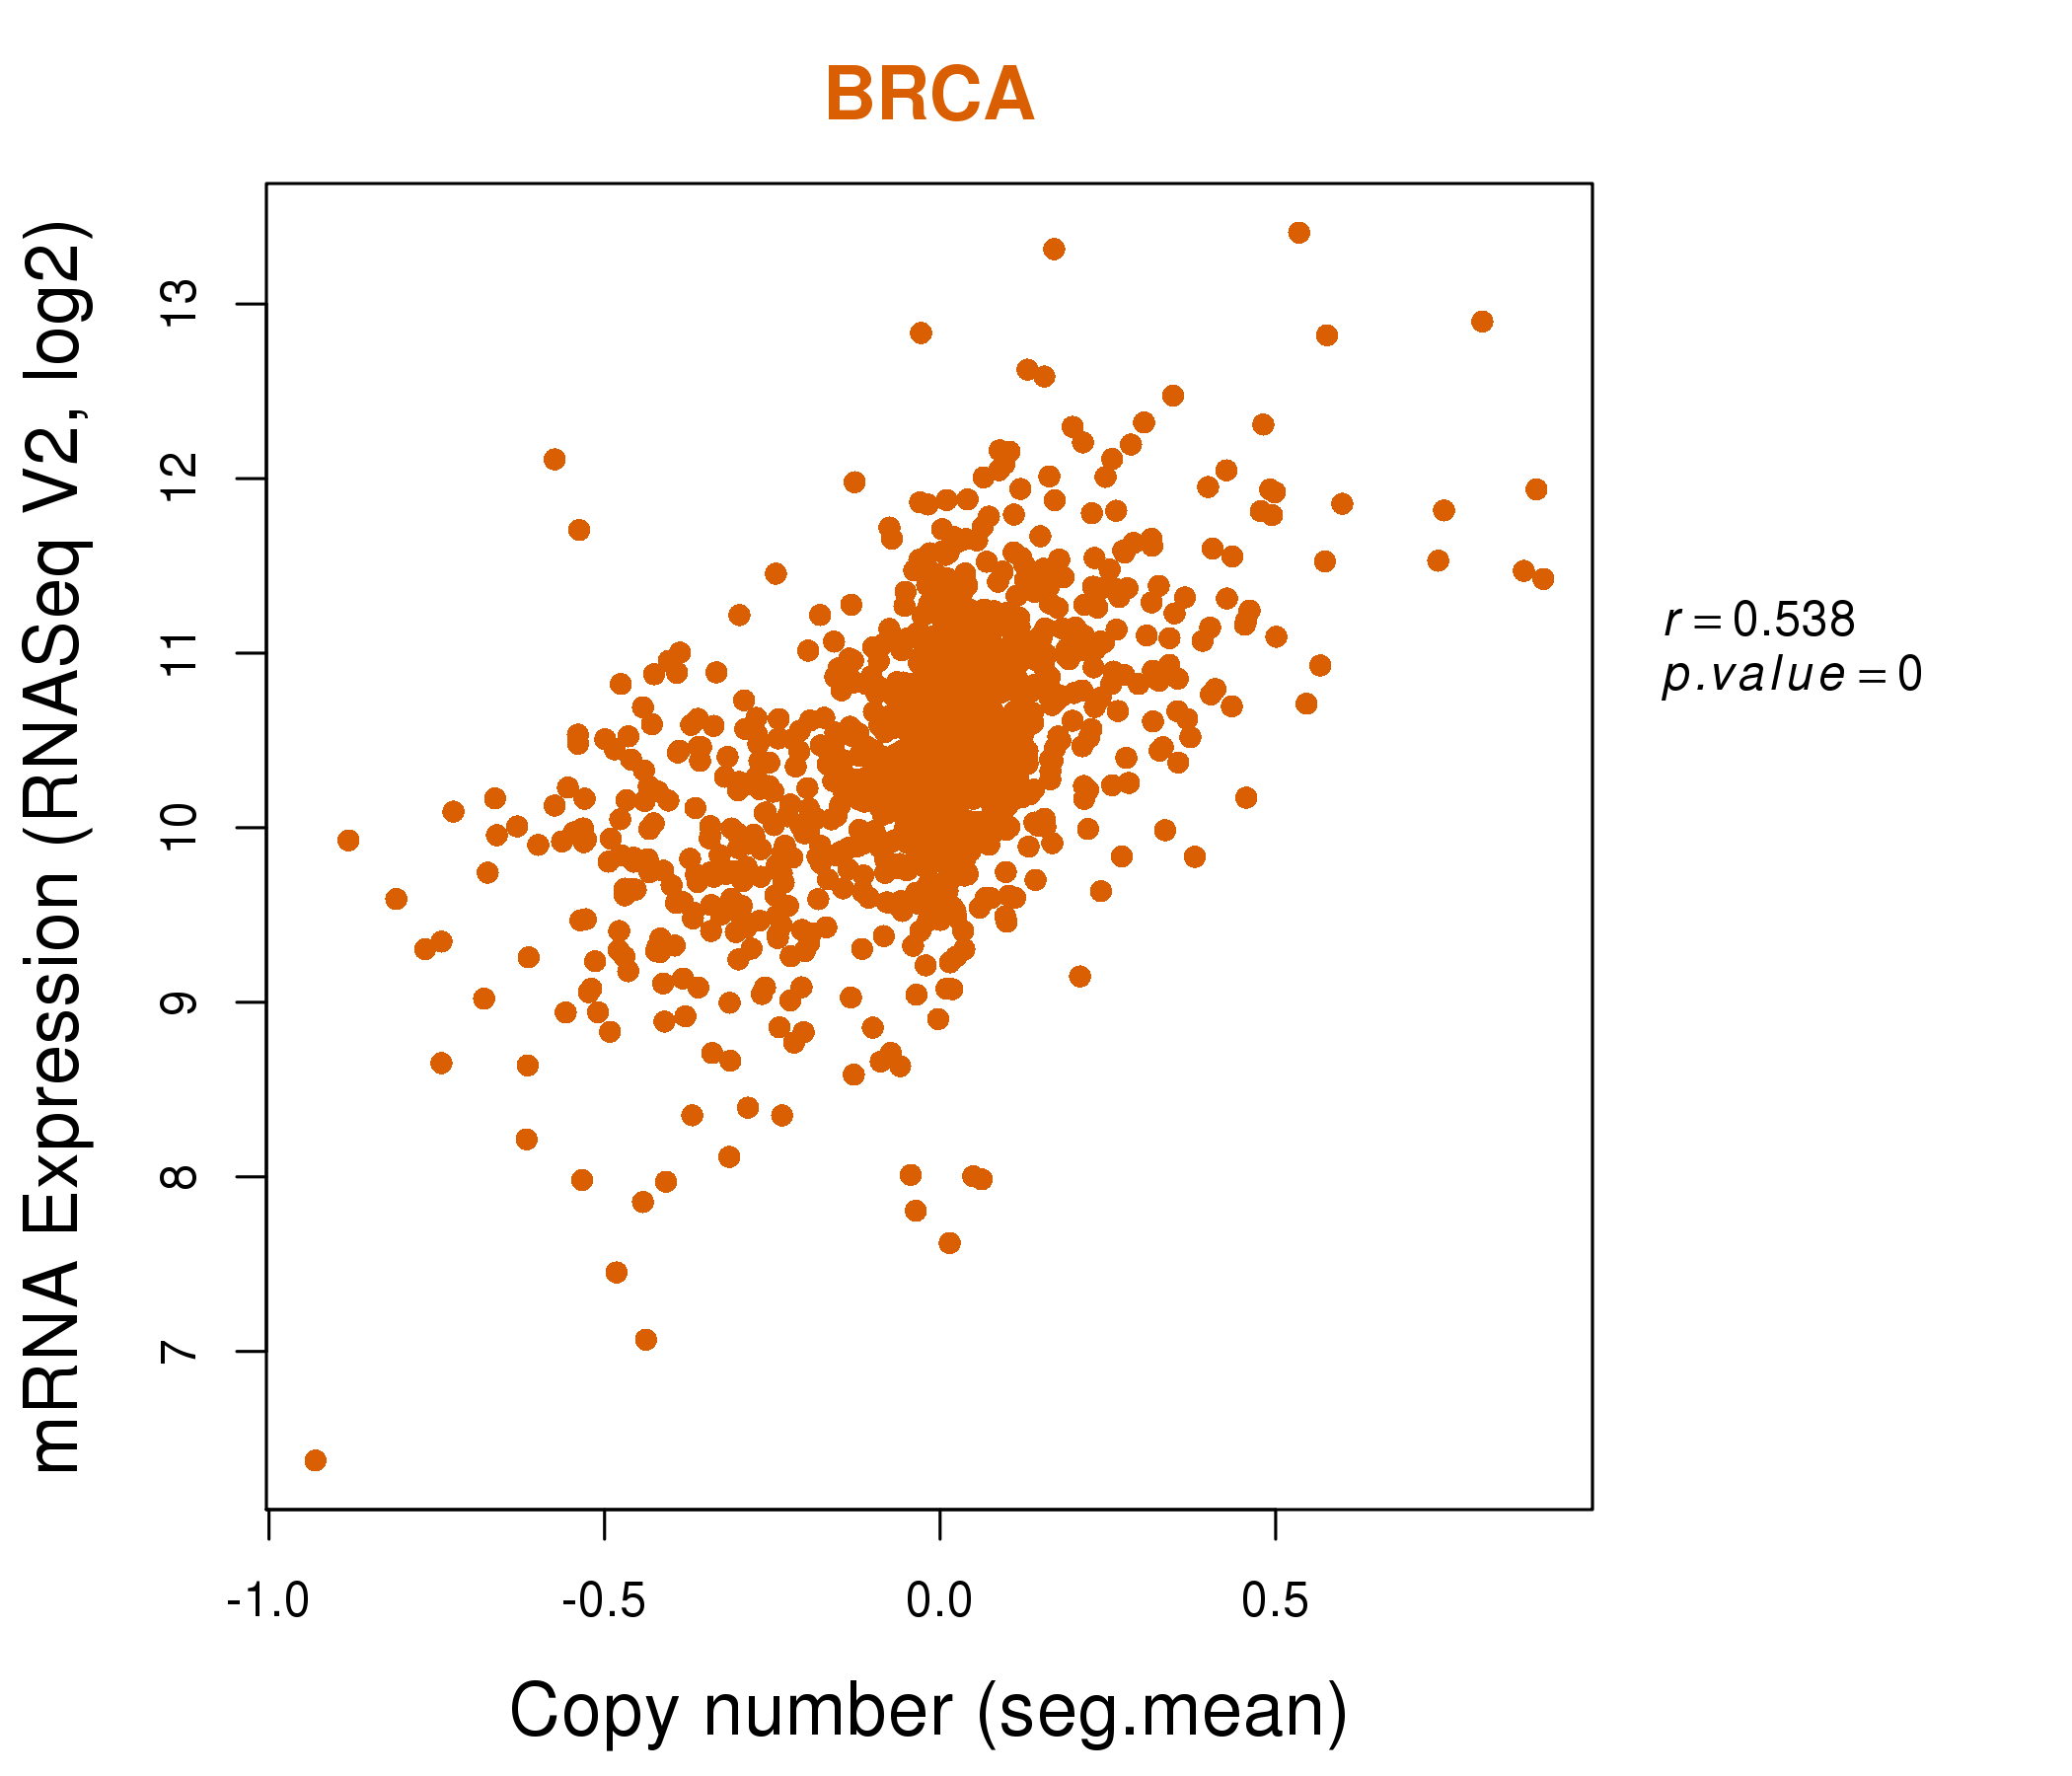
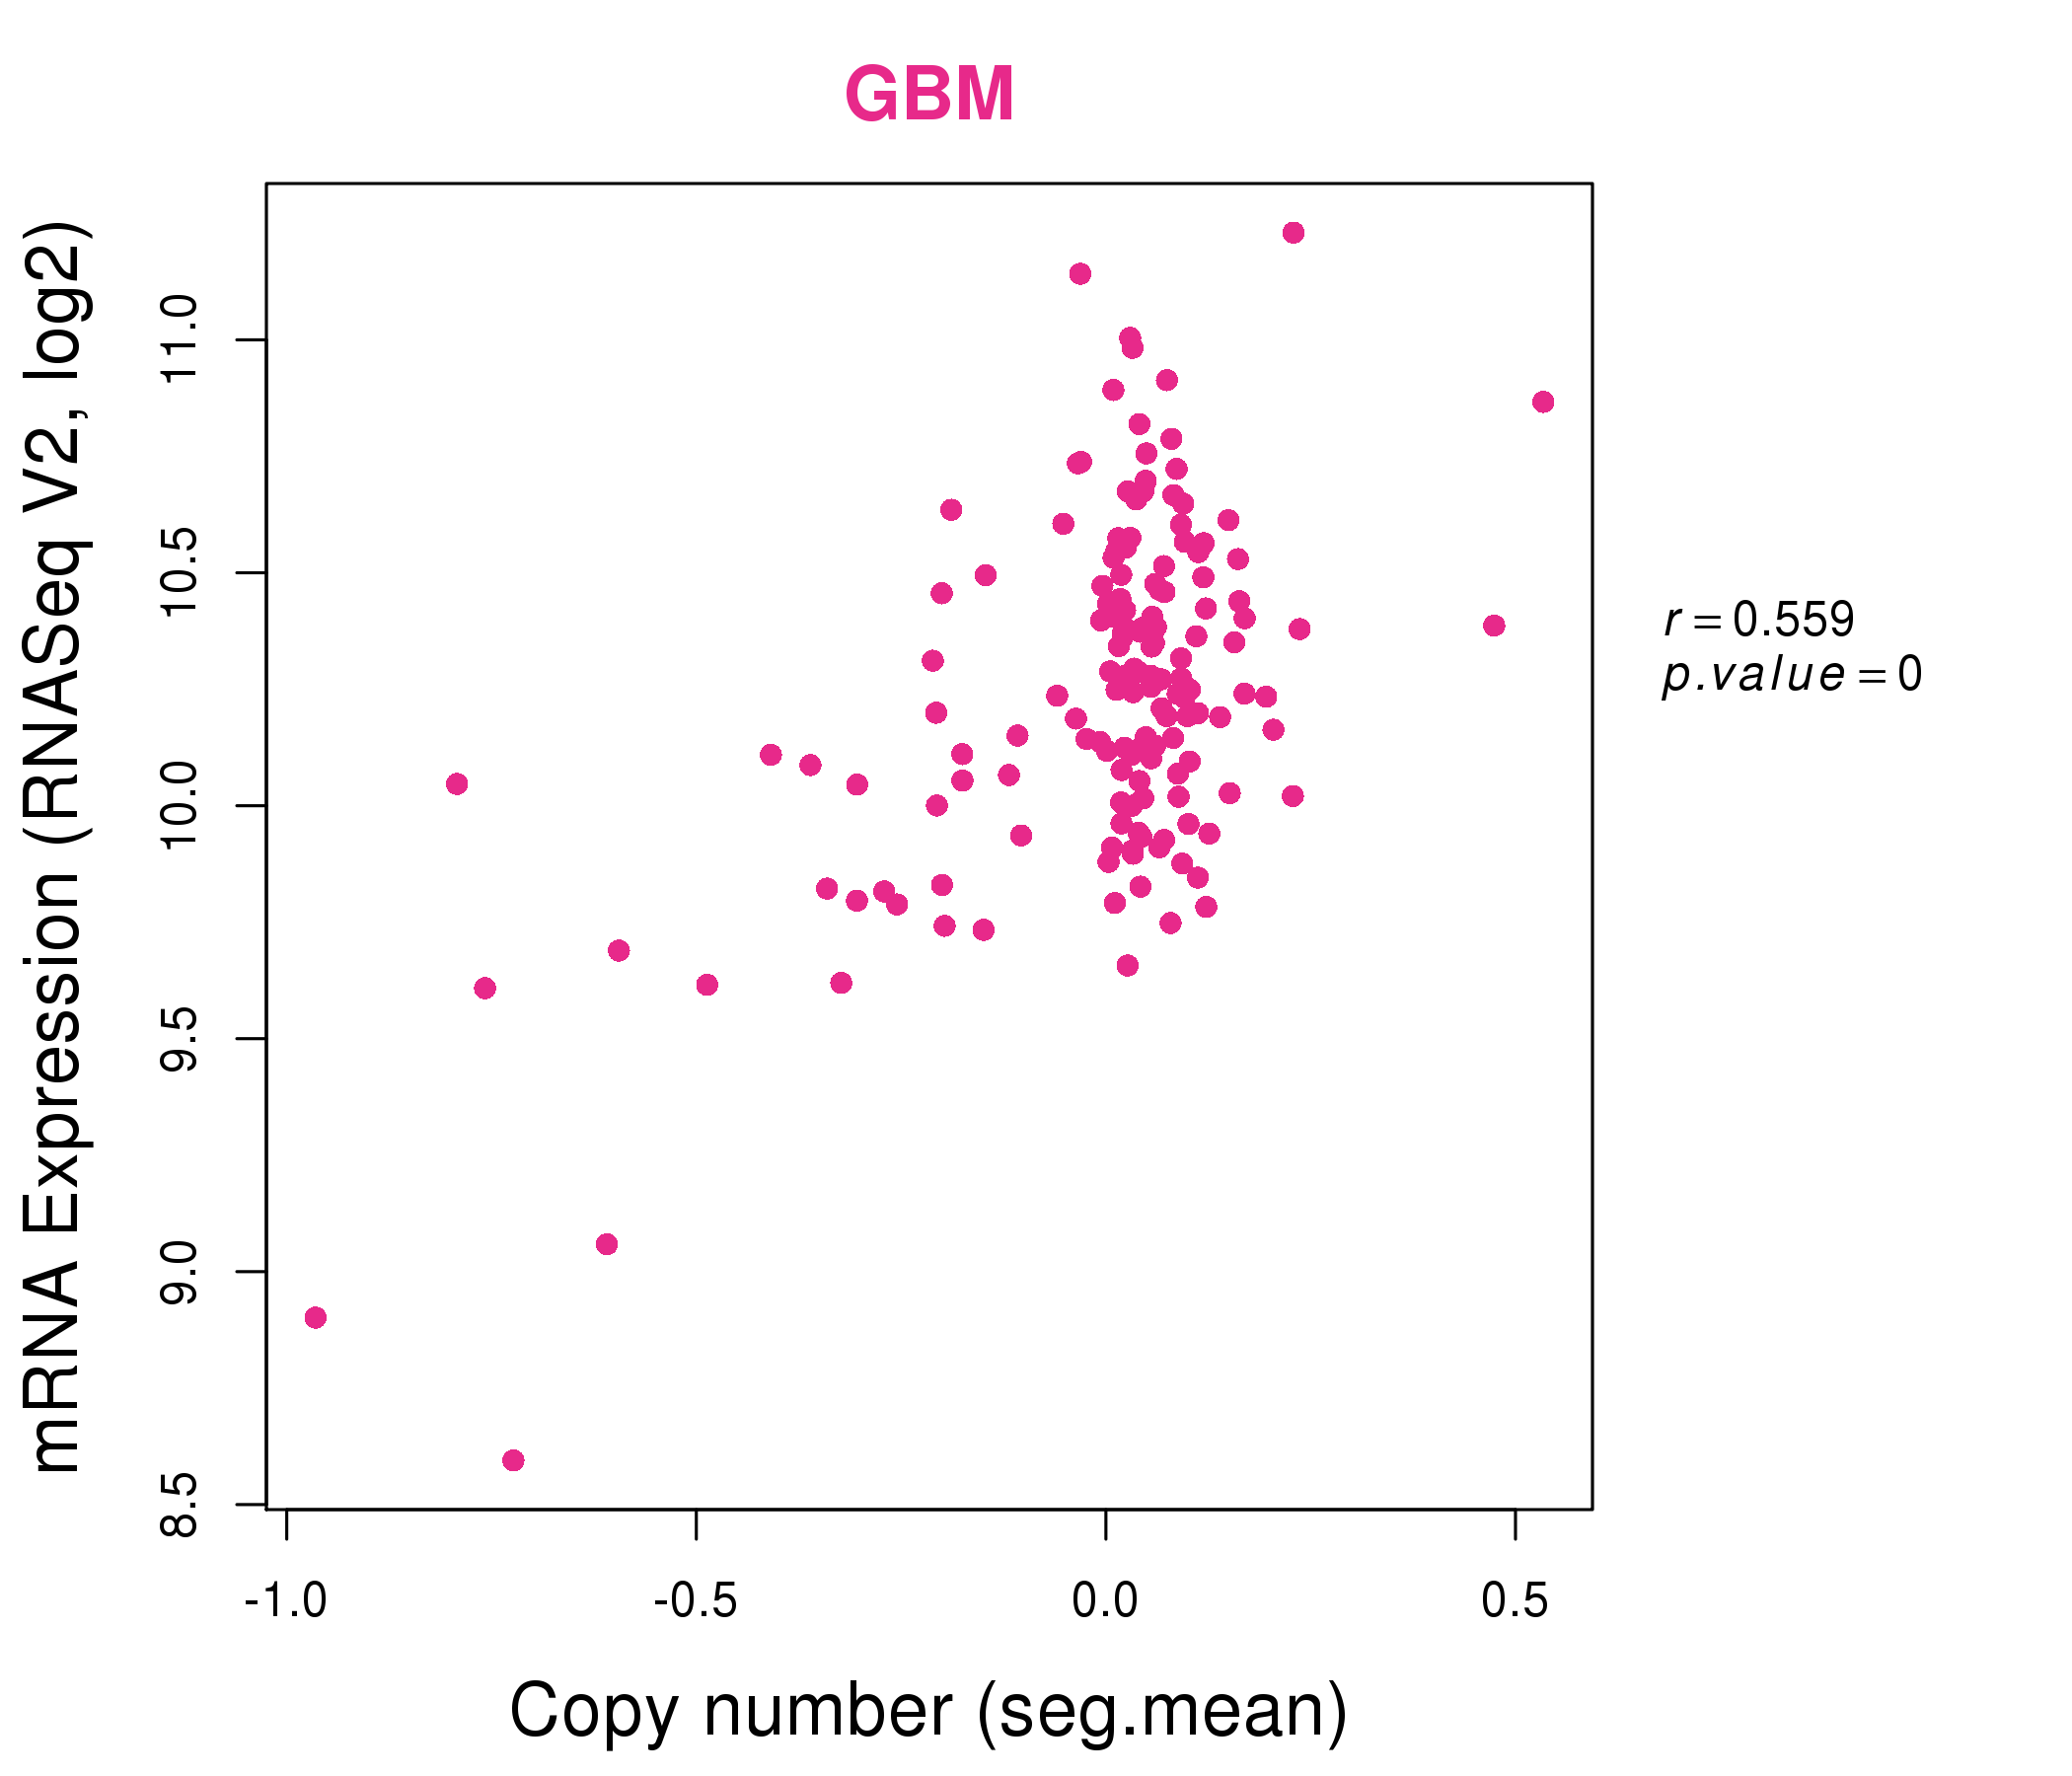
| * This plots show the correlation between CNV and gene expression. |
: Open all plots for all cancer types
 |
|
 |
|
| Top |
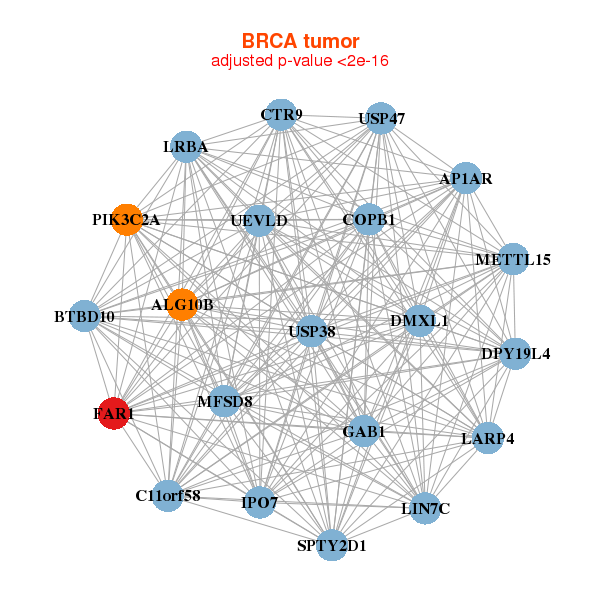
| Gene-Gene Network Information |
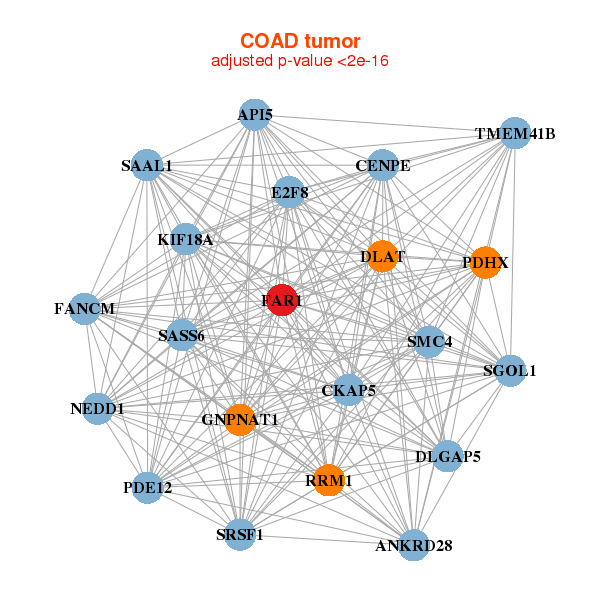
| * Co-Expression network figures were drawn using R package igraph. Only the top 20 genes with the highest correlations were shown. Red circle: input gene, orange circle: cell metabolism gene, sky circle: other gene |
: Open all plots for all cancer types
 |
|
| ALG10B,AP1AR,BTBD10,C11orf58,COPB1,CTR9,DMXL1, DPY19L4,FAR1,GAB1,IPO7,LARP4,LIN7C,LRBA, METTL15,MFSD8,PIK3C2A,SPTY2D1,UEVLD,USP38,USP47 | ACAP2,C16orf52,C5orf24,CDK17,CHIC1,DPY19L4,FAM91A1, FAR1,FMR1,GABPA,LYSMD3,MIER1,MTMR6,PRKAA1, SOCS4,STAM2,TMED7,TMEM106B,TMEM168,TMEM30A,TROVE2 |
 |
|
| ANKRD28,API5,CENPE,CKAP5,DLAT,DLGAP5,E2F8, FANCM,FAR1,GNPNAT1,KIF18A,NEDD1,PDE12,PDHX, RRM1,SAAL1,SASS6,SRSF1,SGOL1,SMC4,TMEM41B | BRCC3,CAAP1,DTWD2,FAM76B,FAM91A1,FAR1,FASTKD1, LARP4,MECOM,NIPAL2,PDE12,PPIP5K2,PRPF40A,PRPF4B, SLC30A9,SMC5,SOCS4,TDG,TMEM167A,TMEM168,ZNF562 |
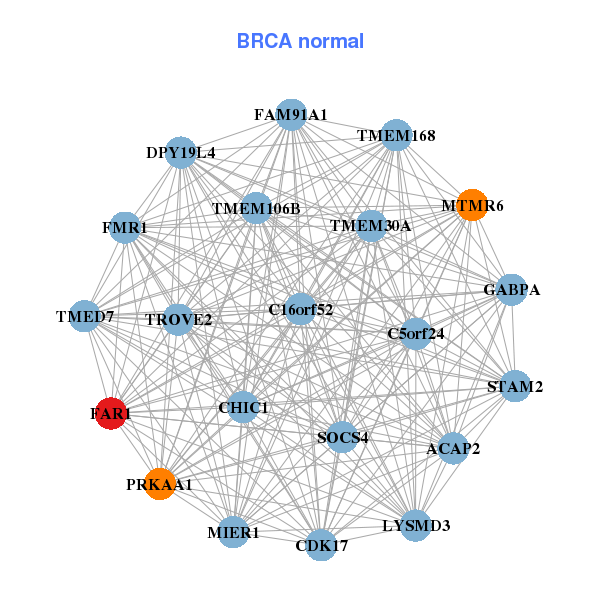
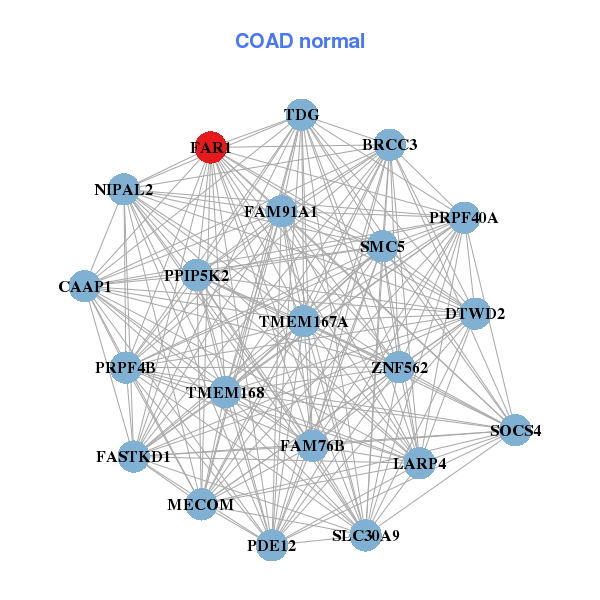
| * Co-Expression network figures were drawn using R package igraph. Only the top 20 genes with the highest correlations were shown. Red circle: input gene, orange circle: cell metabolism gene, sky circle: other gene |
: Open all plots for all cancer types
| Top |
: Open all interacting genes' information including KEGG pathway for all interacting genes from DAVID
| Top |
| Pharmacological Information for FAR1 |
| There's no related Drug. |
| Top |
| Cross referenced IDs for FAR1 |
| * We obtained these cross-references from Uniprot database. It covers 150 different DBs, 18 categories. http://www.uniprot.org/help/cross_references_section |
: Open all cross reference information
|
Copyright © 2016-Present - The Univsersity of Texas Health Science Center at Houston @ |