|
||||||||||||||||||||
| |
| Phenotypic Information (metabolism pathway, cancer, disease, phenome) |
| |
| |
| Gene-Gene Network Information: Co-Expression Network, Interacting Genes & KEGG |
| |
|


| Gene Summary for MRI1 |
| Basic gene info. | Gene symbol | MRI1 |
| Gene name | methylthioribose-1-phosphate isomerase 1 | |
| Synonyms | MRDI|MTNA|Ypr118w | |
| Cytomap | UCSC genome browser: 19p13.2 | |
| Genomic location | chr19 :13875336-13885096 | |
| Type of gene | protein-coding | |
| RefGenes | NM_001031727.2, NM_032285.2, | |
| Ensembl id | ENSG00000037757 | |
| Description | M1PiMTR-1-P isomeraseS-methyl-5-thioribose-1-phosphate isomerase 1mediator of RhoA-dependent invasionmethylthioribose-1-phosphate isomerasemethylthioribose-1-phosphate isomerase homologtranslation initiation factor eIF-2B subunit alpha/beta/delta-li | |
| Modification date | 20141207 | |
| dbXrefs | MIM : 615105 | |
| HGNC : HGNC | ||
| Ensembl : ENSG00000037757 | ||
| HPRD : 14548 | ||
| Vega : OTTHUMG00000180867 | ||
| Protein | UniProt: go to UniProt's Cross Reference DB Table | |
| Expression | CleanEX: HS_MRI1 | |
| BioGPS: 84245 | ||
| Gene Expression Atlas: ENSG00000037757 | ||
| The Human Protein Atlas: ENSG00000037757 | ||
| Pathway | NCI Pathway Interaction Database: MRI1 | |
| KEGG: MRI1 | ||
| REACTOME: MRI1 | ||
| ConsensusPathDB | ||
| Pathway Commons: MRI1 | ||
| Metabolism | MetaCyc: MRI1 | |
| HUMANCyc: MRI1 | ||
| Regulation | Ensembl's Regulation: ENSG00000037757 | |
| miRBase: chr19 :13,875,336-13,885,096 | ||
| TargetScan: NM_001031727 | ||
| cisRED: ENSG00000037757 | ||
| Context | iHOP: MRI1 | |
| cancer metabolism search in PubMed: MRI1 | ||
| UCL Cancer Institute: MRI1 | ||
| Assigned class in ccmGDB | C | |
| Top |
| Phenotypic Information for MRI1(metabolism pathway, cancer, disease, phenome) |
| Cancer | CGAP: MRI1 |
| Familial Cancer Database: MRI1 | |
| * This gene is included in those cancer gene databases. |
|
|
|
|
|
| . | ||||||||||||||
Oncogene 1 | Significant driver gene in | |||||||||||||||||||
| cf) number; DB name 1 Oncogene; http://nar.oxfordjournals.org/content/35/suppl_1/D721.long, 2 Tumor Suppressor gene; https://bioinfo.uth.edu/TSGene/, 3 Cancer Gene Census; http://www.nature.com/nrc/journal/v4/n3/abs/nrc1299.html, 4 CancerGenes; http://nar.oxfordjournals.org/content/35/suppl_1/D721.long, 5 Network of Cancer Gene; http://ncg.kcl.ac.uk/index.php, 1Therapeutic Vulnerabilities in Cancer; http://cbio.mskcc.org/cancergenomics/statius/ |
| REACTOME_SULFUR_AMINO_ACID_METABOLISM REACTOME_METABOLISM_OF_AMINO_ACIDS_AND_DERIVATIVES REACTOME_METABOLISM_OF_POLYAMINES | |
| OMIM | |
| Orphanet | |
| Disease | KEGG Disease: MRI1 |
| MedGen: MRI1 (Human Medical Genetics with Condition) | |
| ClinVar: MRI1 | |
| Phenotype | MGI: MRI1 (International Mouse Phenotyping Consortium) |
| PhenomicDB: MRI1 | |
| Mutations for MRI1 |
| * Under tables are showing count per each tissue to give us broad intuition about tissue specific mutation patterns.You can go to the detailed page for each mutation database's web site. |
| There's no structural variation information in COSMIC data for this gene. |
| * From mRNA Sanger sequences, Chitars2.0 arranged chimeric transcripts. This table shows MRI1 related fusion information. |
| ID | Head Gene | Tail Gene | Accession | Gene_a | qStart_a | qEnd_a | Chromosome_a | tStart_a | tEnd_a | Gene_a | qStart_a | qEnd_a | Chromosome_a | tStart_a | tEnd_a |
| Top |
| There's no copy number variation information in COSMIC data for this gene. |
| Top |
|
 |
| Top |
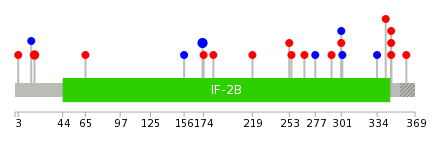
| Stat. for Non-Synonymous SNVs (# total SNVs=13) | (# total SNVs=7) |
 |  |
(# total SNVs=4) | (# total SNVs=0) |
 |
| Top |
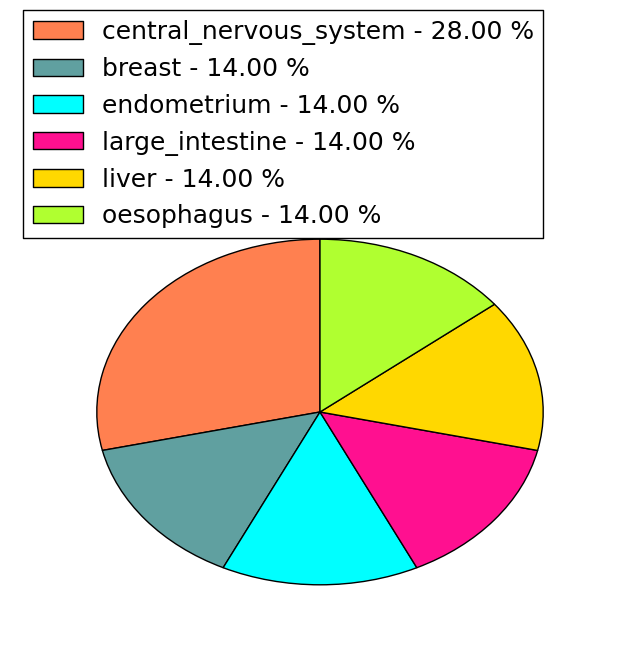
| * When you move the cursor on each content, you can see more deailed mutation information on the Tooltip. Those are primary_site,primary_histology,mutation(aa),pubmedID. |
| GRCh37 position | Mutation(aa) | Unique sampleID count |
| chr19:13882968-13882968 | p.H330fs*24 | 4 |
| chr19:13876915-13876915 | p.L173L | 3 |
| chr19:13875456-13875456 | p.Q18H | 2 |
| chr19:13883024-13883024 | p.E347* | 2 |
| chr19:13879744-13879744 | p.Y277Y | 1 |
| chr19:13883025-13883025 | p.E347V | 1 |
| chr19:13875469-13875469 | p.K23* | 1 |
| chr19:13879787-13879787 | p.G292S | 1 |
| chr19:13883026-13883026 | p.E347D | 1 |
| chr19:13875746-13875746 | p.A65V | 1 |
| Top |
|
 |
| Point Mutation/ Tissue ID | 1 | 2 | 3 | 4 | 5 | 6 | 7 | 8 | 9 | 10 | 11 | 12 | 13 | 14 | 15 | 16 | 17 | 18 | 19 | 20 |
| # sample | 2 | 1 | 1 | 1 | 1 | 1 | 1 | 4 | 2 | |||||||||||
| # mutation | 2 | 1 | 1 | 1 | 1 | 1 | 1 | 4 | 2 | |||||||||||
| nonsynonymous SNV | 1 | 1 | 1 | 1 | 1 | 1 | 3 | |||||||||||||
| synonymous SNV | 1 | 1 | 1 | 2 |
| cf) Tissue ID; Tissue type (1; BLCA[Bladder Urothelial Carcinoma], 2; BRCA[Breast invasive carcinoma], 3; CESC[Cervical squamous cell carcinoma and endocervical adenocarcinoma], 4; COAD[Colon adenocarcinoma], 5; GBM[Glioblastoma multiforme], 6; Glioma Low Grade, 7; HNSC[Head and Neck squamous cell carcinoma], 8; KICH[Kidney Chromophobe], 9; KIRC[Kidney renal clear cell carcinoma], 10; KIRP[Kidney renal papillary cell carcinoma], 11; LAML[Acute Myeloid Leukemia], 12; LUAD[Lung adenocarcinoma], 13; LUSC[Lung squamous cell carcinoma], 14; OV[Ovarian serous cystadenocarcinoma ], 15; PAAD[Pancreatic adenocarcinoma], 16; PRAD[Prostate adenocarcinoma], 17; SKCM[Skin Cutaneous Melanoma], 18:STAD[Stomach adenocarcinoma], 19:THCA[Thyroid carcinoma], 20:UCEC[Uterine Corpus Endometrial Carcinoma]) |
| Top |
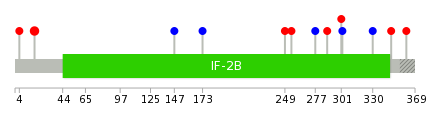
| * We represented just top 10 SNVs. When you move the cursor on each content, you can see more deailed mutation information on the Tooltip. Those are primary_site, primary_histology, mutation(aa), pubmedID. |
| Genomic Position | Mutation(aa) | Unique sampleID count |
| chr19:13875456 | p.Q18H,MRI1 | 2 |
| chr19:13876915 | p.L173L | 1 |
| chr19:13879242 | p.P147P | 1 |
| chr19:13879659 | p.R249H,MRI1 | 1 |
| chr19:13879676 | p.D255N,MRI1 | 1 |
| chr19:13879744 | p.Y277Y,MRI1 | 1 |
| chr19:13879776 | p.R288H,MRI1 | 1 |
| chr19:13879814 | p.P301S,MRI1 | 1 |
| chr19:13879819 | p.G302G,MRI1 | 1 |
| chr19:13882975 | p.H330H,MRI1 | 1 |
| * Copy number data were extracted from TCGA using R package TCGA-Assembler. The URLs of all public data files on TCGA DCC data server were gathered on Jan-05-2015. Function ProcessCNAData in TCGA-Assembler package was used to obtain gene-level copy number value which is calculated as the average copy number of the genomic region of a gene. |
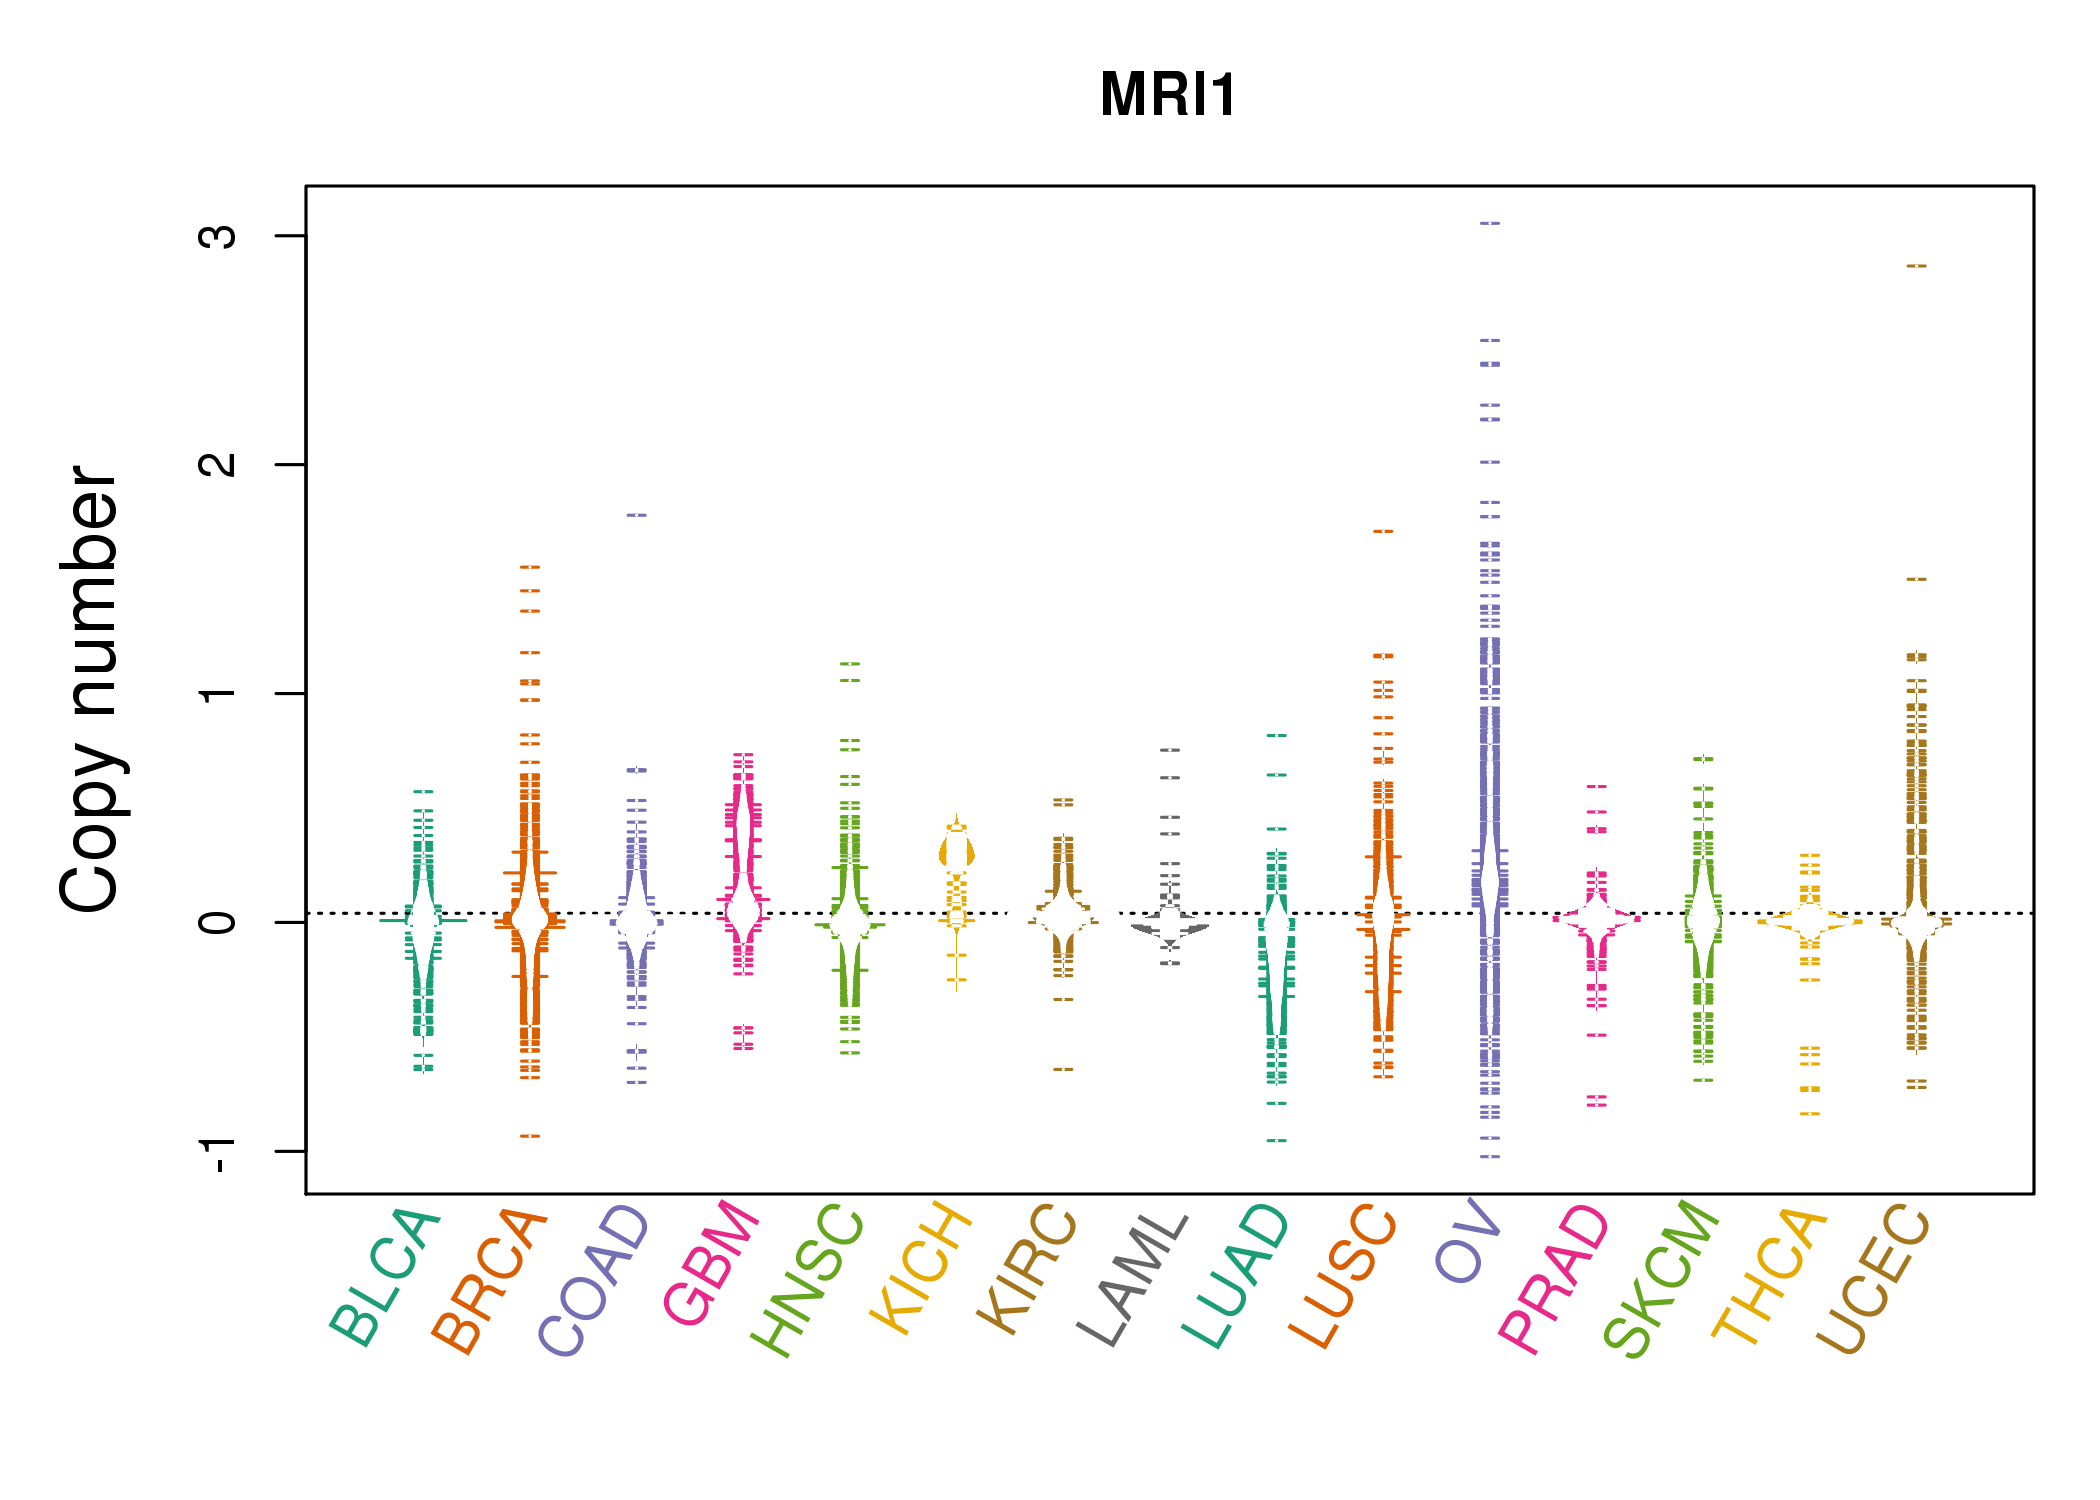 |
| cf) Tissue ID[Tissue type]: BLCA[Bladder Urothelial Carcinoma], BRCA[Breast invasive carcinoma], CESC[Cervical squamous cell carcinoma and endocervical adenocarcinoma], COAD[Colon adenocarcinoma], GBM[Glioblastoma multiforme], Glioma Low Grade, HNSC[Head and Neck squamous cell carcinoma], KICH[Kidney Chromophobe], KIRC[Kidney renal clear cell carcinoma], KIRP[Kidney renal papillary cell carcinoma], LAML[Acute Myeloid Leukemia], LUAD[Lung adenocarcinoma], LUSC[Lung squamous cell carcinoma], OV[Ovarian serous cystadenocarcinoma ], PAAD[Pancreatic adenocarcinoma], PRAD[Prostate adenocarcinoma], SKCM[Skin Cutaneous Melanoma], STAD[Stomach adenocarcinoma], THCA[Thyroid carcinoma], UCEC[Uterine Corpus Endometrial Carcinoma] |
| Top |
| Gene Expression for MRI1 |
| * CCLE gene expression data were extracted from CCLE_Expression_Entrez_2012-10-18.res: Gene-centric RMA-normalized mRNA expression data. |
 |
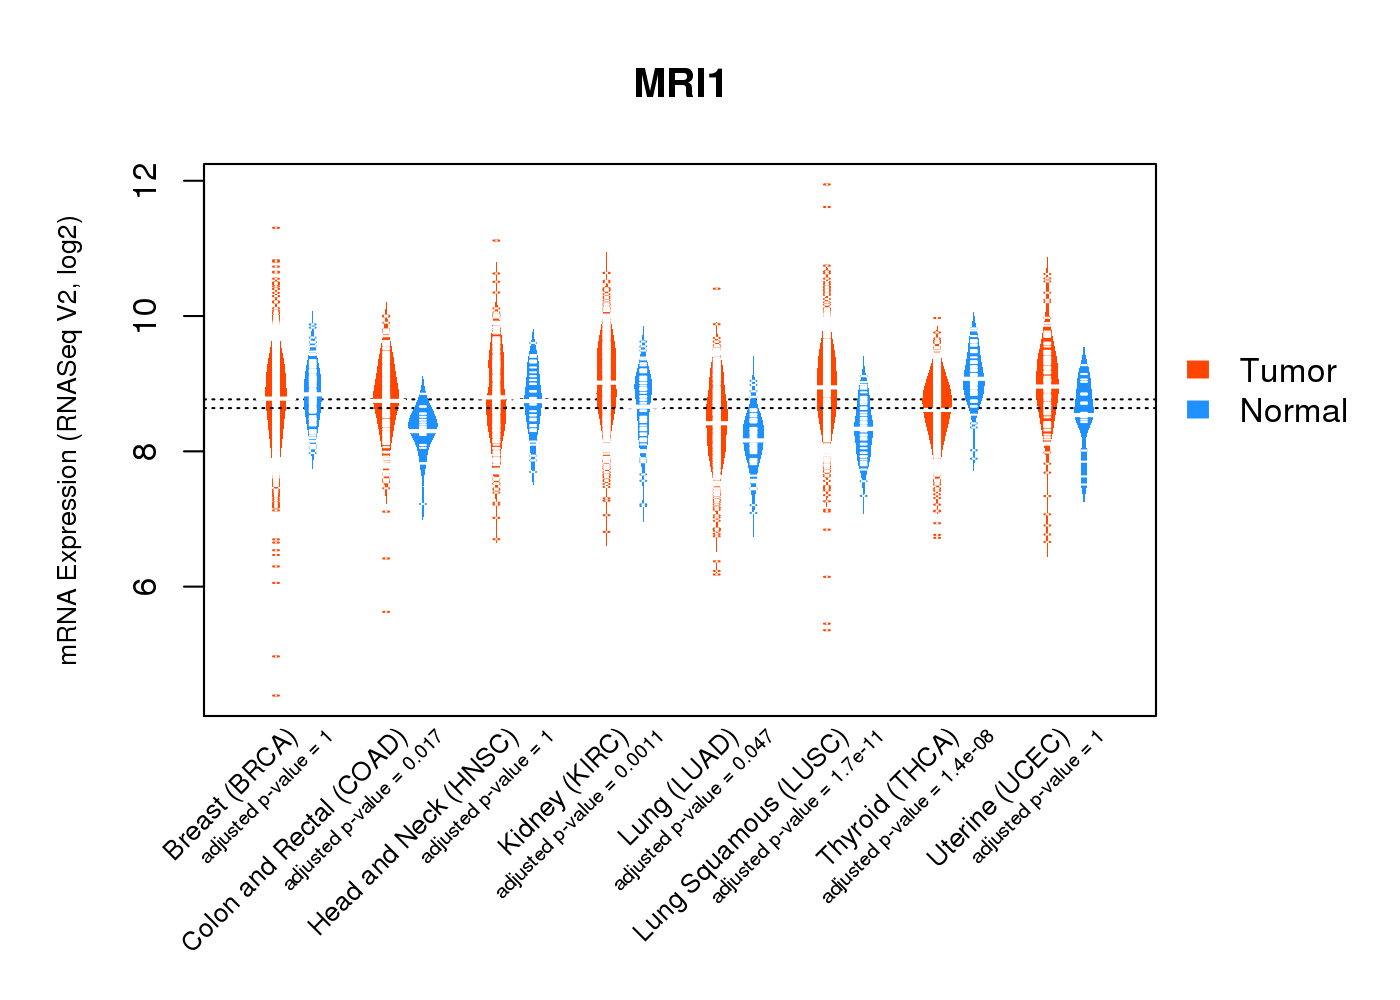
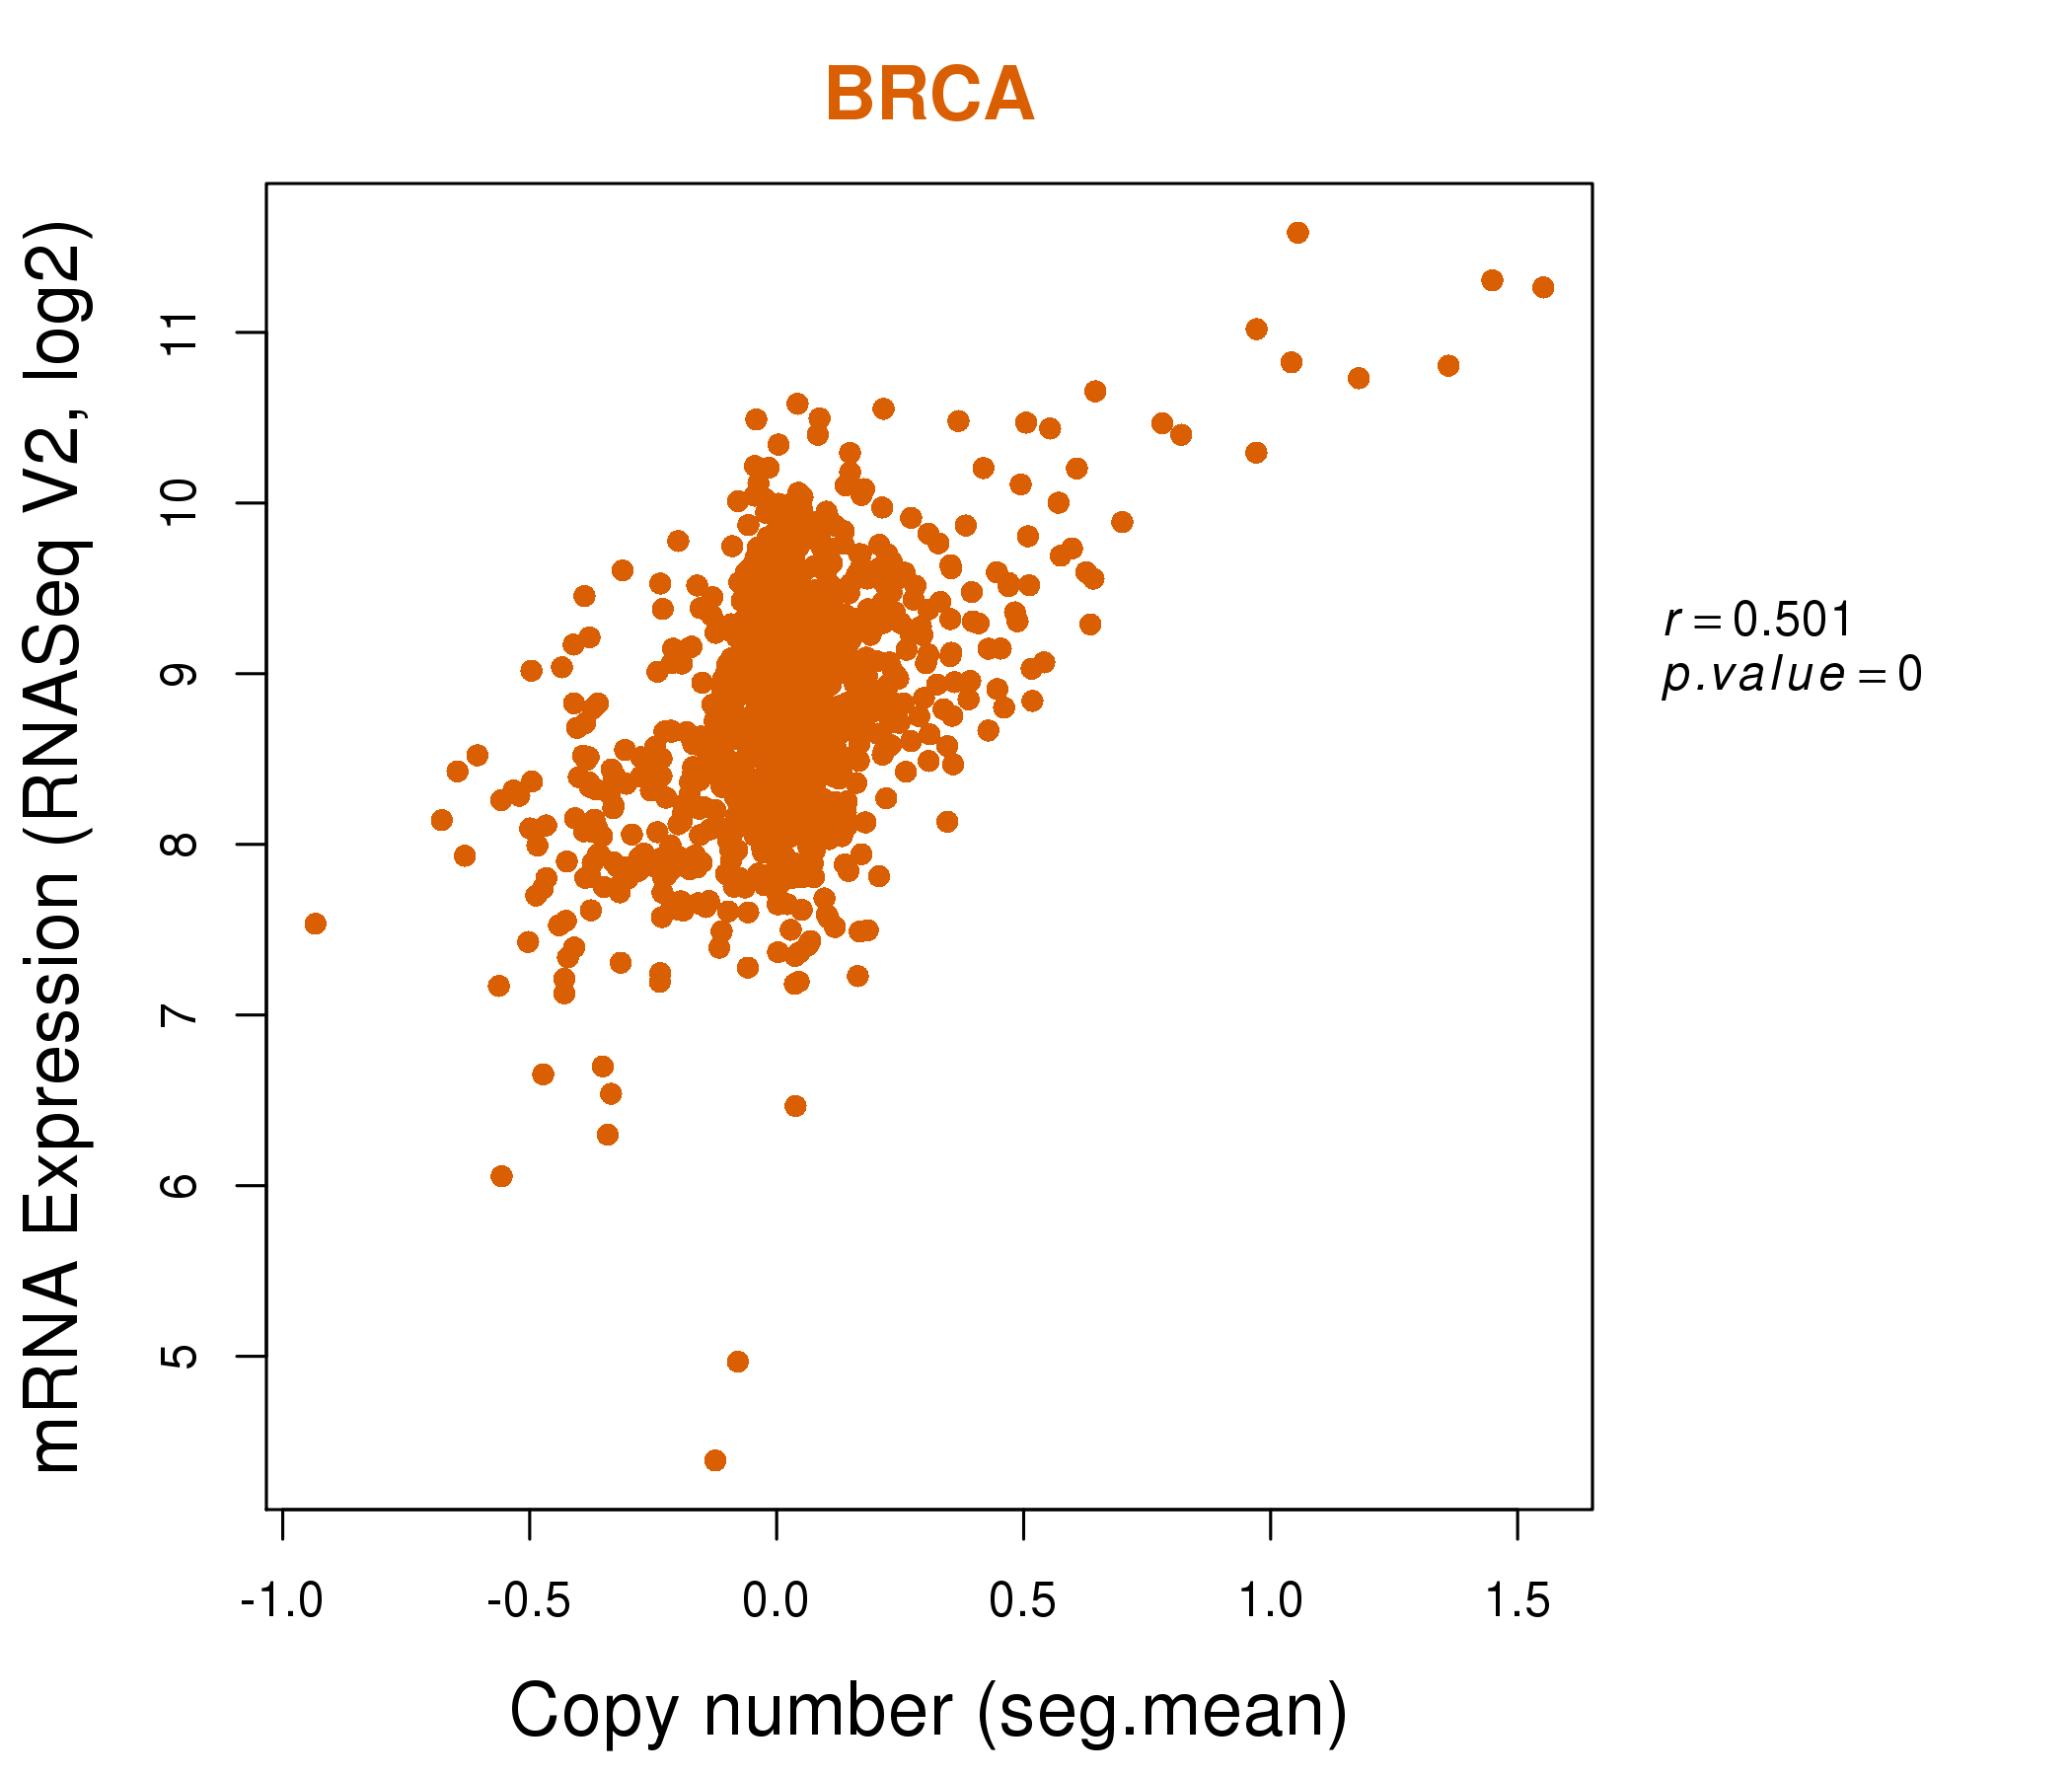
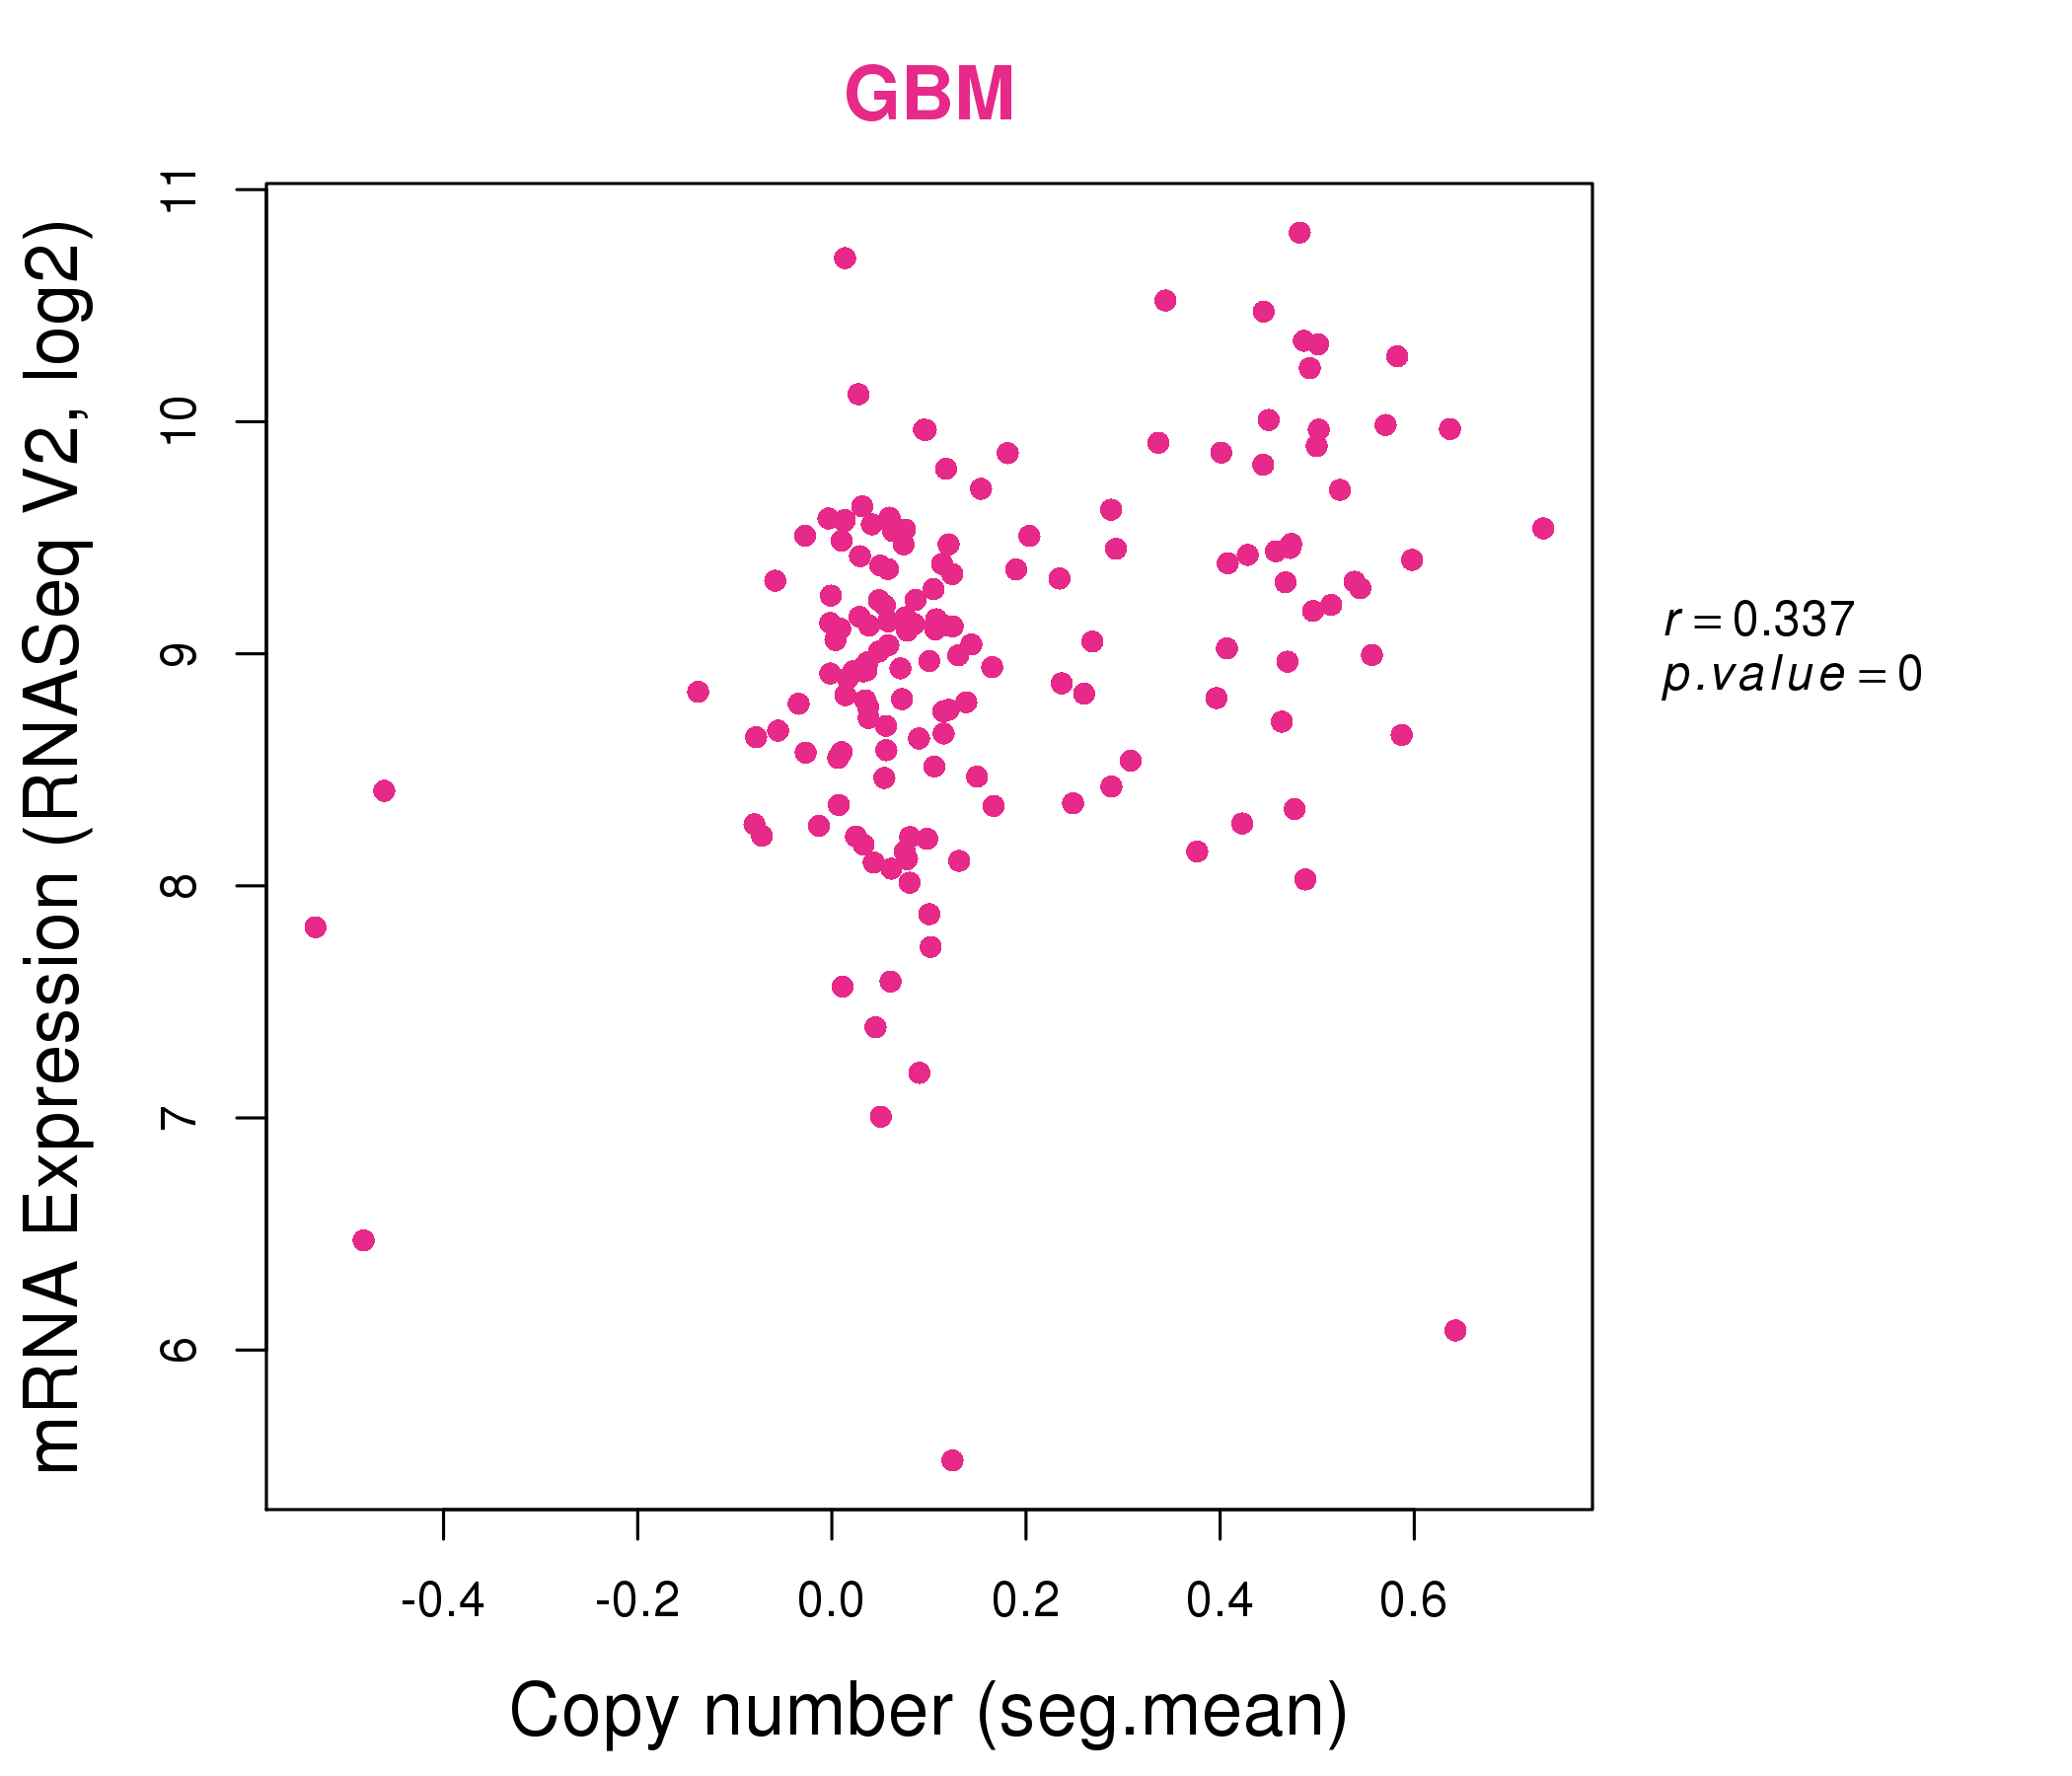
| * Normalized gene expression data of RNASeqV2 was extracted from TCGA using R package TCGA-Assembler. The URLs of all public data files on TCGA DCC data server were gathered at Jan-05-2015. Only eight cancer types have enough normal control samples for differential expression analysis. (t test, adjusted p<0.05 (using Benjamini-Hochberg FDR)) |
 |
| Top |
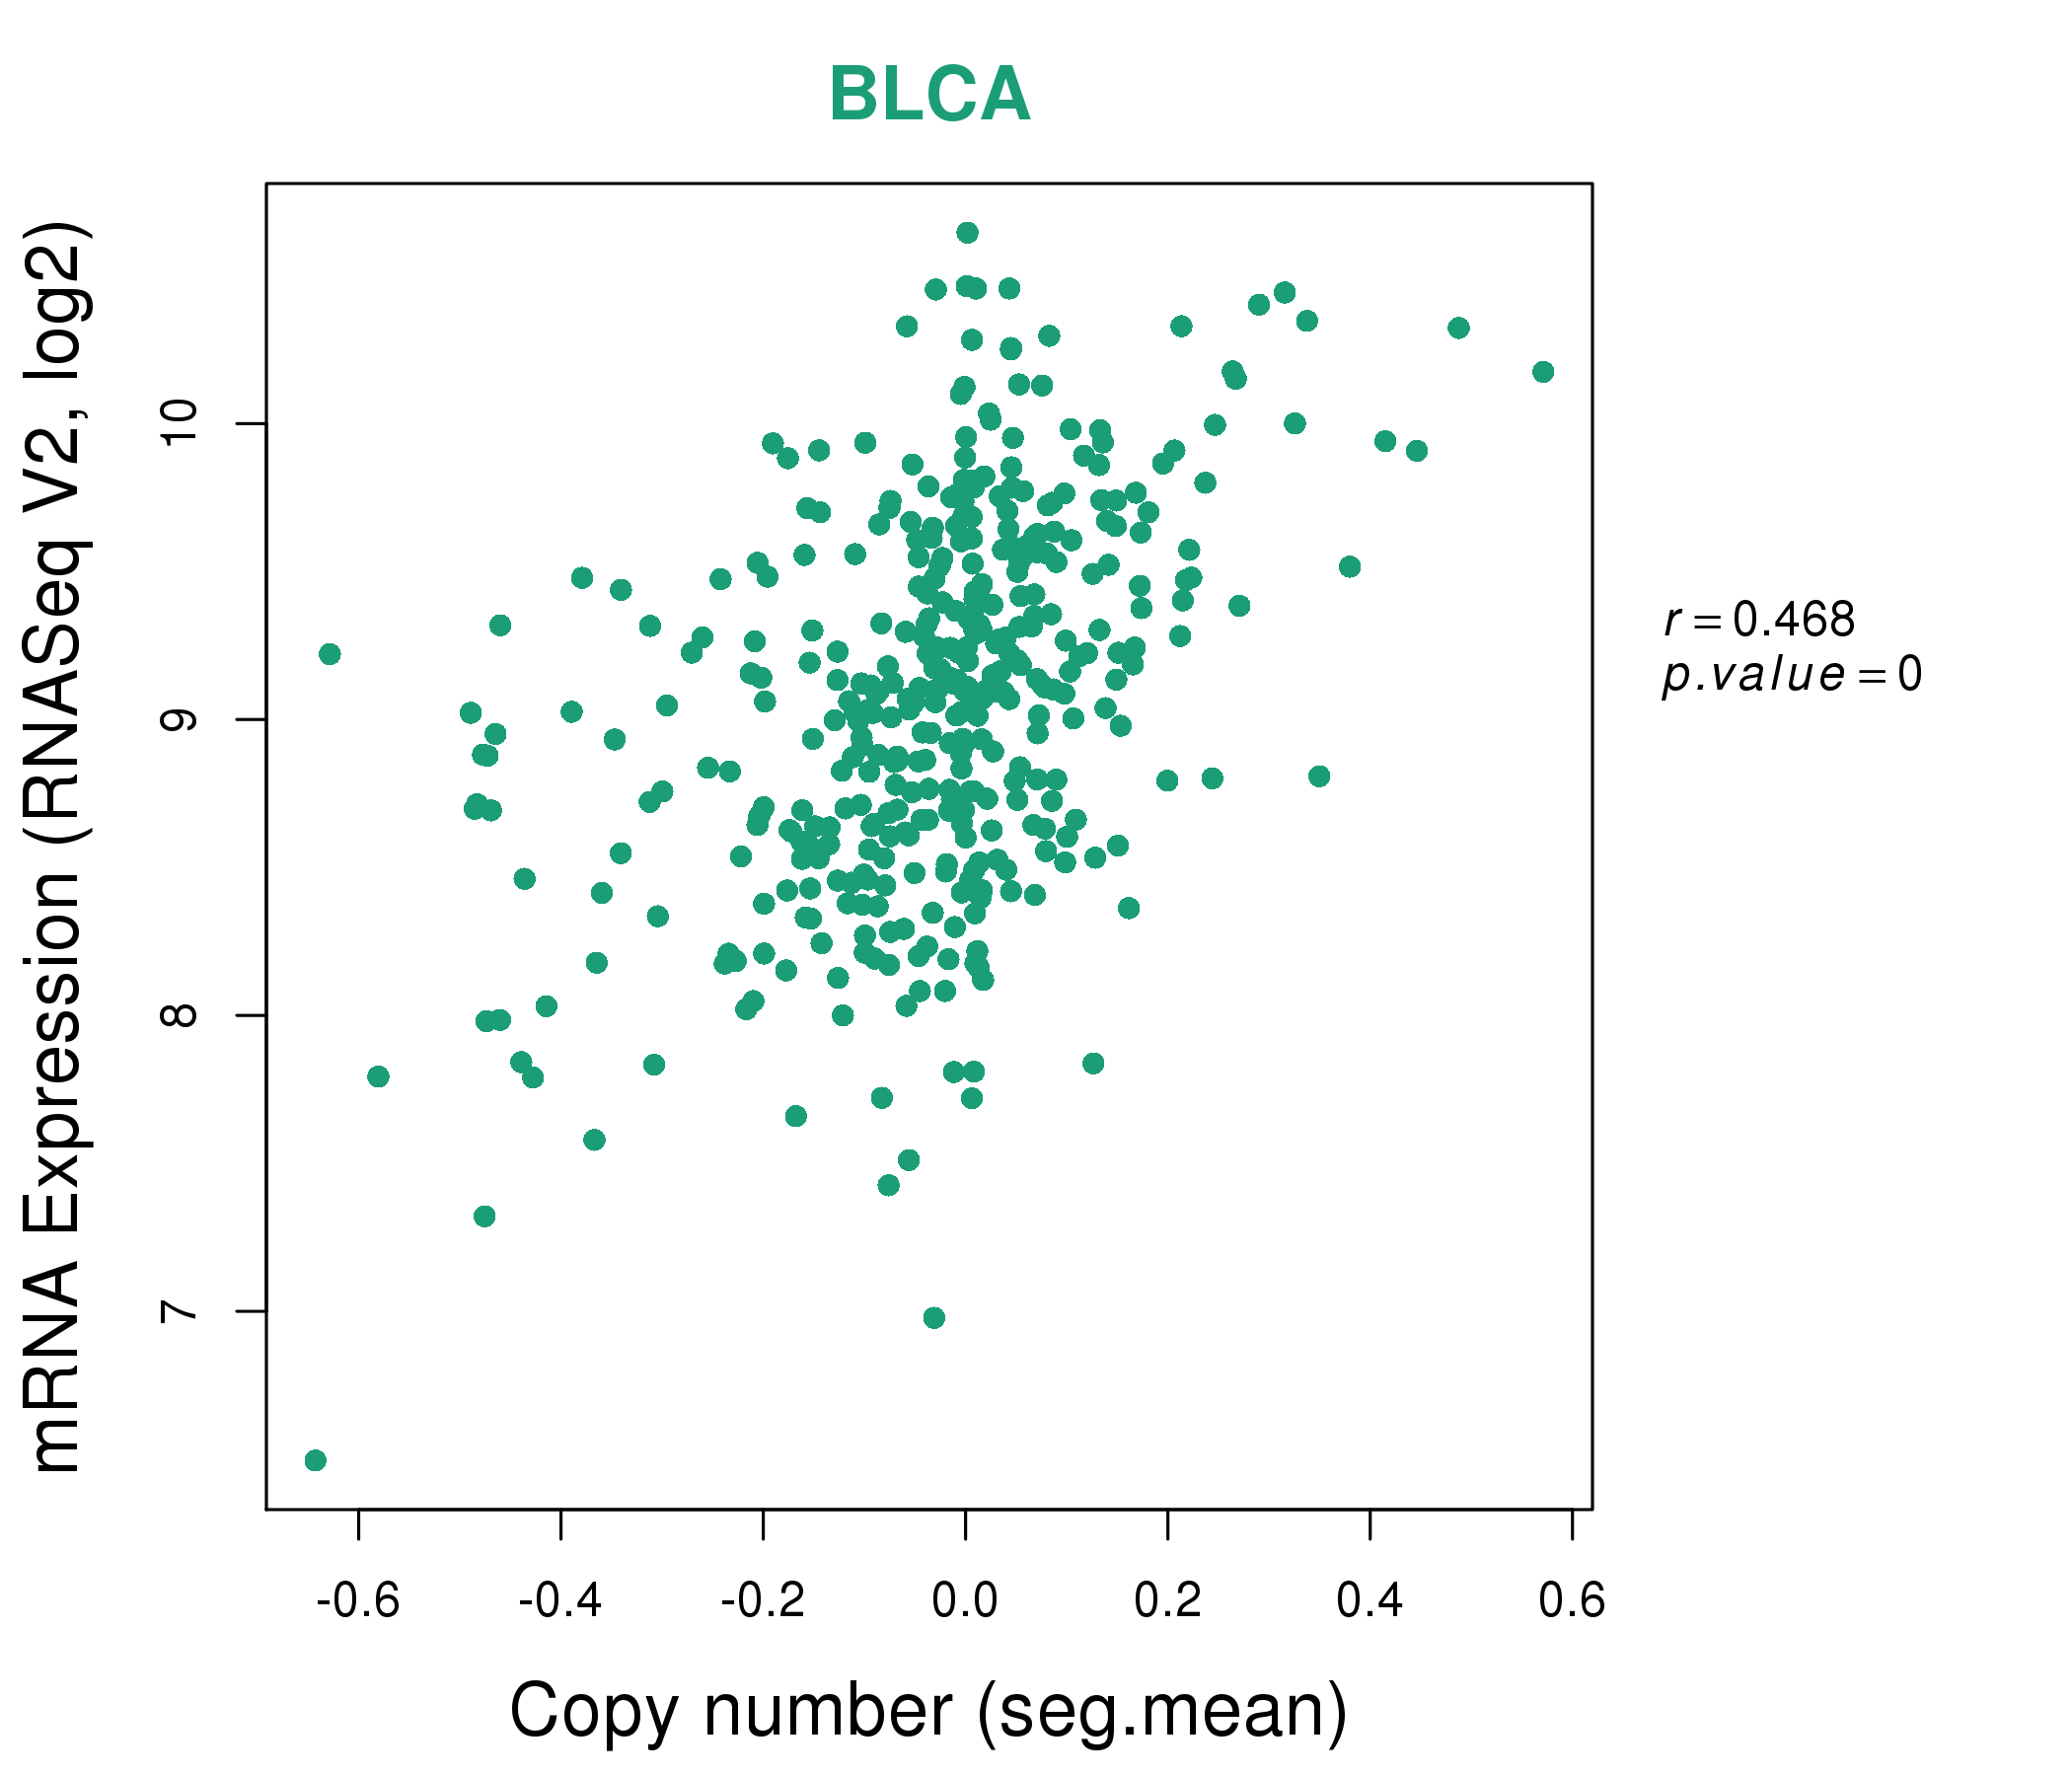
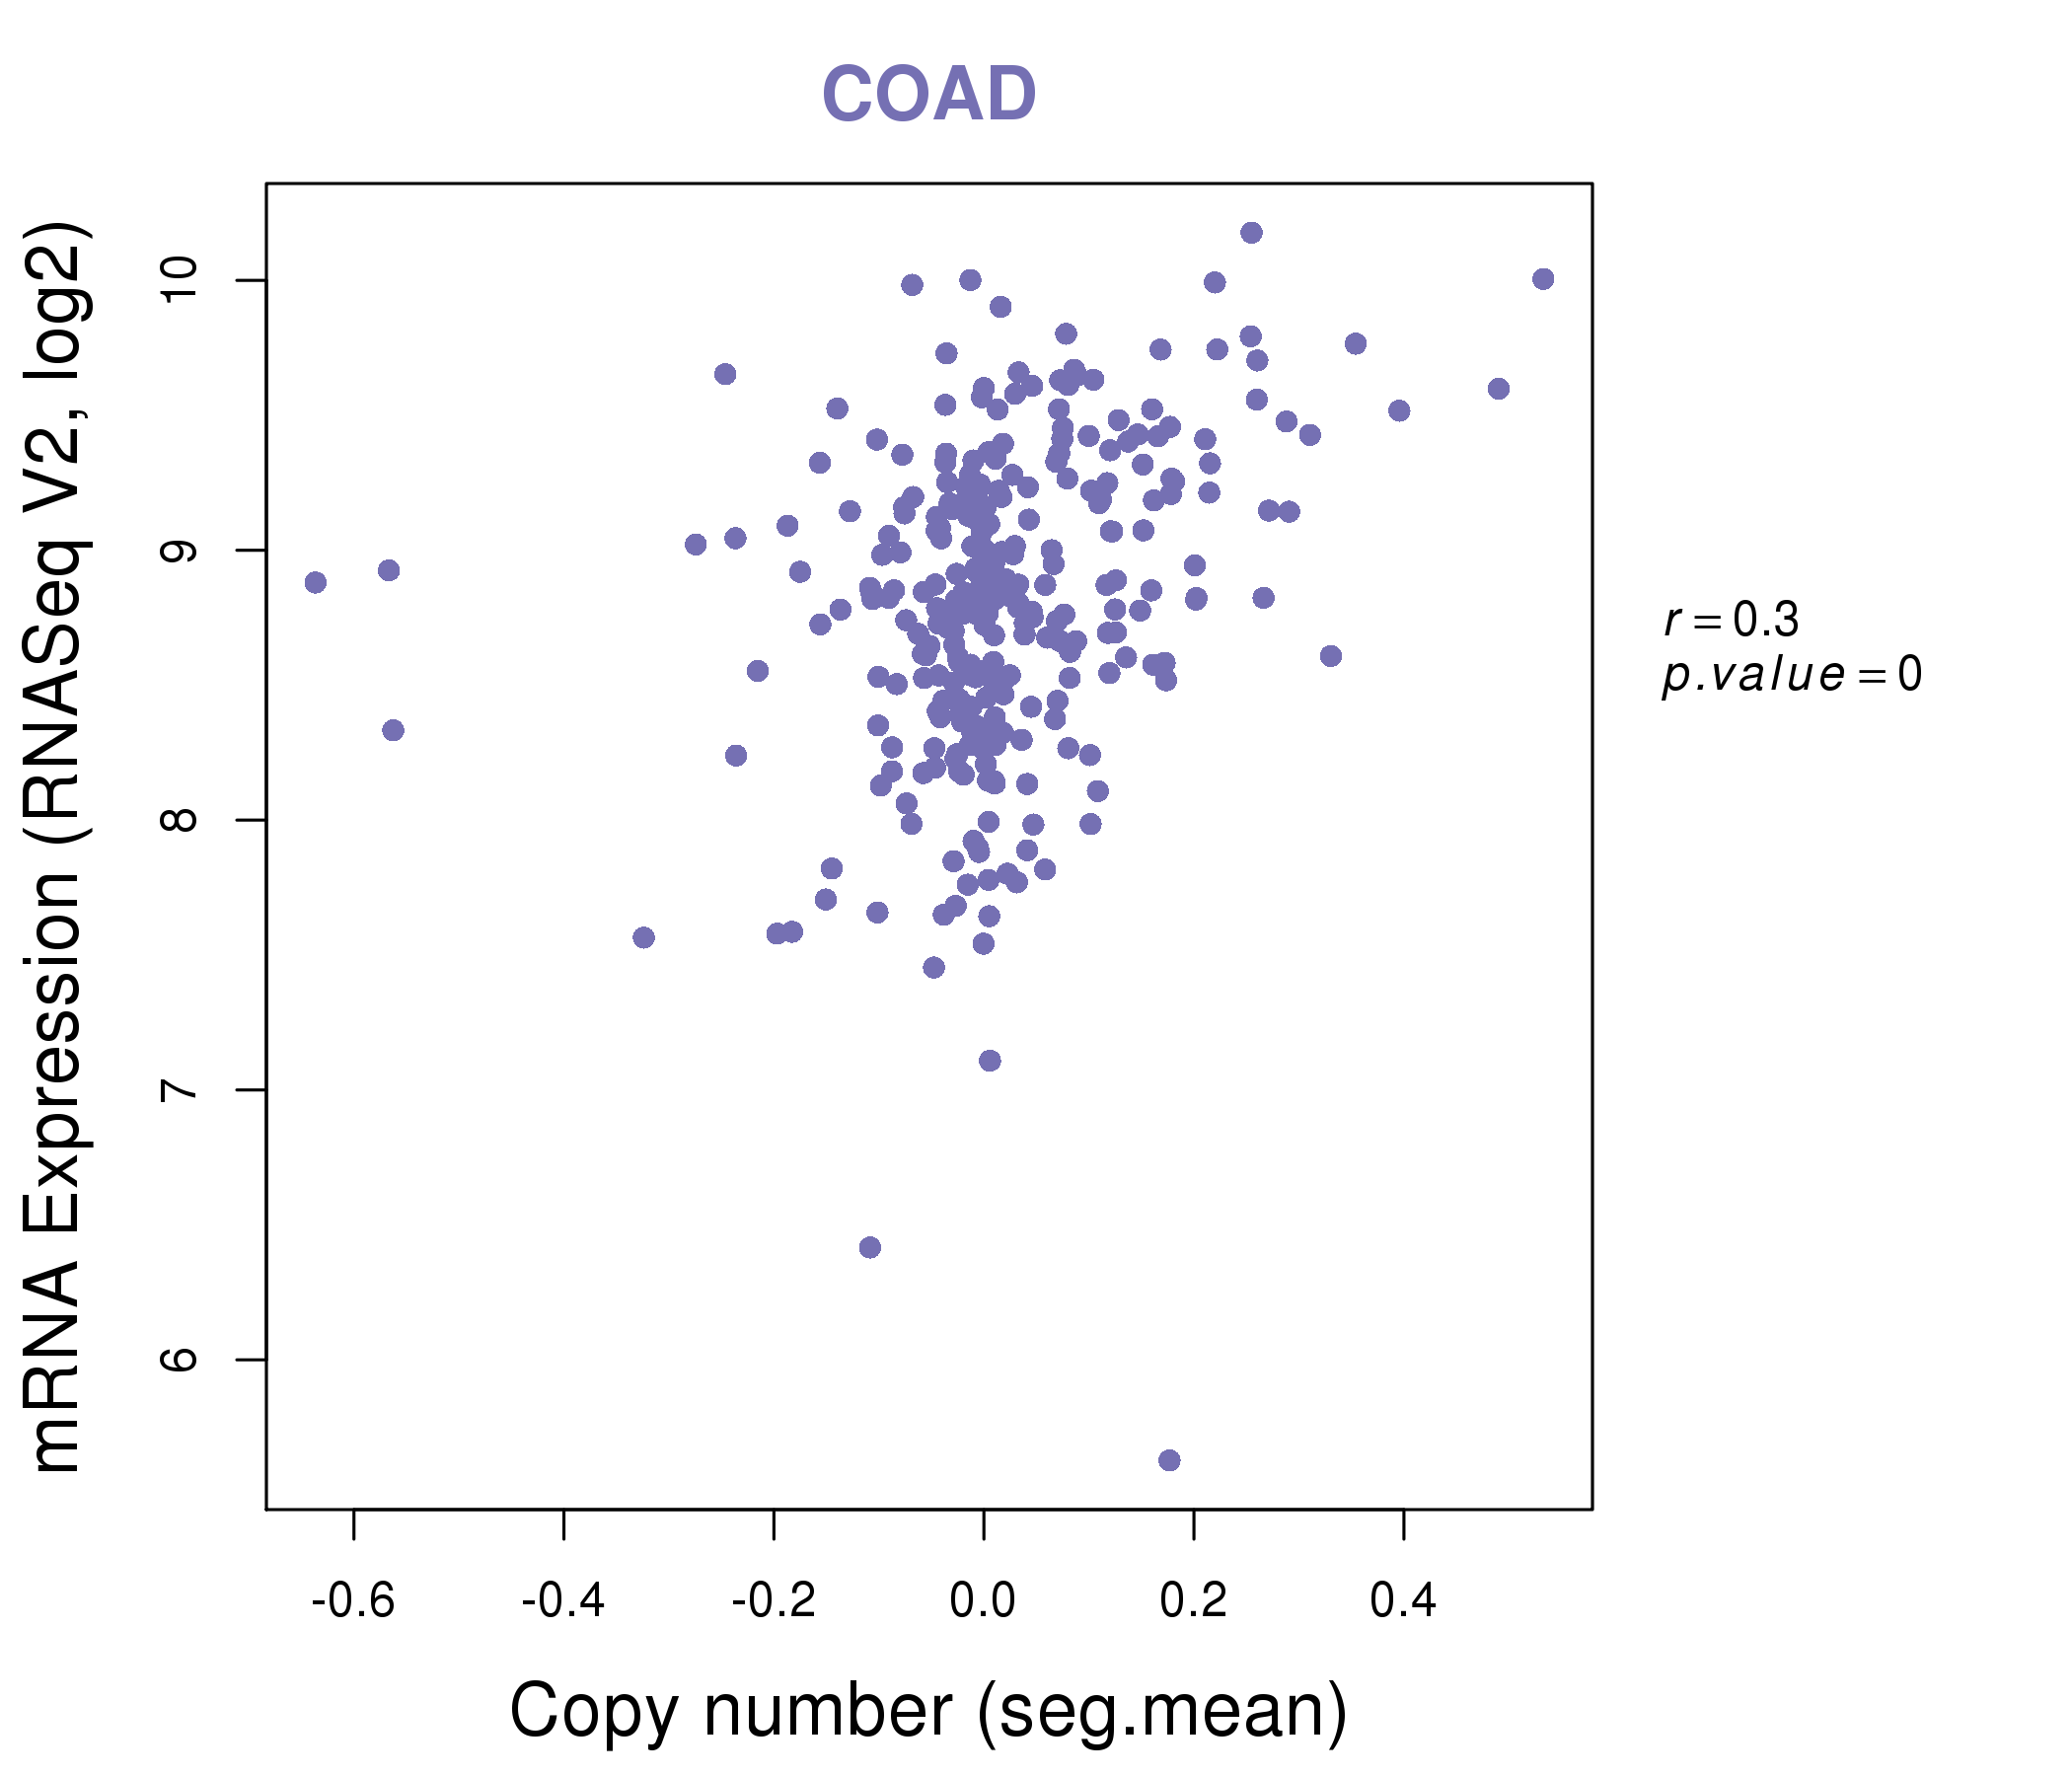
| * This plots show the correlation between CNV and gene expression. |
: Open all plots for all cancer types
 |
|
 |
|
| Top |
| Gene-Gene Network Information |
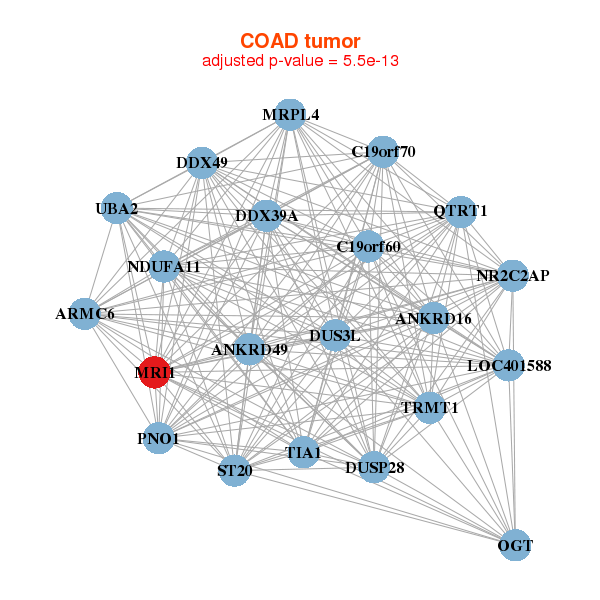
| * Co-Expression network figures were drawn using R package igraph. Only the top 20 genes with the highest correlations were shown. Red circle: input gene, orange circle: cell metabolism gene, sky circle: other gene |
: Open all plots for all cancer types
 |
|
| AKAP8,ANO8,C19orf44,CC2D1A,CCDC130,CHERP,CRTC1, DCAF15,GTPBP3,HOOK2,KRI1,MED26,MRI1,RFX1, SIN3B,STX10,TNPO2,TRMT1,TYK2,WIZ,ZNF700 | ARHGAP33,BPNT1,ATAT1,TBC1D32,CDK20,FLJ45445,GK5, HSD17B7P2,METTL17,MRI1,NSUN7,PABPC1L,PMS2,QPCTL, SECISBP2,SNHG10,WDR73,ZNF266,ZNF273,ZNF433,ZNF785 |
 |
|
| ANKRD16,ANKRD49,ARMC6,C19orf60,C19orf70,DDX39A,DDX49, DUS3L,DUSP28,LOC401588,MRI1,MRPL4,NDUFA11,NR2C2AP, OGT,PNO1,QTRT1,ST20,TIA1,TRMT1,UBA2 | AGAP4,AHSA2,ANKS3,APBB3,CALCR,CEP95,EFHC1, IKBKB,MRI1,PAN2,POLM,RBM5,SNHG12,STAG3L1, TBC1D3,THSD1P1,TRIM4,TRPV1,USPL1,ZNF75D,ZNF839 |

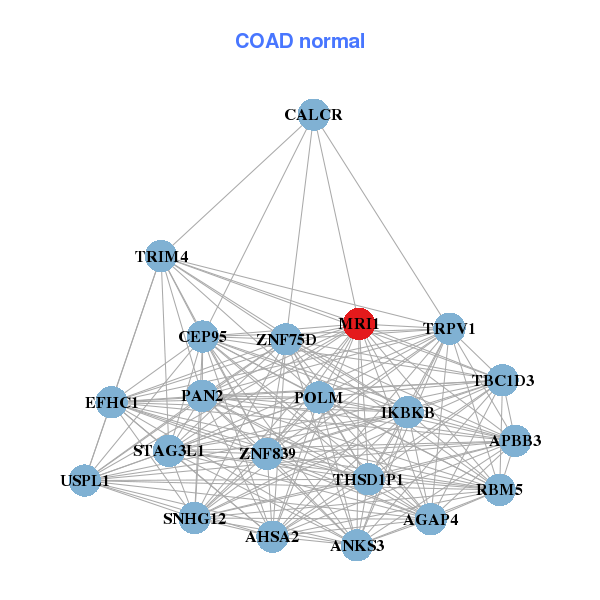
| * Co-Expression network figures were drawn using R package igraph. Only the top 20 genes with the highest correlations were shown. Red circle: input gene, orange circle: cell metabolism gene, sky circle: other gene |
: Open all plots for all cancer types
| Top |
: Open all interacting genes' information including KEGG pathway for all interacting genes from DAVID
| Top |
| Pharmacological Information for MRI1 |
| There's no related Drug. |
| Top |
| Cross referenced IDs for MRI1 |
| * We obtained these cross-references from Uniprot database. It covers 150 different DBs, 18 categories. http://www.uniprot.org/help/cross_references_section |
: Open all cross reference information
|
Copyright © 2016-Present - The Univsersity of Texas Health Science Center at Houston @ |