|
||||||||||||||||||||
| |
| Phenotypic Information (metabolism pathway, cancer, disease, phenome) |
| |
| |
| Gene-Gene Network Information: Co-Expression Network, Interacting Genes & KEGG |
| |
|


| Gene Summary for MED10 |
| Basic gene info. | Gene symbol | MED10 |
| Gene name | mediator complex subunit 10 | |
| Synonyms | NUT2|TRG20 | |
| Cytomap | UCSC genome browser: 5p15.31 | |
| Genomic location | chr5 :6372038-6378639 | |
| Type of gene | protein-coding | |
| RefGenes | NM_032286.2, | |
| Ensembl id | ENSG00000133398 | |
| Description | TRG-17TRG-20mediator of RNA polymerase II transcription subunit 10mediator of RNA polymerase II transcription, subunit 10transformation-related gene 17 proteintransformation-related gene 20 protein | |
| Modification date | 20141207 | |
| dbXrefs | MIM : 612382 | |
| HGNC : HGNC | ||
| Ensembl : ENSG00000133398 | ||
| HPRD : 14680 | ||
| Vega : OTTHUMG00000161682 | ||
| Protein | UniProt: go to UniProt's Cross Reference DB Table | |
| Expression | CleanEX: HS_MED10 | |
| BioGPS: 84246 | ||
| Gene Expression Atlas: ENSG00000133398 | ||
| The Human Protein Atlas: ENSG00000133398 | ||
| Pathway | NCI Pathway Interaction Database: MED10 | |
| KEGG: MED10 | ||
| REACTOME: MED10 | ||
| ConsensusPathDB | ||
| Pathway Commons: MED10 | ||
| Metabolism | MetaCyc: MED10 | |
| HUMANCyc: MED10 | ||
| Regulation | Ensembl's Regulation: ENSG00000133398 | |
| miRBase: chr5 :6,372,038-6,378,639 | ||
| TargetScan: NM_032286 | ||
| cisRED: ENSG00000133398 | ||
| Context | iHOP: MED10 | |
| cancer metabolism search in PubMed: MED10 | ||
| UCL Cancer Institute: MED10 | ||
| Assigned class in ccmGDB | C | |
| Top |
| Phenotypic Information for MED10(metabolism pathway, cancer, disease, phenome) |
| Cancer | CGAP: MED10 |
| Familial Cancer Database: MED10 | |
| * This gene is included in those cancer gene databases. |
|
|
|
|
|
| . | ||||||||||||||
Oncogene 1 | Significant driver gene in | |||||||||||||||||||
| cf) number; DB name 1 Oncogene; http://nar.oxfordjournals.org/content/35/suppl_1/D721.long, 2 Tumor Suppressor gene; https://bioinfo.uth.edu/TSGene/, 3 Cancer Gene Census; http://www.nature.com/nrc/journal/v4/n3/abs/nrc1299.html, 4 CancerGenes; http://nar.oxfordjournals.org/content/35/suppl_1/D721.long, 5 Network of Cancer Gene; http://ncg.kcl.ac.uk/index.php, 1Therapeutic Vulnerabilities in Cancer; http://cbio.mskcc.org/cancergenomics/statius/ |
| REACTOME_METABOLISM_OF_LIPIDS_AND_LIPOPROTEINS | |
| OMIM | |
| Orphanet | |
| Disease | KEGG Disease: MED10 |
| MedGen: MED10 (Human Medical Genetics with Condition) | |
| ClinVar: MED10 | |
| Phenotype | MGI: MED10 (International Mouse Phenotyping Consortium) |
| PhenomicDB: MED10 | |
| Mutations for MED10 |
| * Under tables are showing count per each tissue to give us broad intuition about tissue specific mutation patterns.You can go to the detailed page for each mutation database's web site. |
| There's no structural variation information in COSMIC data for this gene. |
| * From mRNA Sanger sequences, Chitars2.0 arranged chimeric transcripts. This table shows MED10 related fusion information. |
| ID | Head Gene | Tail Gene | Accession | Gene_a | qStart_a | qEnd_a | Chromosome_a | tStart_a | tEnd_a | Gene_a | qStart_a | qEnd_a | Chromosome_a | tStart_a | tEnd_a |
| AY453399 | SUN2 | 1 | 349 | 22 | 39175441 | 39178755 | MED10 | 350 | 446 | 5 | 6372616 | 6372712 | |
| BU686640 | CC2D1A | 18 | 513 | 19 | 14041197 | 14041692 | MED10 | 512 | 604 | 5 | 6372242 | 6372334 | |
| CA433841 | MED10 | 11 | 257 | 5 | 6377063 | 6377309 | SPARCL1 | 250 | 403 | 4 | 88415592 | 88415745 | |
| Top |
| There's no copy number variation information in COSMIC data for this gene. |
| Top |
|
 |
| Top |
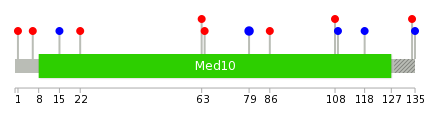
| Stat. for Non-Synonymous SNVs (# total SNVs=7) | (# total SNVs=2) |
 |  |
(# total SNVs=0) | (# total SNVs=0) |
| Top |
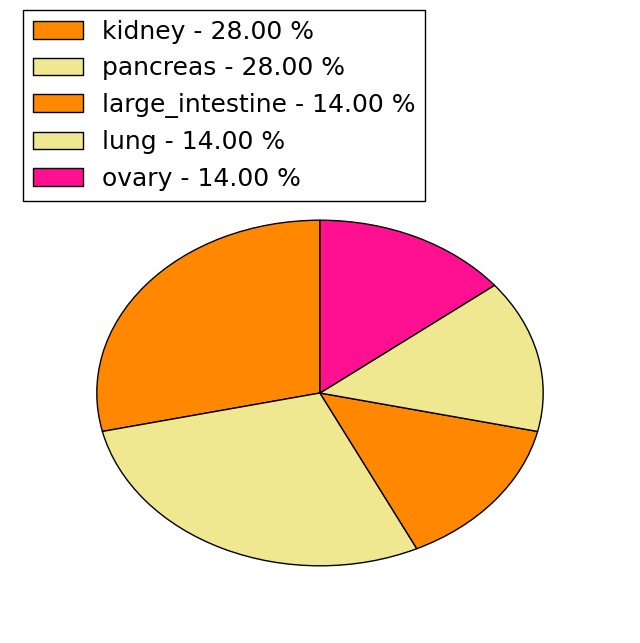
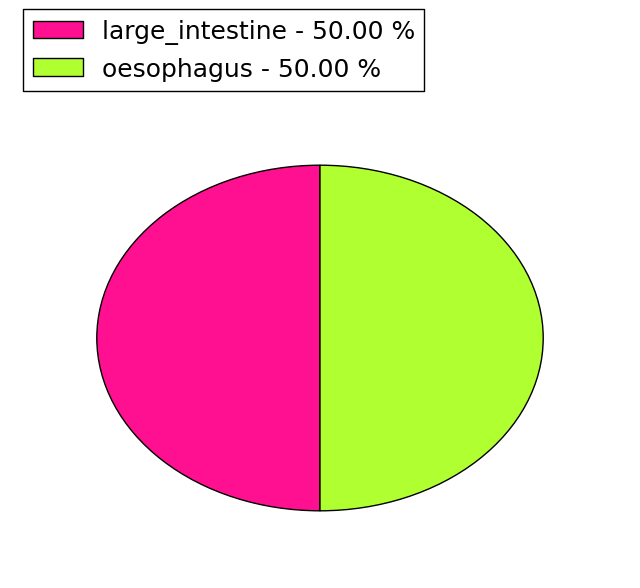
| * When you move the cursor on each content, you can see more deailed mutation information on the Tooltip. Those are primary_site,primary_histology,mutation(aa),pubmedID. |
| GRCh37 position | Mutation(aa) | Unique sampleID count |
| chr5:6374509-6374509 | p.L79L | 2 |
| chr5:6378552-6378552 | p.F15F | 1 |
| chr5:6372619-6372619 | p.S135S | 1 |
| chr5:6378580-6378580 | p.D6V | 1 |
| chr5:6372624-6372624 | p.P134S | 1 |
| chr5:6378594-6378594 | p.M1I | 1 |
| chr5:6372670-6372670 | p.P118P | 1 |
| chr5:6372697-6372697 | p.L109L | 1 |
| chr5:6372701-6372701 | p.L108Q | 1 |
| chr5:6374488-6374488 | p.E86D | 1 |
| Top |
|
 |
| Point Mutation/ Tissue ID | 1 | 2 | 3 | 4 | 5 | 6 | 7 | 8 | 9 | 10 | 11 | 12 | 13 | 14 | 15 | 16 | 17 | 18 | 19 | 20 |
| # sample | 1 | 1 | 1 | 1 | 1 | |||||||||||||||
| # mutation | 1 | 1 | 1 | 1 | 1 | |||||||||||||||
| nonsynonymous SNV | 1 | 1 | 1 | |||||||||||||||||
| synonymous SNV | 1 | 1 |
| cf) Tissue ID; Tissue type (1; BLCA[Bladder Urothelial Carcinoma], 2; BRCA[Breast invasive carcinoma], 3; CESC[Cervical squamous cell carcinoma and endocervical adenocarcinoma], 4; COAD[Colon adenocarcinoma], 5; GBM[Glioblastoma multiforme], 6; Glioma Low Grade, 7; HNSC[Head and Neck squamous cell carcinoma], 8; KICH[Kidney Chromophobe], 9; KIRC[Kidney renal clear cell carcinoma], 10; KIRP[Kidney renal papillary cell carcinoma], 11; LAML[Acute Myeloid Leukemia], 12; LUAD[Lung adenocarcinoma], 13; LUSC[Lung squamous cell carcinoma], 14; OV[Ovarian serous cystadenocarcinoma ], 15; PAAD[Pancreatic adenocarcinoma], 16; PRAD[Prostate adenocarcinoma], 17; SKCM[Skin Cutaneous Melanoma], 18:STAD[Stomach adenocarcinoma], 19:THCA[Thyroid carcinoma], 20:UCEC[Uterine Corpus Endometrial Carcinoma]) |
| Top |
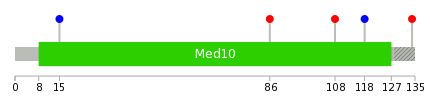
| * We represented just top 10 SNVs. When you move the cursor on each content, you can see more deailed mutation information on the Tooltip. Those are primary_site, primary_histology, mutation(aa), pubmedID. |
| Genomic Position | Mutation(aa) | Unique sampleID count |
| chr5:6372624 | p.P134S | 1 |
| chr5:6372670 | p.P118P | 1 |
| chr5:6372701 | p.L108Q | 1 |
| chr5:6374488 | p.E86D | 1 |
| chr5:6378552 | p.F15F | 1 |
| * Copy number data were extracted from TCGA using R package TCGA-Assembler. The URLs of all public data files on TCGA DCC data server were gathered on Jan-05-2015. Function ProcessCNAData in TCGA-Assembler package was used to obtain gene-level copy number value which is calculated as the average copy number of the genomic region of a gene. |
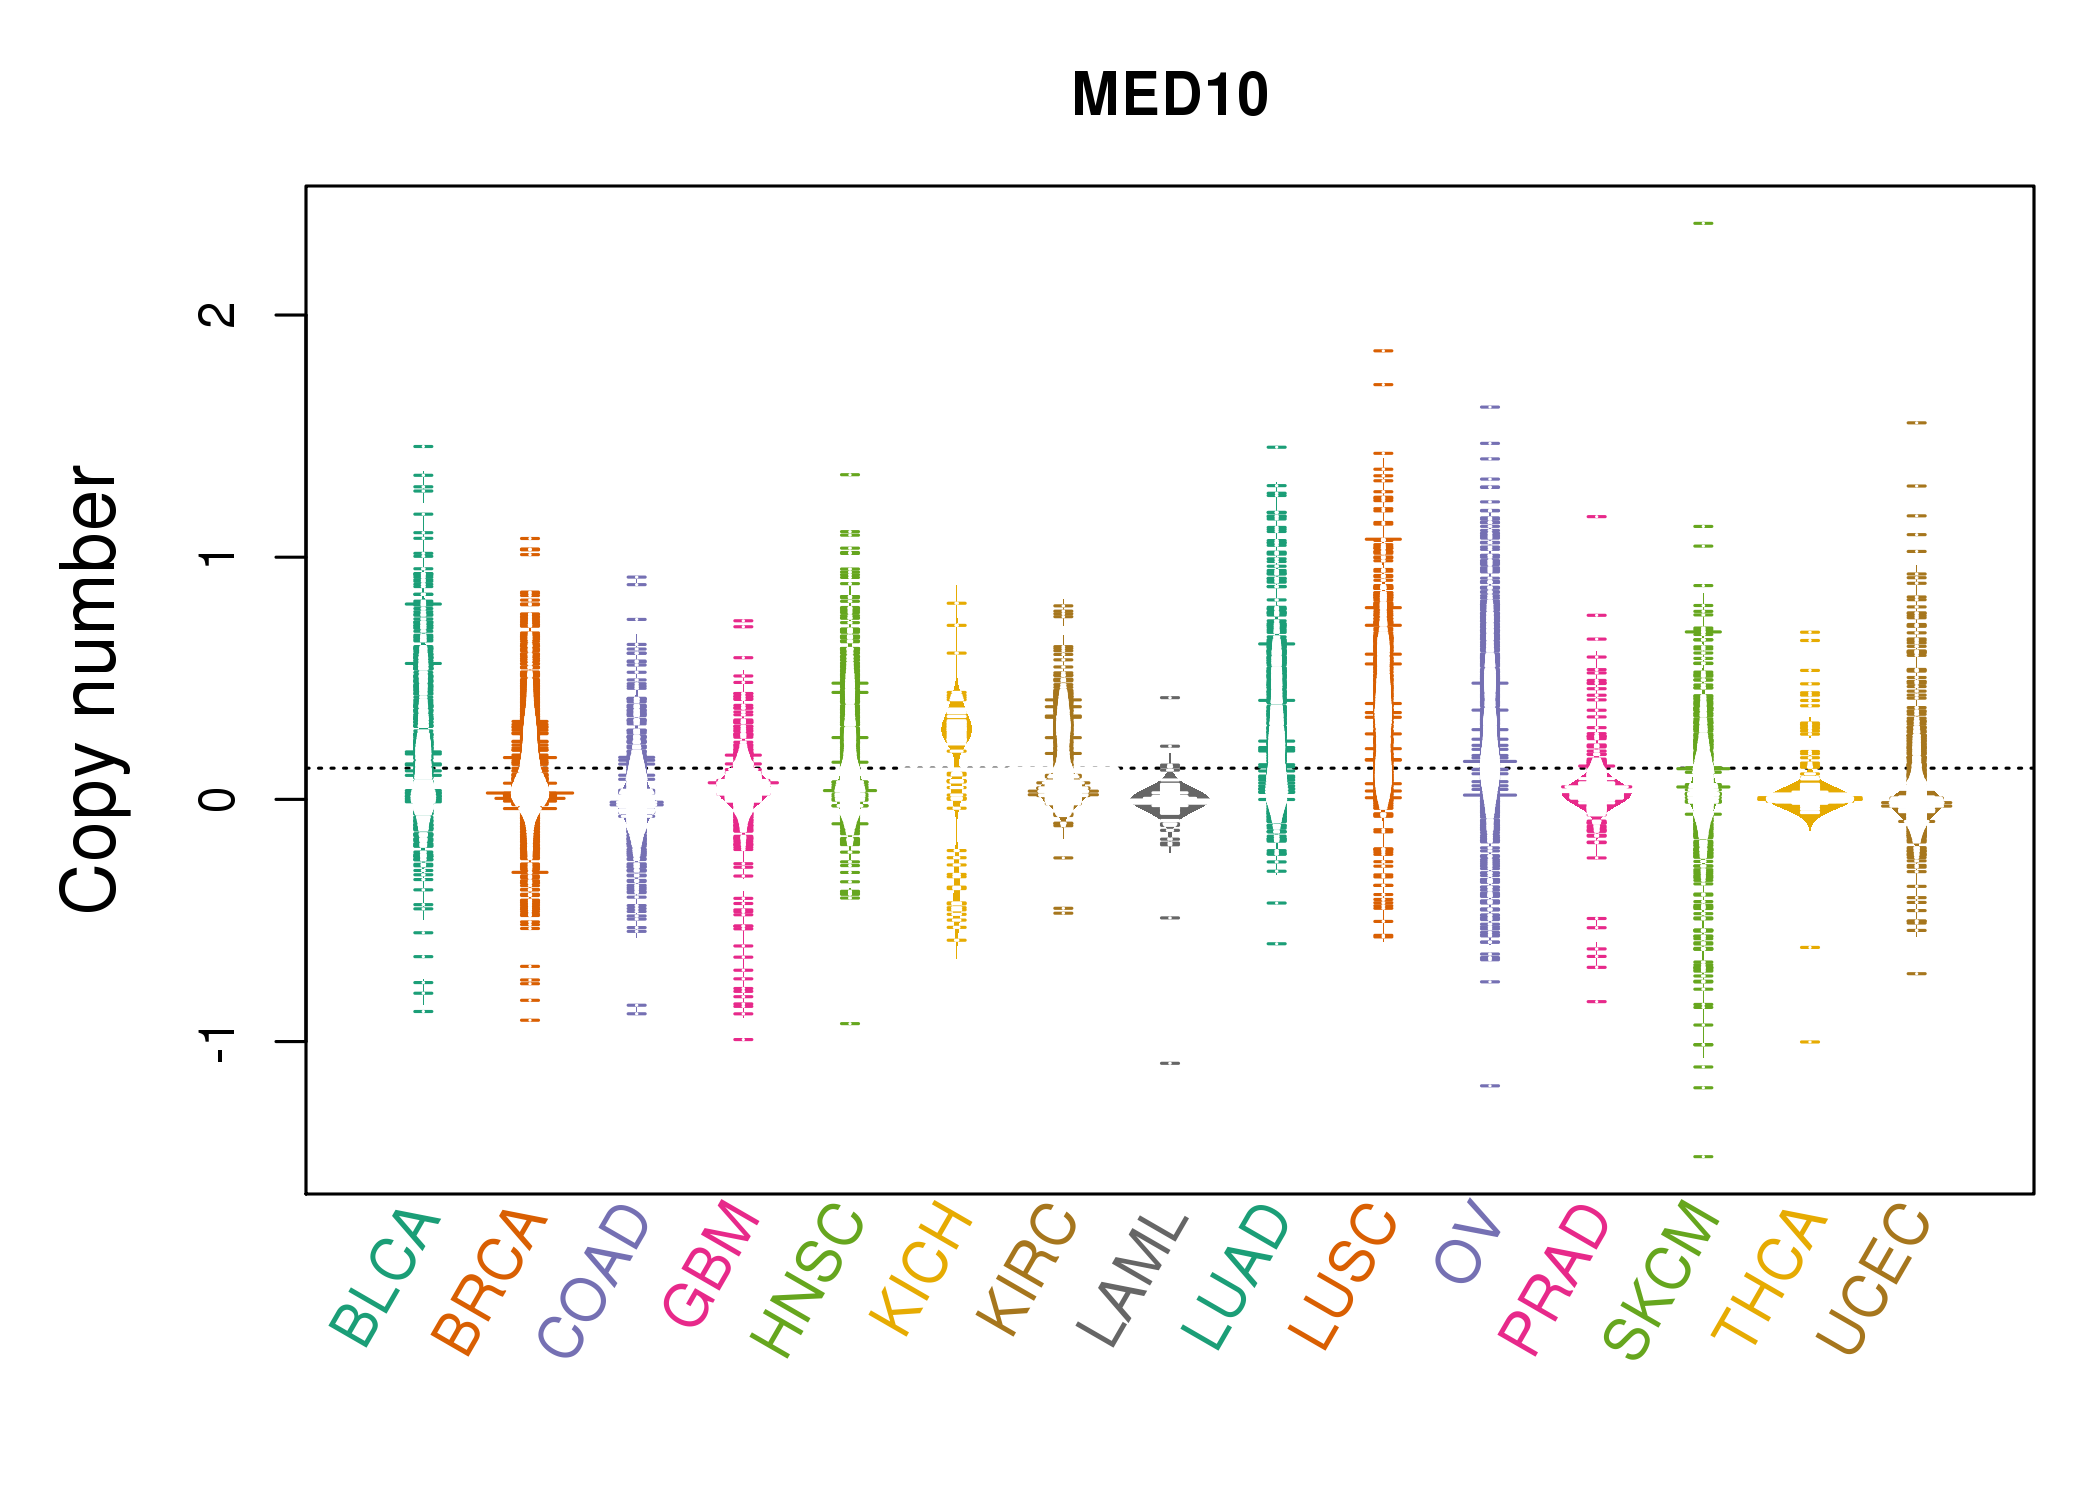 |
| cf) Tissue ID[Tissue type]: BLCA[Bladder Urothelial Carcinoma], BRCA[Breast invasive carcinoma], CESC[Cervical squamous cell carcinoma and endocervical adenocarcinoma], COAD[Colon adenocarcinoma], GBM[Glioblastoma multiforme], Glioma Low Grade, HNSC[Head and Neck squamous cell carcinoma], KICH[Kidney Chromophobe], KIRC[Kidney renal clear cell carcinoma], KIRP[Kidney renal papillary cell carcinoma], LAML[Acute Myeloid Leukemia], LUAD[Lung adenocarcinoma], LUSC[Lung squamous cell carcinoma], OV[Ovarian serous cystadenocarcinoma ], PAAD[Pancreatic adenocarcinoma], PRAD[Prostate adenocarcinoma], SKCM[Skin Cutaneous Melanoma], STAD[Stomach adenocarcinoma], THCA[Thyroid carcinoma], UCEC[Uterine Corpus Endometrial Carcinoma] |
| Top |
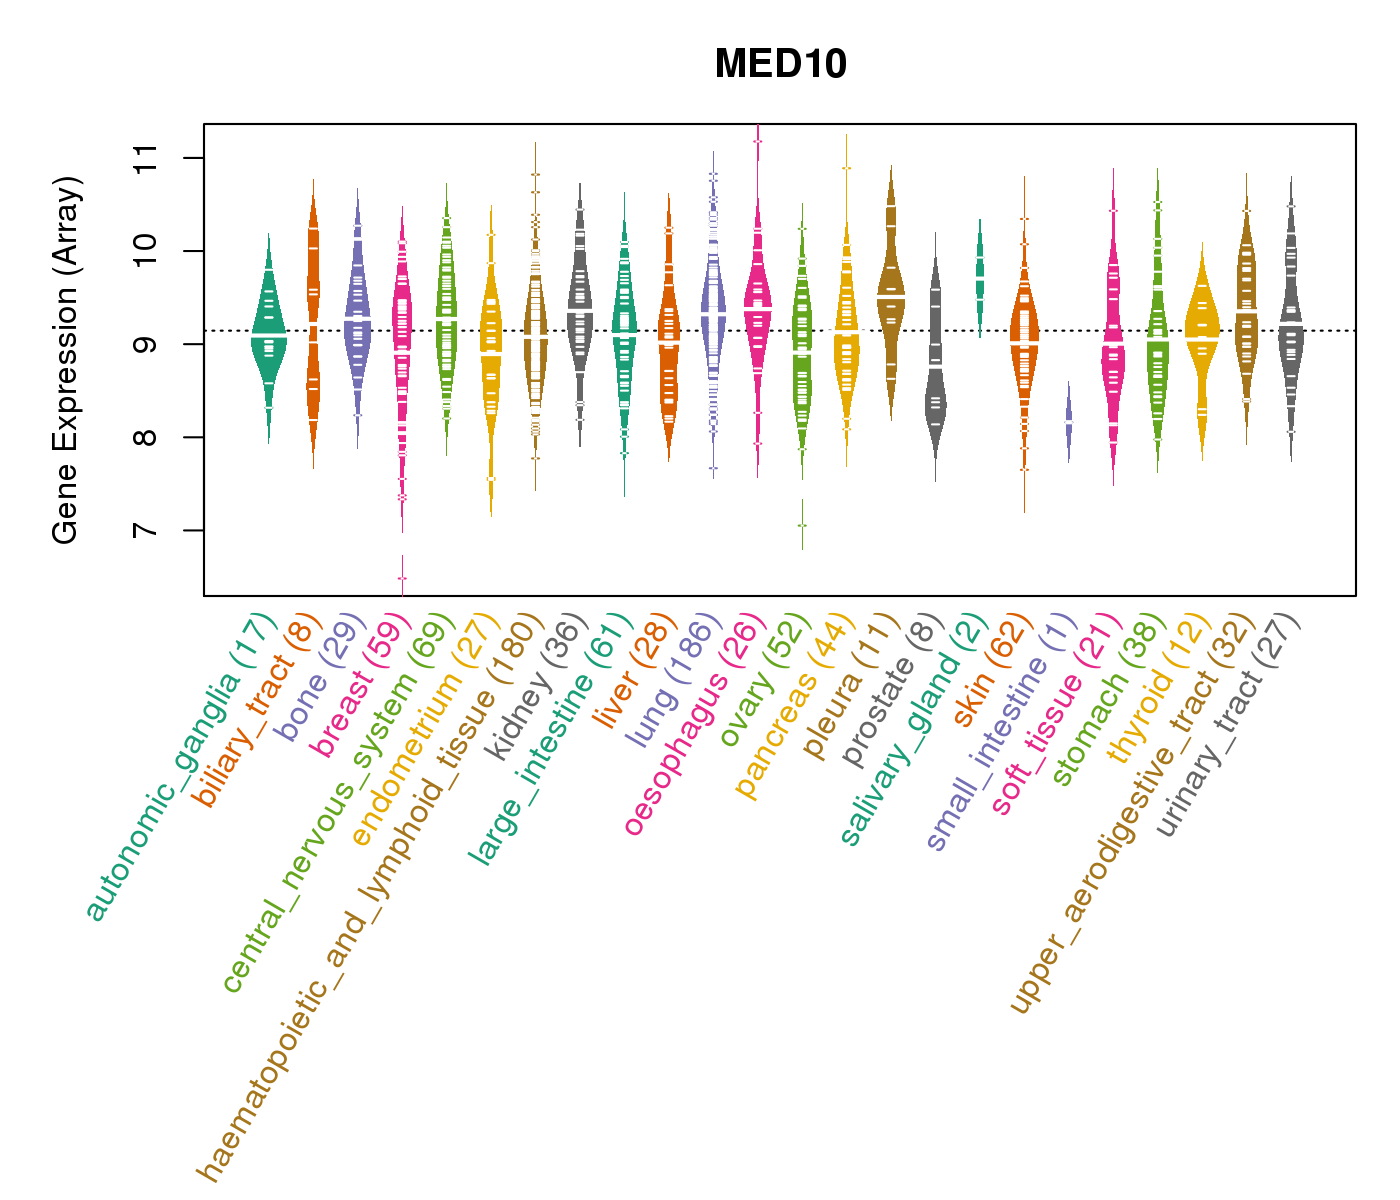
| Gene Expression for MED10 |
| * CCLE gene expression data were extracted from CCLE_Expression_Entrez_2012-10-18.res: Gene-centric RMA-normalized mRNA expression data. |
 |
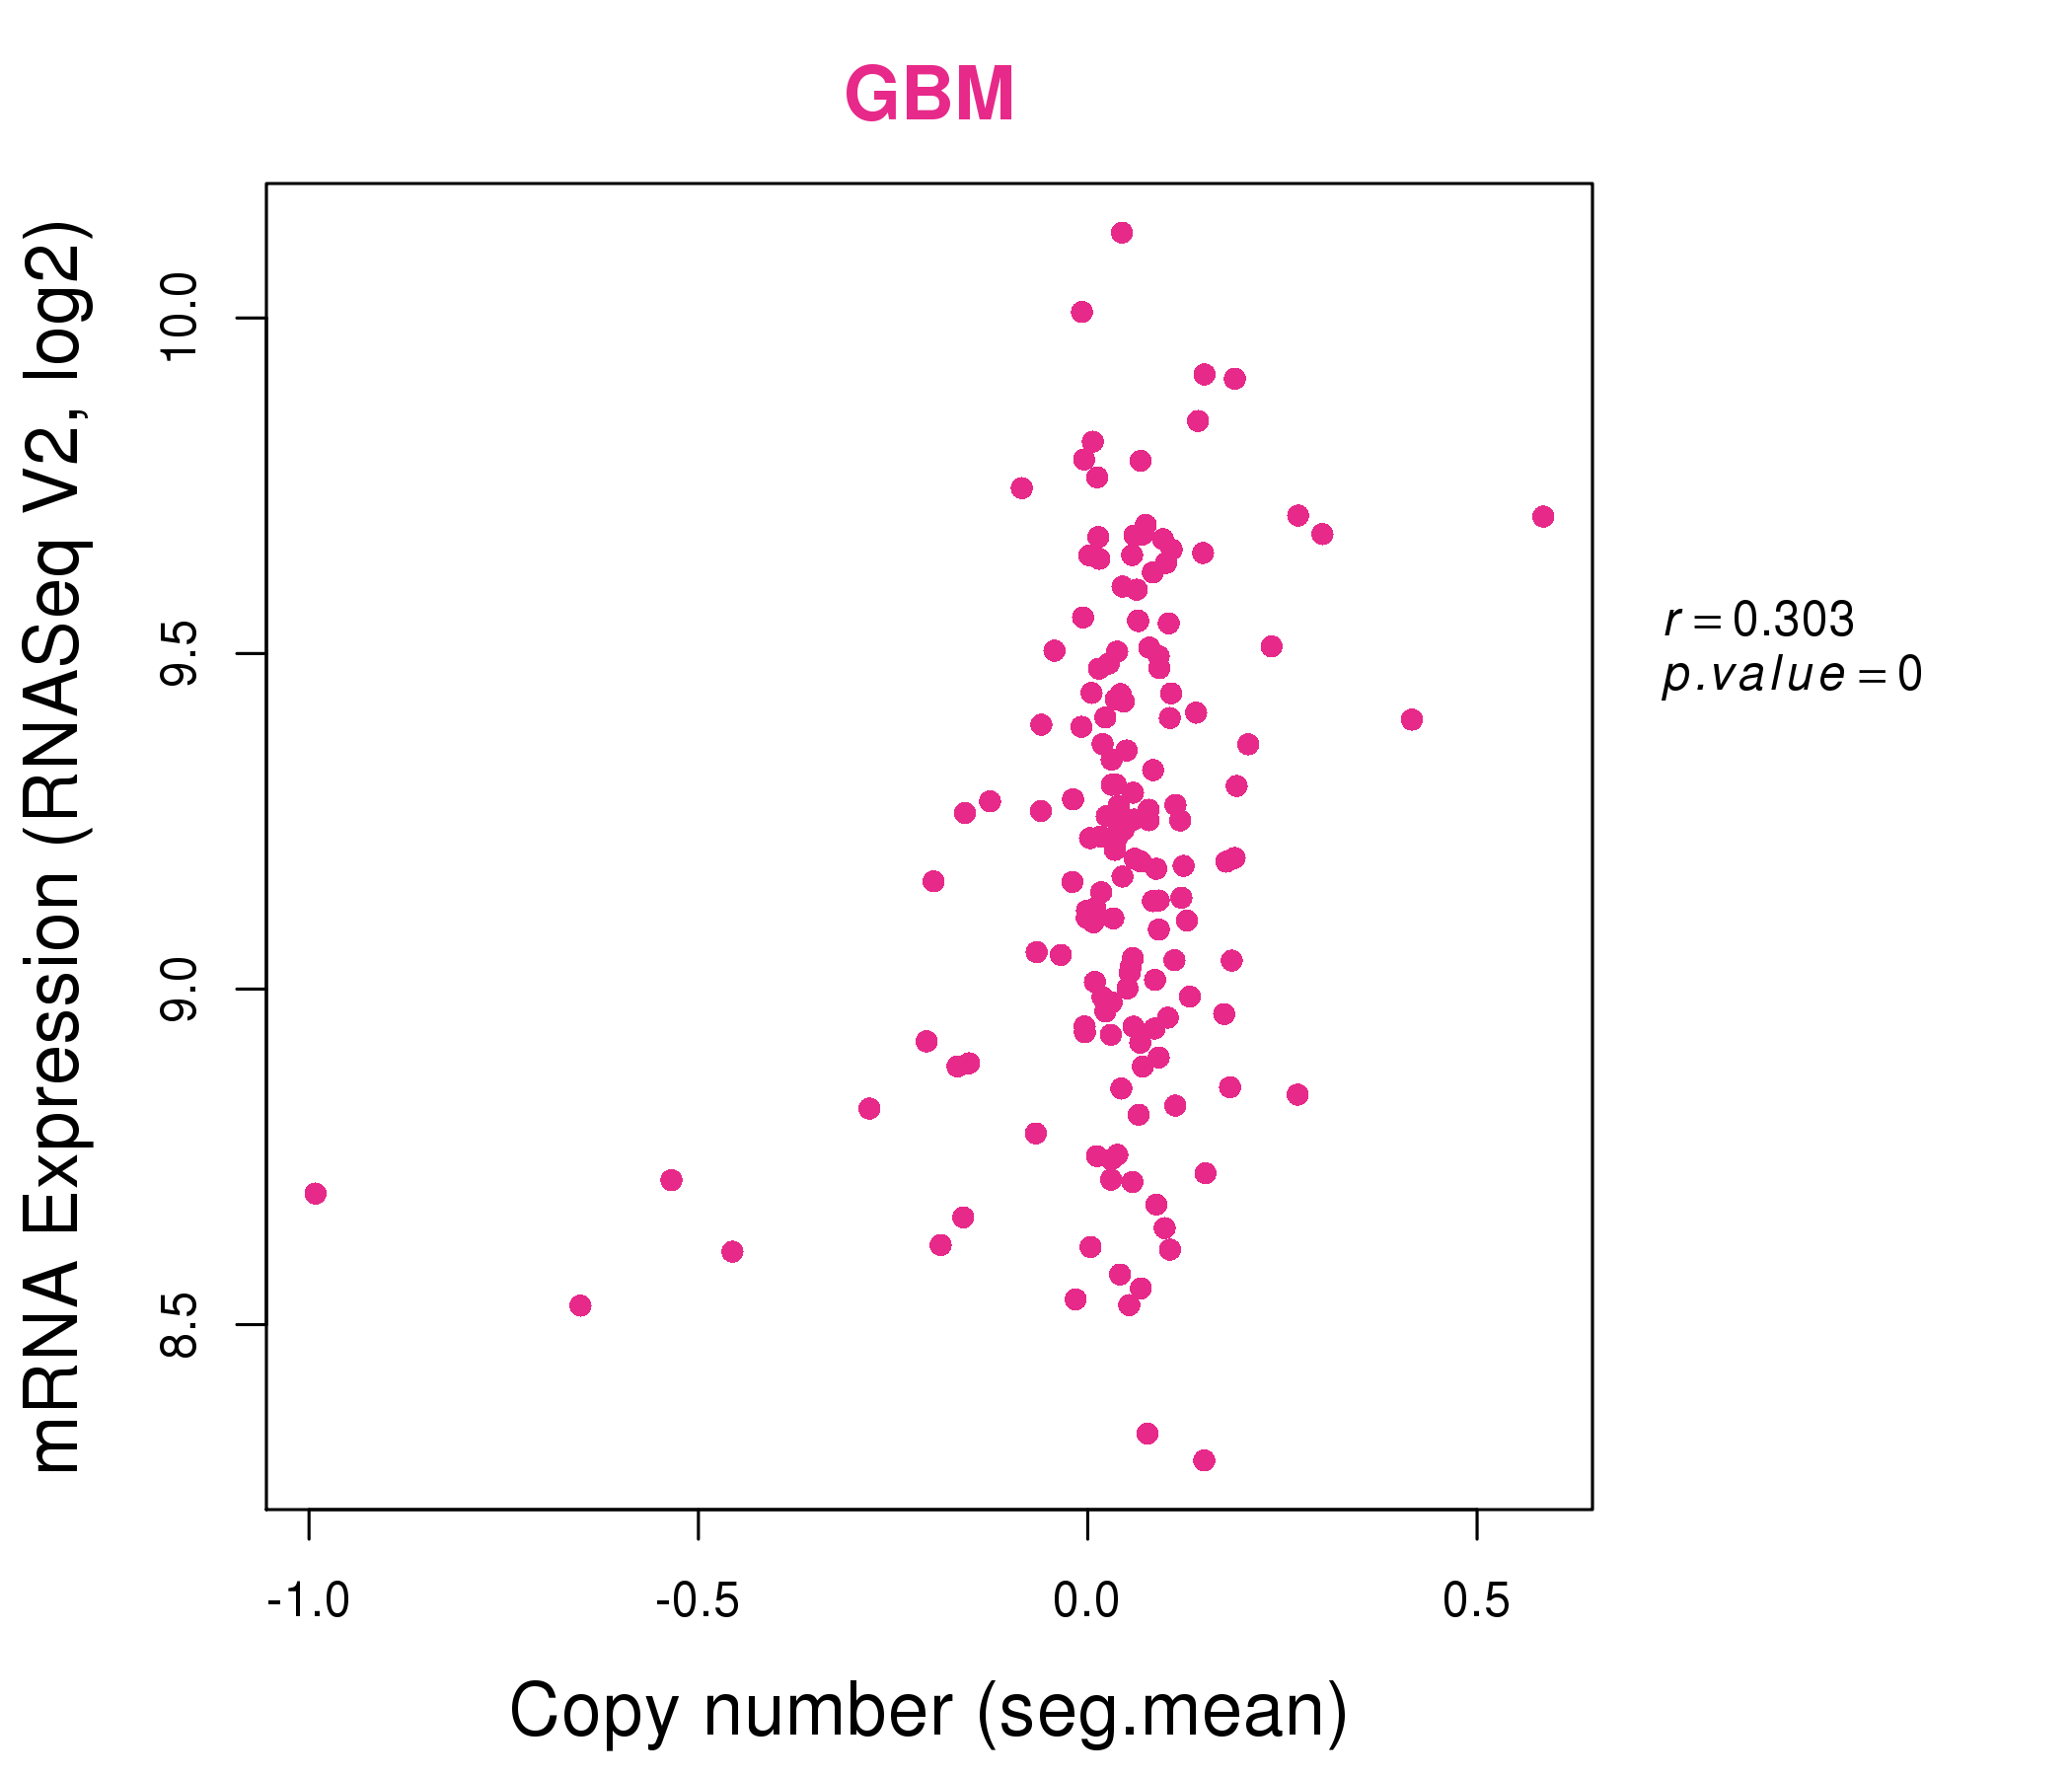
| * Normalized gene expression data of RNASeqV2 was extracted from TCGA using R package TCGA-Assembler. The URLs of all public data files on TCGA DCC data server were gathered at Jan-05-2015. Only eight cancer types have enough normal control samples for differential expression analysis. (t test, adjusted p<0.05 (using Benjamini-Hochberg FDR)) |
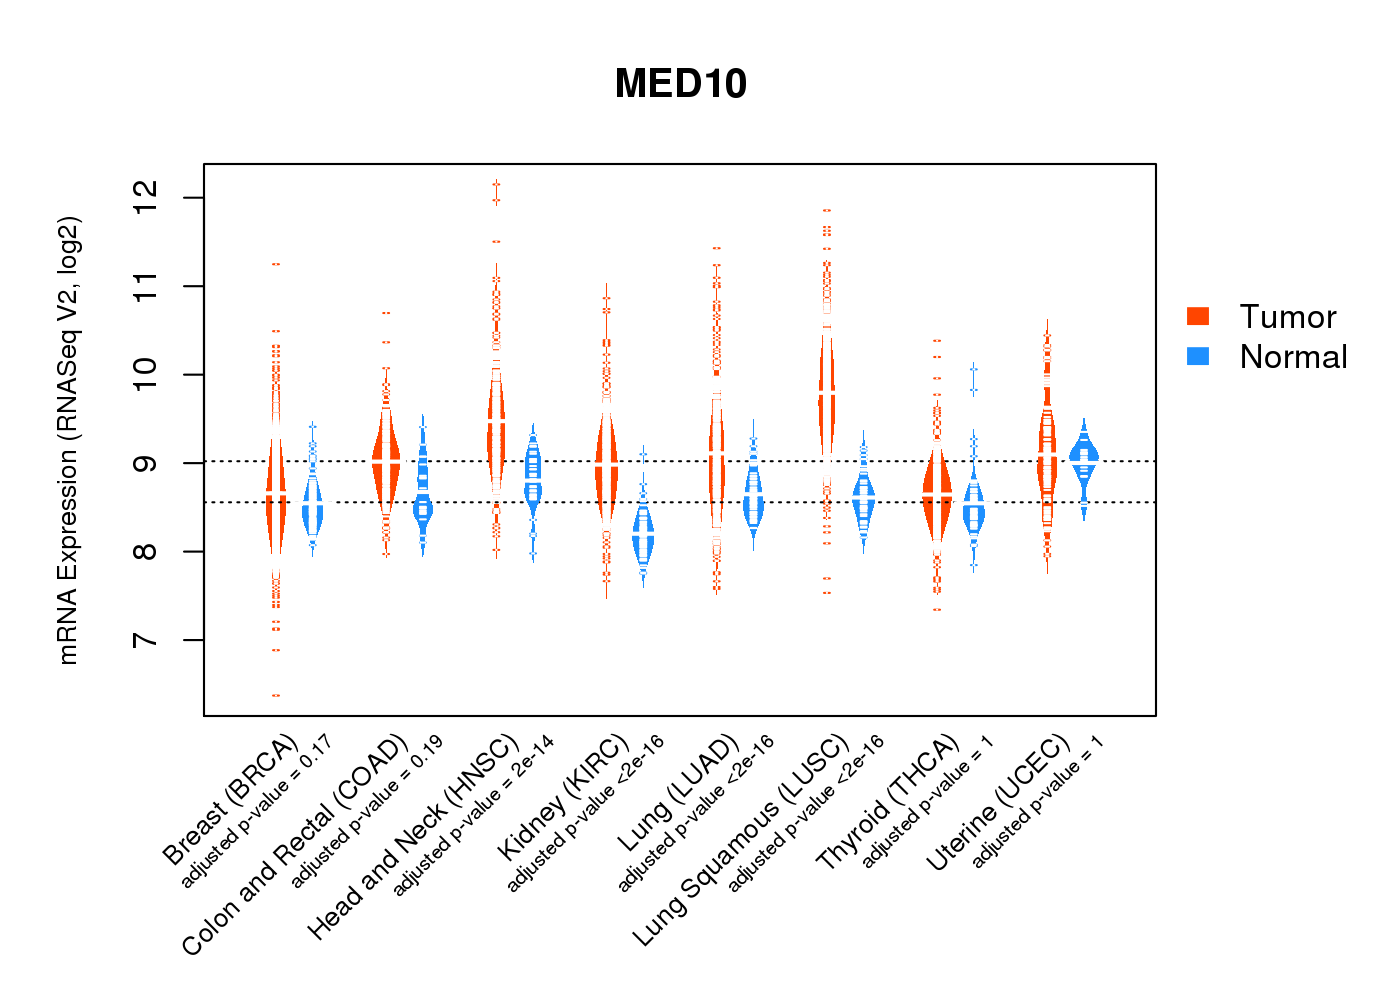 |
| Top |
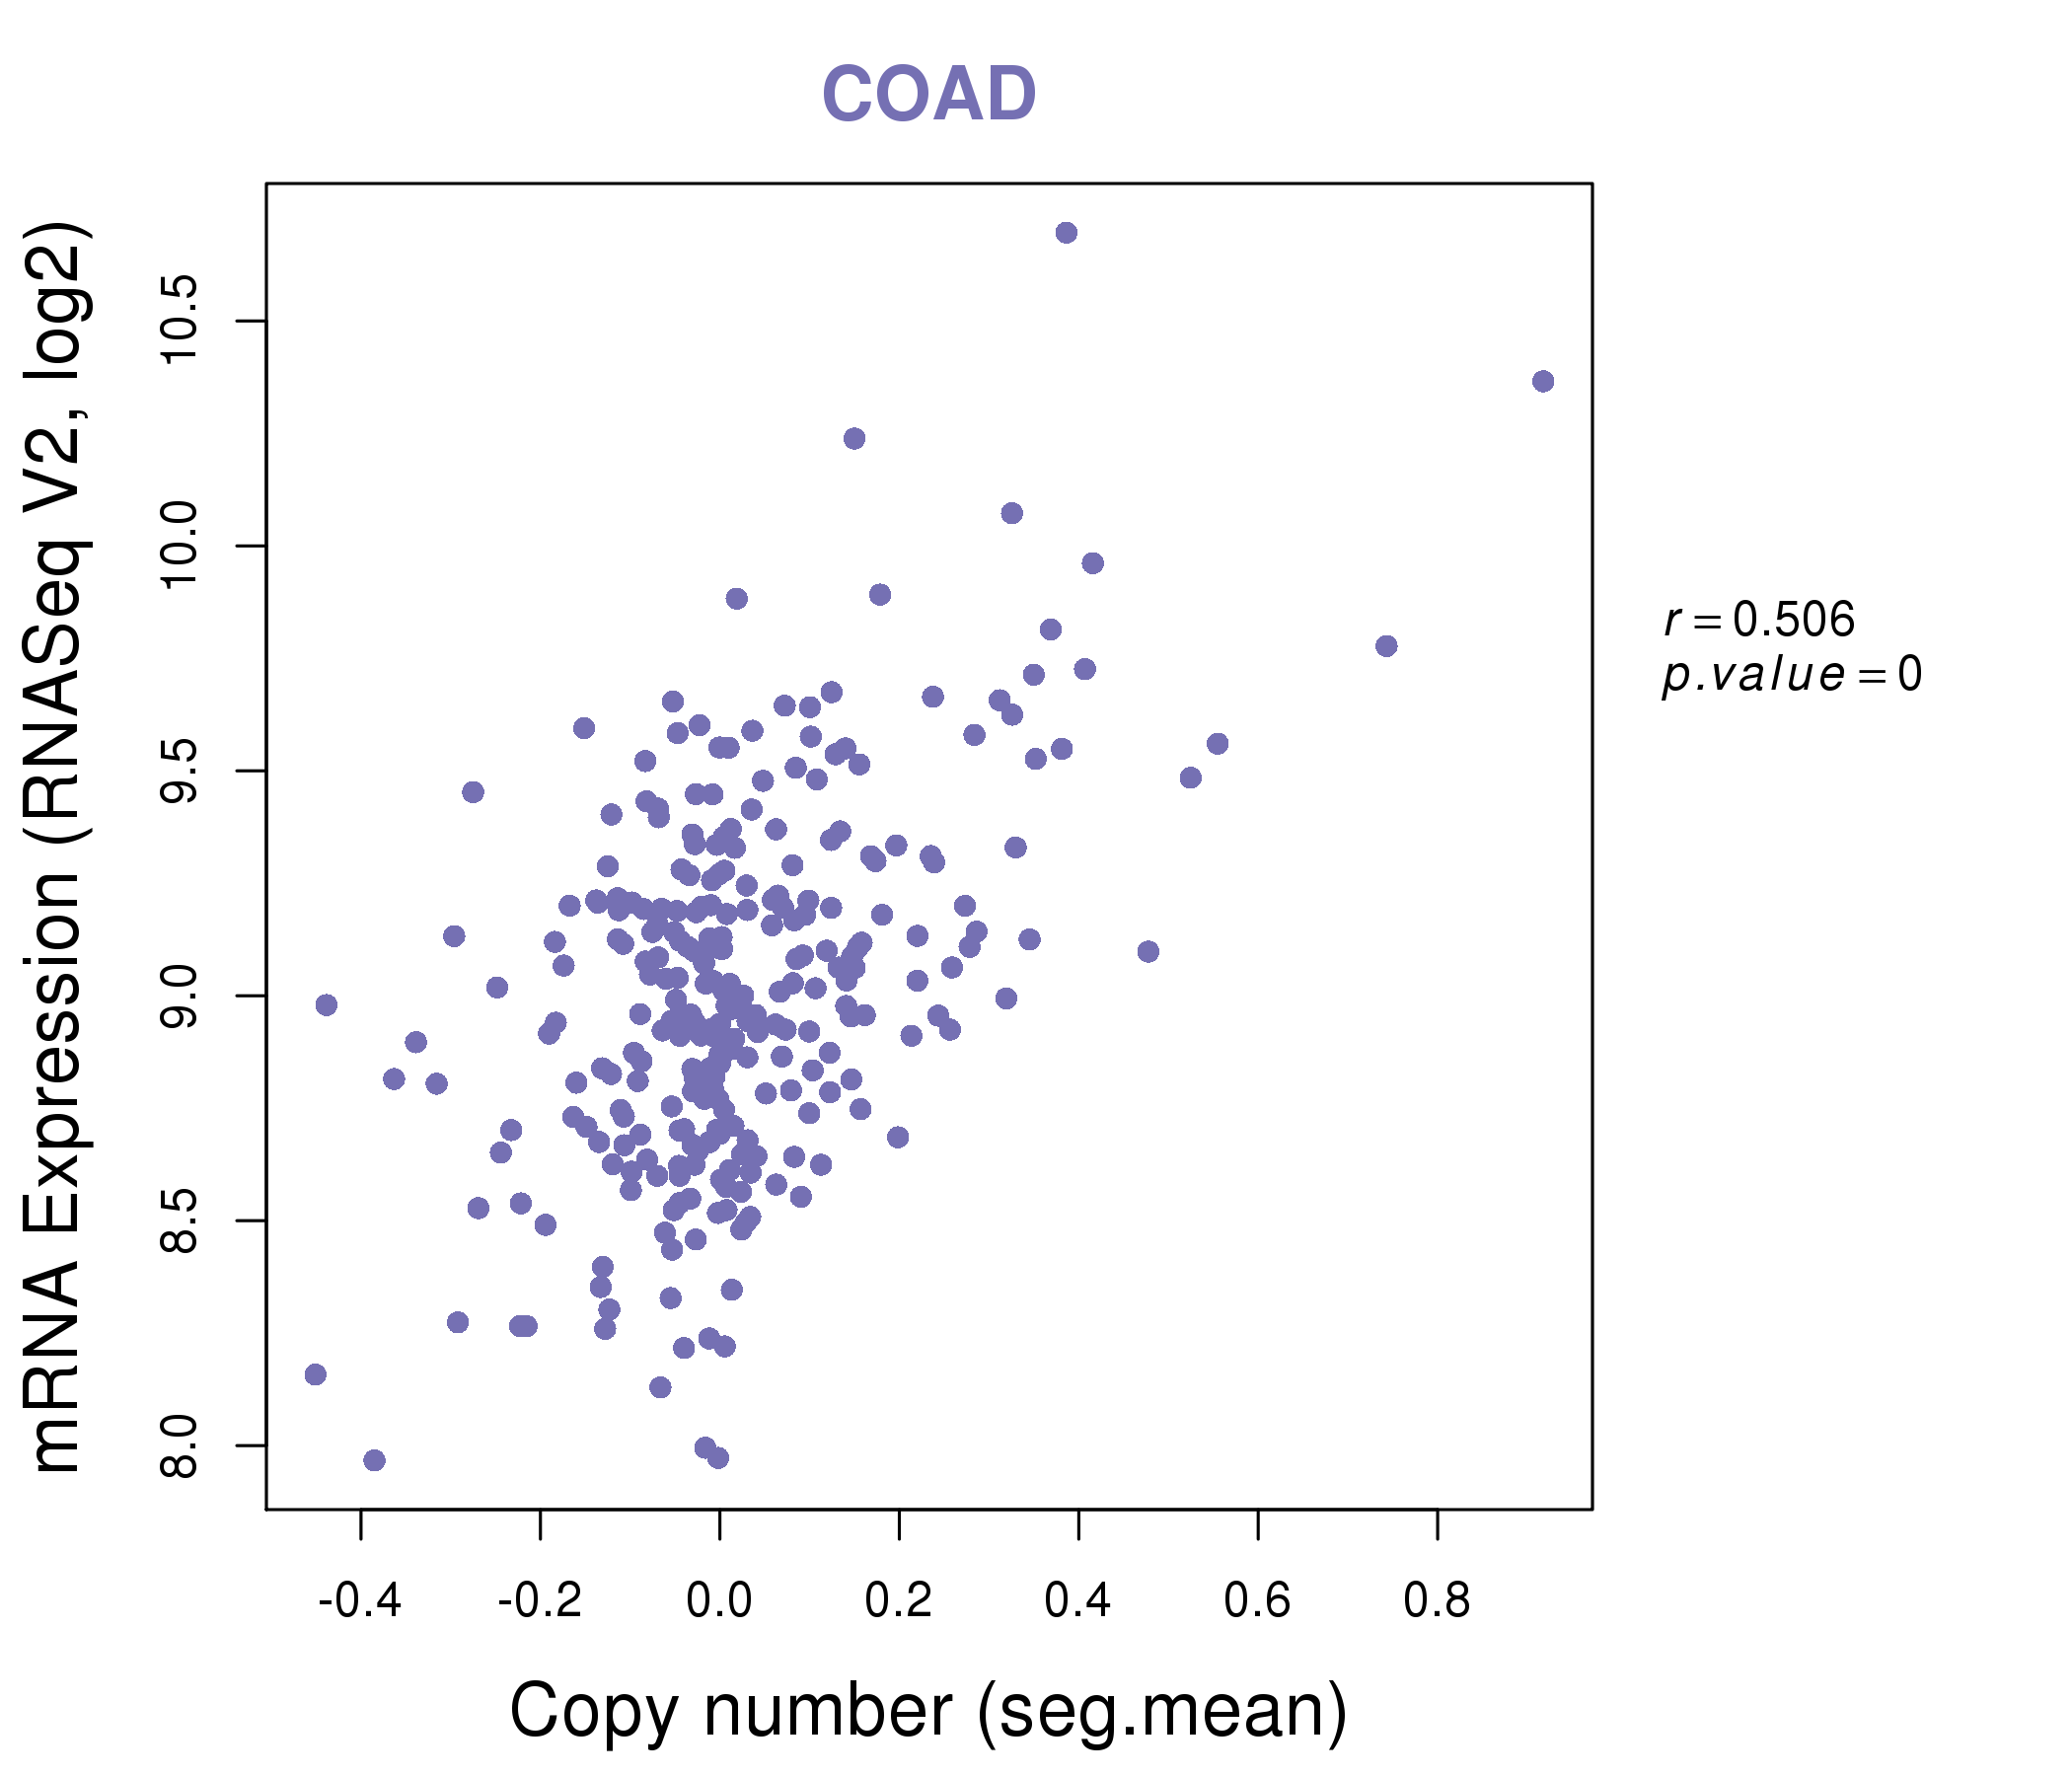
| * This plots show the correlation between CNV and gene expression. |
: Open all plots for all cancer types
 |
|
 |
|

| Top |
| Gene-Gene Network Information |
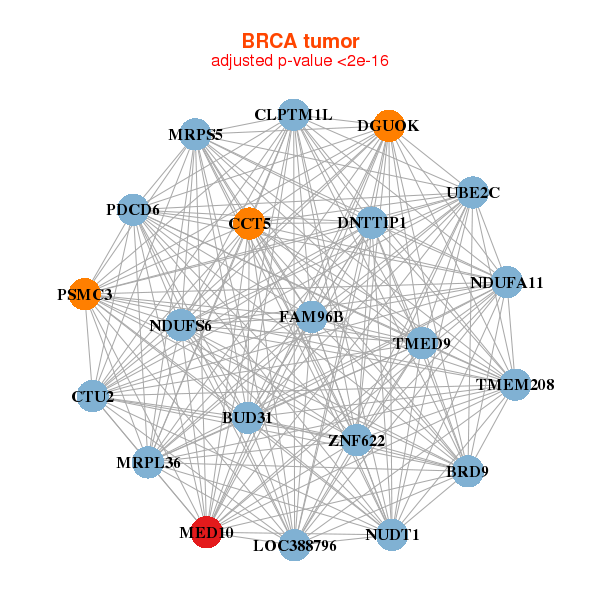
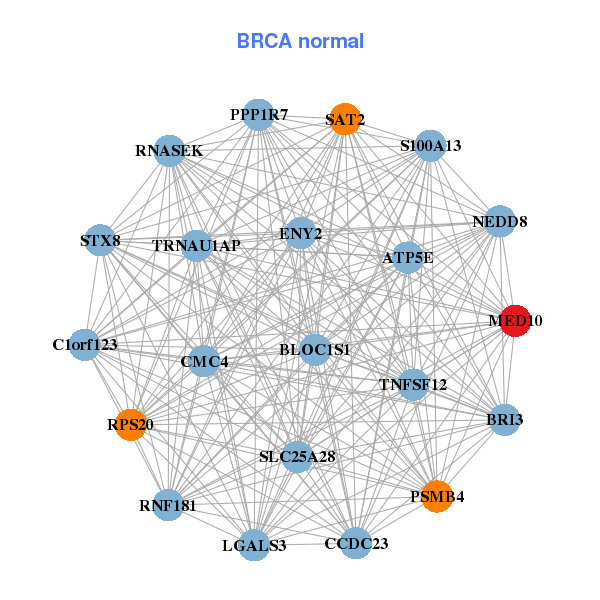
| * Co-Expression network figures were drawn using R package igraph. Only the top 20 genes with the highest correlations were shown. Red circle: input gene, orange circle: cell metabolism gene, sky circle: other gene |
: Open all plots for all cancer types
 |
|
| BRD9,BUD31,CCT5,CLPTM1L,CTU2,DGUOK,DNTTIP1, FAM96B,LOC388796,MED10,MRPL36,MRPS5,NDUFA11,NDUFS6, NUDT1,PDCD6,PSMC3,TMED9,TMEM208,UBE2C,ZNF622 | ATP5E,BLOC1S1,BRI3,C1orf123,CCDC23,ENY2,LGALS3, MED10,CMC4,NEDD8,PPP1R7,PSMB4,RNASEK,RNF181, RPS20,S100A13,SAT2,SLC25A28,STX8,TNFSF12,TRNAU1AP |
 |
|
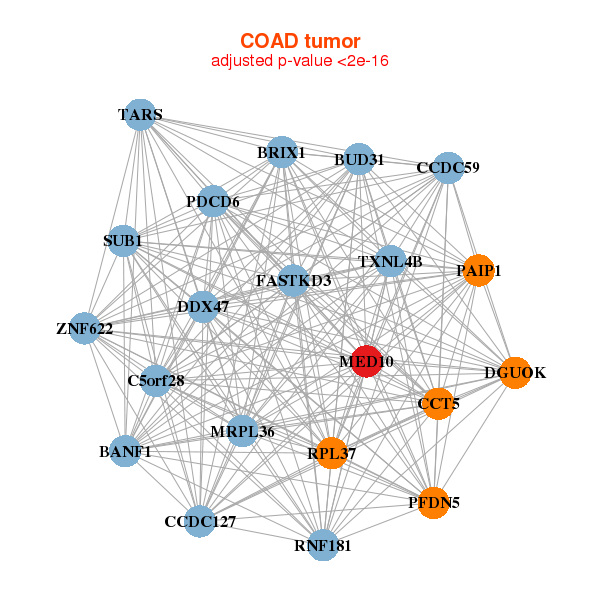
| BANF1,BRIX1,BUD31,C5orf28,CCDC127,CCDC59,CCT5, DDX47,DGUOK,FASTKD3,MED10,MRPL36,PAIP1,PDCD6, PFDN5,RNF181,RPL37,SUB1,TARS,TXNL4B,ZNF622 | ANAPC16,ATG12,AZI2,LYRM9,SMIM11,FBXL5,FIS1, FNTA,HMGN4,LYRM5,MANBAL,MED10,METTL5,NEK7, PCNP,RHEB,S100A13,SNX3,STARD3NL,TMEM14A,YPEL5 |

| * Co-Expression network figures were drawn using R package igraph. Only the top 20 genes with the highest correlations were shown. Red circle: input gene, orange circle: cell metabolism gene, sky circle: other gene |
: Open all plots for all cancer types
| Top |
: Open all interacting genes' information including KEGG pathway for all interacting genes from DAVID
| Top |
| Pharmacological Information for MED10 |
| There's no related Drug. |
| Top |
| Cross referenced IDs for MED10 |
| * We obtained these cross-references from Uniprot database. It covers 150 different DBs, 18 categories. http://www.uniprot.org/help/cross_references_section |
: Open all cross reference information
|
Copyright © 2016-Present - The Univsersity of Texas Health Science Center at Houston @ |